Article

Hot-Deformation Behavior and Processing Maps of a Low-Carbon Fe-2 wt% Nb Steel

1
International Joint Laboratory for Light Alloys (MOE), College of Materials Science and Engineering, Chongqing University, Chongqing 400044, China
2
National Engineering Research Center for Equipment and Technology of Cold Rolled Strip, Yanshan University, Qinhuangdao 066004, China
3
Electron Microscopy Center of Chongqing University, Chongqing University, Chongqing 400044, China
4
Shenyang National Laboratory for Materials Science, Chongqing University, Chongqing 400044, China
5
Beijing Advanced Innovation Center for Materials Genome Engineering, University of Science and Technology Beijing, Beijing 100083, China
*
Authors to whom correspondence should be addressed.
Metals 2021, 11(12), 1939; https://doi.org/10.3390/met11121939
Submission received: 14 October 2021 / Revised: 18 November 2021 / Accepted: 24 November 2021 / Published: 30 November 2021
(This article belongs to the Special Issue Crystal Plastic Deformation Mechanism of Metallic Materials)

Abstract

:
In the present work, the deformation behavior and processing maps of a low-carbon Fe-2 wt% Nb steel were studied by means of hot-compression tests at temperatures of 800–1150 °C and strain rates of 0.01–10 s−1. The hot-processing maps at different strains and corresponding microstructural evolution were constructed and discussed. The hot-deformation behaviors of two different phase regions, i.e., austenite + NbC dual-phase and ferrite + NbC dual-phase, were predicted by determining the constitutive equations using Arrhenius-type and Zener–Hollomon models. The results suggest that the hot-deformed microstructures of the material present a strong correlation with the processing parameters in the hot-processing maps. In addition, the optimum parameters based on the processing maps were obtained, and the instable and the safe domains during the hot deformation in the hot-processing maps provide solid theoretical guidance for industrial production.

1. Introduction

Heat-resistant steels with outstanding high-temperature properties are necessary in thermal power plants [1,2,3], turbo-chargers [4], and pressure vessels [5]. In our previous study, we designed a low-carbon 2 wt% Nb bearing steel, in order to utilize NbC precipitates with various sizes to stabilize and strengthen the microstructures at both room temperature and high temperatures [6]. We found that the yield stress and ultimate tensile stress of the as-forged 2Nb steel were 297 MPa and 430 MPa at 600 °C, which shows an excellent potential for future application [6]. However, to further improve both the strength and ductility, there are still several things that need systematic investigations, including the hot-deformation behavior and processing maps, which is the first step for microstructural control [7].
Understanding the high-temperature deformation mechanism, constructing a constitutive model and grasping the law of the microstructural evolution of metals play significant roles in optimizing the hot-process parameters for high-quality products of alloys [7,8,9]. In the past few decades, a large number of researchers have carried out detailed and in-depth studies on the thermal-deformation flow behavior of metal materials and established many constitutive models [10,11,12,13,14,15,16,17], including the Johnson–Cook (J–C) model [11], artificial-neural-network model [13,14], and modified Arrhenius model. To date, the modified Arrhenius model has been widely used in the simulation of thermal-deformation flow behavior [15,16,17].
In this study, we investigated the hot-deformation behavior of Fe-2 wt% Nb steel by fitting processing parameters and establishing constitutive equations in detail. Based on the above data calculation and model establishment, a hot-processing map was established, which can provide a reliable and accurate strain-processing area, to predict hot-deformation behavior and guide manufacturing and processing.
As shown in Figure 1, which was calculated and drawn using the Thermocalc software (Thermo-Calc 2017b, Stockholm, Sweden), the microstructures in the 800–1150 °C range contain two different phase zones, i.e., austenite + NbC at 1000–1150 °C and ferrite + NbC at 800–950 °C, which is different from the typical single-austenite-phase deformation condition. In the present study, the two hot-compression-temperature zones (800–950 °C range and 1000–1150 °C range) are discussed and compared with the typical single-temperature-zone condition (800–1150 °C range).

2. Experimental Materials and Procedure

The specific composition of Fe-2 wt% Nb steel is shown in Table 1.
A hot-compression experiment was carried out using a Gleeble 3800 thermal simulator (Dynamic Systems Inc., Austin, TX, USA). The sample had a diameter of 8 mm and length of 12 mm. The detailed procedures of the heat treatment and isothermal compressive experiment are shown in Figure 2. The direction of the compression load was perpendicular to the circular surface of the sample.
The surfaces were mechanically polished and etched with 5 vol.% nital solution for metallographic observation using a light optical microscope (Zeiss, Jena, Germany).

3. Results and Discussion

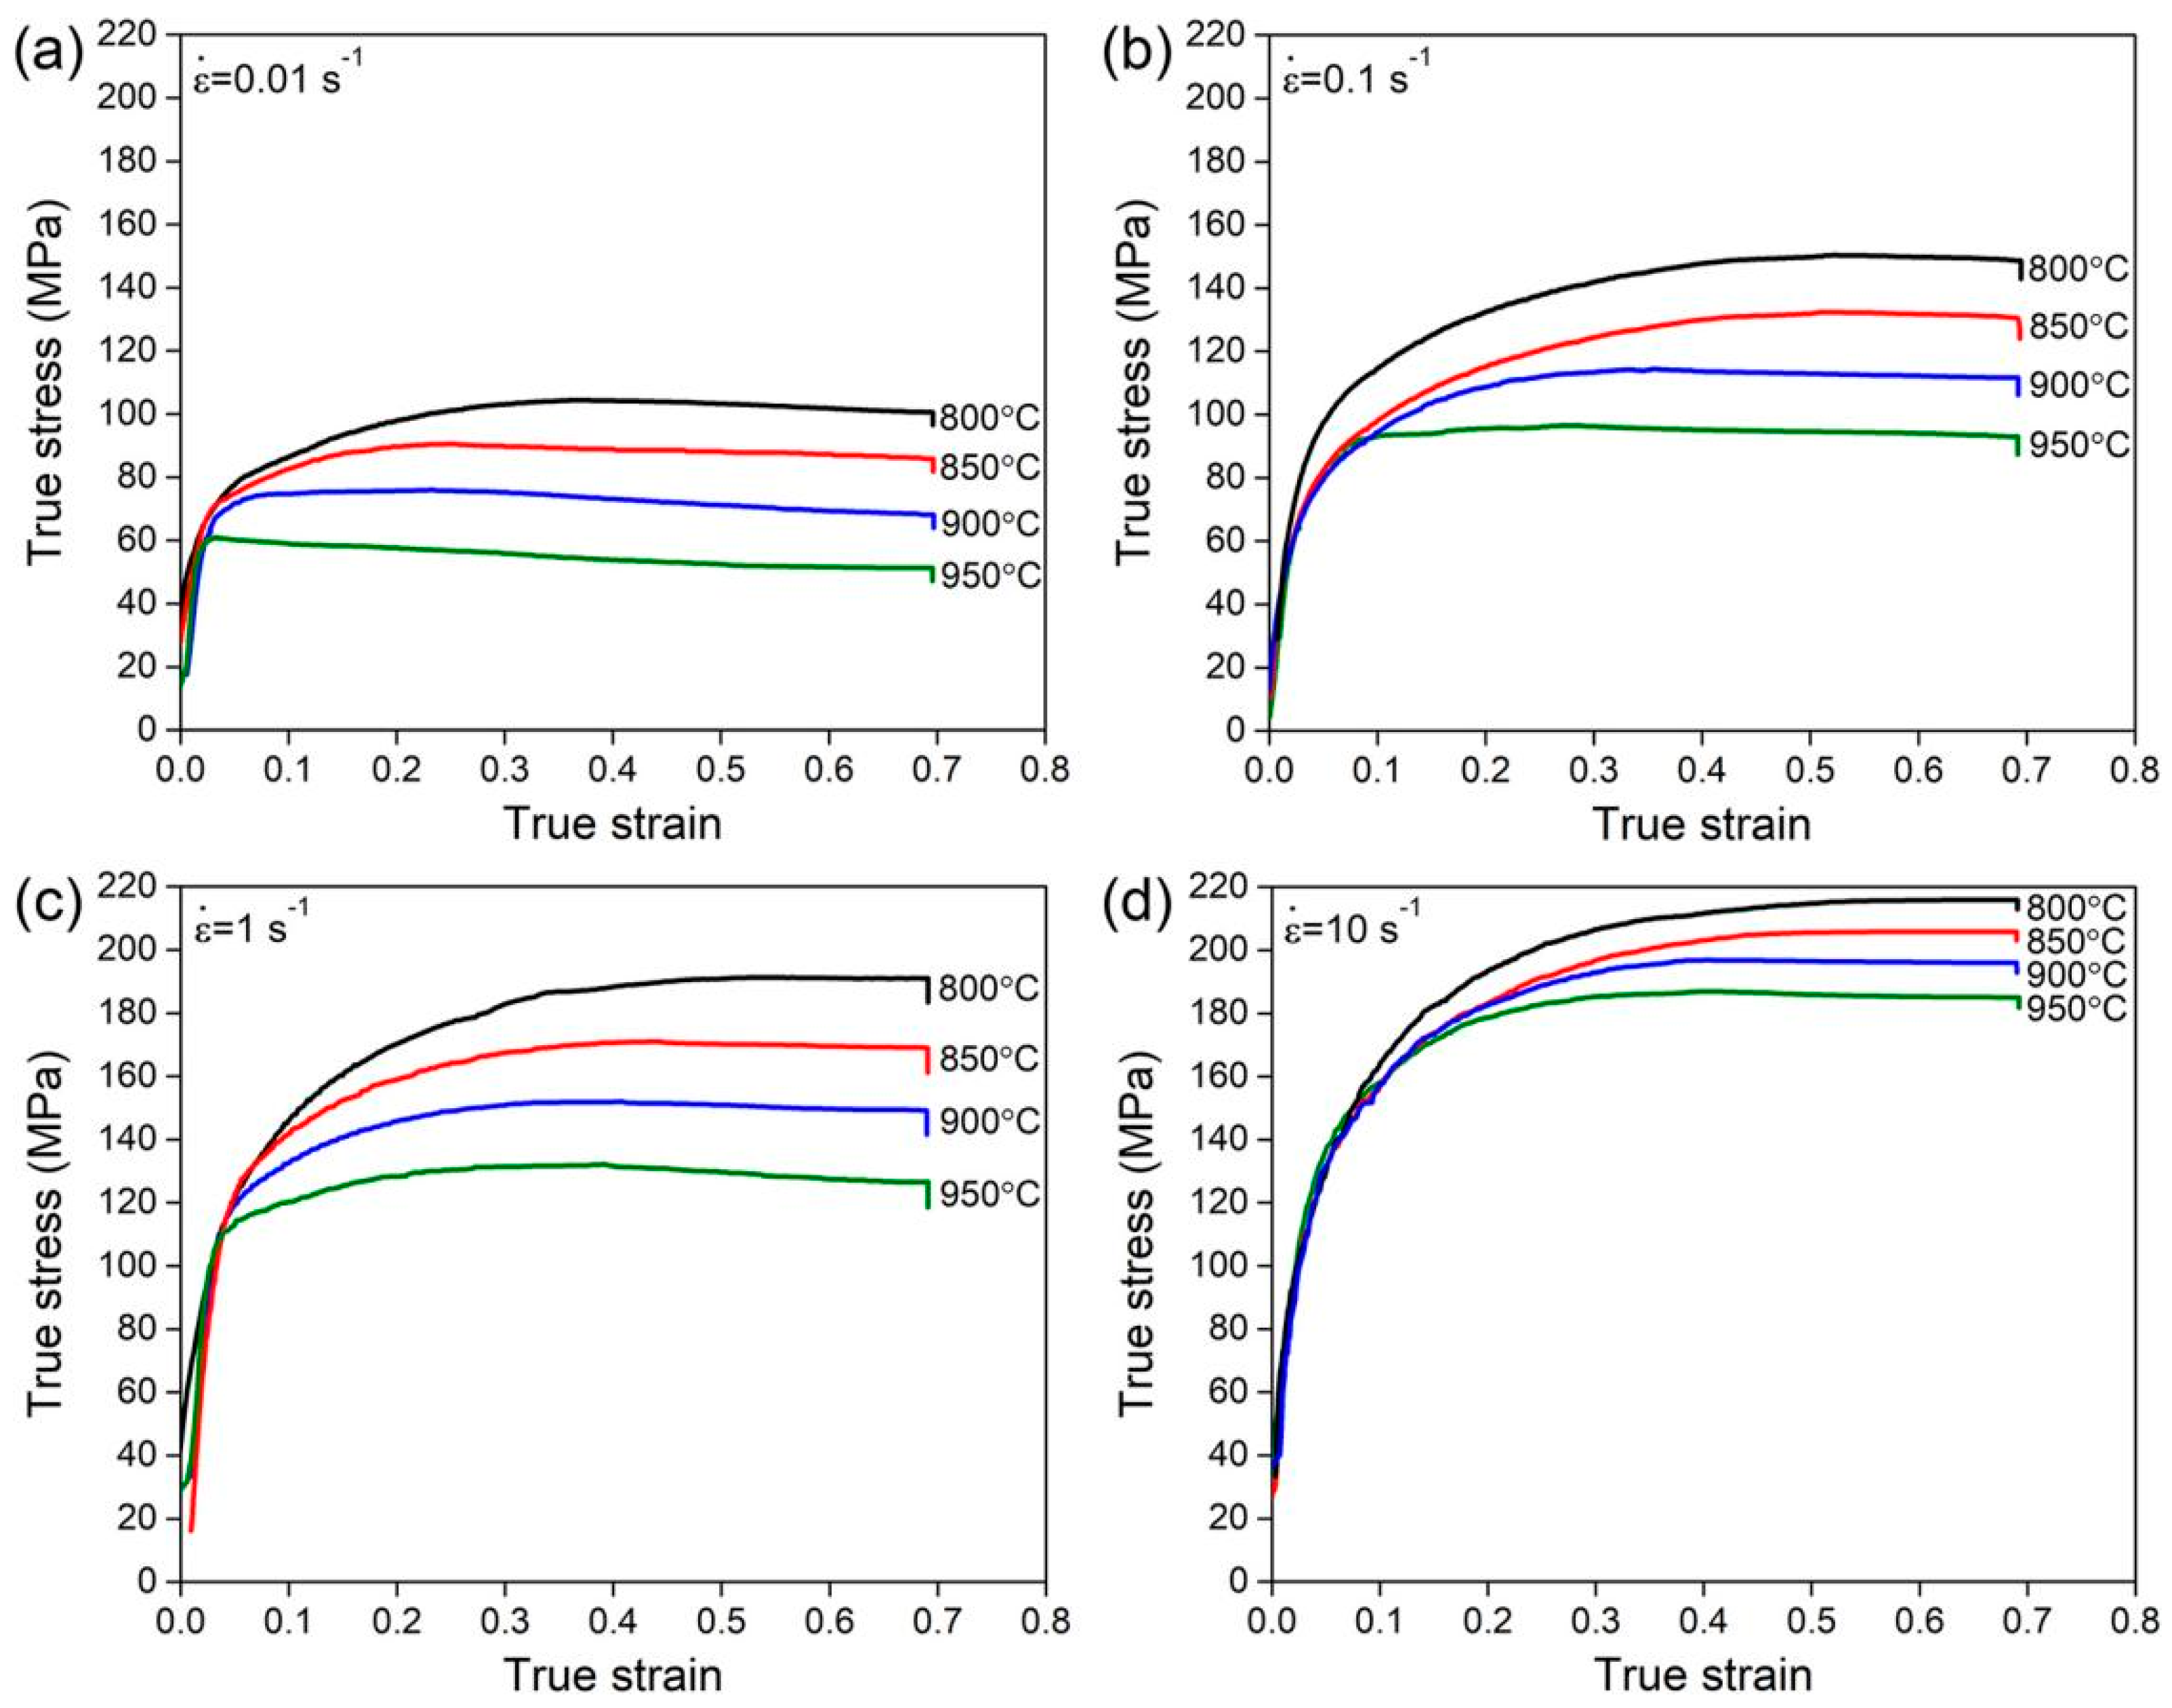
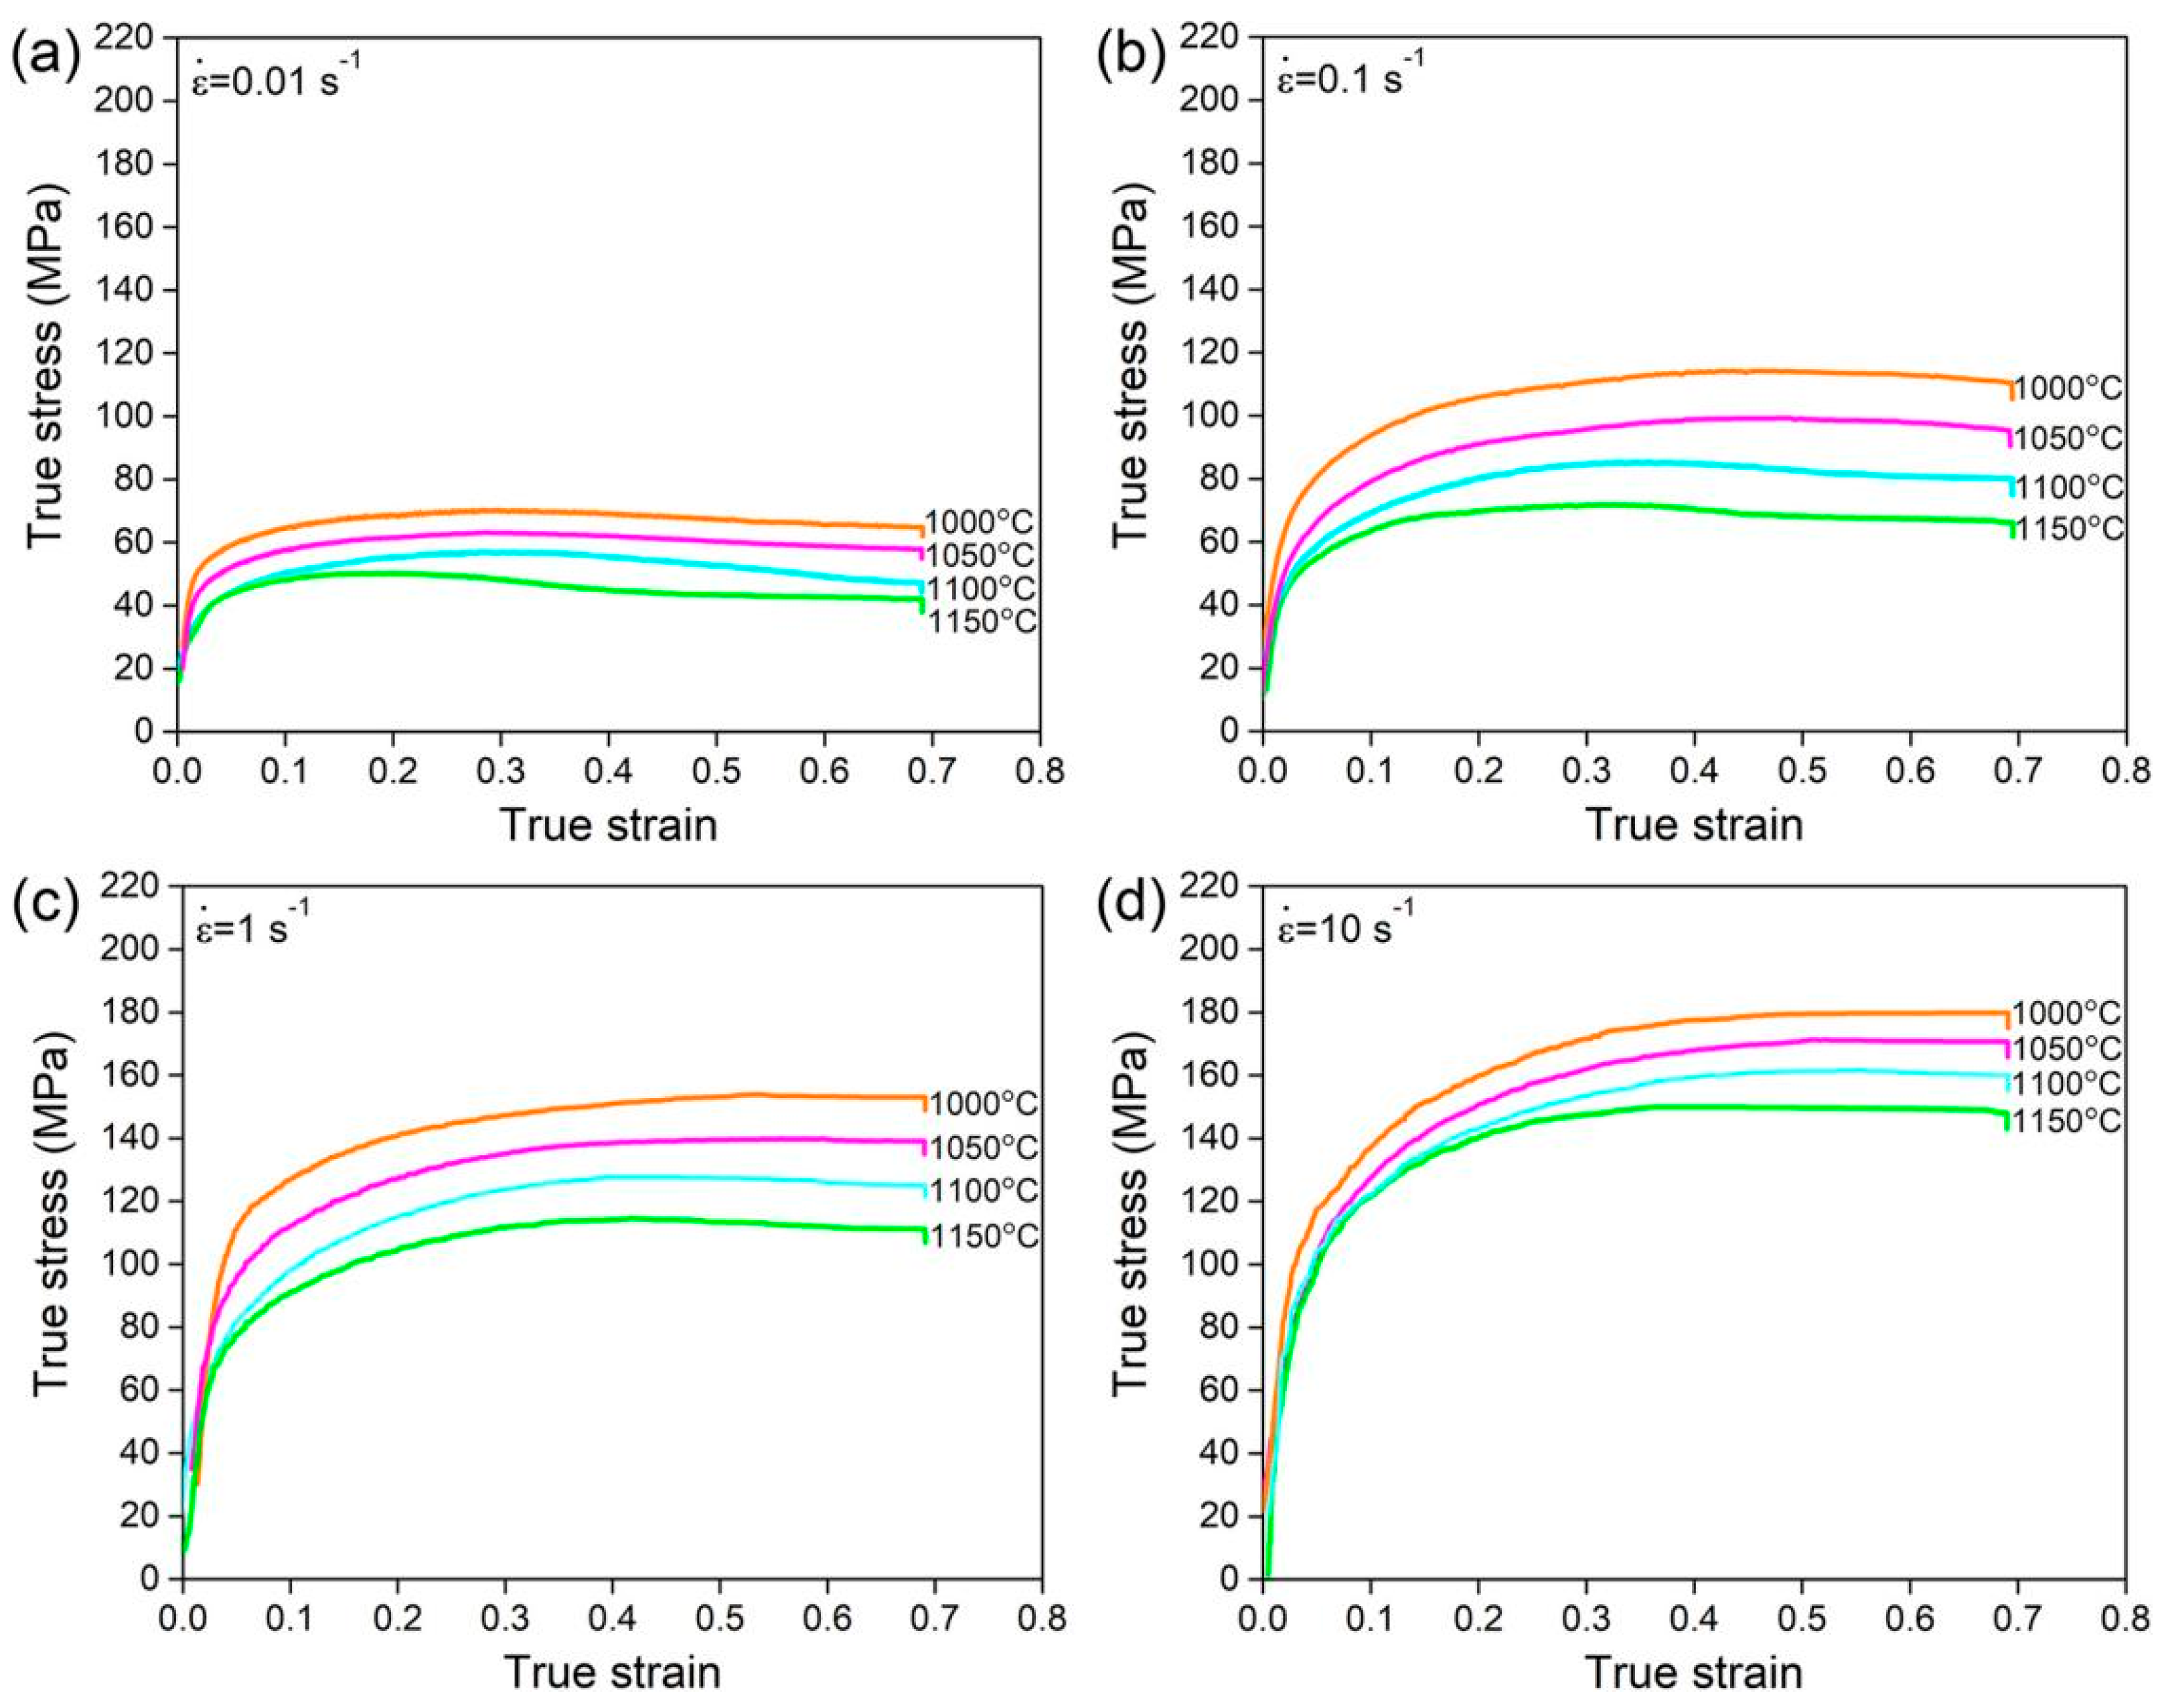
3.1. Hot-Compressive Stress–Strain Curves

The true stress–strain curves are shown in Figure 3 and Figure 4. In the early deformation stage, work hardening dominates, which represents a rapid stress increase for the continuous deformation.
After the work-hardening stage, most of the curves reach a steady state, especially when the materials were deformed at too-low temperatures with high strain rates, indicating that dynamic recovery (DRV) dominated the deformation, as seen in Figure 3d [10]. Only a very small number of curves have obvious stress-softening stages, indicating that dynamic recrystallization (DRX) dominated the deformation, such as at 900 °C and 950 °C with 0.01 s−1 in Figure 3 and 1150 °C with strain rates of 0.01 s−1 and 0.1 s−1 in Figure 4.

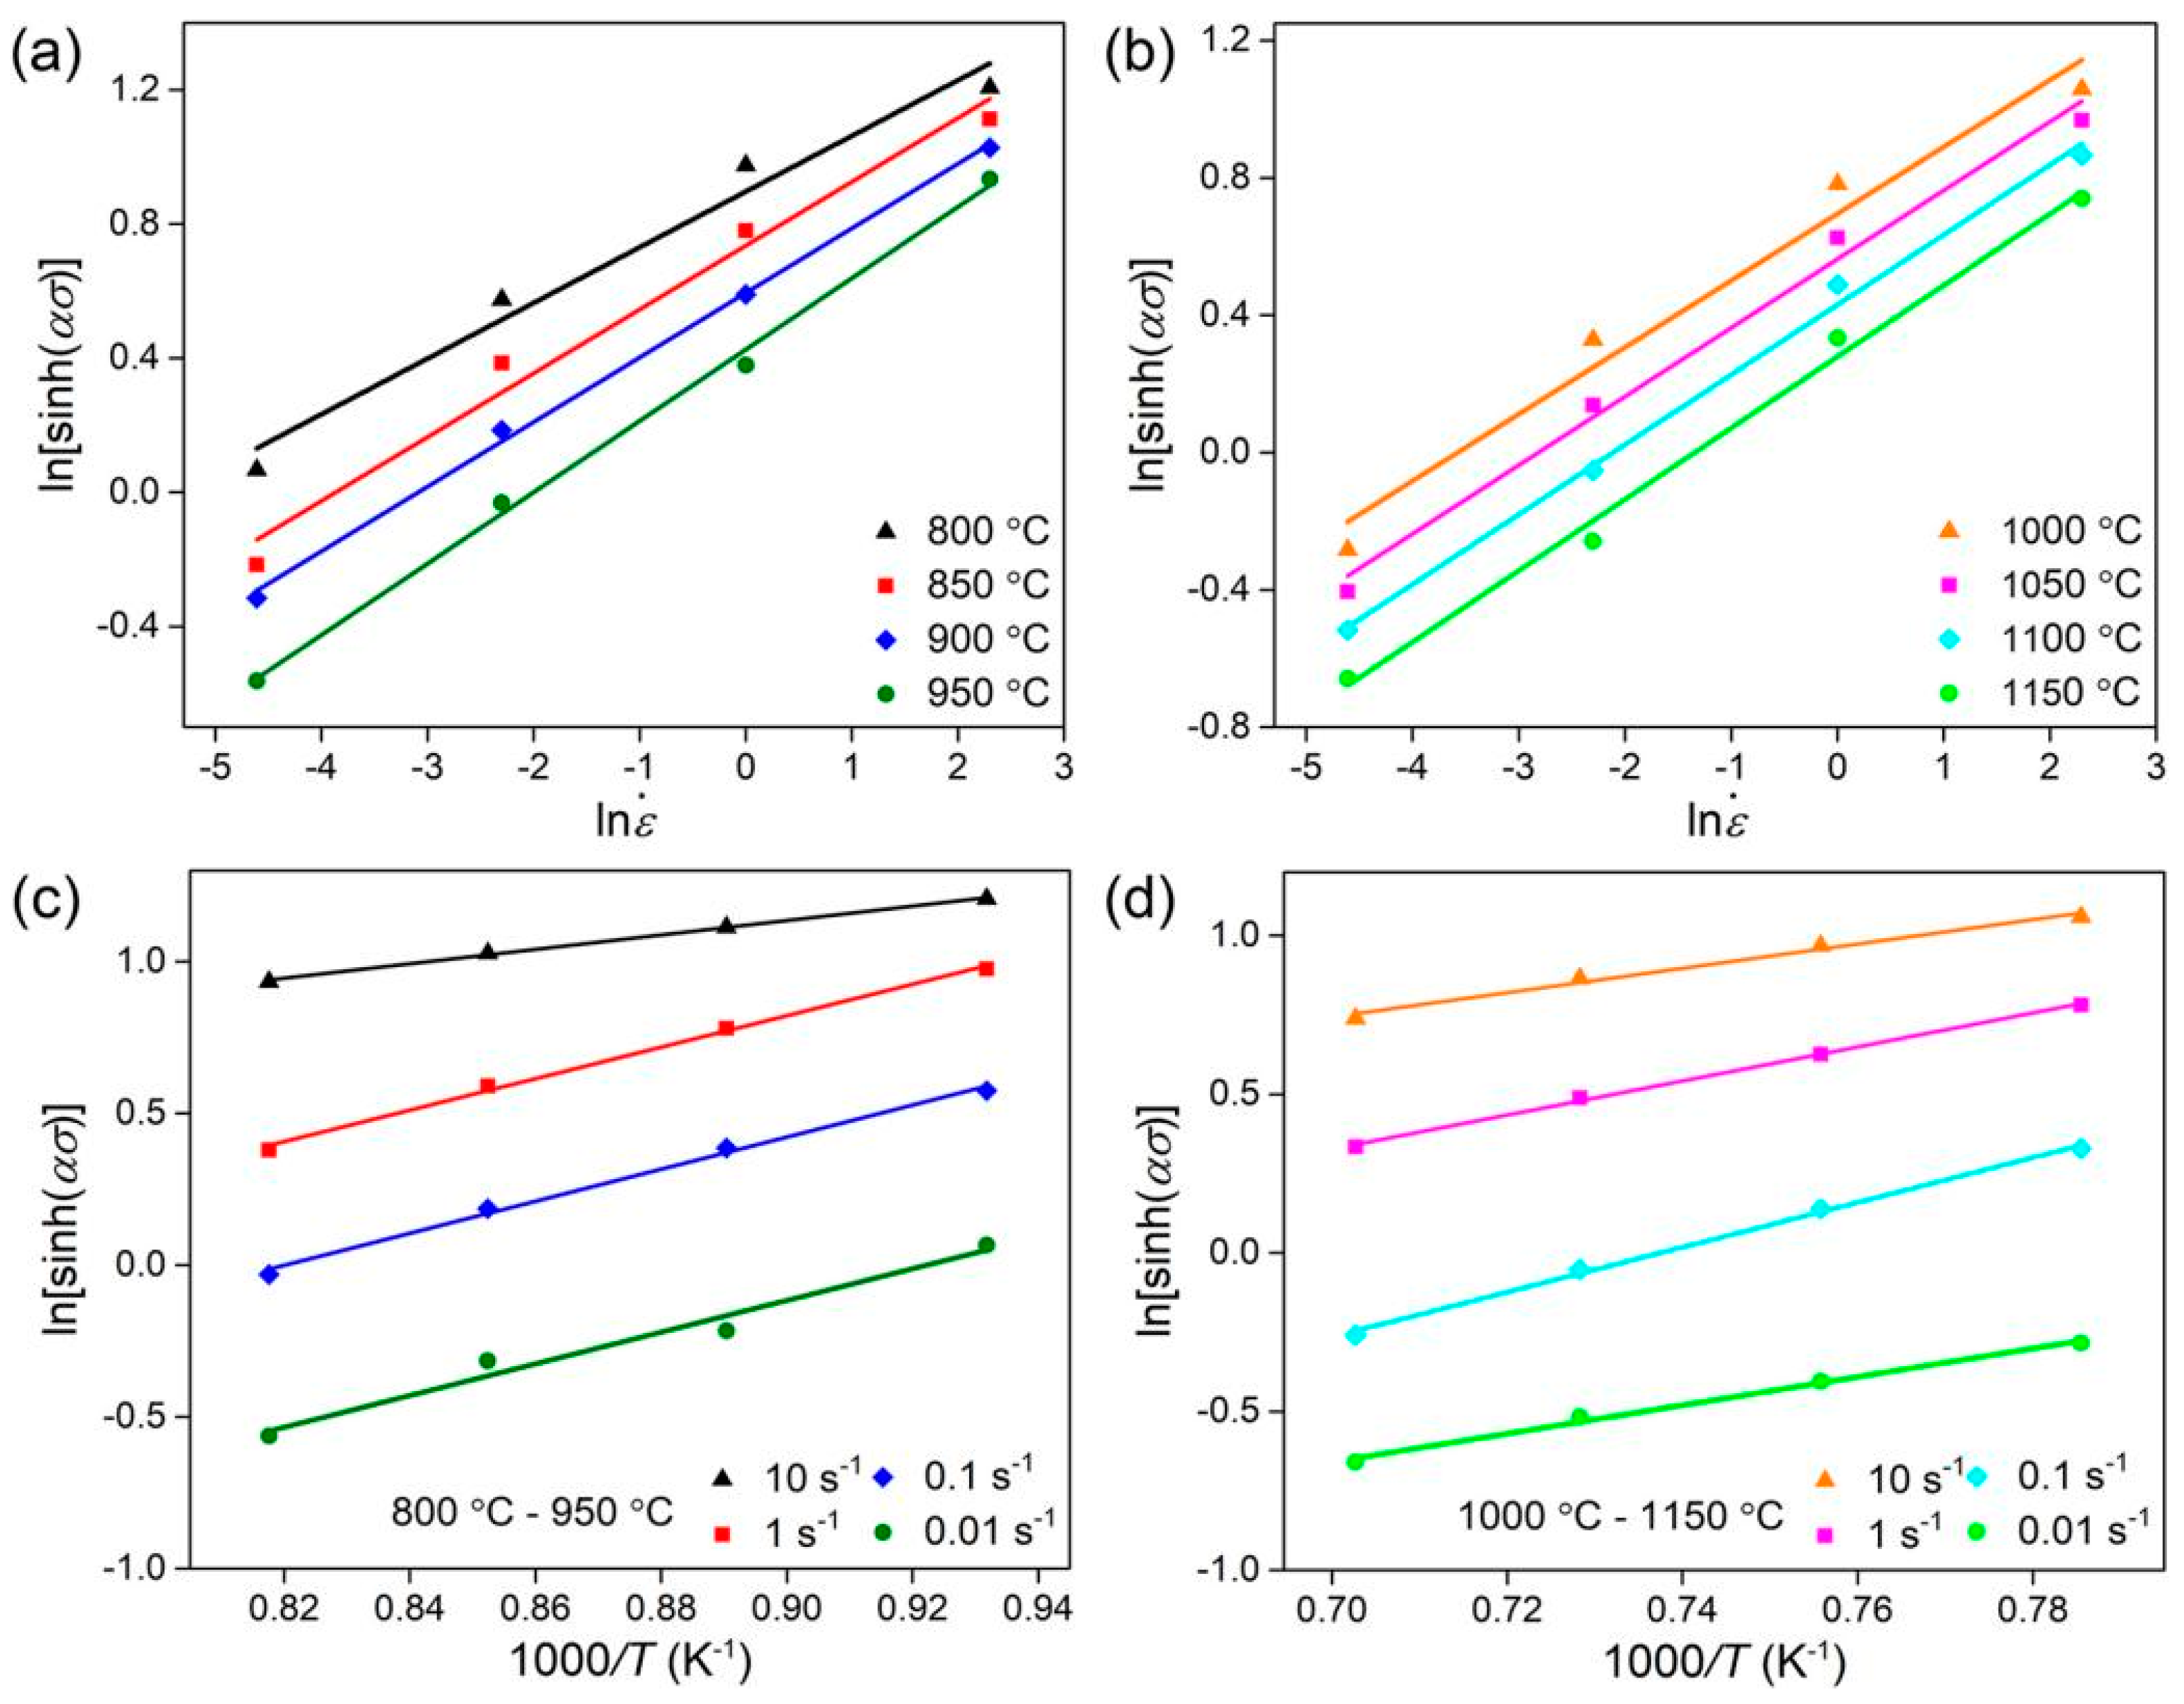
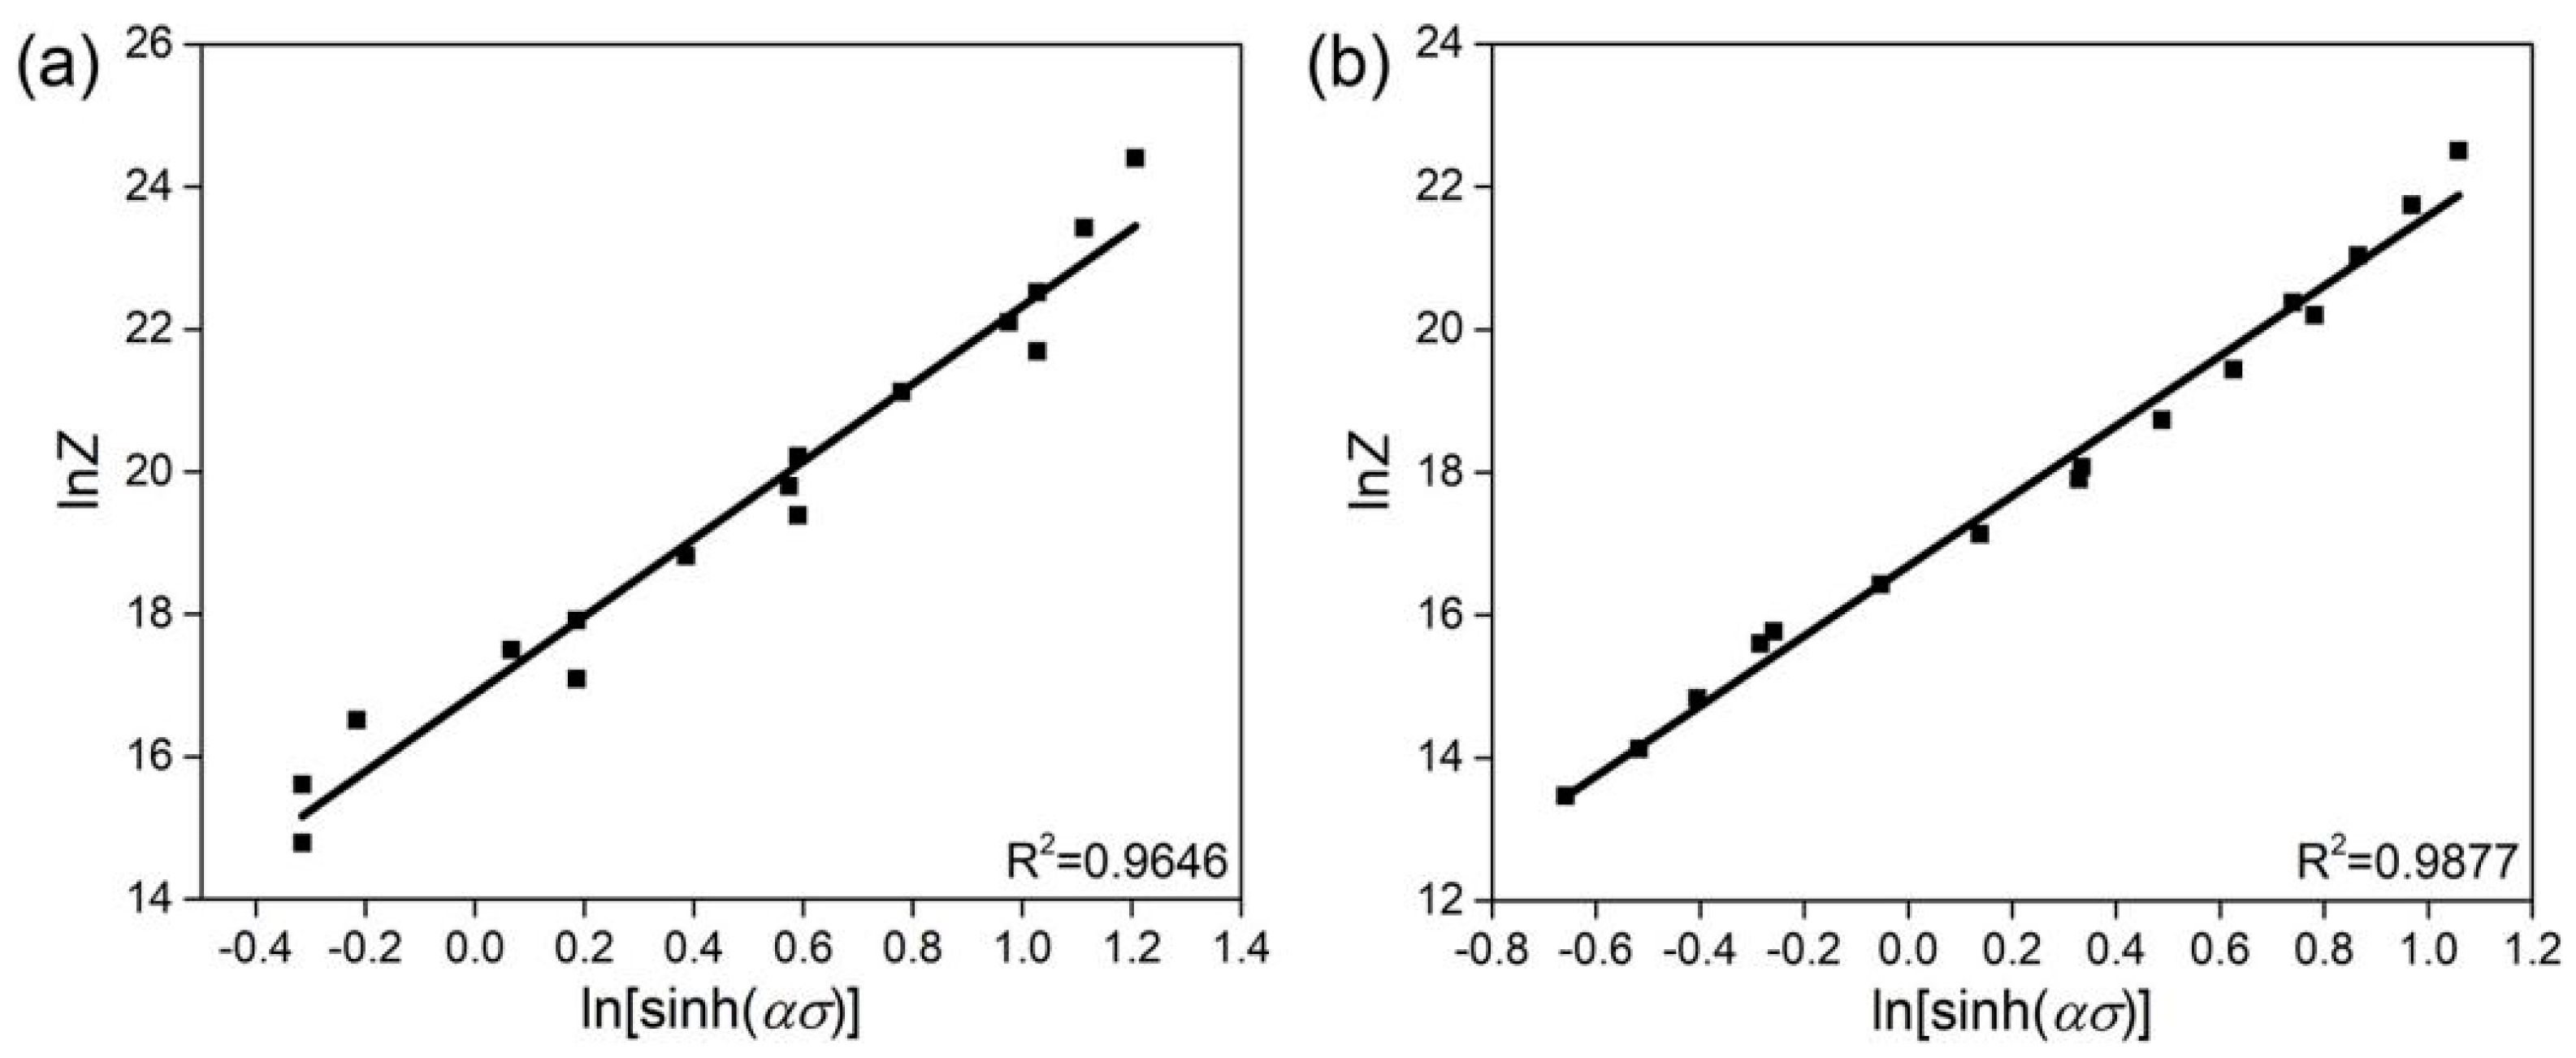
3.2. Hot-Compressive-Deformation Model

The relationship between the flow stress, σ ; strain rate, ε ˙ ; and temperature, T, is widely described by an Arrhenius-type hyperbolic-sine relationship and Zener–Hollomon parameter, Z, which can be represented as follows [18,19]:
A 0 σ n 0 ( α σ < 0.8 )
Z = ε ˙ exp ( Q R T ) = A 1 exp ( β σ ) ( α σ > 1.2 )
A [ sin h ( α β ) ] n ( f o r   a l l   σ )
where Q (kJ/mol) is the activation energy; R is the universal gas constant, 8.314 J·mol−1·K−1; ε ˙ represents the strain rate; A0, A1, and A are structural factors; α denotes the stress level parameter; and β is a constant. n0 and n are stress exponents. Equations (1) and (3) are applicable to low stress levels, α σ < 0.8 ; high stress levels, α σ > 1.2 ; and all stress levels, respectively.
As shown in Figure 5, σ versus ln ε ˙ and ln σ versus ln ε ˙ at 800–1150 °C were, respectively, calculated using Equations (1) and (2), complying with the following Equations (4) and (5), and α can be calculated using Equation (6):
n 0 = ( ln ε ˙ / ln σ ) T
β = ( ln ε ˙ / σ ) T
α = β / n 0
The stress exponent, n, and the activation energy, Q, can be calculated using Equation (3) with the linear fitting line of ln [ sin h ( α σ ) ] - ln   ε ˙ and ln [ sin h ( α σ ) ] - 1000 / T , as shown in Figure 6, and the correlation coefficients are close to 1.
To further take the log function and deduce the equivalence relation on both sides of Equation (3), the parameters A can be derived, as shown in Figure 7.
Based on the above experimental data, the n0, β, α, n, A, and Q for Fe-2 wt% Nb steel are listed in Table 2. The activation energies of the ferrite + NbC region and austenite + NbC region were separately calculated using two linear ranges, as shown in Figure 6c,d. They were 197.23 kJ/mol and 213.86 kJ/mol, respectively, which are higher than that of a low-carbon AISI1010 steel (177 kJ/mol) [20], and comparable to that of Fe-2Mn-0.3Si-0.1Nb (wt%), which is 280 kJ/mol [21]. This means that the NbC precipitates and solute Nb have effects on the deformation process. Consequently, the constitutive equations can be established as:
ε ˙ = 2.15 × 10 7 [ sin h ( 0.0089 σ ) ] 5.25 exp ( 197.23 × 10 3 / R T )  
for the ferrite + NbC dual-phase region, and:
ε ˙ = 1.77 × 10 7 [ sin h ( 0.0099 σ ) ] 4.96 exp ( 213.86 × 10 3 / R T )
for the austenite + NbC dual-phase region.
As shown in Table 2, most of the parameters obtained in the two temperature ranges are very close; thus, parameters in single temperature range (800–1150 °C) were also calculated with same methods and are listed in Table 2. However, it is shown that most of the parameters were largely different from their counterparts, indicating that separately measuring two temperature regions is much more applicable to our conditions.

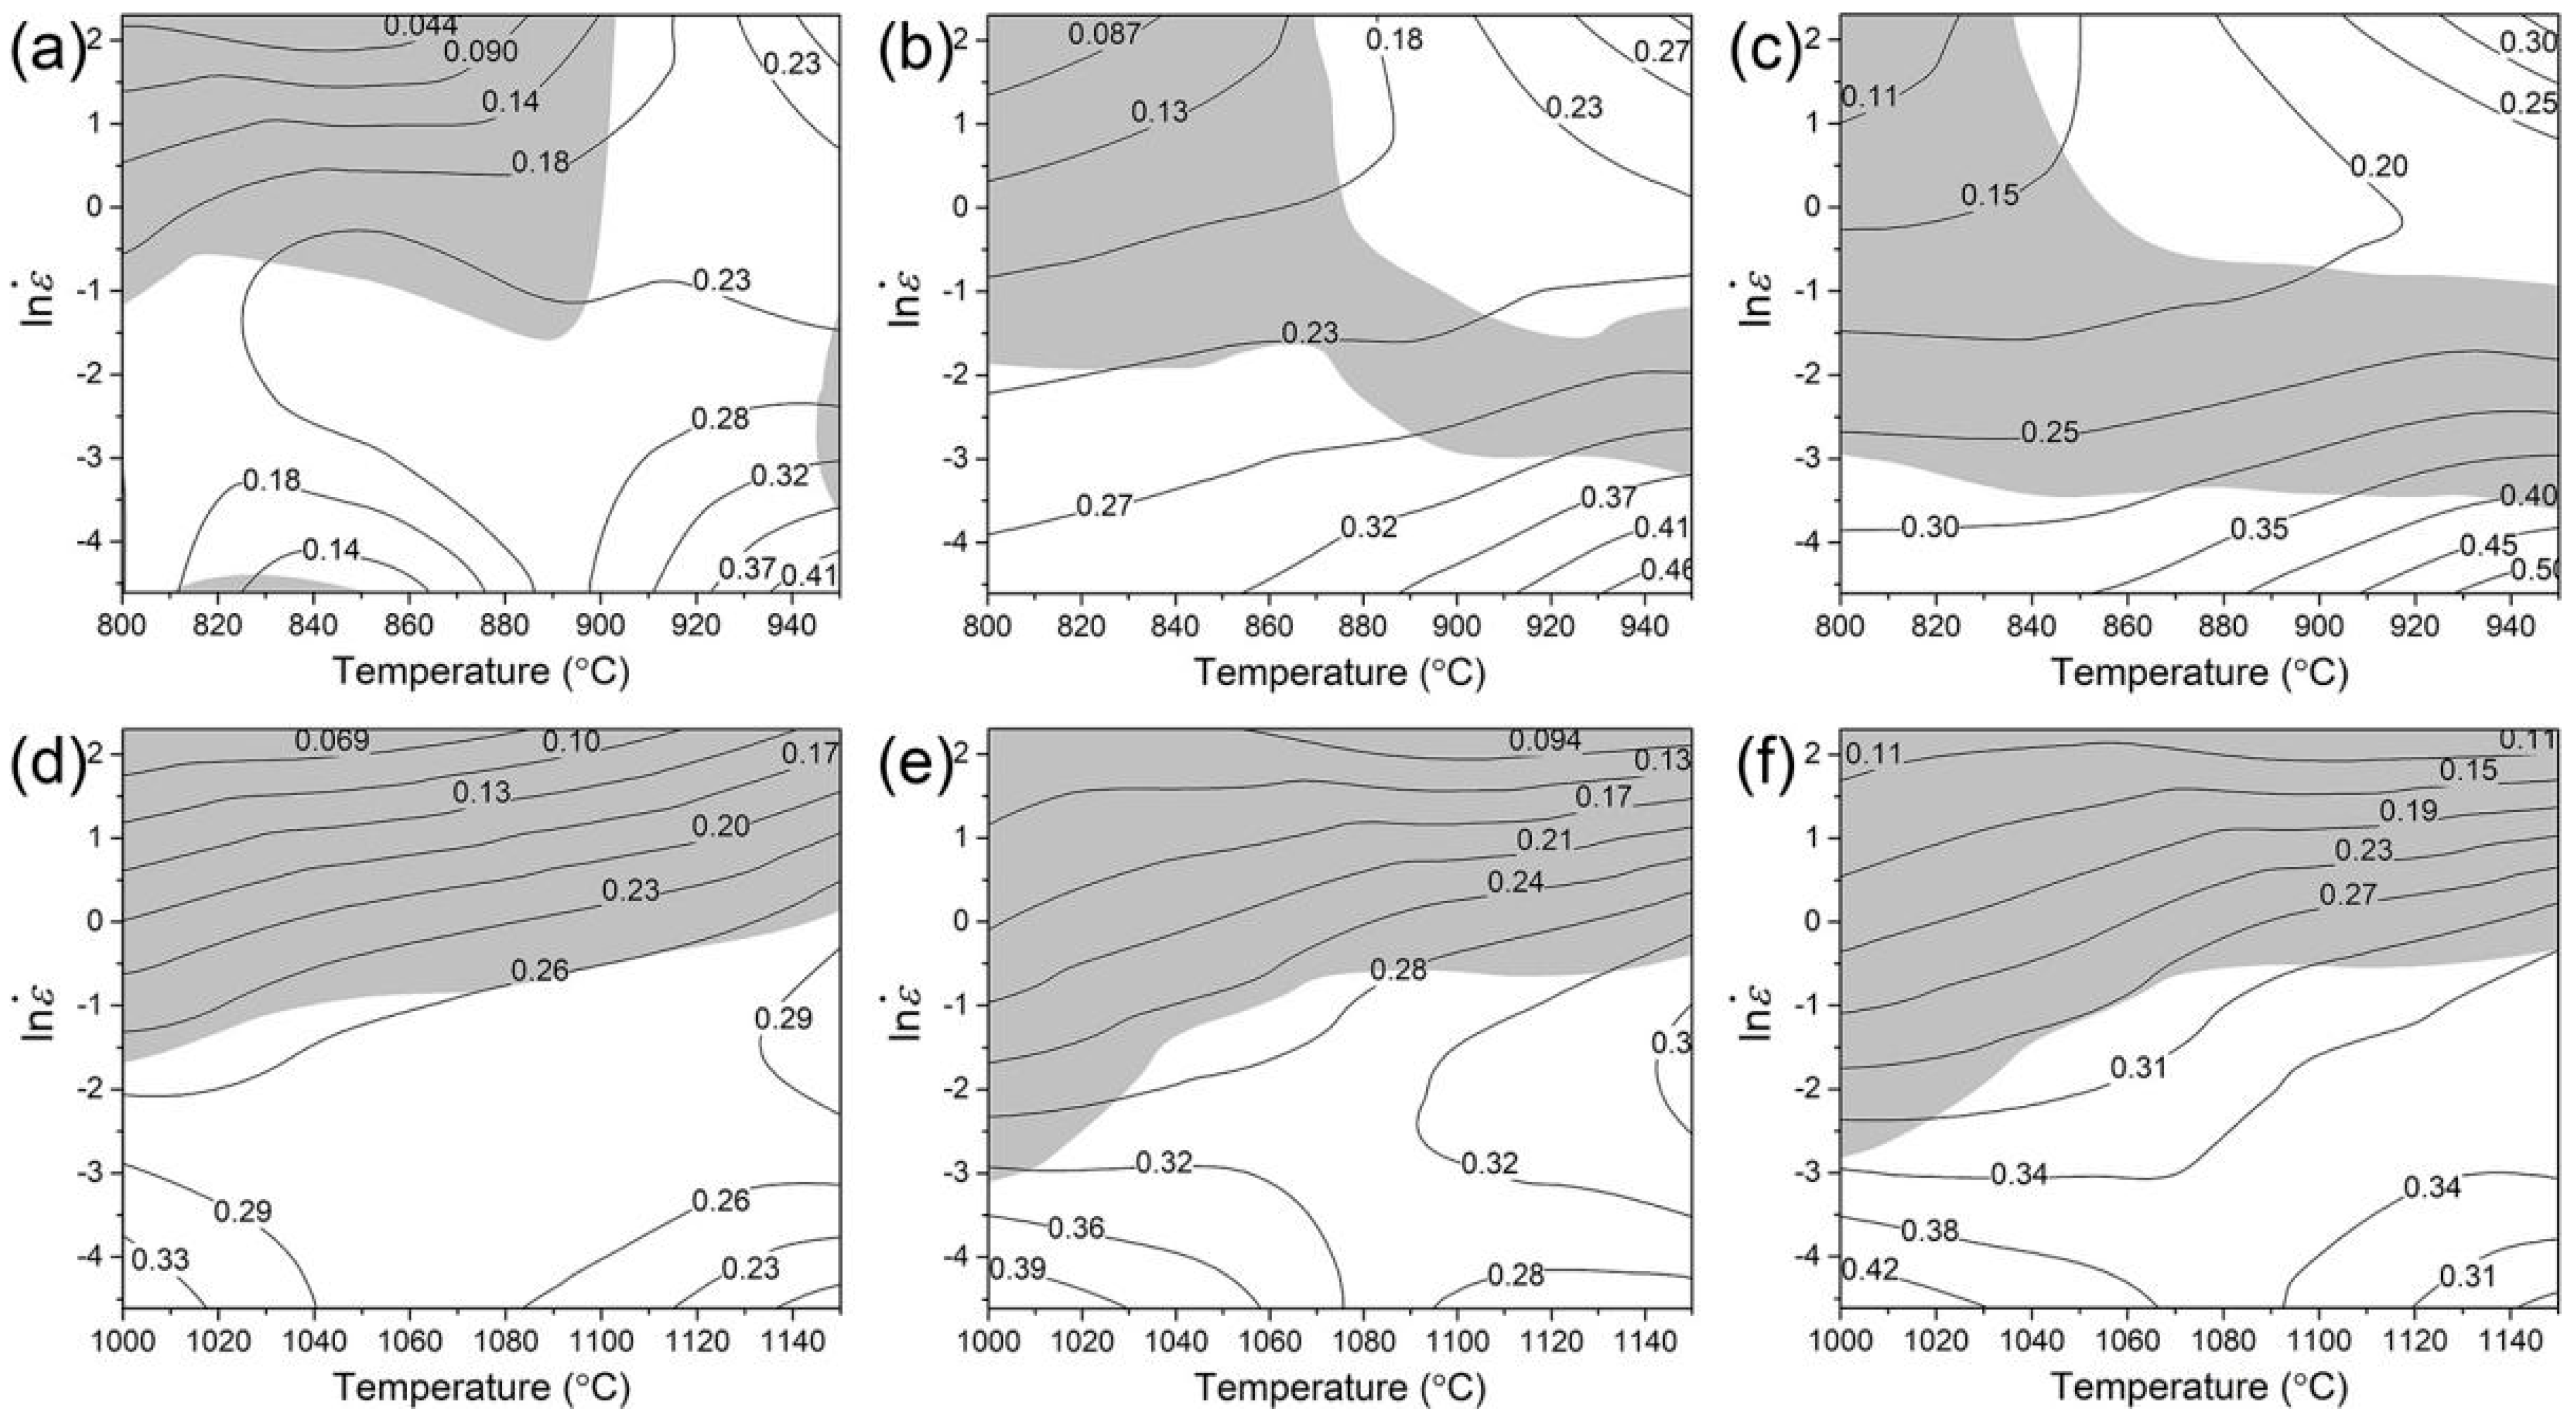
3.3. Hot-Processing Maps

According to the calculation formula for the hot-processing map [22,23,24], the total power, P, consists of two parts; one is the power consumption, G, and the other is the dissipation of quantity, J, related to the dissipation energy arising from the microstructural changes. The relationship among P, G, and J can be described by Equation (9):
P = σ ε ˙ = G + J = 0 ε ˙ σ d ε ˙ + 0 σ ε ˙ d σ
The parameter m can be calculated from Equation (10). The power-dissipation efficiency, η , and instability criteria efficiency, ξ ( ε ˙ ) , can be calculated using Equations (11) and (12), respectively:
m = J / G = ( ln σ ) / ( ln ε ˙ )
η = 2 m / ( m + 1 )
ξ ( ε ˙ ) = ln [ m / ( m + 1 ) ] / ln ε ˙ < 0
At a certain strain, the hot-working diagram can be obtained by the superposition of the power-dissipation-efficiency diagram and instability diagram.
Figure 8 exhibits the hot-processing maps of 2Nb steel at different strains. The value on the contour line in Figure 8 is the power-dissipation factor, η , which represents the power dissipation required by the evolution of the microstructure in the thermal-deformation system. The larger the η value is, the more likely dynamic recovery and dynamic recrystallization will occur in this region, thus ensuring the reduction of internal defects in the metal and the refinement of the grains. However, not all regions with large η values can obtain products with ideal mechanical properties. When the hot-working parameters meet Equation (12), these regions will have microstructural instability, such as coarse grains or rheological characteristics, so these regions are the instable domains. Thus, Equation (12) is the boundary of the instable and the safe domains.
For the ferrite + NbC dual-phase region, it can be observed that, as the total deformation strain increased, the instable domains covered by shadow gradually diffused from a low-temperature and high-strain-rate region to a high-temperature and low-strain-rate region, and the area of the instable domains gradually increased. The safe domains without shadow for hot processing were located in the region with low strain rates (0.01 s−1) at all temperatures, as well as a high strain rate (1–10 s−1) at temperatures of about 840–950 °C. The maximum power-dissipation efficiency was 0.5, obtained at 950 °C with 0.01 s−1, where the optimum processing performance could be obtained. For the austenite + NbC phase region, it can also be seen that the instable domains gradually diffused from a high-strain-rate region to low-strain-rate region with increasing total deformation strain, and the safe domains dwelt approximately in the region from 0.01 s−1 to 0.1 s−1 strain rates at all temperature ranges. The maximum power-dissipation efficiency reached 0.43 at 1000 °C with 0.01 s−1, where the best processing performance could be achieved.

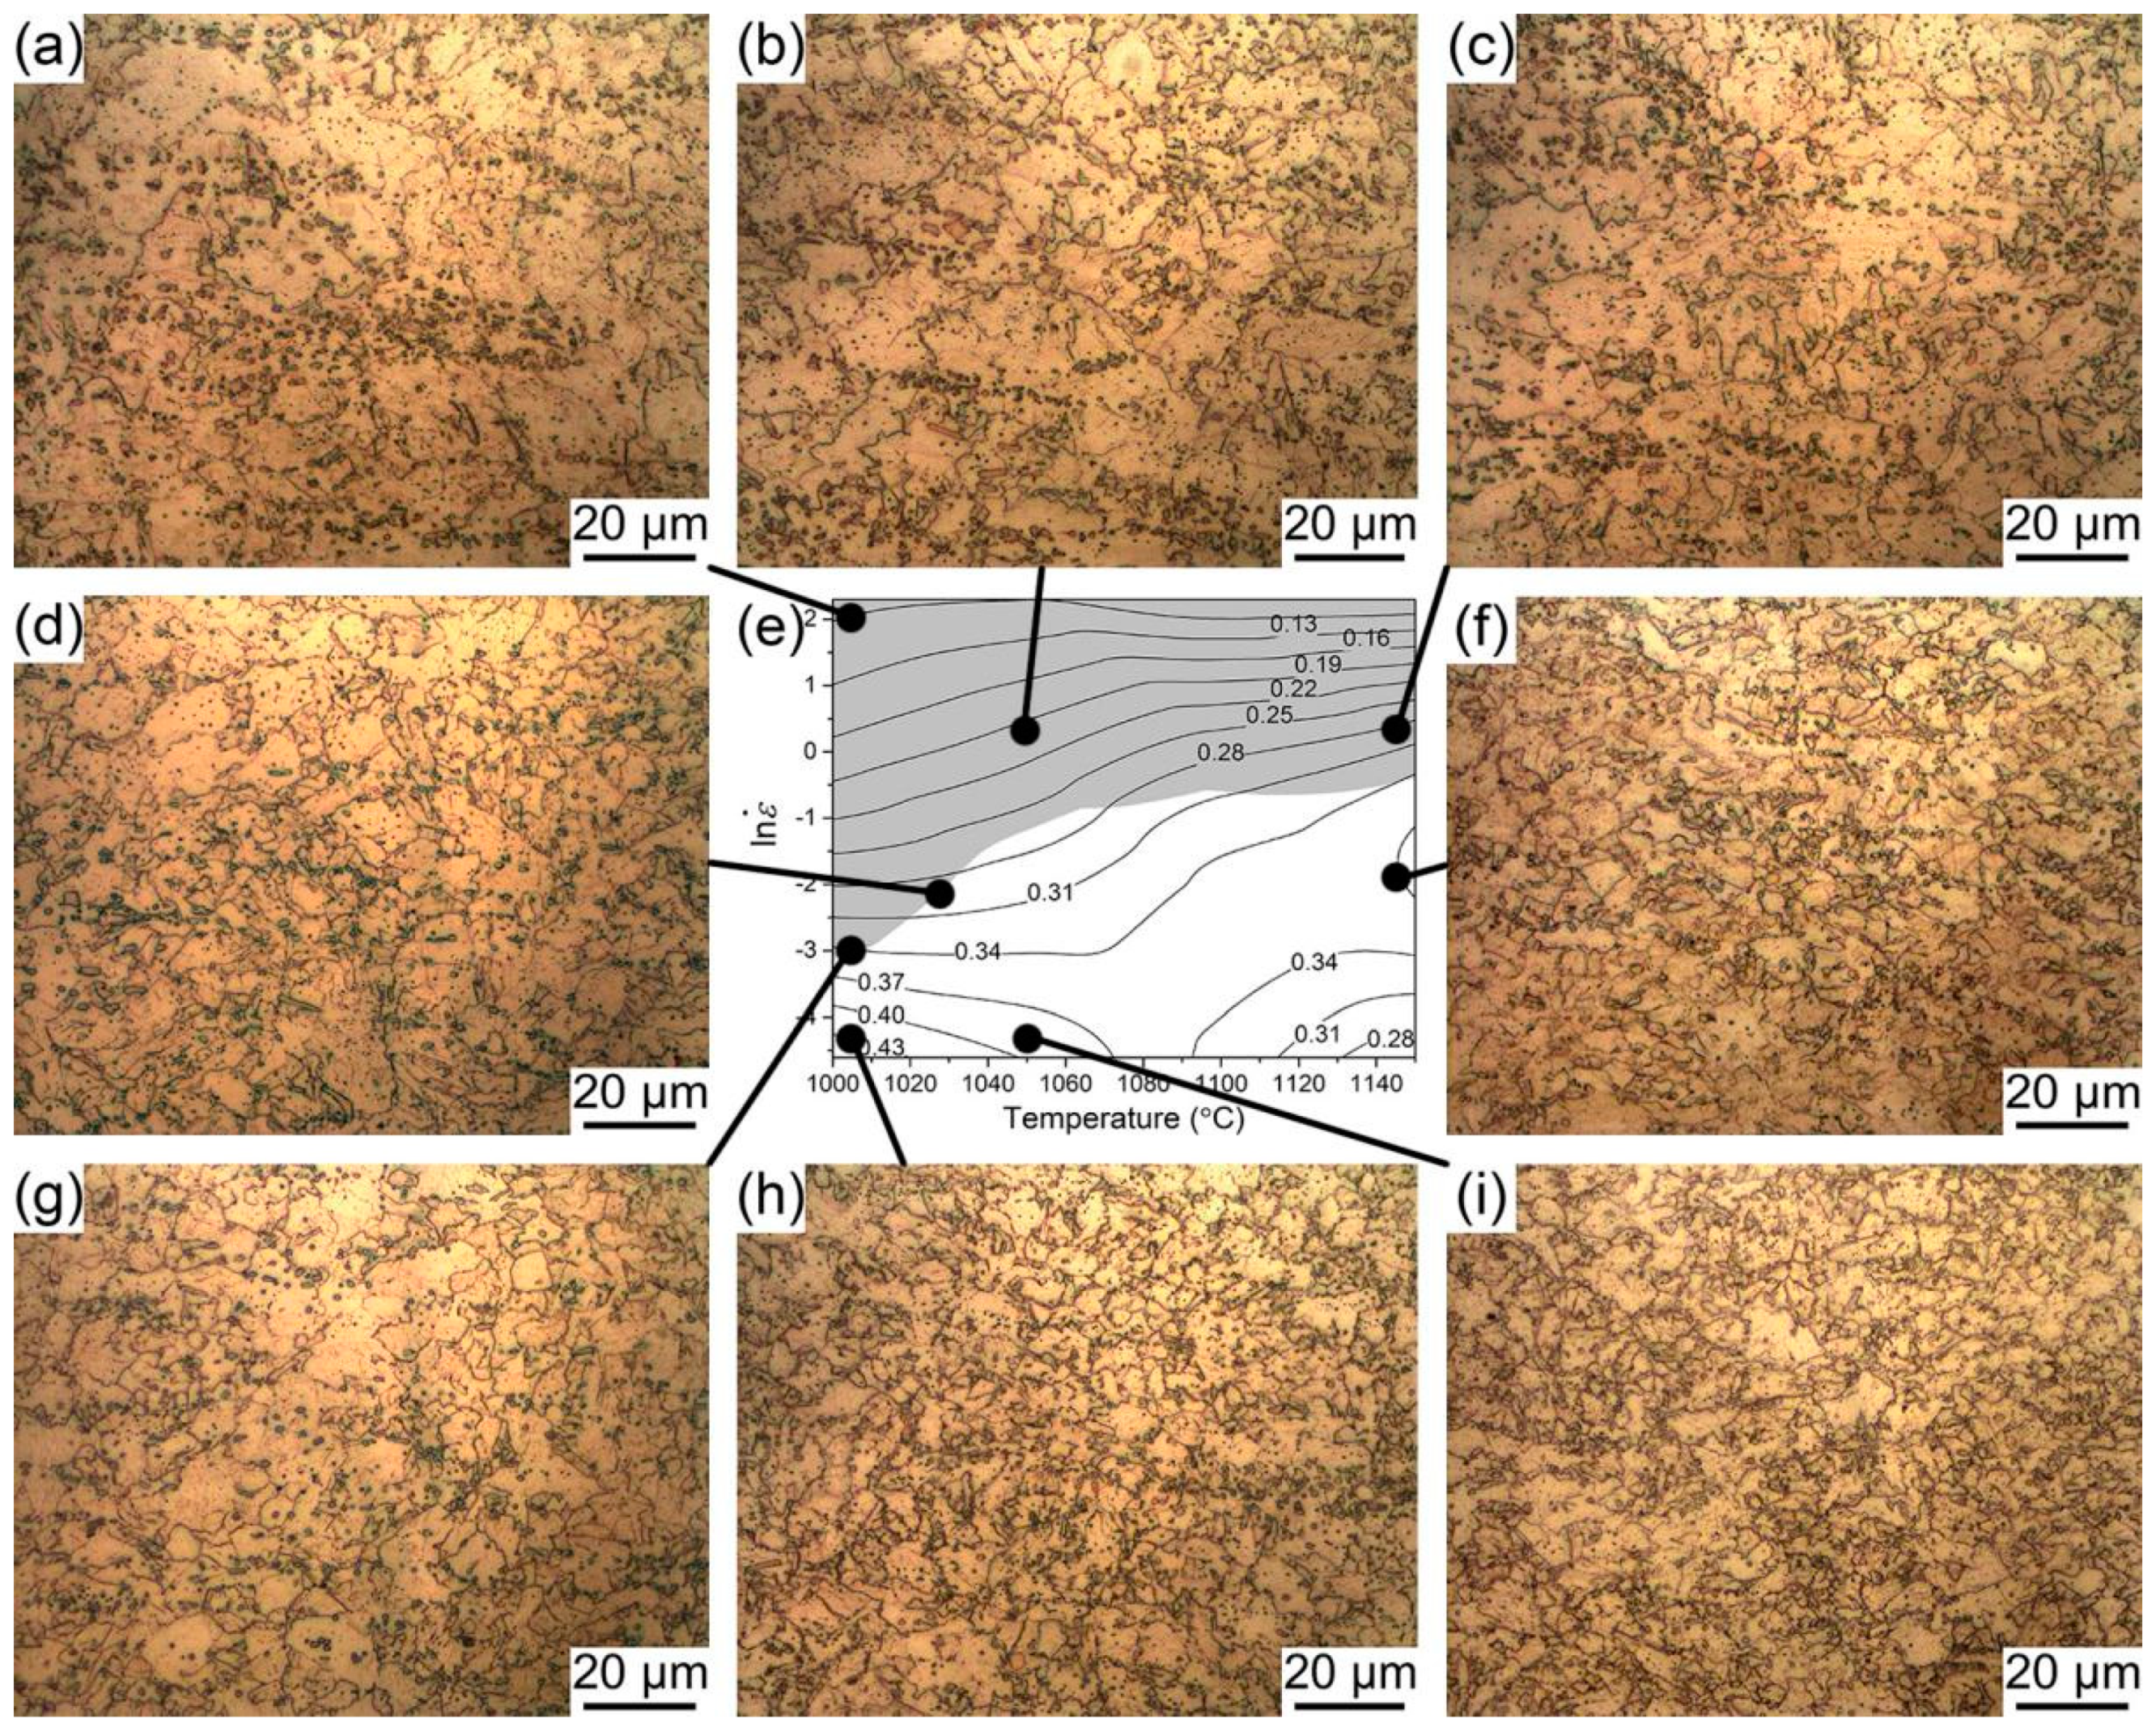
3.4. Microstructural Evolution

To investigate microstructural evolution correlating with stress–strain behavior, the microstructures of specimens after hot compression were characterized by optical microscopy.
As shown in Figure 9a–c, the instability domain with an η of 0.1–0.22 in the temperature range of 800–950 °C with strain rates of 0.03–10 s−1 for a true strain of 0.69 was characterized by mainly elongated grains and a small fraction of recrystallization grains; see the regions indicated by black arrows. This is consistent with previous reports on flow instability resulting in localized plastic flow or cracking [25]. The safe domain with a high power-dissipation efficiency, η , was mainly composed of two stable regions, i.e., the region in a temperature range of 900–950 °C with strain rates of 0.3–10 s−1 and the region in a temperature range of 800–950 °C with strain rates of 0.01–0.2 s−1, as seen from Figure 9f,h,i. In these domains, η was calculated to be from 0.22 to 0.50, representing a homogeneous and completed recrystallization microstructure. Moreover, it could be found that the grain size decreased with an increase in η , which indicates that sufficient recrystallization requires more energy consumption [26]. Therefore, based on Equations (11) and (12) as well as the validation of optical micrographs, the processing performances of these regions were suitable for actual production. Furthermore, the third microstructural domain was the boundary between the stable region and unstable region, as seen from Figure 9d,g. It could be notably observed that a greatly inhomogeneous microstructure existed from location to location, such as a deformed microstructure in the upper part of Figure 9g and recrystallized microstructure in the lower part of Figure 9g. Therefore, these processing areas should also be avoided in actual production.
Compared with the microstructures for 800–950 °C consisting of a ferrite + NbC phase, the microstructures for 1000–1150 °C composed of austenite + NbC were different, as seen in Figure 10a–i. In the unstable domain with an η of 0.1–0.27 in the temperature range of 1000–1150 °C with strain rates of 0.06–10 s−1, the grains were relatively coarse, as shown in Figure 10a–c. In addition, further observation shows that, with an increase in the η value, the formation of new grains occurred gradually. As seen in Figure 10f,h,i, it is evident that, in the safe domain, the grains were relatively fine and uniformly distributed, accompanying signs of dynamic recrystallization, where the η varied from 0.31 to 0.43 with strain rates of 0.01–0.36 s−1 in a temperature range of 1000–1150 °C. Compared with the stable domain of 800–950 °C, the grain size was smaller, and the grain boundary morphology was more curved in the stable domain at 1000–1150 °C. In the same way, the grain size decreased with a rise in the η value. As shown in Figure 10d,g, at the boundary between the stable and unstable regions, small grains were embedded by coarse grains, which is slightly different from that at 800–950 °C.

4. Conclusions

The hot-deformation behavior and microstructural evolution of Fe-2 wt% Nb steel were studied. The Arrhenius constitutive equation together with a microstructural evolution characterization was employed to describe the flow behavior. The relevant conclusions are as follows:
  • The constitutive equations of hot deformation are as follows:
    ε ˙ = 2.15 × 10 7 [ sin h ( 0.0089 σ ) ] 5.25 exp ( 197.23 × 10 3 / R T )
    for the bcc + fcc dual-phase microstructure and
    ε ˙ = 1.77 × 10 7 [ sin h ( 0.0099 σ ) ] 4.96 e x p ( 213.86 × 10 3 / R T )
    for the fcc phase microstructure.
  • Based on the experimental data, the processing maps were obtained. For the ferrite matrix condition, the feasible regions are in the 850–950 °C range with strain rates of 0.4–10 s−1 and 800–950 °C with strain rates of 0.01–0.03 s−1, respectively. For the austenite matrix, the feasible region ranges from 1000 °C to 1150 °C with strain rates of 0.01–0.05 s−1.
  • In the safe domains, with an increase in η , the grains are gradually refined, showing a typical recrystallization structure. However, in the instable domains, the grains are elongated and separated without recrystallization, showing typical rheological-instability characteristics.

Author Contributions

Conceptualization, W.L. and L.Z.; methodology, W.L.; software, Z.H.; validation, L.Z., Z.H. and G.W.; formal analysis, W.L.; investigation, W.L.; resources, L.Z. and Y.W.; data curation, P.C. and Y.W.; writing—original draft preparation, W.L.; writing—review and editing, L.Z. and Z.H.; visualization, P.C.; supervision, L.Z., Z.H. and G.W.; project administration, L.Z.; funding acquisition, L.Z. All authors have read and agreed to the published version of the manuscript.

Funding

This research was funded by the Natural Science Foundation of China (grant number 51871194 and 52071038) and the Fundamental Research Funds for the Central Universities (grant number 2020CDJDPT001).

Institutional Review Board Statement

Not applicable.

Informed Consent Statement

Not applicable.

Acknowledgments

The authors wish to thank the financial support of the Natural Science Foundation of China (NSFC, Grants No. 51871194, 52071038), and the Fundamental Research Funds for the Central Universities (Project No. 2020CDJDPT001).

Conflicts of Interest

The authors declare no conflict of interest.

References

  1. Yamamoto, Y.; Brady, M.P.; Lu, Z.P.; Maziasz, P.J.; Liu, C.T.; Pint, B.A.; More, K.L.; Meyer, H.M.; Payzant, E.A. Creep-Resistant, Al2O3-Forming Austenitic Stainless Steels. Science 2007, 316, 433–436. [Google Scholar] [CrossRef] [PubMed]
  2. Kanno, N.; Yoshimura, K.; Takata, N.; Tarigan, I.; Takeyama, M. Mechanical properties of austenitic heat-resistant Fe-20Cr-30Ni-2Nb steel at ambient temperature. Mater. Sci. Eng. A 2016, 662, 551–563. [Google Scholar] [CrossRef] [Green Version]
  3. Matsunaga, T.; Hongo, H.; Tabuchi, M.; Souissi, M.; Sahara, R. Creep lifetime and microstructure evolution in boron-added 9Cr-1Mo heatresistant steel. Mater. Sci. Eng. A 2019, 760, 267–276. [Google Scholar] [CrossRef]
  4. Jung, S.; Jo, Y.H.; Jeon, C.; Choi, W.M.; Lee, B.J.; Oh, Y.J.; Kim, G.Y. Effects of Mn and Mo addition on high-temperature tensile properties in high-Ni-containing austenitic cast steels used for turbo-charger application. Mater. Sci. Eng. A 2017, 682, 147–155. [Google Scholar] [CrossRef]
  5. Loktionov, V.; Lyubashevskaya, I.; Sosnin, O.; Terentyev, E. Short-term strength properties and features of high-temperature deformation of VVER reactor pressure vessel steel 15Kh2NMFA-A within the temperature range 20—1200 °C. Nucl. Eng. Des. 2019, 352, 110188–110192. [Google Scholar] [CrossRef]
  6. Luo, W.T.; Wang, L.L.; Wang, Y.H.; Meng, L.; Yuan, Y.; Zhang, L.; Wu, G.L. Microstructure and mechanical properties of a 2 wt% Nb bearing low carbon steel. Mater. Sci. Eng. A 2021, 826, 141957. [Google Scholar] [CrossRef]
  7. Lakshmi, A.; SrinivasaRaob, C.; Gangadharc, J.; Srinivasud, C.; Singh, S.K. Review of Processing Maps and Development of Qualitative Processing Maps. Mater. Today Proc. 2017, 4, 946–956. [Google Scholar] [CrossRef]
  8. Liu, P.T.; Huang, Q.X.; Ma, L.F.; Wang, T. Characterization of hot deformation behavior of wear-resistant steel BTW1 using processing maps and constitutive equations. J. Iron Steel Res. Int. 2018, 25, 1054–1061. [Google Scholar] [CrossRef]
  9. Wang, H.; Liu, D.; Wang, J.G.; Wang, H.P.; Hu, Y.; Rao, H.D. Characterization of hot deformation behavior of 30Si2MnCrMoVE low-alloying ultra-high-strength steel by constitutive equations and processing maps. J. Iron Steel Res. Int. 2020, 27, 807–819. [Google Scholar] [CrossRef]
  10. Chen, X.M.; Lin, Y.C.; Wen, D.X.; Zhang, J.L.; He, M. Dynamic recrystallization behavior of a typical nickel-based superalloy during hot deformation. Mater. Des. 2014, 57, 568–577. [Google Scholar] [CrossRef]
  11. Wang, H.R.; Cai, C.Y.; Chen, D.N.; Ma, D.F. Dynamic compressive behavior of Pr-Nd alloy at high strain rates and temperatures. J. Appl. Phys. 2012, 112, 014903. [Google Scholar] [CrossRef]
  12. Liang, R.; Khan, A.S. A critical review of experimental results and constitutive models for BCC and FCC metals over a wide range of strain rates and temperatures. Int. J. Plast. 1999, 15, 963–980. [Google Scholar] [CrossRef]
  13. Sheikh, H.; Serajzadeh, S. Estimation of flow stress behavior of AA5083 using artificial neural networks with regard to dynamic strain ageing effect. J. Mater Process. Technol. 2008, 196, 115–119. [Google Scholar] [CrossRef]
  14. Sun, Y.; Zeng, W.D.; Zhao, Y.Q.; Qi, Y.L.; Ma, X.; Han, Y.F. Development of constitutive relationship model of Ti600 alloy using artificial neural network. Comp. Mater. Sci. 2010, 48, 686–691. [Google Scholar] [CrossRef]
  15. Cao, Y.; Di, H.H.; Misra, R.D.K.; Yi, X.; Zhang, J.; Ma, T.J. On the hot deformation behavior of AISI 420 stainless steel based on constitutive analysis and CSL model. Mater. Sci. Eng. A 2014, 593, 111–119. [Google Scholar] [CrossRef]
  16. Lin, Y.C.; Chen, M.S.; Zhong, J. Constitutive modeling for elevated temperature flow behavior of 42CrMo steel. Comp. Mater. Sci. 2008, 42, 470–477. [Google Scholar] [CrossRef]
  17. Amiri, A.; Sadeghi, M.H.; Ebrahimi, G.R. Characterization of Hot Deformation Behavior of AMS 5708 Nickel-Based Superalloy Using Processing Map. J. Mater. Eng. Perform. 2013, 22, 3940–3945. [Google Scholar] [CrossRef]
  18. Zener, C.; Hollomon, J.H. Effect of Strain Rate Upon Plastic Flow of Steel. J. Appl. Phys. 1944, 15, 22–32. [Google Scholar] [CrossRef]
  19. Sellars, C.M.; Mctegart, W.J. On the mechanism of hot deformation. Acta Metall. 1966, 14, 1136–1138. [Google Scholar] [CrossRef]
  20. Rajput, S.K.; Chaudhari, G.P.; Nath, S.K. Characterization of hot deformation behavior of a low carbon steel using processing maps, constitutive equations and Zener-Hollomon parameter. J. Mater. Process. Technol. 2016, 237, 113–125. [Google Scholar] [CrossRef]
  21. Cao, Y.B.; Xiao, F.R.; Qiao, G.Y.; Huang, C.J.; Zhang, X.B.; Wu, Z.X.; Liao, B. Strain-induced precipitation and softening behaviors of high Nb microalloyed steels. Mater. Sci. Eng. A 2012, 552, 502–513. [Google Scholar] [CrossRef]
  22. Prasad, Y.V.R.K.; Gegel, H.L.; Doraivelu, S.M.; Malas, J.C.; Morgan, J.T.; Lark, K.A.; Barker, D.R. Modeling of dynamic material behavior in hot deformation: Forging of Ti-6242. Mater. Trans. A 1984, 15, 1883–1892. [Google Scholar] [CrossRef]
  23. Babu, K.A.; Mandal, S.; Kumar, A.; Athreya, C.N.; Boer, B. Characterization of hot deformation behavior of alloy 617 through kinetic analysis, dynamic material modeling and microstructural studies. Mater. Sci. Eng. A 2016, 664, 177–187. [Google Scholar] [CrossRef]
  24. Shi, Z.X.; Yan, X.F.; Duan, C.H. Characterization of hot deformation behavior of GH925 superalloy using constitutive equation, processing map and microstructure observation. J. Alloy. Compd. 2015, 652, 30–38. [Google Scholar] [CrossRef]
  25. Peng, X.N.; Guo, H.Z.; Shi, Z.F.; Qin, C.; Zhao, Z.L.; Yao, Z.K. Study on the hot deformation behavior of TC4-DT alloy with equiaxed α+β starting structure based on processing map. Mater. Sci. Eng. A 2014, 605, 80–88. [Google Scholar] [CrossRef]
  26. Beynon, J.H. Tribology of hot metal forming. Tribol. Inter. 1998, 31, 73–77. [Google Scholar] [CrossRef]
Figure 1. The phase diagram of Fe-Nb containing 2 wt% carbon.
Metals 11 01939 g001
Figure 2. Schematic representation of hot-deformation tests for Fe-2 wt% Nb steel.
Metals 11 01939 g002
Figure 3. True stress–true strain curves of Fe-2 wt% Nb steel at 800–950 °C: (a) 0.01 s−1, (b) 0.1 s−1, (c) 1 s−1, and (d) 10 s−1.
Metals 11 01939 g003
Figure 4. True stress–true strain curves of Fe-2 wt% Nb steel at 1000–1150 °C: (a) 0.01 s−1, (b) 0.1 s−1, (c) 1 s−1, and (d) 10 s−1.
Metals 11 01939 g004
Figure 5. Relationship between σ and ln ε ˙ , and ln σ   and   ln ε ˙ : (a,b) 800–950 °C; (c,d) 1000–1150 °C.
Metals 11 01939 g005
Figure 6. Relationship between ln [ sin h ( α σ ) ] - ln ε ˙ and ln [ sin h ( α σ ) ] - 1000 / T : (a,c) 800–950 °C; (b,d) 1000–1150 °C.
Metals 11 01939 g006
Figure 7. Relationship between ln Z - ln [ sin h ( α σ ) ] : (a) 800–950 °C; (b) 1000–1150 °C.
Metals 11 01939 g007
Figure 8. Hot-processing maps of 2Nb steel: (a) 800–950 °C and ε = 0.2, (b) 800–950 °C and ε = 0.4, (c) 800–950 °C and ε = 0.6, (d) 1000–1150 °C and ε = 0.2, (e) 1000–1150 °C and ε = 0.4, and (f) 1000–1150 °C and ε = 0.6.
Metals 11 01939 g008
Figure 9. Microstructures of 2Nb steel at 800–950 °C in different deformation regions: (a) 800 °C and ε ˙ = 10, (b) 840 °C and ε ˙ = 1, (c) 900 °C and ε ˙ = 0.1, (d) 850 °C and ε ˙ = 1, (e) hot-processing maps (800–950 °C), (f) 950 °C and ε ˙ = 1, (g) 800 °C and ε ˙ = 0.1, (h) 900 °C and ε ˙ = 0.01 and (i) 950 °C and ε ˙ = 0.01.
Metals 11 01939 g009
Figure 10. Microstructures of 2Nb steel at 1000–1150 °C in different deformation regions: (a) 1000 °C and ε ˙ = 10, (b) 1050 °C and ε ˙ = 1, (c) 1150 °C and ε ˙ = 1, (d) 1030 °C and ε ˙ = 0.1, (e) hot-processing maps (1000–1150 °C), (f) 1150 °C and ε ˙ = 0.1, (g) 1000 °C and ε ˙ = 0.1, (h) 1000 °C and ε ˙ = 0.01 and (i) 1050 °C and ε ˙ = 0.01.
Metals 11 01939 g010
Table 1. The specific composition of Fe-2 wt% Nb steel.
ElementNbCCrNiVPFe
wt%2.1100.1980.0260.0170.0130.010bal
Table 2. Parameters in Equations (1)–(8).
Tn0βαnAQ (KJ/mol)
800–950 °C6.770.0610.00895.252.15 × 107197.23
1000–1150 °C6.320.0630.00994.961.77 × 107213.86
800–1150 °C5.550.0640.01154.213.88 × 107266.59
Publisher’s Note: MDPI stays neutral with regard to jurisdictional claims in published maps and institutional affiliations.

