Article

Research on the Thermal Characteristics of an 18650 Lithium-Ion Battery Based on an Electrochemical–Thermal Flow Coupling Model

1
National Center for Materials Service Safety, University of Science and Technology Beijing, Beijing 100083, China
2
Research Institute of Macro-Safety Science, University of Science and Technology Beijing, Beijing 100083, China
*
Author to whom correspondence should be addressed.
World Electr. Veh. J. 2021, 12(4), 250; https://doi.org/10.3390/wevj12040250
Submission received: 2 September 2021 / Revised: 17 November 2021 / Accepted: 18 November 2021 / Published: 24 November 2021

Abstract

:
Aiming at the complex experimental conditions of multi-physical field coupling in the analysis of thermal characteristics of lithium-ion batteries, a three-dimensional electrochemical-thermal flow coupling model for lithium-ion batteries was established using COMSOL Multiphysics software. Through the analysis of simulation results, the thermal characteristics of lithium-ion batteries for electric vehicles were explored from the aspects of heat generation and dissipation. It was found that increasing the charge–discharge rate and the electrode thickness will increase the temperature rise rate of lithium-ion batteries, and the temperature rise rate of lithium-ion batteries is the highest during their first time charging and discharging. Increasing the airflow velocity and reducing the size of the inlet flow area can improve the cooling effect on the cell. Under a single inlet, the cooling effect of the airflow field entering from the negative electrode is better than that from the positive electrode.

1. Introduction

Batteries are widely used in the field of electric vehicles. Compared with lead–acid, Ni–MH, and sodium sulfur batteries, lithium-ion batteries have a long service life, low maintenance, large specific energy, high output voltage, and a low self-discharge rate [1]. Battery development is the main research focus in electric vehicles and energy storage systems [2]. Lithium-ion batteries can generate a lot of heat while charging and discharging. Untimely heat dissipation will accumulate heat and lead to excessive battery temperature. Temperature changes will not only damage the performance of the internal materials of the battery and reduce the service life of the battery, but also easily lead to overheating, expansion, electric leakage, fire, explosion, and other thermal runaway phenomena which pose a great threat to the safety of automobiles and passengers [3]. Therefore, it is important to analyze the thermal characteristics of lithium-ion batteries.
The heat generation of lithium-ion batteries is mainly comprised of irreversible heat and reversible heat. Reversible heat is generally determined by the entropy coefficient during charging and discharging. Irreversible heat is mainly generated by overpotential during charging and discharging [4]. Zhang [5] analyzed the discharge process of lithium-ion batteries, discussed their sources of reversible heat and irreversible heat, and studied their heating characteristics. It was found that the ohmic heat generated by lithium-ion batteries accounts for about 54%, electrochemical reaction heat accounts for about 30%, and the heat generated by polarization accounts for the least. Both Duan and Xu et al. [6,7] decomposed the calculation of irreversible heat of the battery into reactive polarization heat and ohmic polarization heat. This method can be used to analyze the heating mechanism of a battery in detail by simulation, but it takes a long time and needs to solve a lot of partial differential equations. Dai et al. [8] calculated the irreversible heat of the battery by creating a difference between the open circuit potential and the terminal voltage of the battery, improving the simulation accuracy of the battery temperature distribution. Low temperature affects the capacity of lithium-ion batteries. Wu [9] studied the effect of low-speed charging on the capacity fading of lithium-ion batteries in a low-temperature environment through experiments.
Due to the complex experimental conditions of multi-physical field coupling in the thermal characteristic analysis of lithium-ion batteries, the finite element method is commonly used to simulate and analyze batteries. Cheng [10] developed a simple circuit model to efficiently calculate the heat generation of a Li-ion cell and integrated it into the commercial software Fluent for engineering applications. Compared to the 1D and 2D thermal models, the thermoelectrical model produced the best simulated temperature of an 18650 Li-ion battery. Joris et al. [11] established a streamlined three-dimensional thermal model of lithium titanate based on heat transfer theory, and conducted module simulation under extreme conditions. The internal conduction and convection heating effects were considered in the temperature simulation prediction. The experimental results showed that the temperature data were consistent with the simulation results. Du et al. [12] established three-dimensional models of lithium-ion battery cells and three- and five-series battery modules by COMSOL, and quantitatively analyzed their temperature distribution under different operating currents and specific heat transfer coefficients. Chen et al. [13] established the electrochemical–thermal coupling model of 18650 lithium-ion batteries using COMSOL simulation software, and the effects of various factors on battery temperature and temperature difference were comprehensively and systematically compared, which verified the accuracy of the model. Edouard et al. [14] developed a single particle (SP) electrochemical–thermal model by applying a pseudo-2D mathematical structure. The model was applied to evaluate the sensitivity of key parameters involved in battery aging. Tran et al. [15] provided a 1D electrochemical–thermal model to reduce the order of the P2D model, thus significantly reducing calculation time. Capron et al. [16] investigated the thermal behavior of large LiFePO4 batteries with the P2D model created by COMSOL Multiphysics, finding a 1.9 °C temperature difference between the core and the surface and a 0.9 °C difference between the longitudinal and radial directions. This result was later validated by measurements of LiFePO4 26650 lithium-ion cylindrical cells under different discharge depths [17]. Ghaznavi et al. [18] applied a mathematical approach to conduct a sensitivity study on a lithium–sulfur cell. They focused on the effects of discharge current and positive conductivity over a wide range.
At present, most studies model and analyze lithium-ion batteries based on the electrochemical and thermal scales. When the thermal characteristics of lithium batteries are simulated, the effects of other physical fields on the model are not considered, especially when analyzing the thermal behavior of the model, and coupling in external heat dissipation conditions is not considered. The existing literature only simulates the temperature characteristics of lithium-ion batteries from a single angle of heat generation or dissipation, and seldom comprehensively analyzes the thermal characteristics of lithium-ion batteries from two angles. In view of this, based on electrochemical–thermal flow multi-physical field coupling, a cylindrical 18650 lithium-ion battery model was established. The thermal performance of the battery was simulated and analyzed from two aspects: heat generation (discharge rate, electrode thickness, and continuous charge–discharge cycle) and heat dissipation (ambient temperature, air-cooled heat dissipation conditions, and heat dissipation position). The thermal characteristics of the 18650 lithium-ion battery were comprehensively analyzed and compared. A reference for the structural optimization of lithium-ion batteries and a theoretical basis for the development of battery thermal management systems were thus produced, emphasizing the main factors of battery performance, battery aging, and thermal safety during operation.

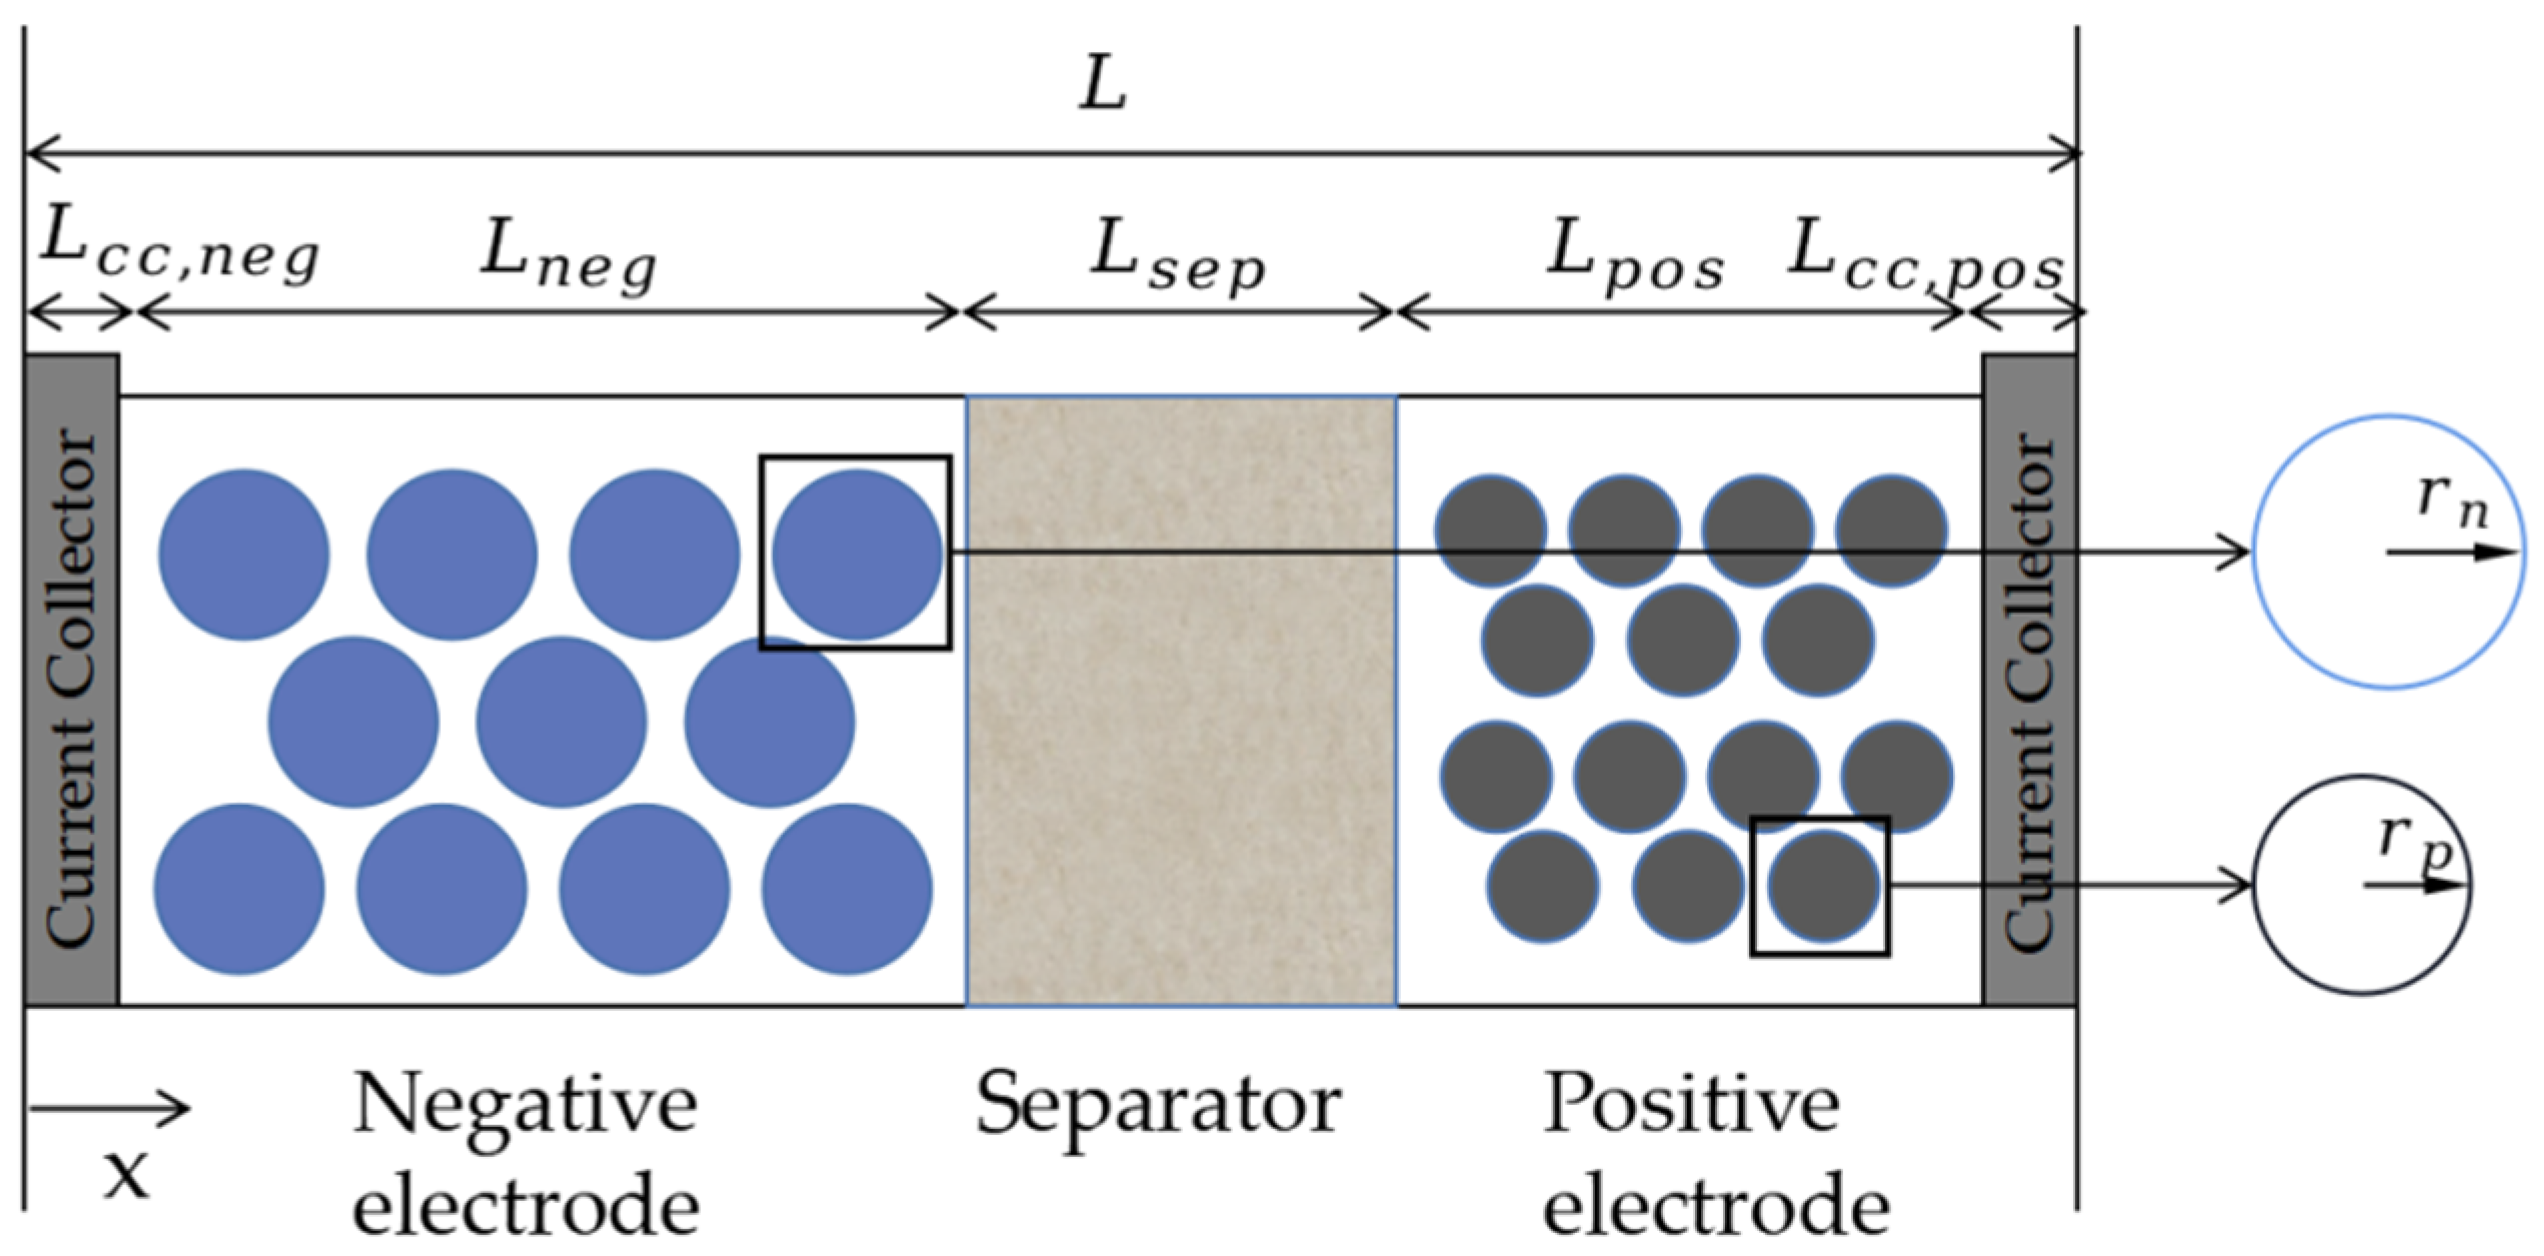
2. Establishment of a Lithium-Ion Battery Model

Mathematical models can describe and predict the voltage and current density of batteries in transient processes such as charge and discharge, mechanisms of battery aging and failure, and the effects of different materials, characteristics, and design parameters on battery performance.

2.1. Basic Electrochemical Model

In the 1990s, Doyle, Fuller, and Newman [19,20] established the pseudo-two-dimensional (P2D) model based on the porous electrode and concentrated solution theory, which is the main model used for the high-fidelity modeling of lithium-ion batteries. Using a series of partial differential equations and algebraic equations, this model accounts for the conservation of lithium and charge in both the electrode and the electrolyte [21]. The model assumes that the active material particles are spherical particles of a single size, and the intercalation and deintercalation of lithium ions occurs on the surface of the active materials. Due to homogenization (or volume averaging), the internal side reactions appear as source terms [22]. Based on this theory, electrode materials and electrolytes in pores can be regarded as uniform flat plate, and a uniform electrode model can be established. The schematic geometry of a single electrode pair is shown in Figure 1.

2.1.1. Conservation of Charge

During the charge–discharge cycle, lithium ions and electrons flow in opposite directions, meeting the charge conservation; that is, the number of lithium ions must be equal to the electron charge transfer. The actual conservation law in the equations is also held locally.
As with the diffusion of Li-ions in the solid phase, the concentration of lithium ions and the conductivity of electrode active material will affect the potential distribution. The charge conservation equation is as follows, which is also a form of Ohm’s law.
x ( σ eff ϕ s x ) = a s Fj Li
where σ eff is the solid-phase effective conductivity, ϕ s is the solid-phase potential, j Li is the current reaction density, a s is the reaction surface area, and F is the Faraday constant of 96 , 485   C / mol . In the location of x = 0 and x = L , the current density equals the external circuit load I / A e .
σ eff ϕ s x | x = 0 = σ eff ϕ s x | x = L = I A e .
Due to the property of the separator that the electrons cannot pass through, the electric intensity of the solid phase at the location of x = L cc , neg + L neg and x = L cc , neg + L neg + L sep is 0. The boundary conditions are shown as follows:
ϕ s x | x = L cc , neg + L neg = ϕ s x | x = L cc , neg + L neg + L sep = 0 .
The charge conservation equation in the electrolyte phase is shown in the following equation.
x ( k eff ϕ e x ) + x ( k D eff lnC e x ) + a s Fj Li = 0 ,
where k D eff is the effective diffusion conductivity of the substance, and the zero gradient boundary condition on the electrode/current collector surface is added.
ϕ e x | x = L cc , neg = ϕ e x | x = L L cc , pos = 0 .

2.1.2. Conservation of Matter

It is assumed that the particle size of solid lithium as electrode active material is the same. The distribution of lithium ions in the electrode is described by Fick’s second law.
( C s ) t = D s r 2 r ( r 2 C s r ) ,
where C s is the lithium ion concentration on the electrode surface, and D s is the diffusion coefficient of solid lithium. There is no material source in the center of the electrode particle, so the boundary condition is defined as follows:
D s C s r | r = 0 = 0 ,   D s C s r | r = r p = j Li ,
where r p is the radius of active substance. The distribution of lithium ions in an electrolyte depends on the diffusion of lithium ions in the electrolyte ( C e ), the porosity of the electrode ( ε e ), and the reaction current density ( j Li ). In the electrolyte phase, the transport of lithium ions is described as follows:
ε e C e t = x ( D e eff C e x ) + a s ( 1 t + 0 ) j Li ,
where F is also the Faraday constant, and t + 0 is the initial migration number of lithium ions. The boundary condition of Equation (9) is set so that lithium ions cannot diffuse through the current collector [23].
C e x | x = L cc , neg = C e x | x = L L cc , pos = 0 .

2.1.3. Electrochemical Reaction Kinetics

The lithium ions concentration and charge distribution in the electrode and electrolyte phase are described by Equations (1) to (9) and coupled by the Butler–Volmer equation.
j Li = a s i 0 [ exp ( α a F RT η ) exp ( α c F RT η ) ] ,
where i 0 is the exchange current density ( A / cm 2 ), α a and α c are the transfer coefficients of positive and negative poles, R is the general gas constant, and a s is the surface area of the two-phase reaction, which is the surface area between the solid active material and the liquid electrolyte. The surface area can be calculated by treating the solid phase as a collection of uniform spheres, as shown in the following equation:
a s = N p ( 4 π r p 2 ) ,
where N p is the number of solid particles per unit volume, and ε s is the volume fraction of the active material, as shown in the following equation:
ε s = N p ( 4 / 3 π r p 3 ) ,
combining these two equations. The calculation of reaction surface area is as follows.
a s = 3 ε s r p = ( 1 ε e ε f ) r p ,
where ε f is the volume fraction of the filling material. The exchange current density i 0 is a function of temperature and SOC, expressed as Equation (14).
i 0 = k i ( C e ) α a ( C surf , max C surf , e ) α a ( C surf , e ) α c ,
where k i is the reaction rate, which is related to the temperature. α is a dimensionless parameter, which defines the ratio between oxidation and reduction, and is called the symmetry factor. Overpotential ( η ) is the difference between the open circuit voltage (OCV) and the positive and negative operating voltage. The potential of positive and negative electrodes is a function of local lithium concentration, which is defined by an empirical formula, as shown in the following equation:
η = ϕ s ϕ e U ref .

2.2. Basic Thermal Model

Due to the entropy change during discharge, there are three main heat sources in lithium-ion batteries [24,25], including reaction heat caused by the entropy change during discharge ( Q rea ), the ohmic heat caused by the ohmic potential drop ( Q ohm ), and the active polarization heat ( Q act ) caused by the electrochemical reaction polarization between electrolytes [26,27].
The generated reaction heat is calculated by the following equation:
Q rea = Fa s j Li T U T .
The ohmic heat generated is calculated by the following equation:
Q   ohm = | σ eff ( ϕ s x ) 2 + k e f f ( ϕ e x ) 2 + 2 k e f f RT F ( t + 1 ) [ 1 + lnf ln c e ] ( ln c e ) x ϕ e x .
The active polarization heat generated between electrolytes is calculated by the following equation:
Q act = Fa s j Li ( ϕ s ϕ e U ) .
The energy conservation formula of a lithium-ion battery is shown as follows:
ρ C p T t = λ 2 T x 2 + Q rea + Q ohm + Q act .
where ρ and C p represent the density and the heat capacity separately. Newton’s cooling law was adopted to set the boundary conditions of the thermal model of lithium-ion batteries [28].
λ ( T x ) = h ( T amb T ) ,
where, T is the surface temperature of the battery, T amb is the ambient temperature,   λ is the thermal conductivity of the battery shell, and h is the convective heat transfer coefficient of the battery which is related to the current environment.

2.3. An Electrochemical–Thermal Flow Coupling Model

A three-dimensional simulation of air-cooled cylindrical 18650 lithium-ion batteries was carried out. A one-dimensional cell model was used to simulate the chemical properties of the cell, while a three-dimensional model was used to simulate the temperature of the cell. These two models were formed by coupling the generated heat source and the average temperature. Irreversible heat generated in the electrochemical model of lithium-ion battery reacted to the temperature field distribution inside the battery, and the temperature field distribution inside the battery influenced the open circuit potential in the electrochemical model of lithium-ion battery [29,30]. After coupling related parameters, the open circuit potential ( E OCV ) was corrected as follows:
E OCV = E OCV , ref + E OCV T ( T sol T amb ) ,
where E OCV , ref is the reference value of open circuit voltage, E OCV / T is the entropy change coefficient, and T sol is the temperature solved by the solid thermal model.
The thermal model also includes the flow of cooling fluid in the flow chamber around the battery. Assuming that the flow properties do not change with temperature, but the fluid flow can affect the heat transfer rate, the coupling of the electrochemical heat flow model is realized by transferring related parameters. The ‘fluid flow’ multi-physical field node is used to fully couple the flow, heat, and battery electrochemistry.

3. Model Parameters and Experimental Verification

3.1. Lithium-Ion Battery Model Parameters

The Panasonic NCR18650PF power battery was selected as the research object, Li [ NiCoAl ] O 2 (NCA) was the positive electrode of the battery, graphite was the negative electrode of the battery as shown in Figure 2, and the electrolyte LiPF 6 was in the EC:EMC (3:7) solution. During the charging and discharging process, lithium ions intercalated and deintercalated back and forth between the anode and the cathode inside the NCA lithium-ion battery.
The basic parameters of the lithium battery in this study are shown in Table 1, and the main electrochemical and thermodynamic parameters of the battery model are shown in Table 2. The parameters in Table 1 are derived from battery measured values. The parameters in Table 2 are from the COMSOL built-in materials library [31,32,33,34,35] and references [23,36].

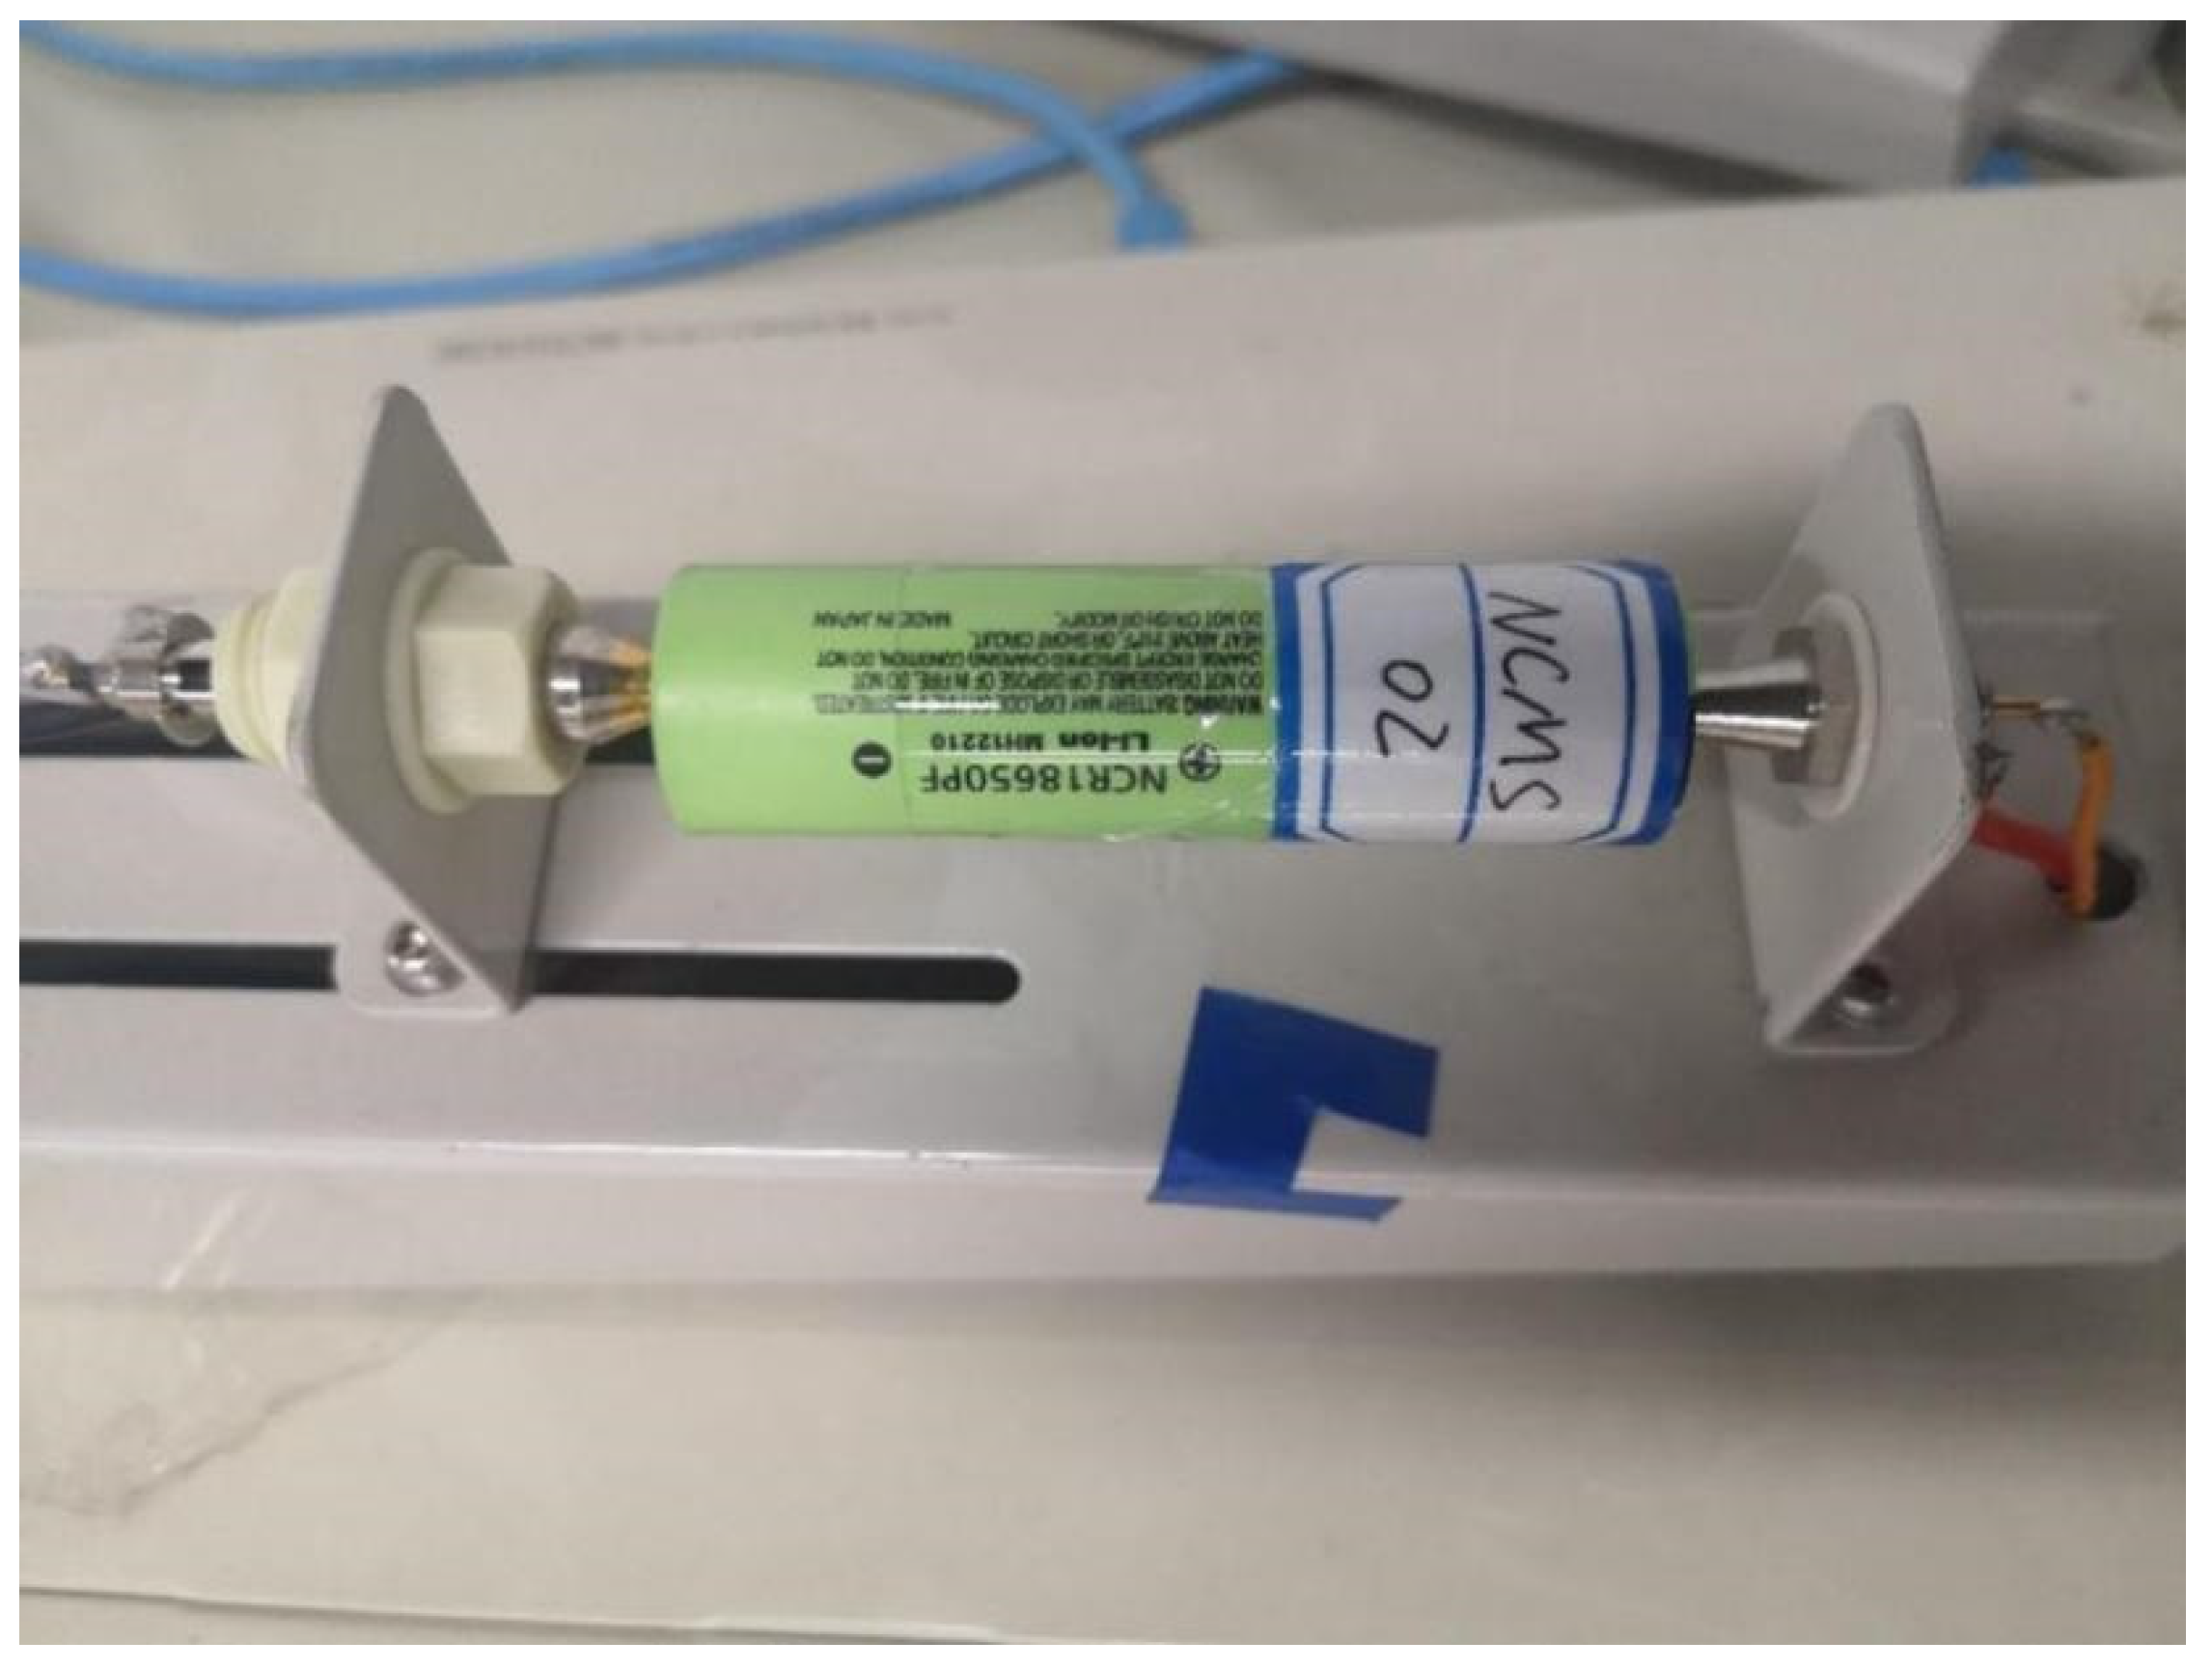
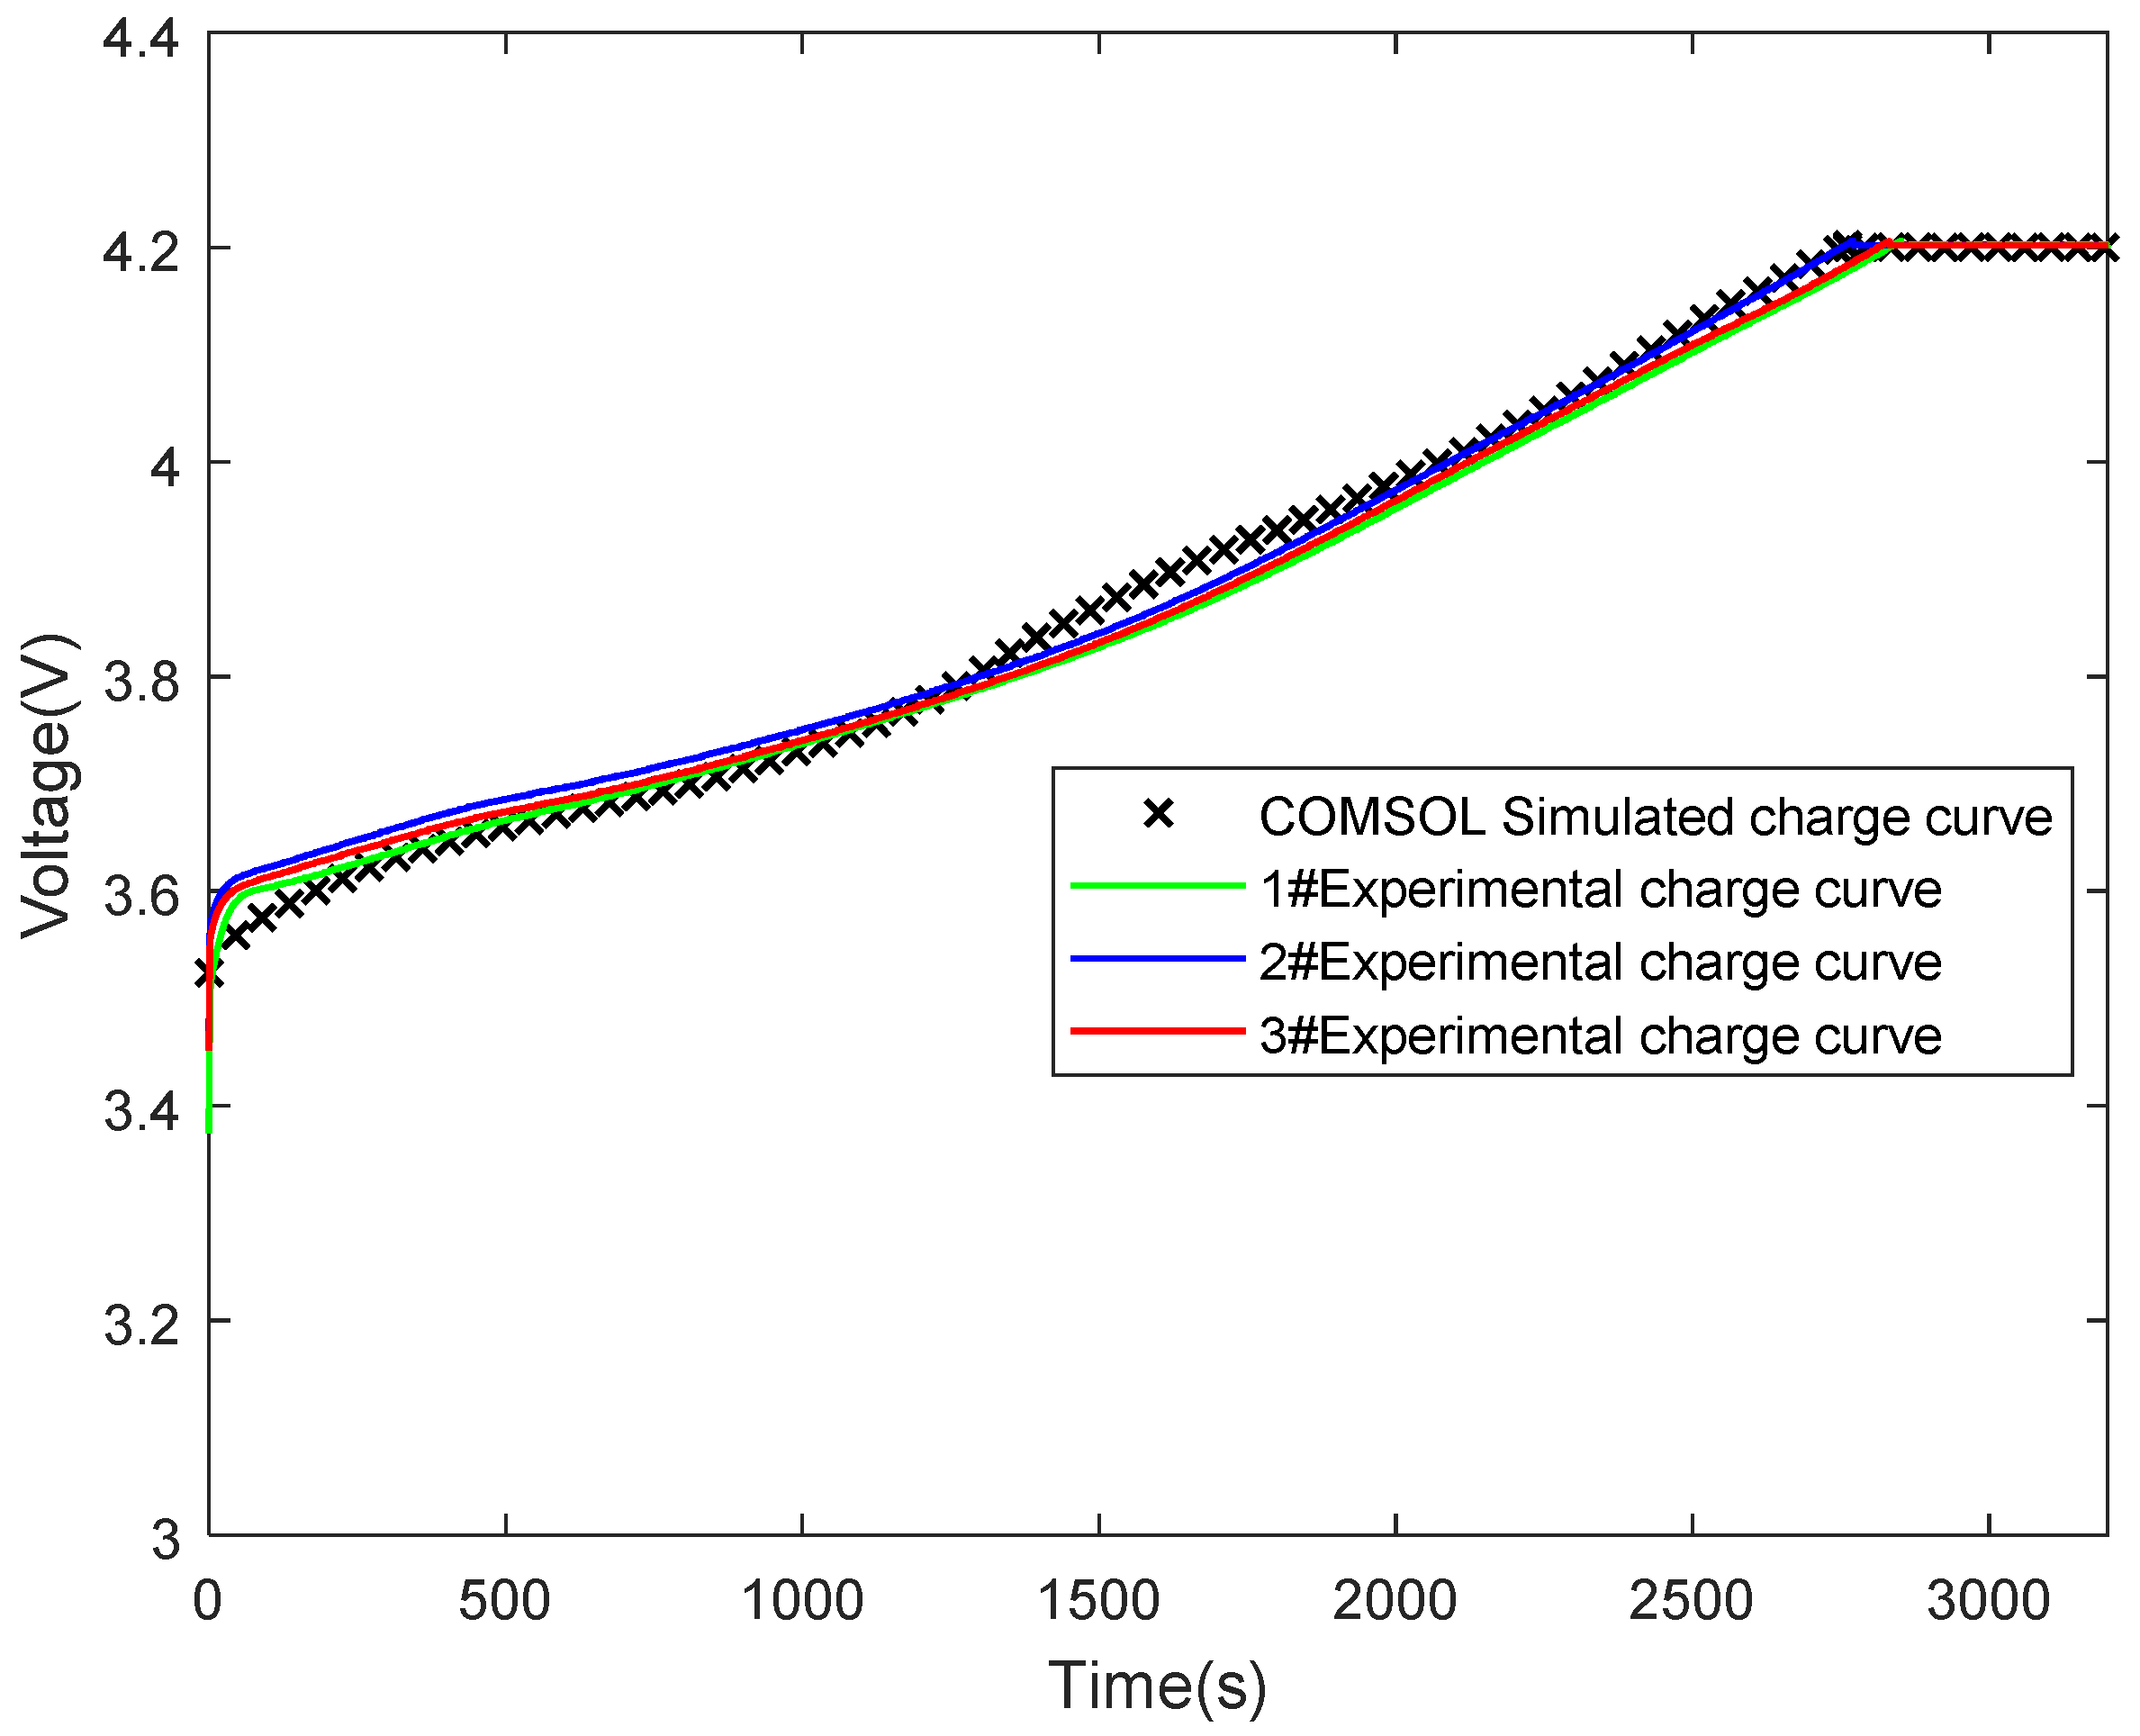
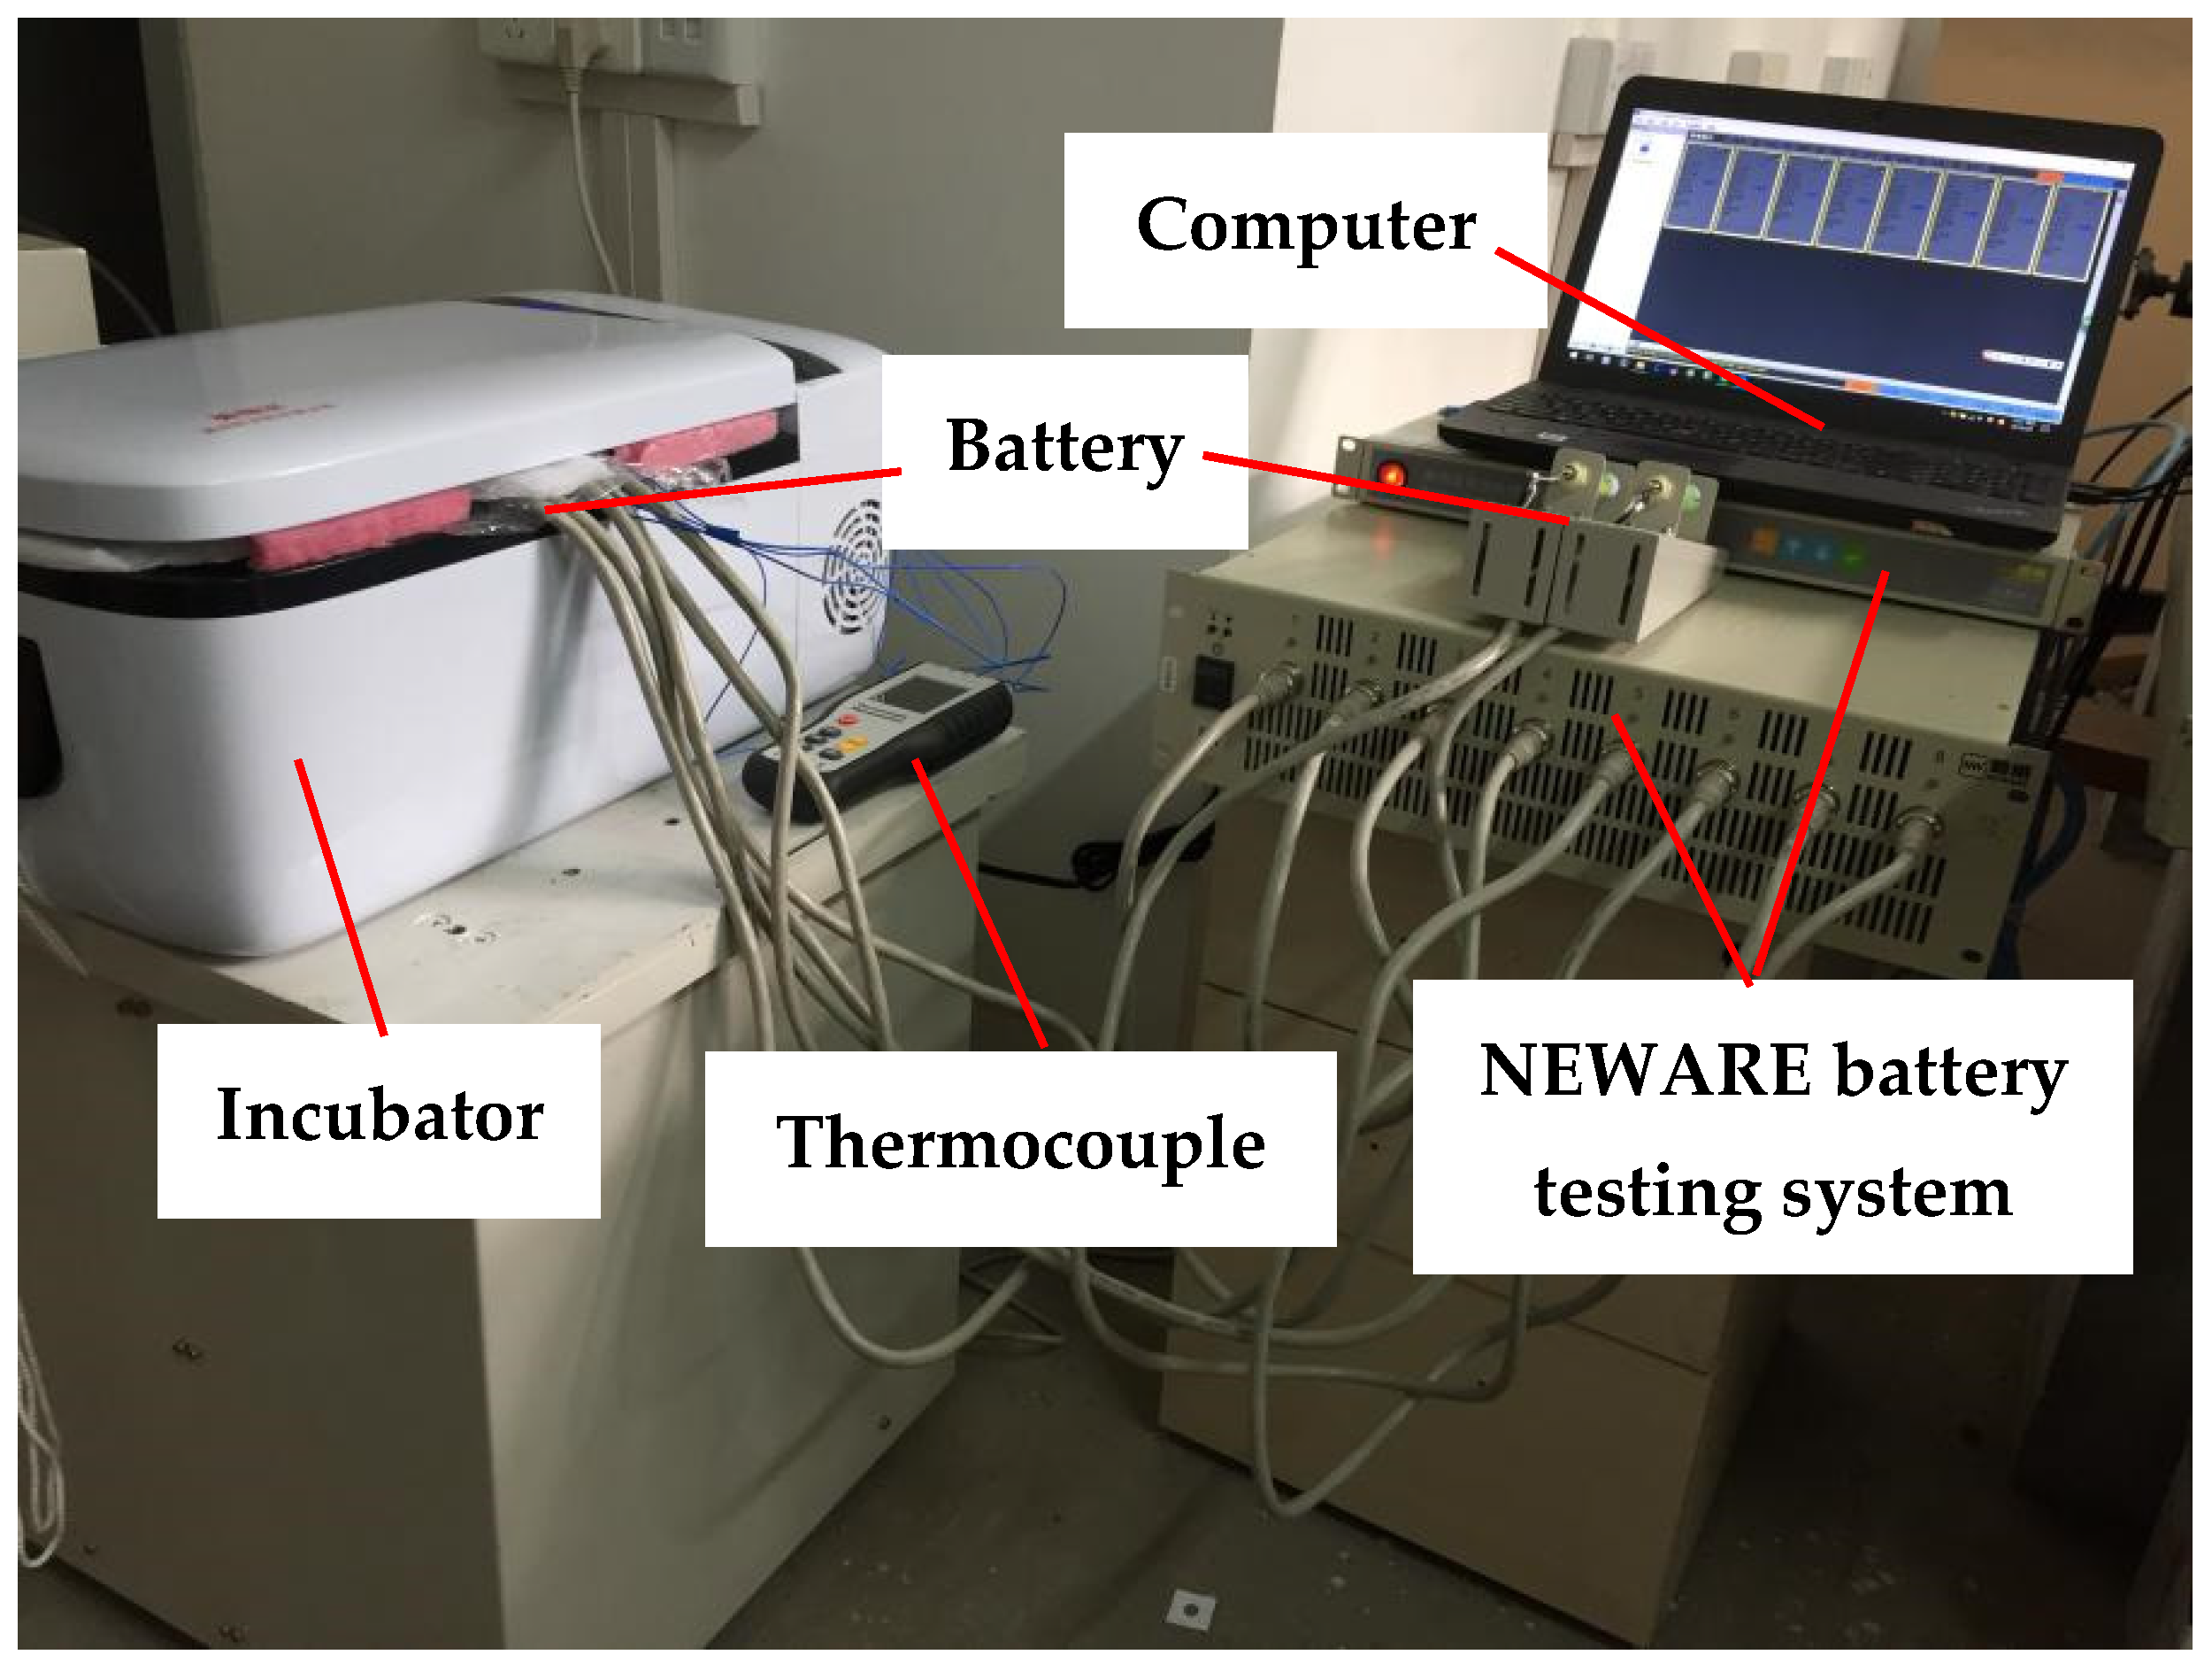
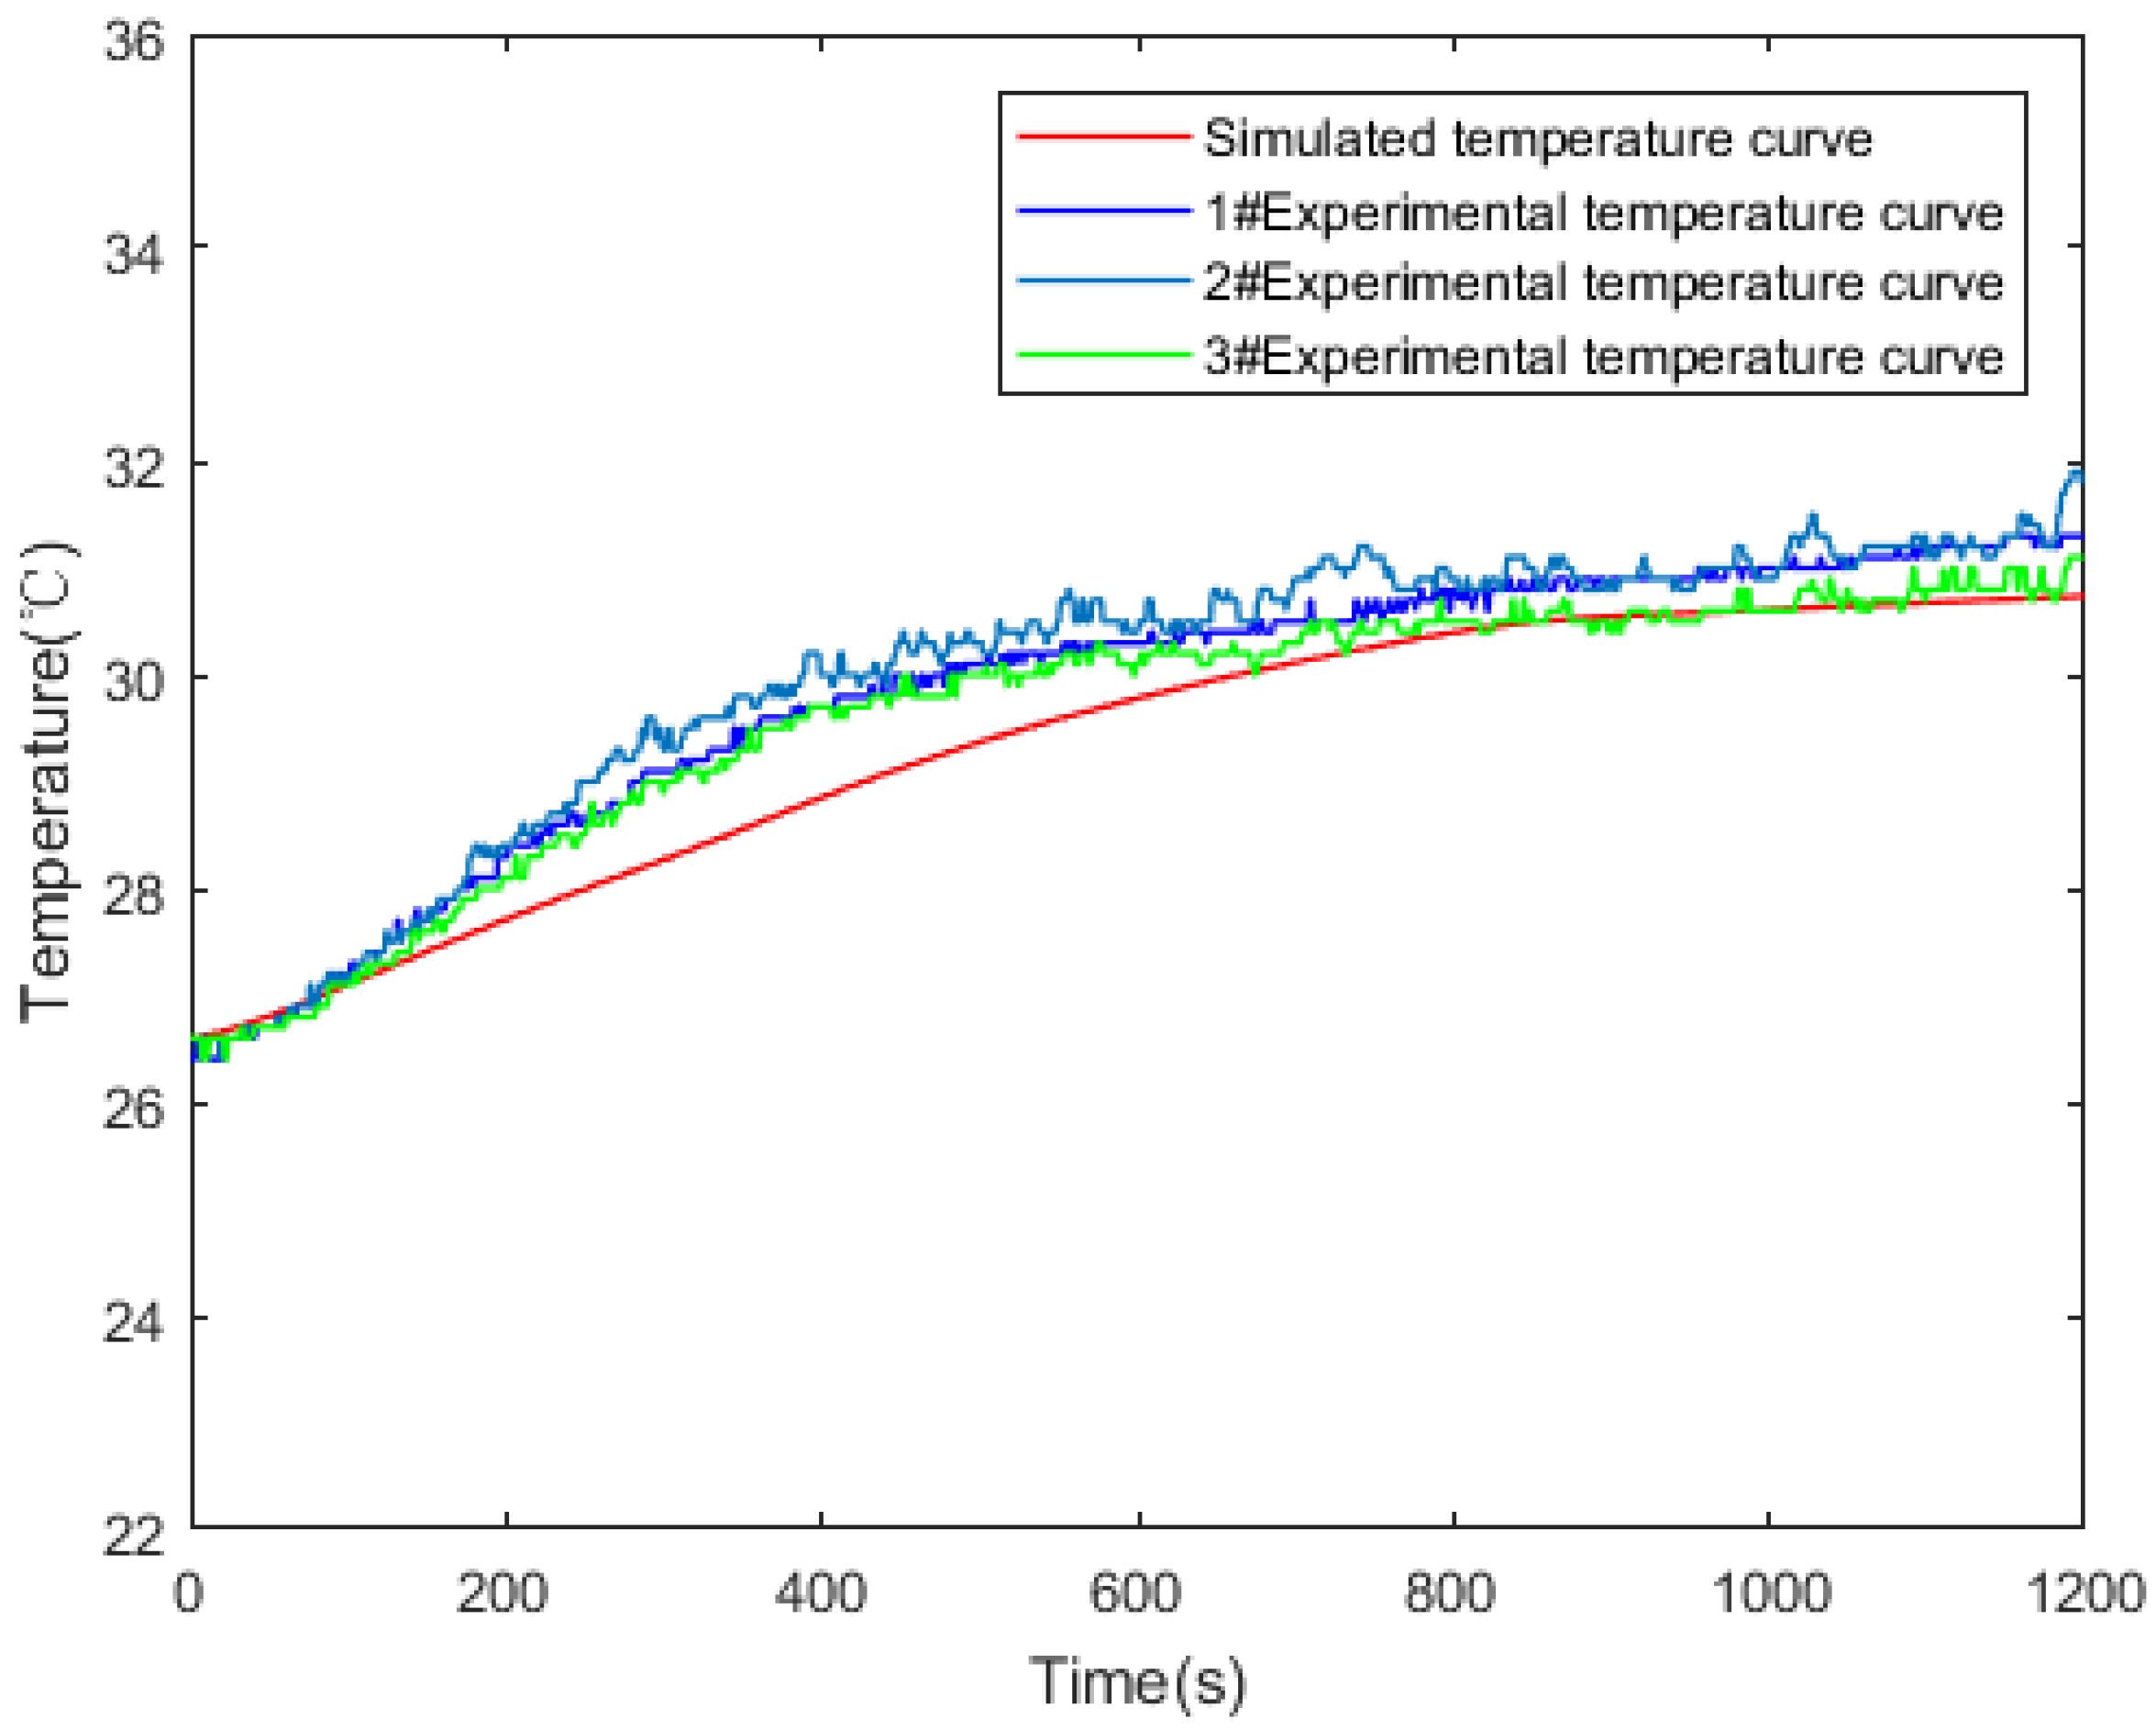
3.2. Experimental Verification of Model Validity

As shown in Figure 2, the model test battery adopted three groups of the same lithium-ion batteries, which were charged with constant current and constant voltage to a cutoff voltage of 4.2 V at a room temperature of 20 °C using the NEWARE power battery testing platform BTS4000, waiting for 120 min, and then discharging the lithium-ion batteries to the cutoff voltage of 2.5 V with a 1 C discharge rate. The COMSOL battery condition is consistent with the experimental battery. The comparison of simulated and measured battery voltage curves during constant current charge is shown in Figure 3.
At the same time, the surface temperature of the battery was measured. The experimental device is shown in Figure 4, including a constant temperature experimental chamber and a temperature tester. The temperature was set at 26 ℃, and the constant current charge was 1200 s at 2 C rate. The comparison of simulated and measured battery temperate curves is shown in Figure 5.
As shown in Figure 3 and Figure 5, the curves of experimental and simulation results are basically consistent. The average voltage error between simulation and measurement was less than 0.1 V. The average temperature error between simulation and measurement was within 5%. There were some differences between the experimental and the simulation data. The main reason is that the experimental process is affected by the environment and measuring instruments, and the error was caused by the inaccurate measurement of battery parameters. However, the error was within an acceptable range, which can verify the effectiveness of the simulation model [37,38].

4. Simulation Results and Analysis

4.1. Results and Analysis of Battery Heat Generation Behavior

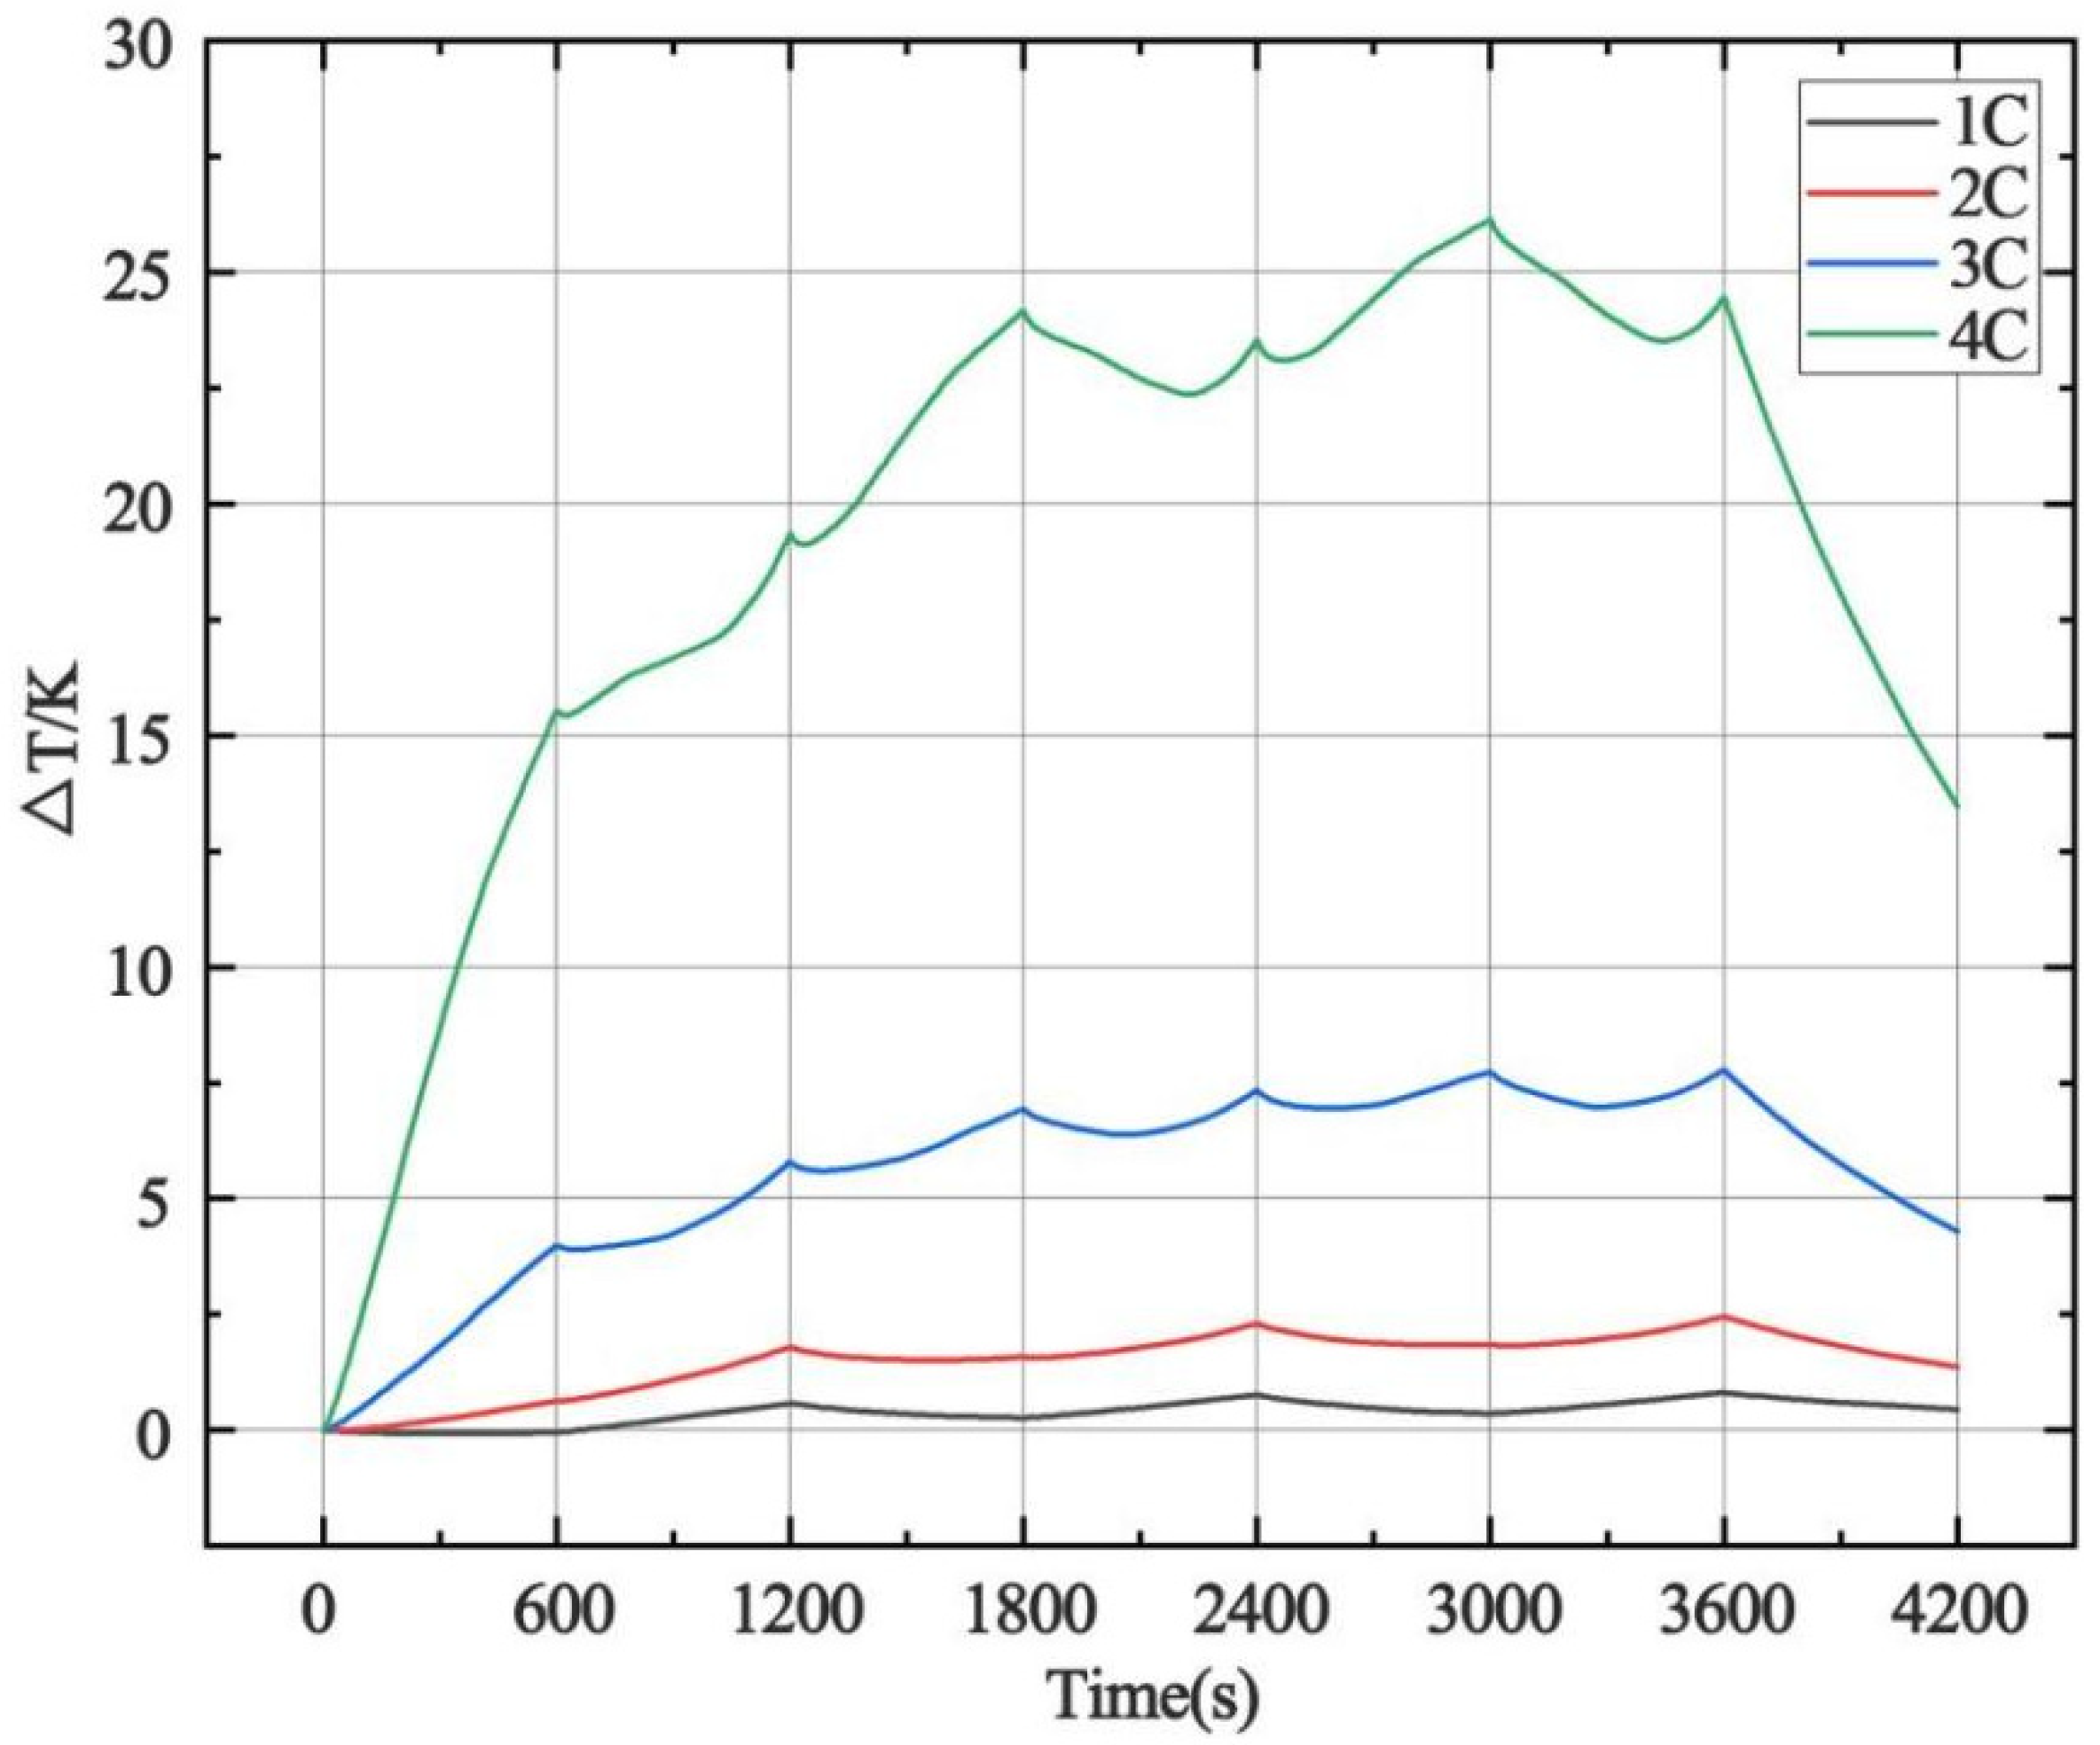
4.1.1. Effect of Charge–Discharge Rate on Heat Generation of Battery

The heat generation of the battery was simulated at the charge–discharge rates of 0.5, 1, 2, and 4 C, and the temperature change inside the battery was studied. When the initial ambient temperature was set at 25 °C and the airflow velocity of 0.1 m/s, the initial battery was 10% SOC, which was continuously charged and discharged three times in 600 s, totaling 3600 s. The charge and discharge rate and battery voltage of the battery are shown in Figure 6. This section mainly compares the effects of different charge–discharge rates on temperature. The corresponding conclusions can be obtained from the incomplete charge and discharge simulation of the battery, which is also more in line with the actual situation that the battery will not be fully charged and discharged during use. According to the simulated data, the maximum and average temperature rise of the battery are shown in Figure 7.
From the simulation results, the influence of different charge–discharge rates on the battery temperature is very obvious. It can be seen from Figure 7 that the temperature rise of the battery was relatively low when charging and discharging at low rates of 0.5 C and 1 C, and the average temperature rise was only about 2.5 K. Under the condition of the high rate of 2 and 4 C discharge, the temperature rise of the battery was obvious, and the highest average temperature rise was about 26.8 K, which is more than 10 times that of the low rate. Therefore, the change in charge–discharge rate has a non-linear effect on temperature rise, and the high rate of charge–discharge has a greater impact on battery temperature.
The average temperature was calculated using the finite element method. The partial differential equation was discretized to construct the approximate equation, and the approximate solution of the real solution was obtained. At the same time, the maximum temperature rise rate of the battery under 1 C was only 1.05 × 10 3   K / s , but the rate under 4 C could reach 25.92 × 10 3   K / s . When charging at 4 C, the temperature of the battery rose about 15.5 K within 600 s, and the heating rate of high-rate charging and discharging also accelerated. Figure 8 shows the external flow field distribution and internal temperature distribution of the battery. It can be seen that the internal temperature distribution was uneven, and it was similar at different rates. The lowest temperature of the battery appeared on the surface and near the air inlet. The highest internal temperature of the battery appeared near the battery core and near the negative electrode of the battery. With the increase in the discharge rate, both the minimum and maximum temperatures of the battery increased.

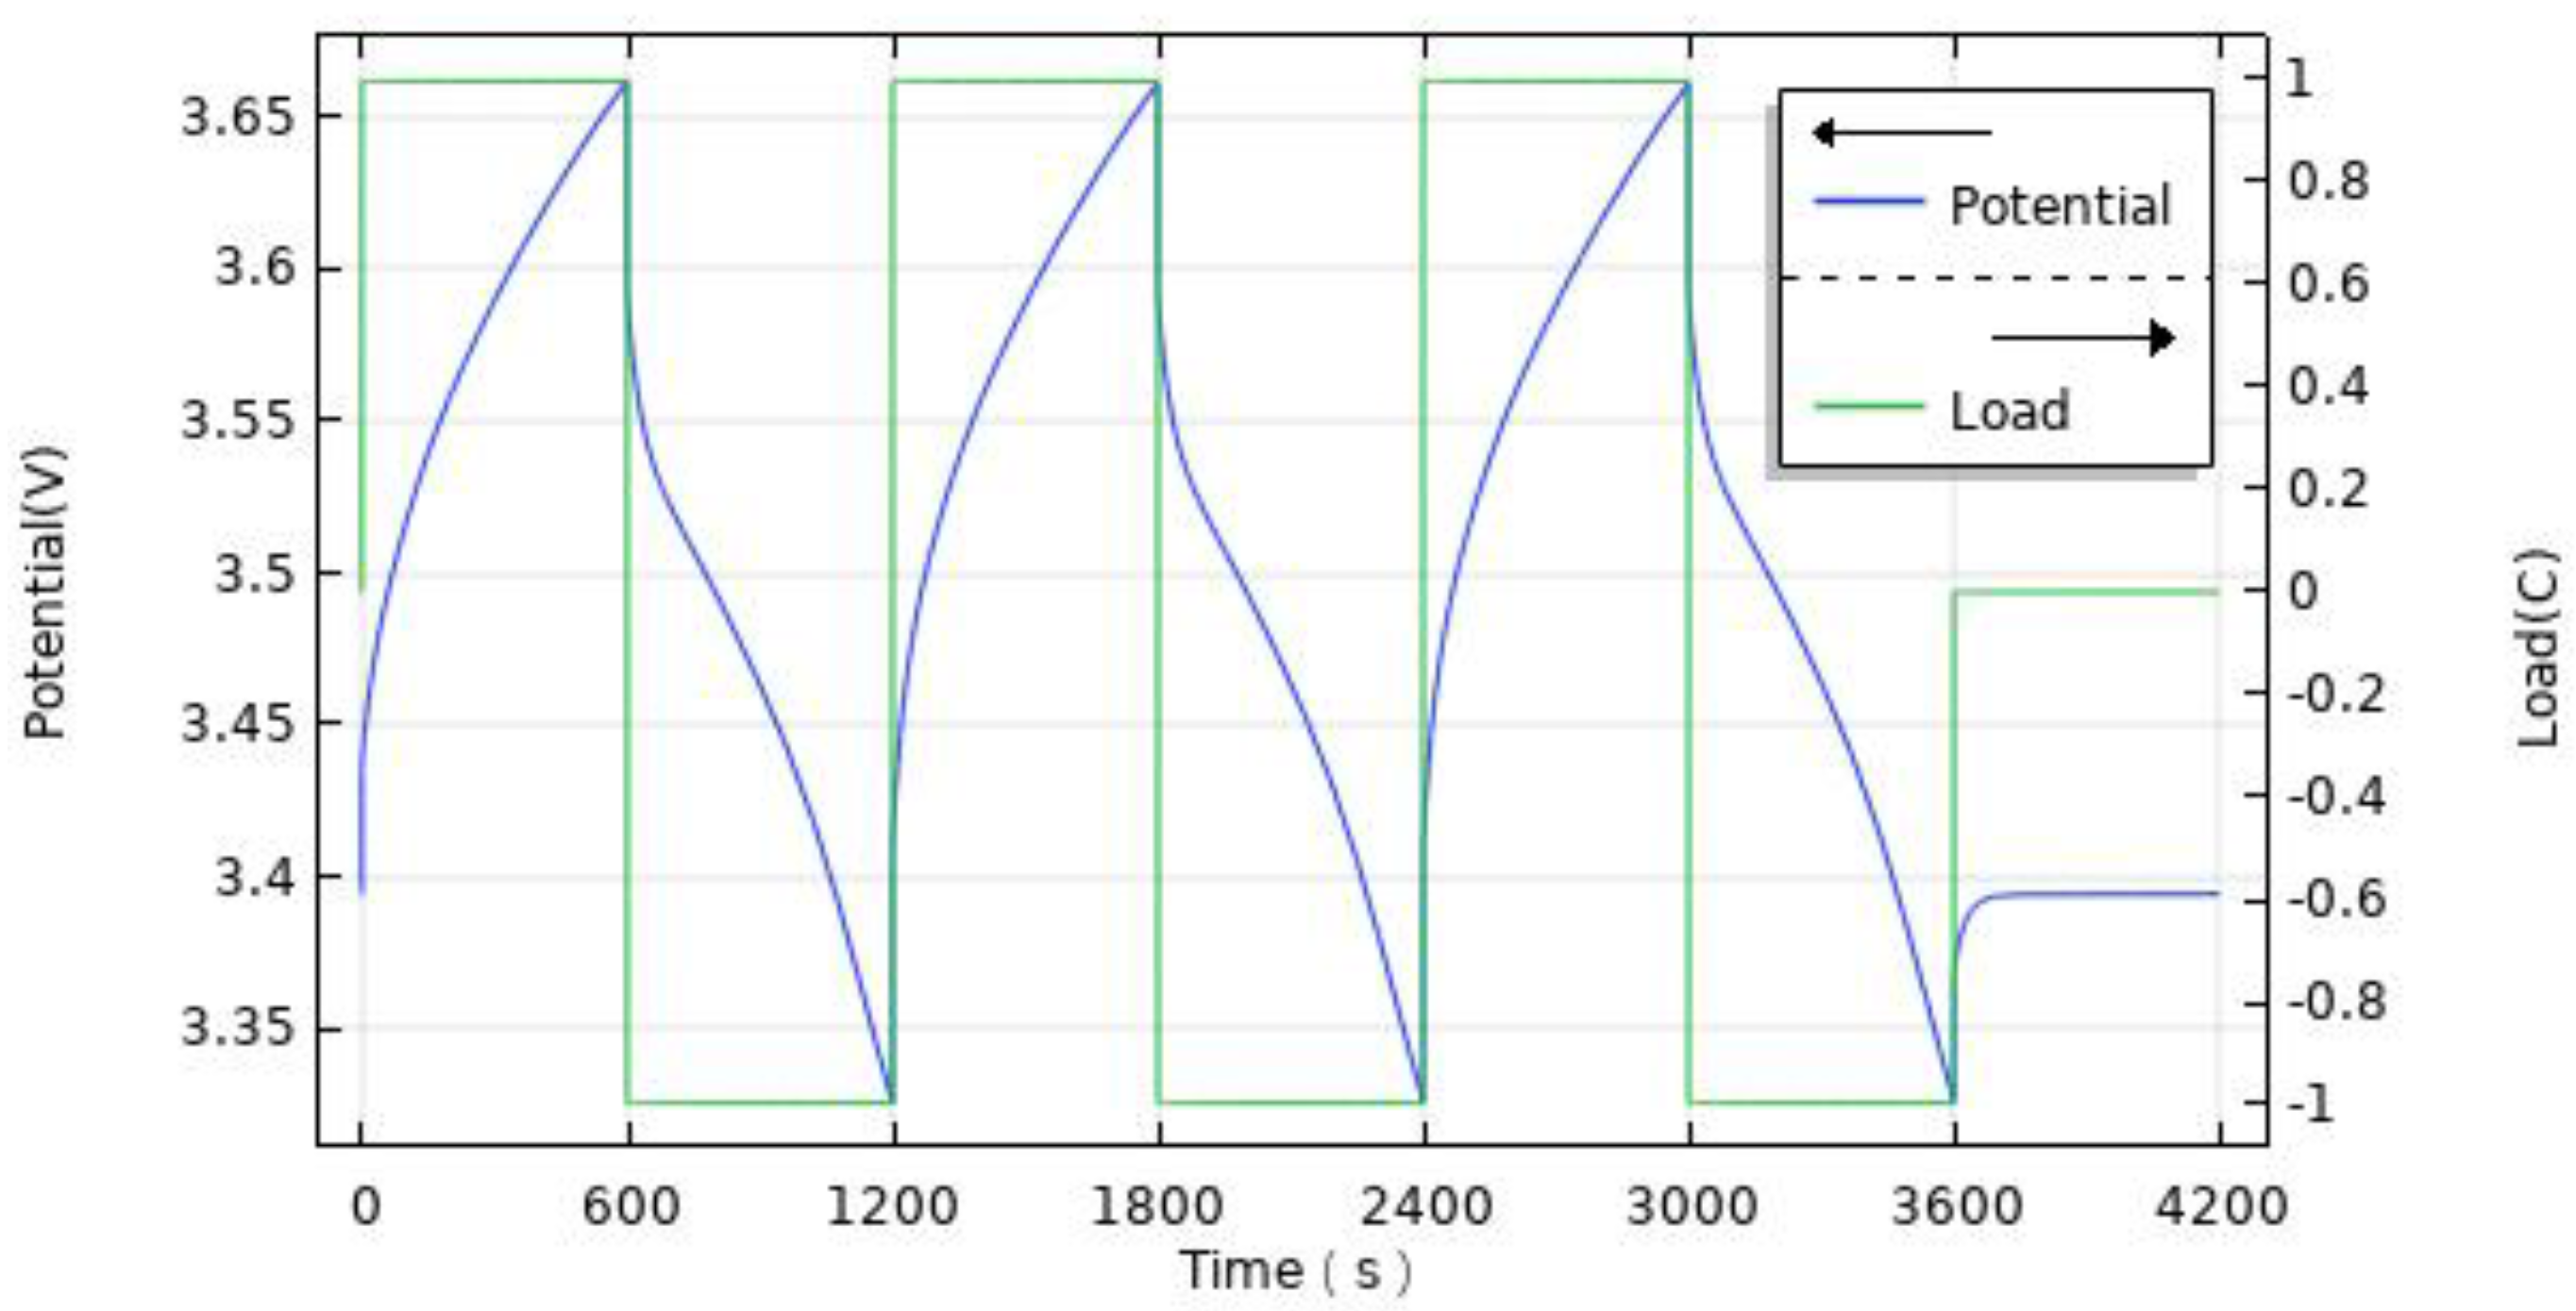
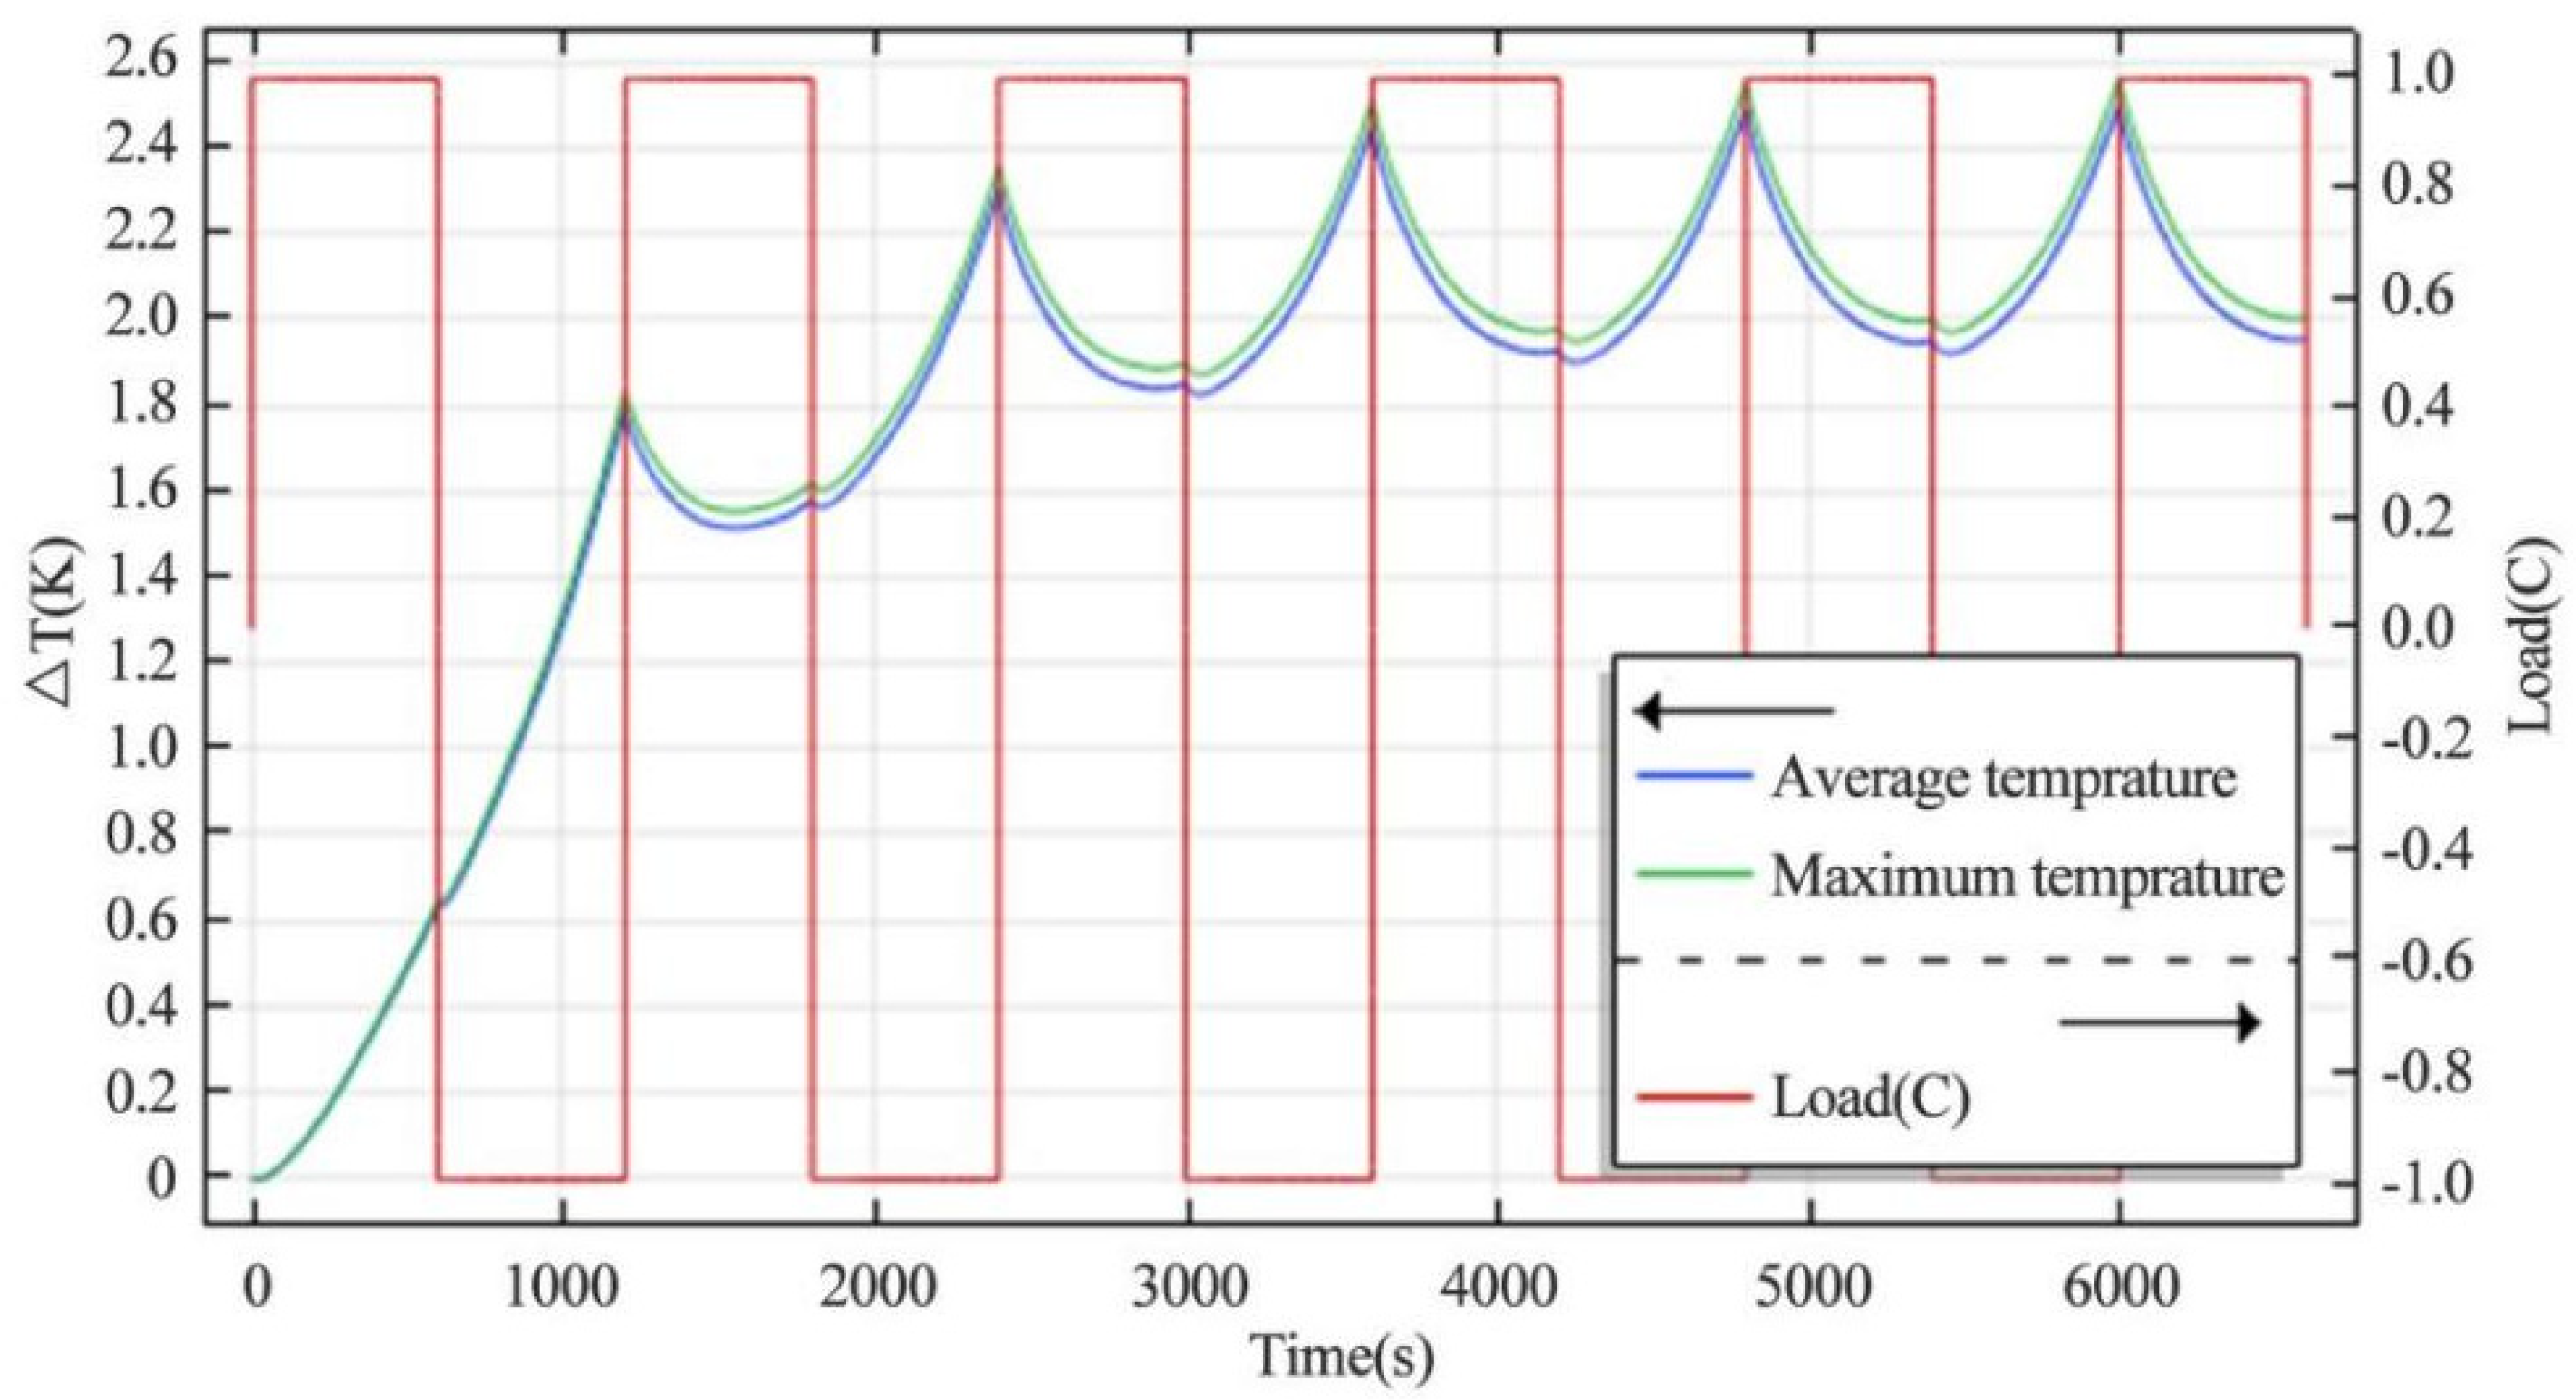
4.1.2. Heating Rate of Continuous Charge–Discharge Cycles

Power batteries are often faced with continuous charge–discharge cycles. The number of cycles is increased to explore the effect of the number of continuous charge–discharge cycles on the battery temperature. The battery was charged at 600 s and discharged at a rate of 1 C five times, as shown in Figure 9.
It can be seen from Figure 9 that the temperature rise of the battery was the highest and the temperature rise rate was also the highest during the first charging and discharging cycle. At the end of the battery charge–discharge cycle, the temperature reached the local maximum. At the beginning of the next cycle discharge, the internal heat generation of the battery was less than the external heat dissipation, and so the average temperature of the battery decreased briefly. Then, the heating rate of the battery increased, and the temperature continued to rise. After about three charging and discharging cycles, the temperature rise of the battery was not obvious. This is because the heat exchange between the battery and the outside was basically stable, the heating rate was equal to the heat dissipation rate, and the temperature rise of the battery was very small. When the battery is continuously charged and discharged, the temperature can also be controlled in a safe range.

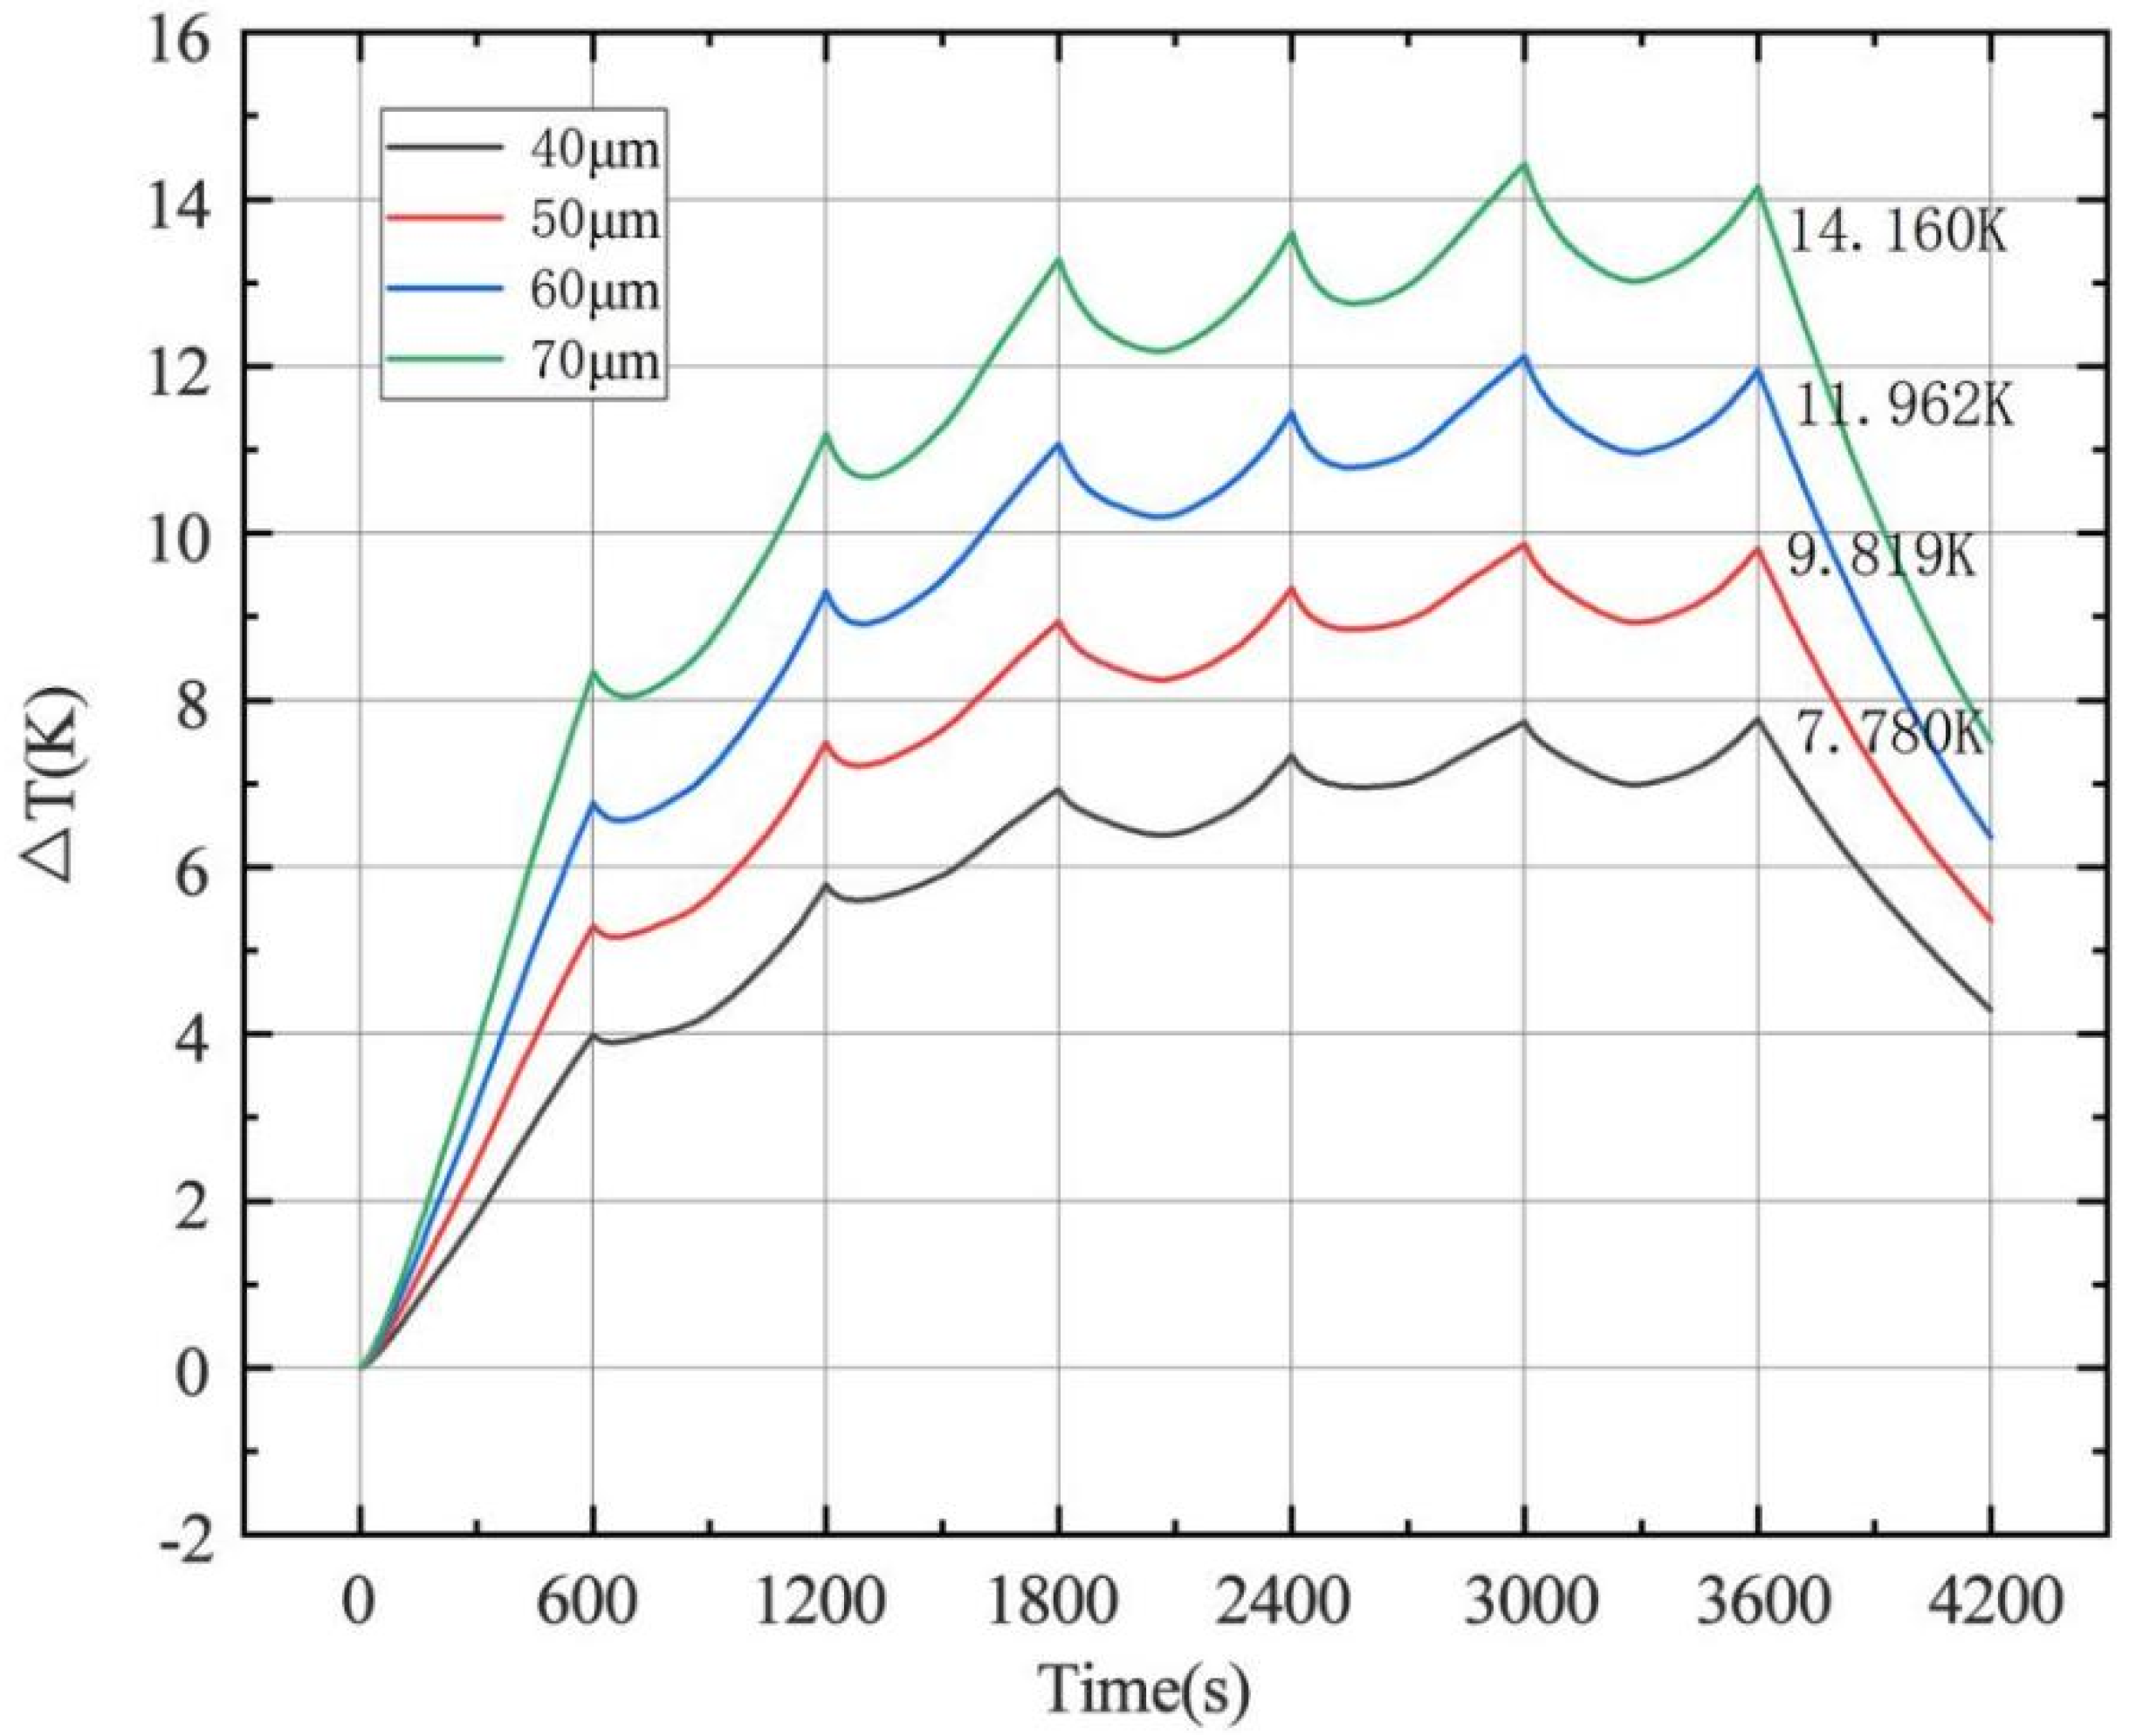
4.1.3. Effect of Electrode Thickness on Temperature

The thickness of the electrode has a great influence on the thermal performance and the energy density of the battery. The thicker the electrode, the more active substances it can carry and the larger the battery capacity. It is necessary to control the electrode thickness at a reasonable range. The capacity of the lithium-ion battery can be determined by Equation (22).
Q C = LA e C s , max ε s Δ xF ,
where L is the electrode thickness, A e is the electrode area, F is the Faraday constant, ε s is the active substance volume fraction, C s , max is the electrode maximum embedded lithium-ion concentration, and Δ x is the positive and negative lithium-ion concentration variation range [30].
According to the modeling parameters and Equation (22), the capacity of the battery per unit area is calculated in Table 3. N/P is the ratio of the capacity of the negative electrode and the positive electrode per unit area of the battery. When the N/P ratio of the battery was ensured, the thickness of the positive electrode of the battery increased from 40   μ m to 70   μ m , and the capacity per unit area of the battery changed from 16.21   Ah / m 2 to 28.367   Ah / m 2 . The thickness of the negative electrode increased proportionally to the thickness of the positive electrode. At the rate of 2 C (the default working condition of this study), the influence of different electrode thicknesses on the battery temperature was studied, as shown in Figure 10.
The thickness of the positive electrode of the battery increased from 40 to 70 μm, and the average temperature rise increased from 7.78 to 14.16 K. At the same rate, the greater the thickness of the battery electrode, the higher the temperature rise of the battery, and the relationship between them is linear. With the increase in the thickness of the positive electrode, the temperature rise of the battery increased by about 2.1 K. Although the increase in electrode thickness will increase the capacity of the battery, it will also increase the specific resistance, which is the resistivity, increase the charge transfer and contact resistance, and increase the temperature rise of the battery.

4.2. Results and Analysis of Battery Heat Dissipation Behavior

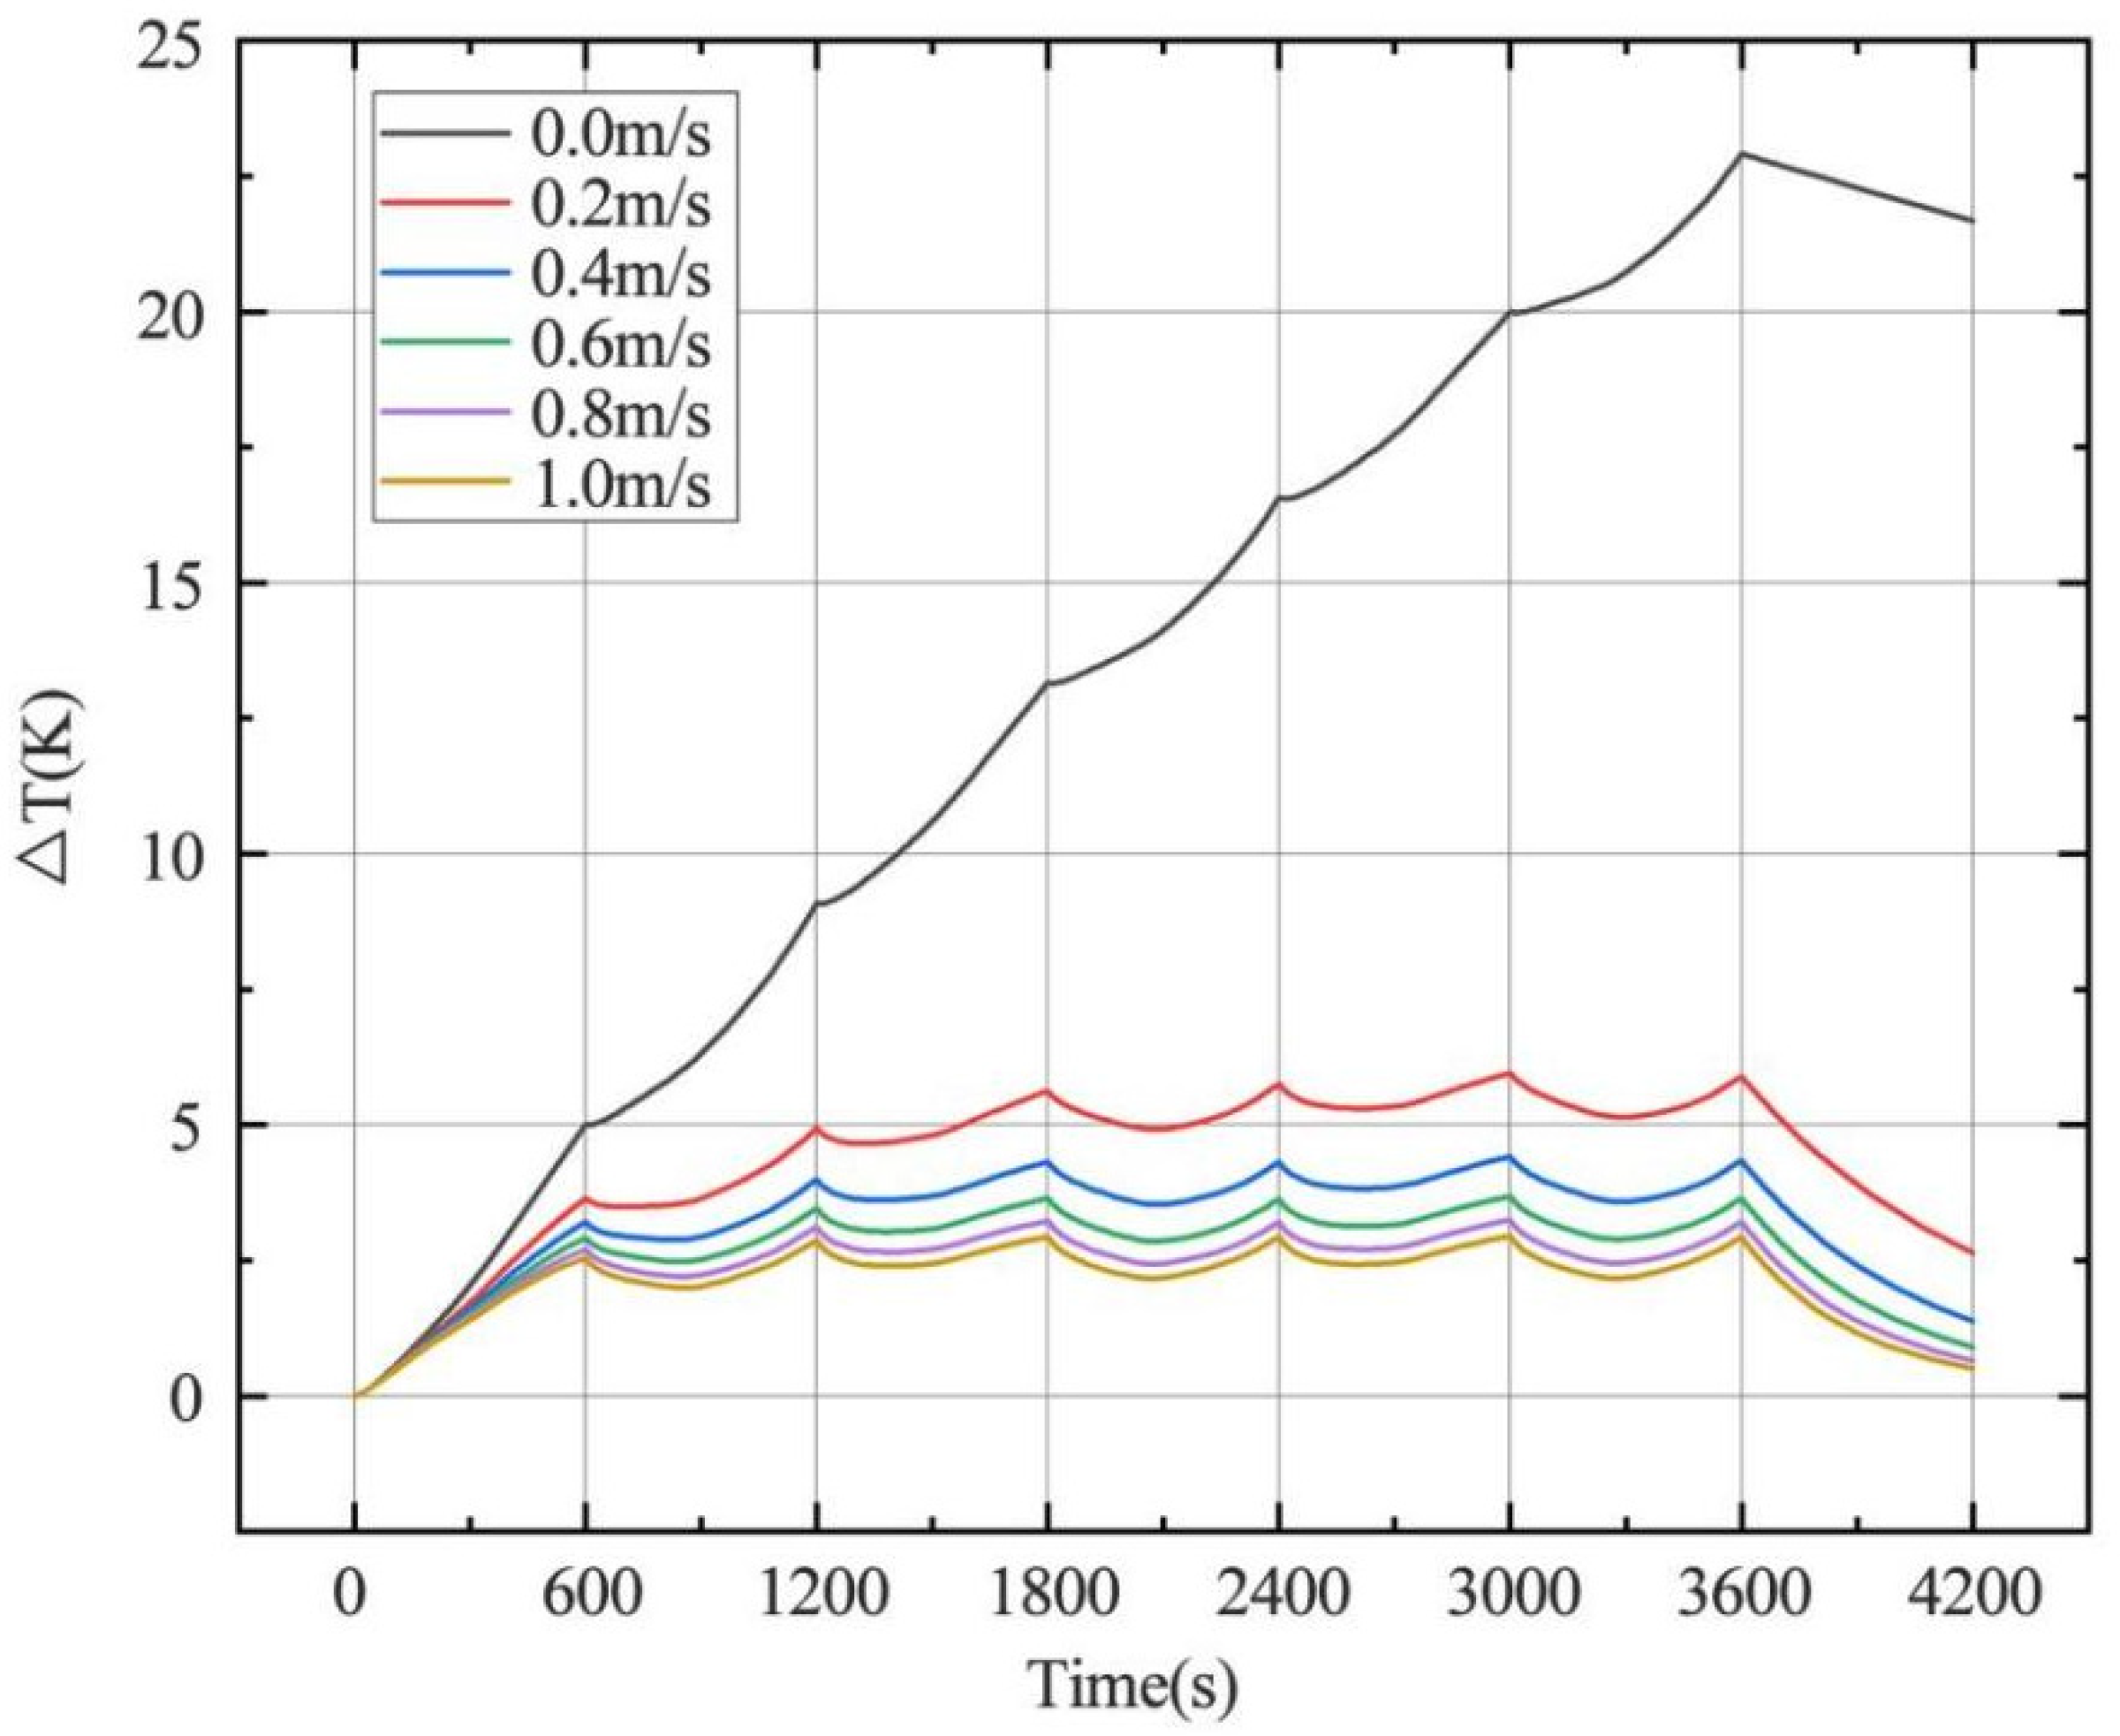
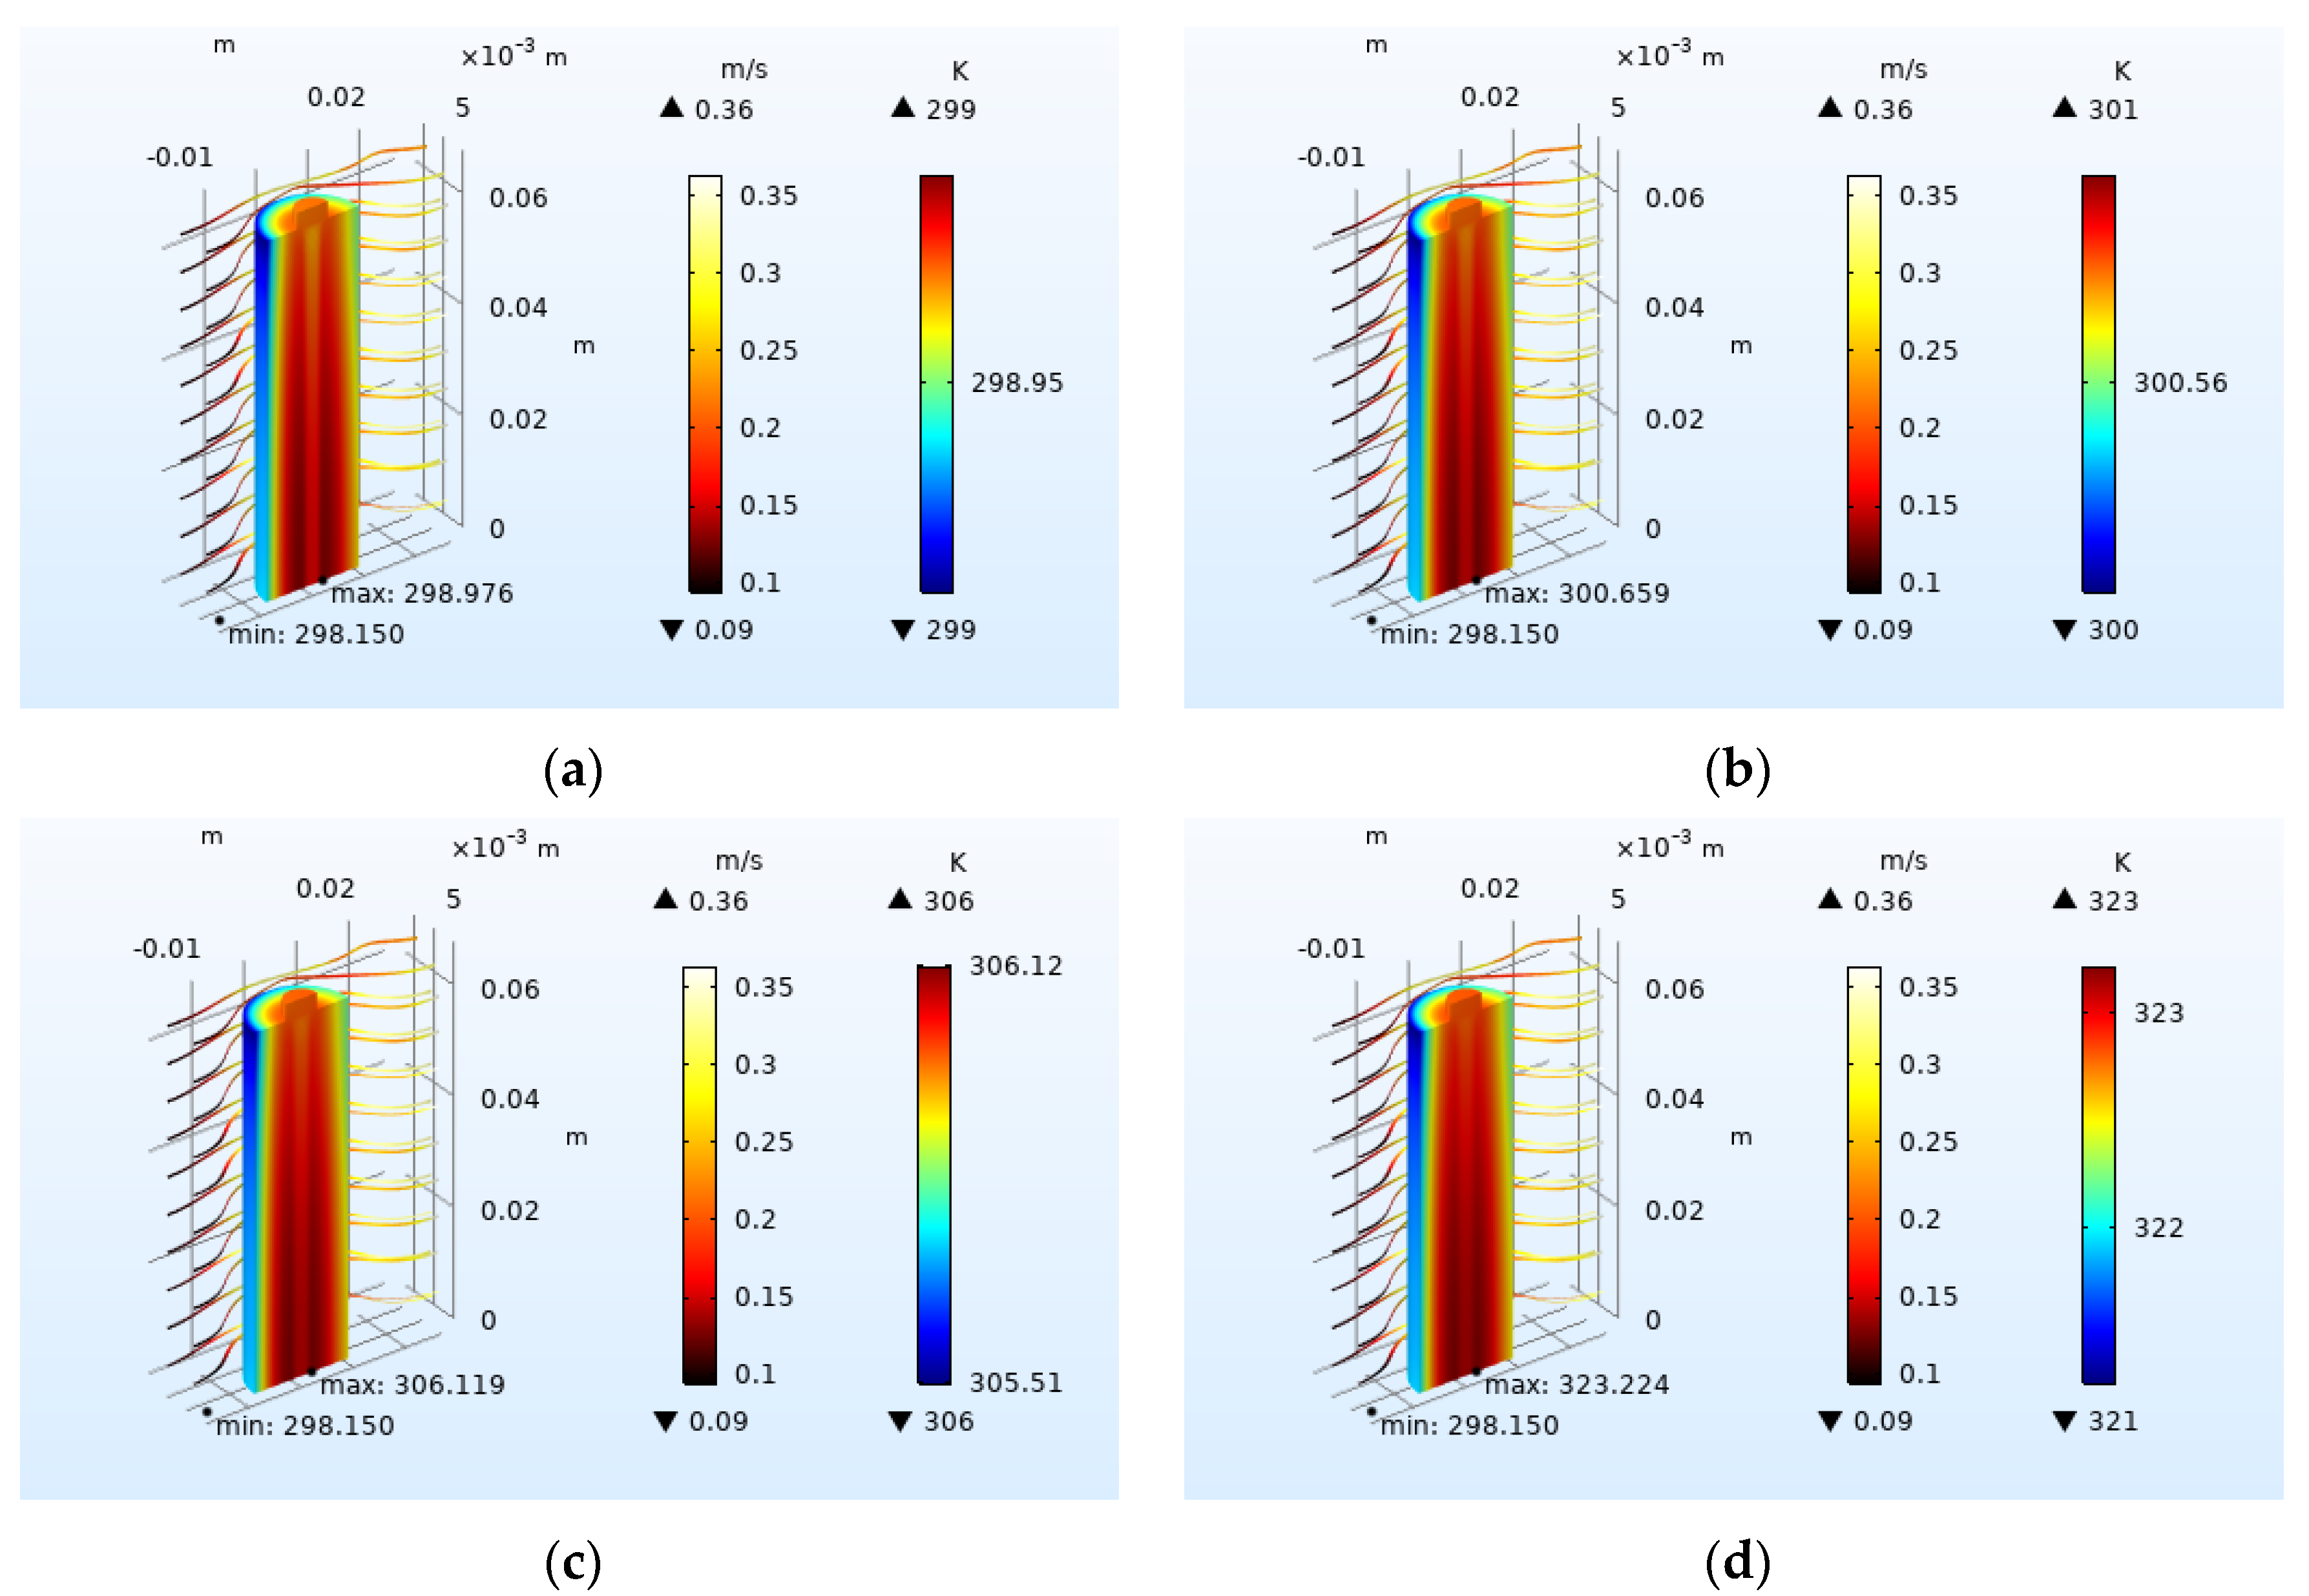
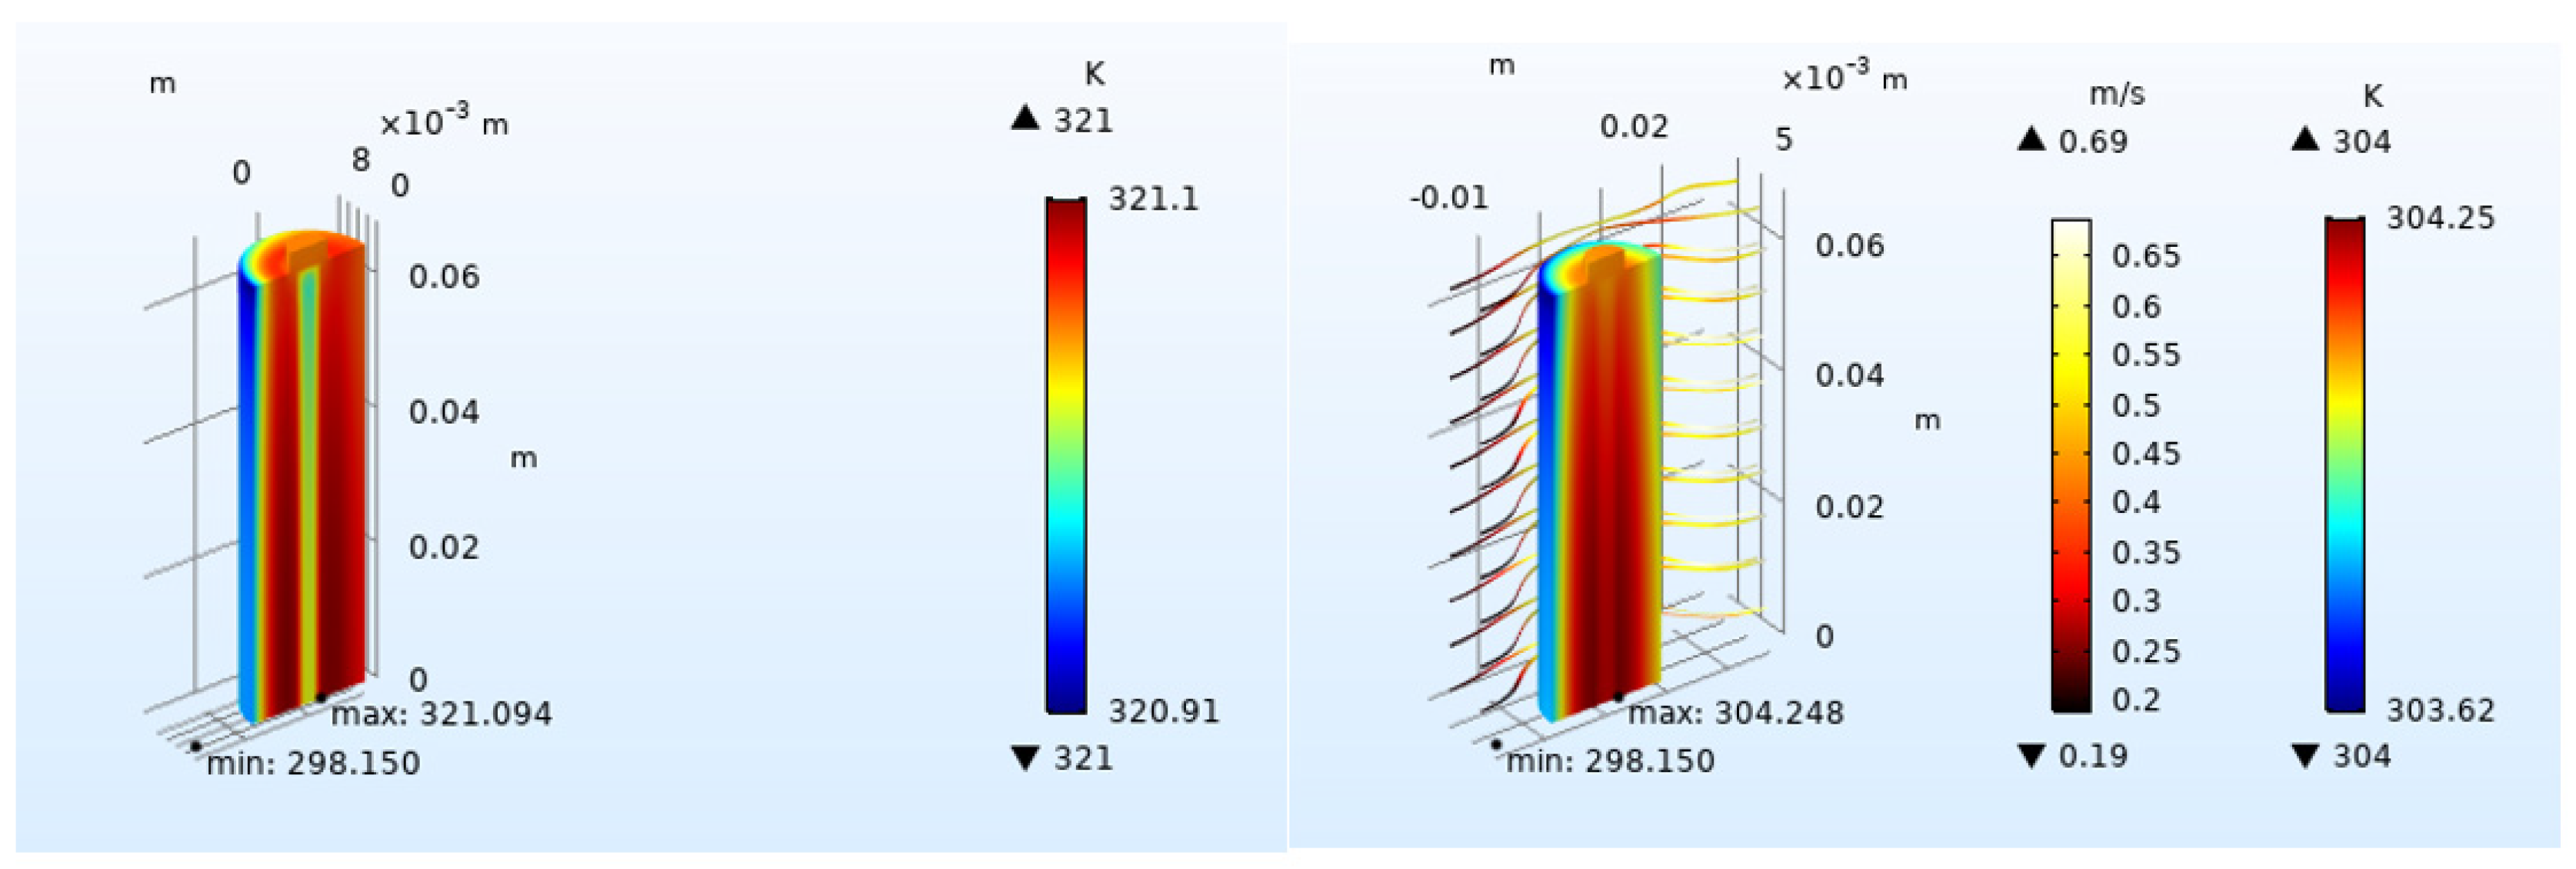
4.2.1. Effect of Inlet Airflow Velocity on Battery Heat Dissipation

In the process of working, batteries need to dissipate heat, and heat is eliminated outside through various cooling measures, such as air cooling, liquid cooling, PCM phase change material cooling, and other new cooling methods [39,40]. Among them, air cooling achieves the purpose of cooling by accelerating the airflow around the battery and improving the heat exchange rate between the battery and the outside. It is widely used because of its simplicity, convenience, and low cost. As shown in Figure 11, under the heat dissipation condition of the 0.2 m/s airflow rate, the maximum temperature rise of the battery was reduced by 16.85 K compared with the battery without cooling measures.
Gas inlet flow velocity has an important influence on battery heat dissipation. Setting the inlet flow velocity from 0.2 to 1.0 m/s, other conditions were consistent with the simulation at 2 C. The influence of inlet airflow velocity on battery heat dissipation was investigated as shown in Figure 12. From the simulation results, it can be seen that increasing the airflow field is very helpful for battery cooling. Increasing the inlet airflow velocity can improve the cooling effect of the battery. If conditions permit, the higher the inlet velocity is, the better the cooling effect will be. However, as the inlet velocity increases by 0.2 m/s, the cooling effect is not significantly improved, so the gas inlet velocity can be controlled within a suitable range.

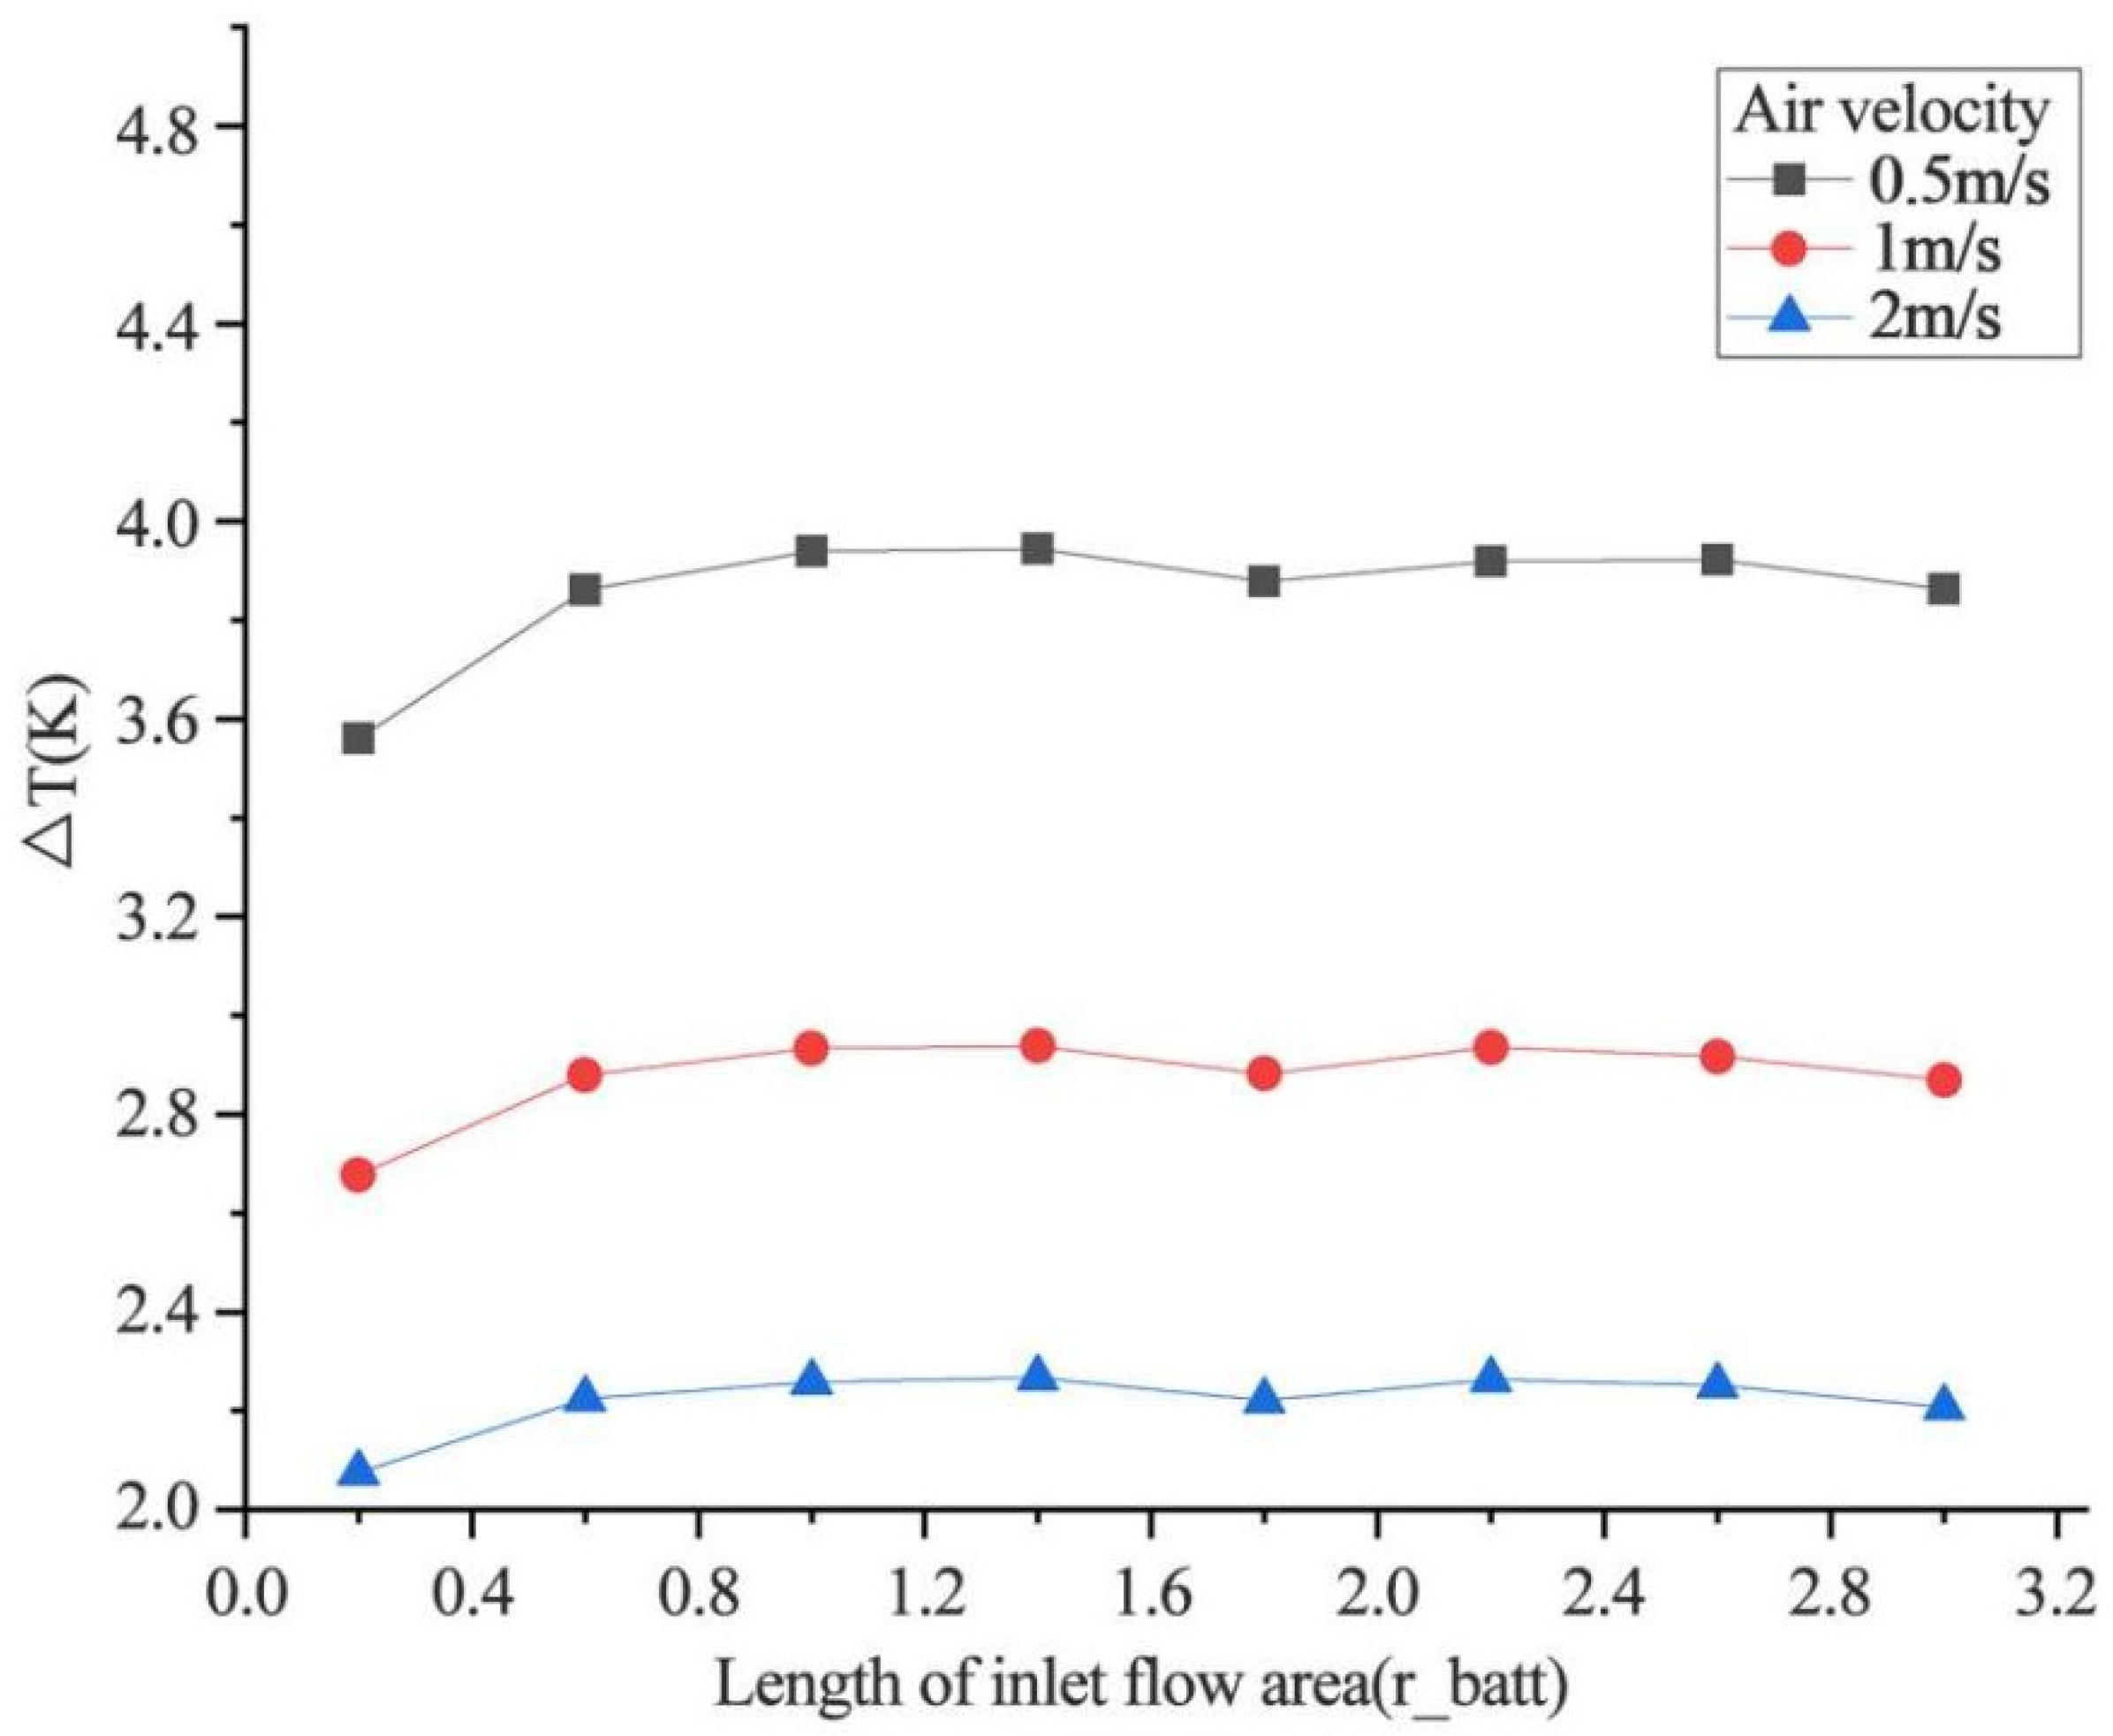
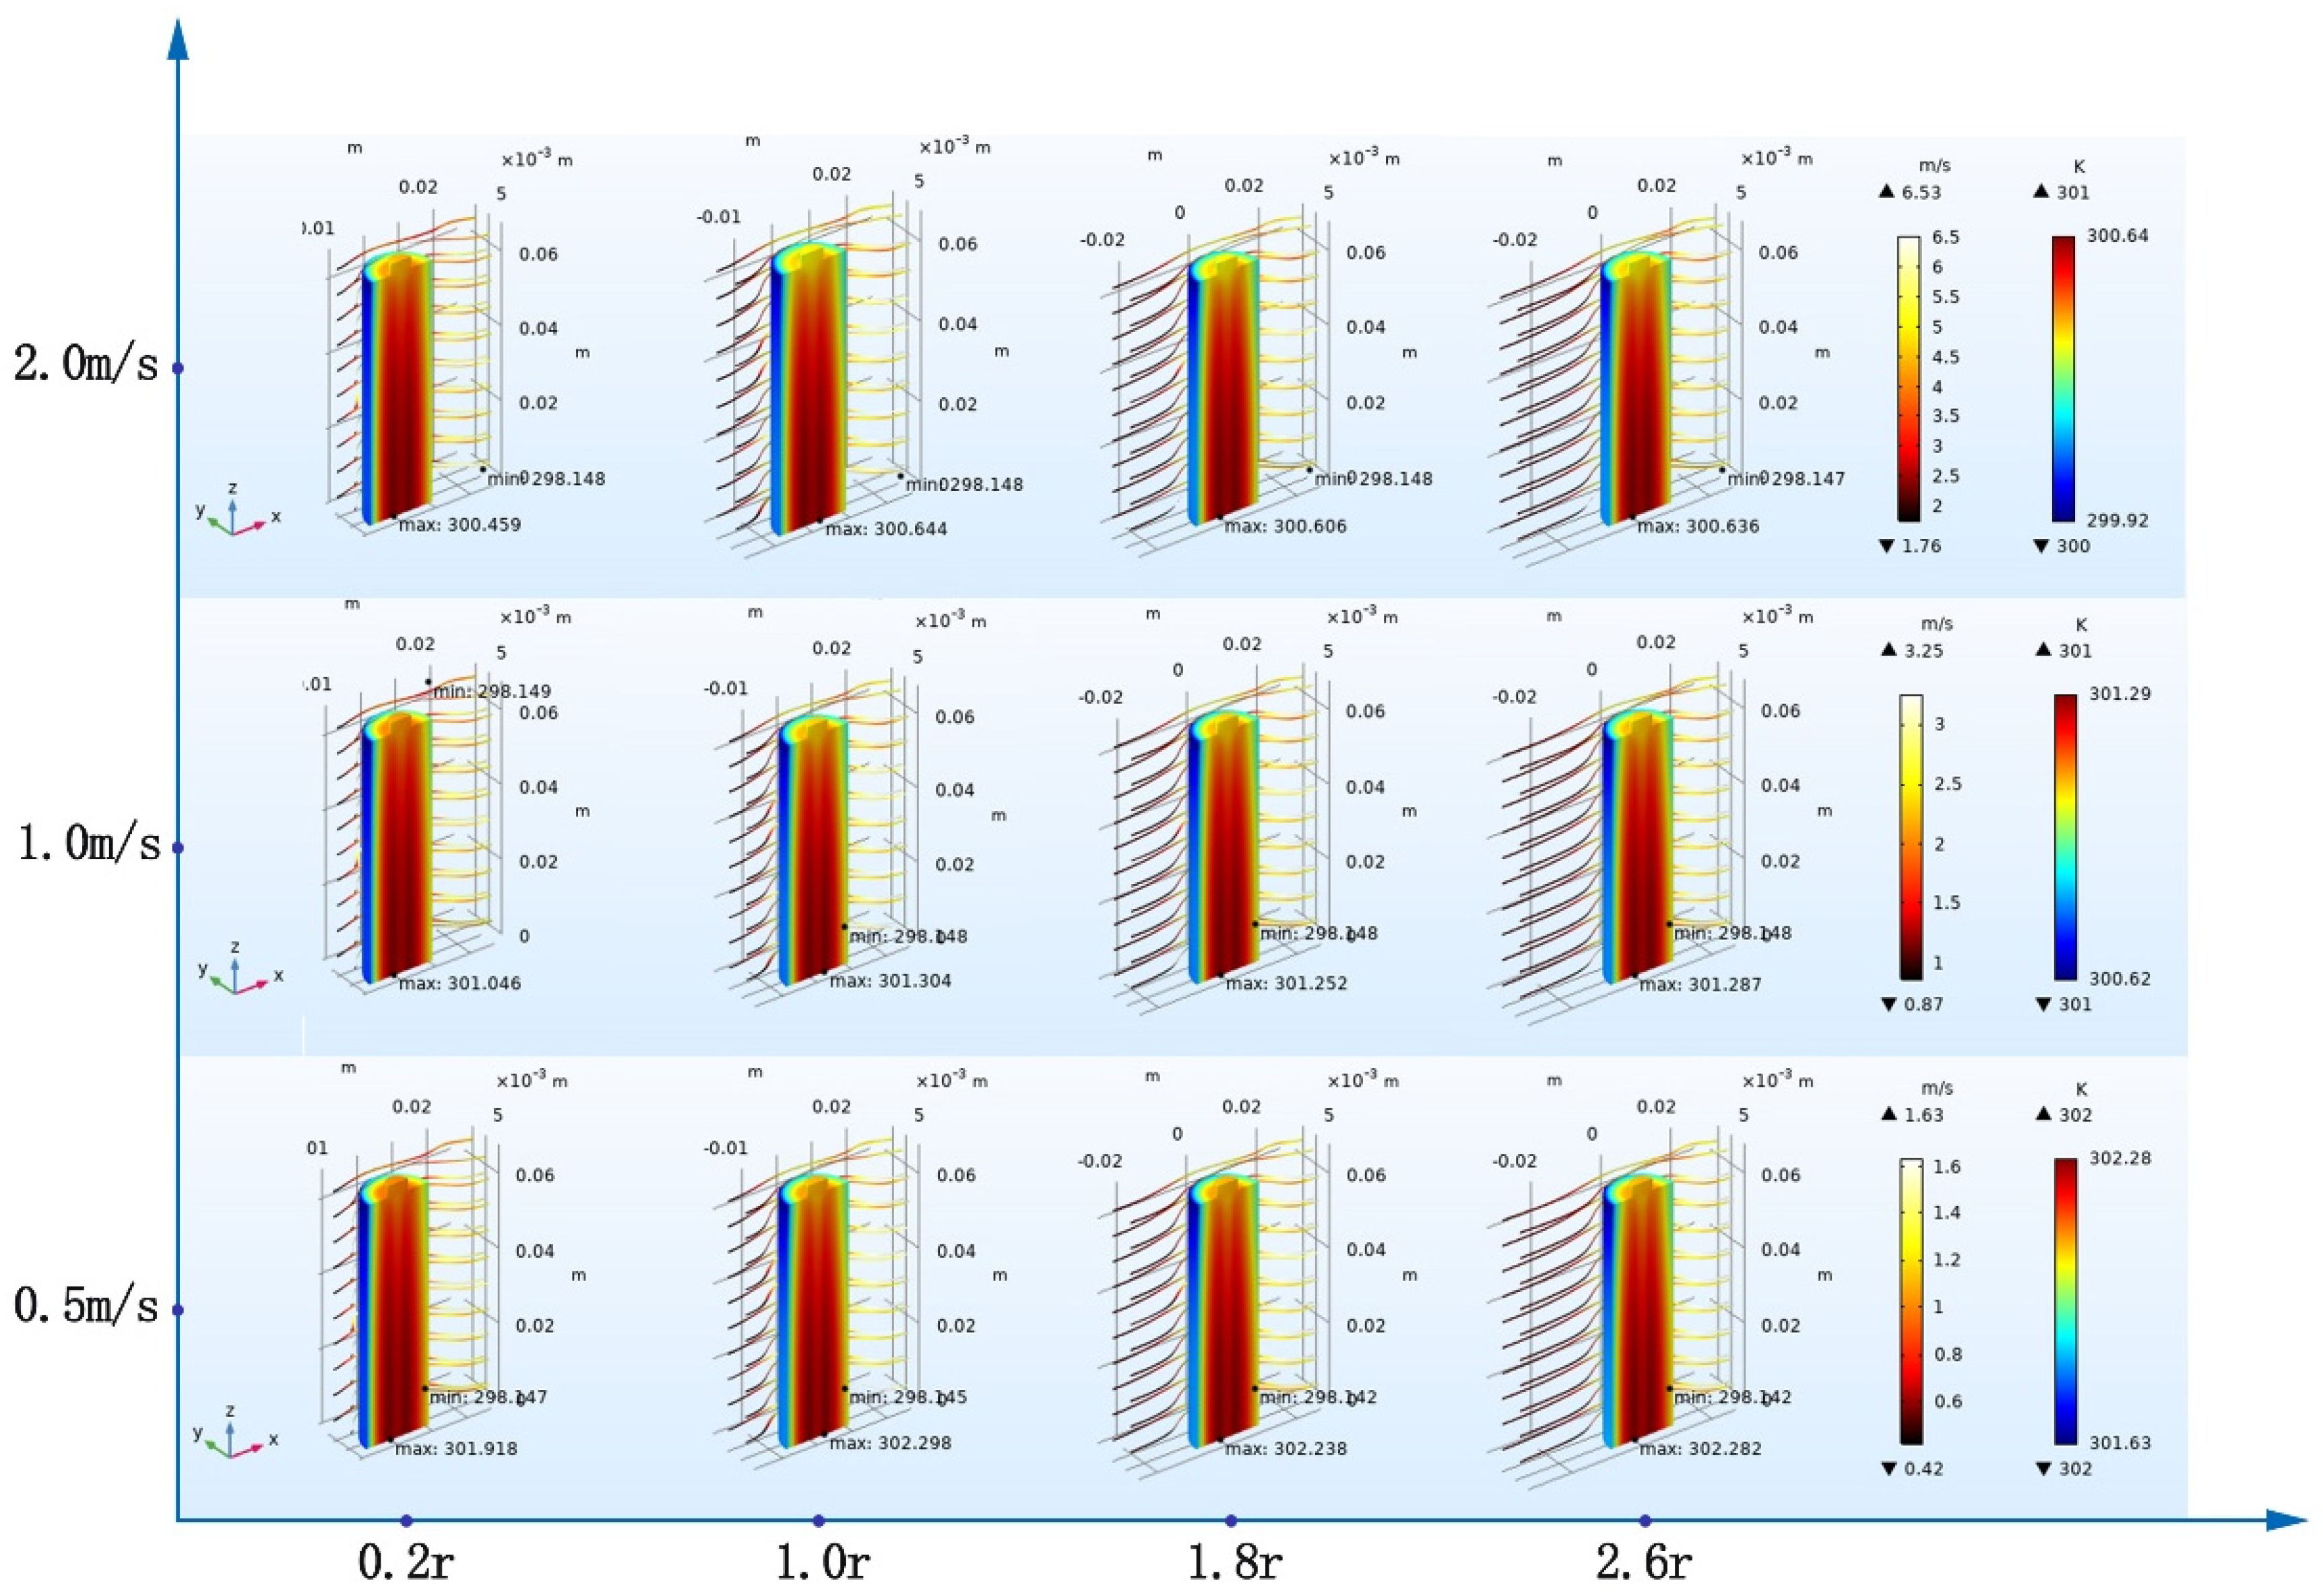
4.2.2. Effect of Inlet Flow Area Size on Heat Dissipation

The area from the inlet to the battery contact is called the inlet flow area, and the size of the inlet flow area will also affect the heat dissipation of the battery. According to the research results of the previous subsection, the inlet airflow velocity condition with the best relative heat dissipation effect is 1 m/s. Because different batteries have different sizes, the heat dissipation area will be different. The size of the inlet flow area (L_inlet) increases in proportion to the radius of the cylindrical battery (r_batt = 0.009 m), to study its effect on the heat dissipation of the battery.
When the size of the inlet airflow area changes at different wind speeds, the average temperature rise of the battery after discharge is shown in Figure 13 and Figure 14. It can be seen from the simulation results that the size of the inlet airflow area is between (0.2~1) × r_batt, and the closer the inlet airflow area is to the battery cell, the better the heat dissipation effect of the battery. The average temperature rise of the battery does not change obviously when the size exceeds 1 × r_batt. The heat dissipation effect of L_inlet is best locally when it is 1.8 × r_batt away from the battery. At different wind speeds, the influence trend of inlet flow area size on the average temperature rise of the battery is the same.

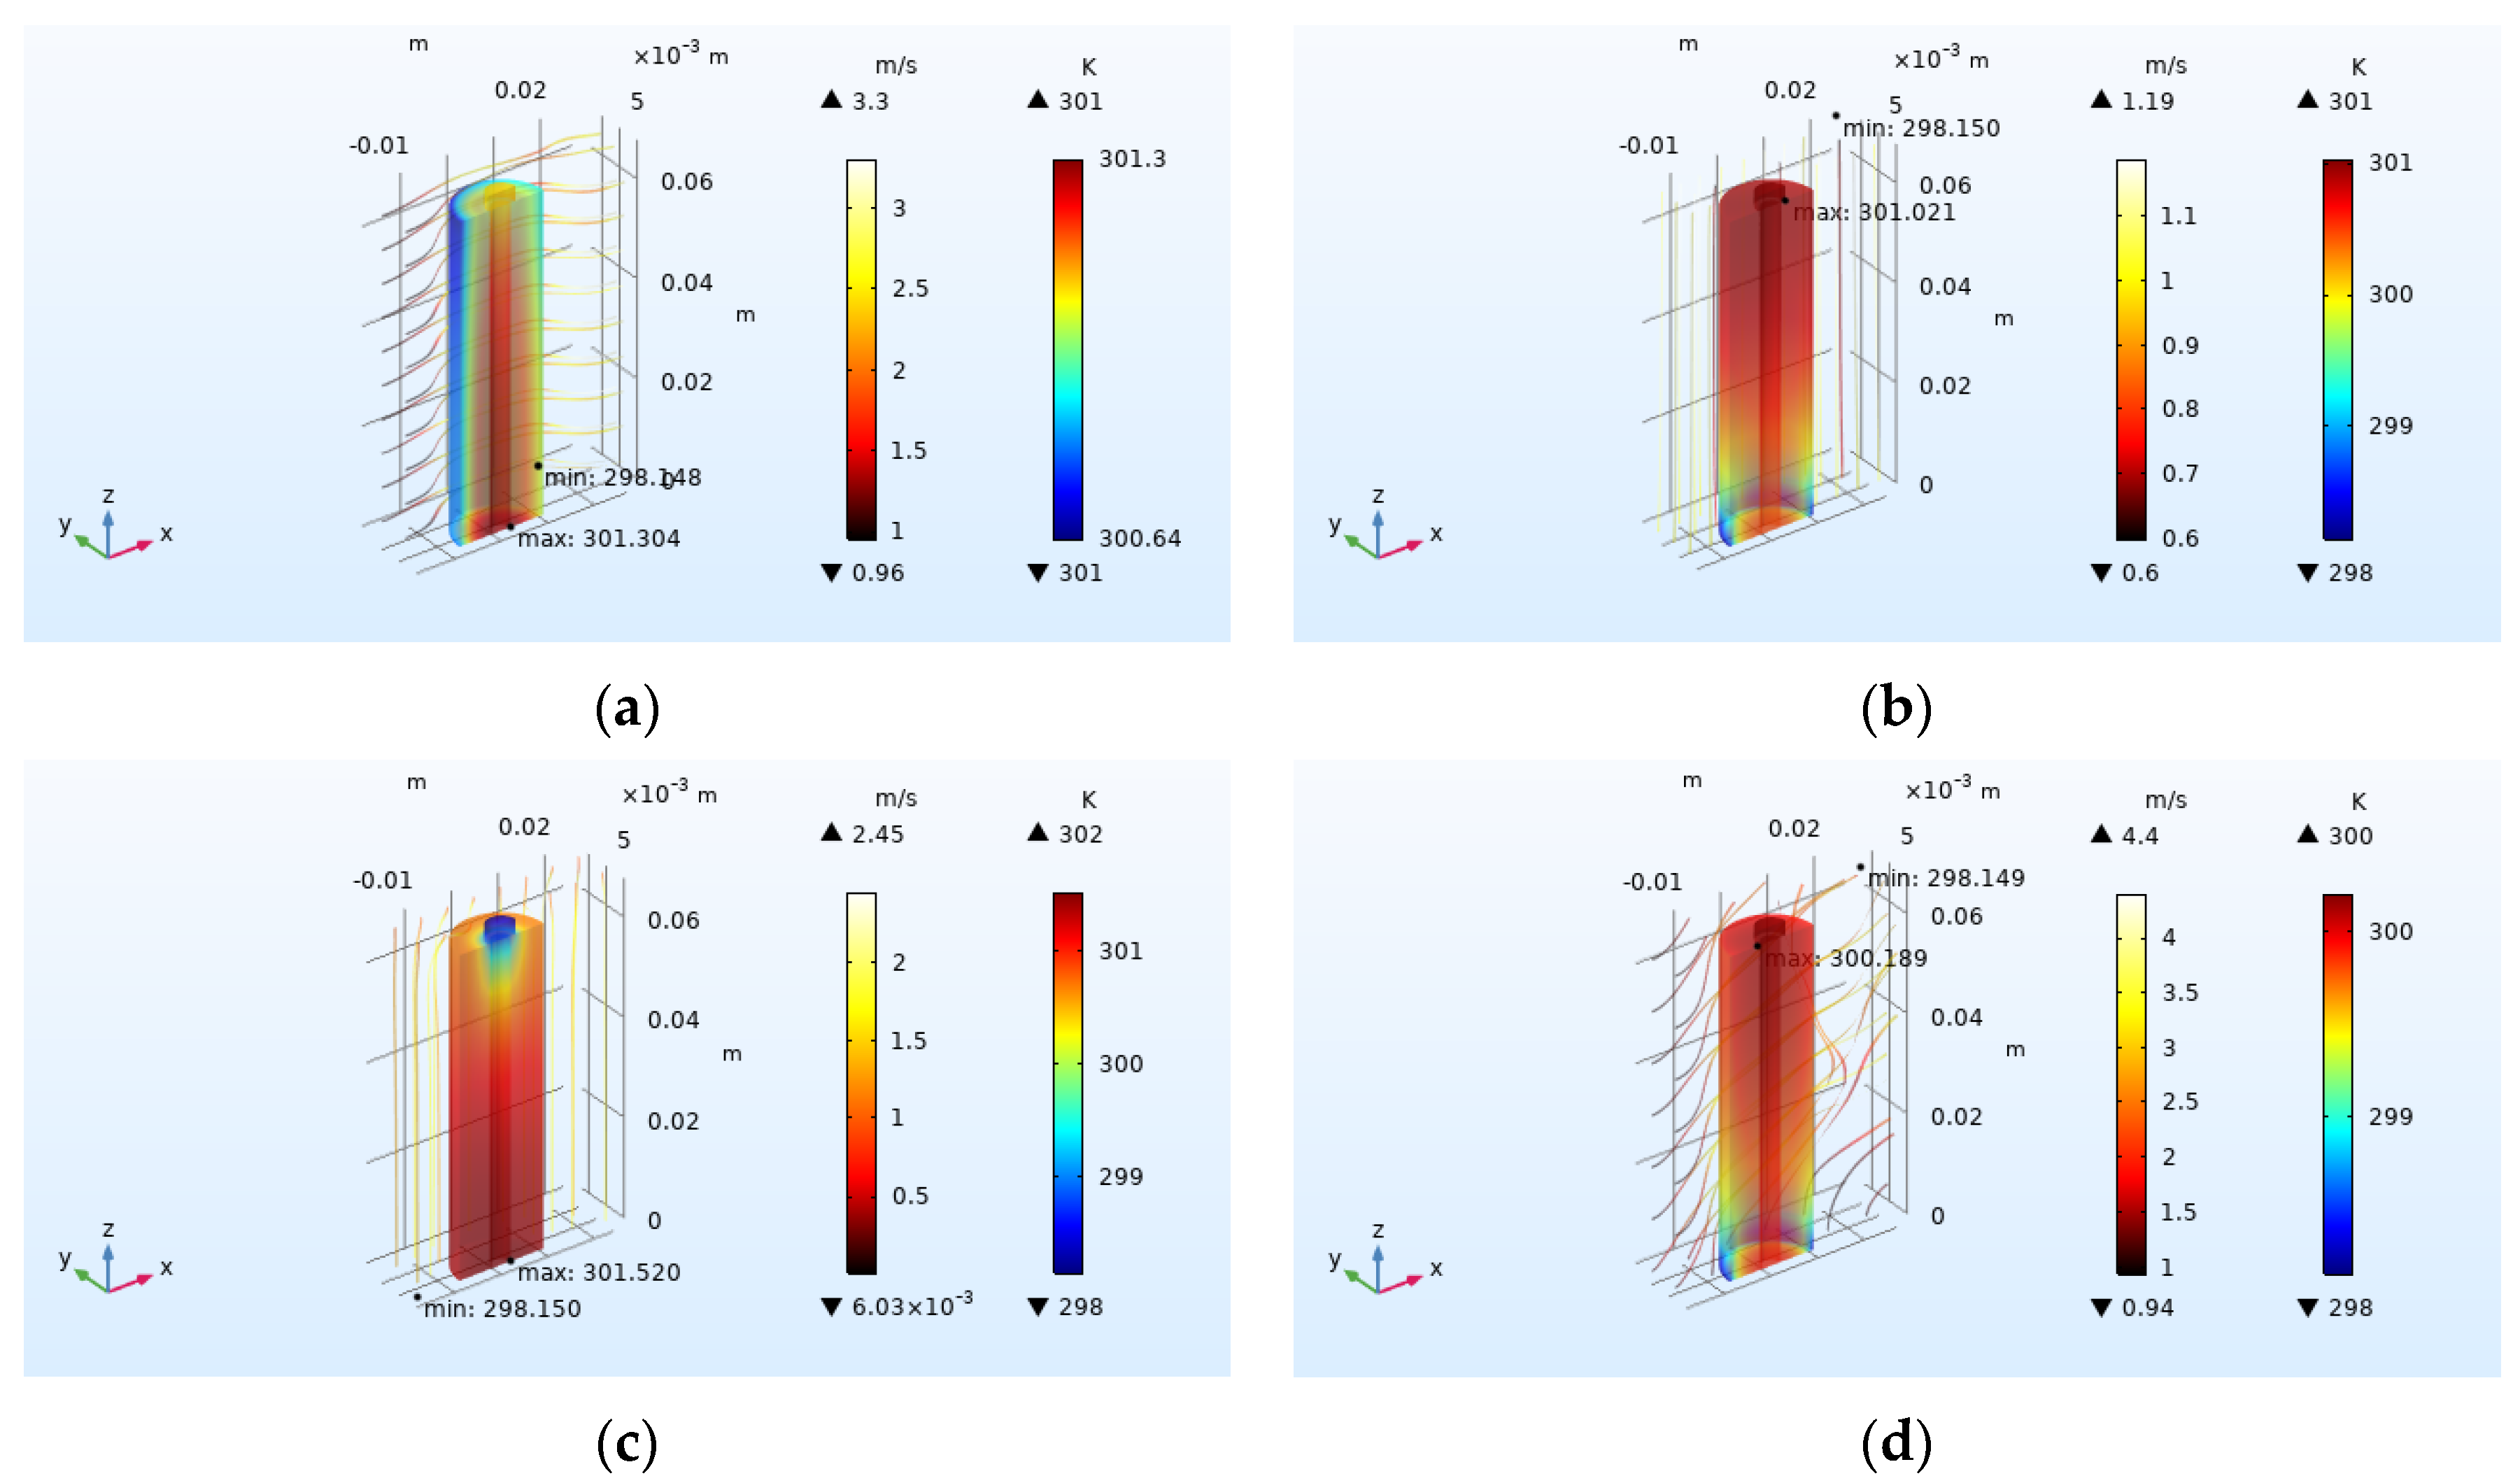
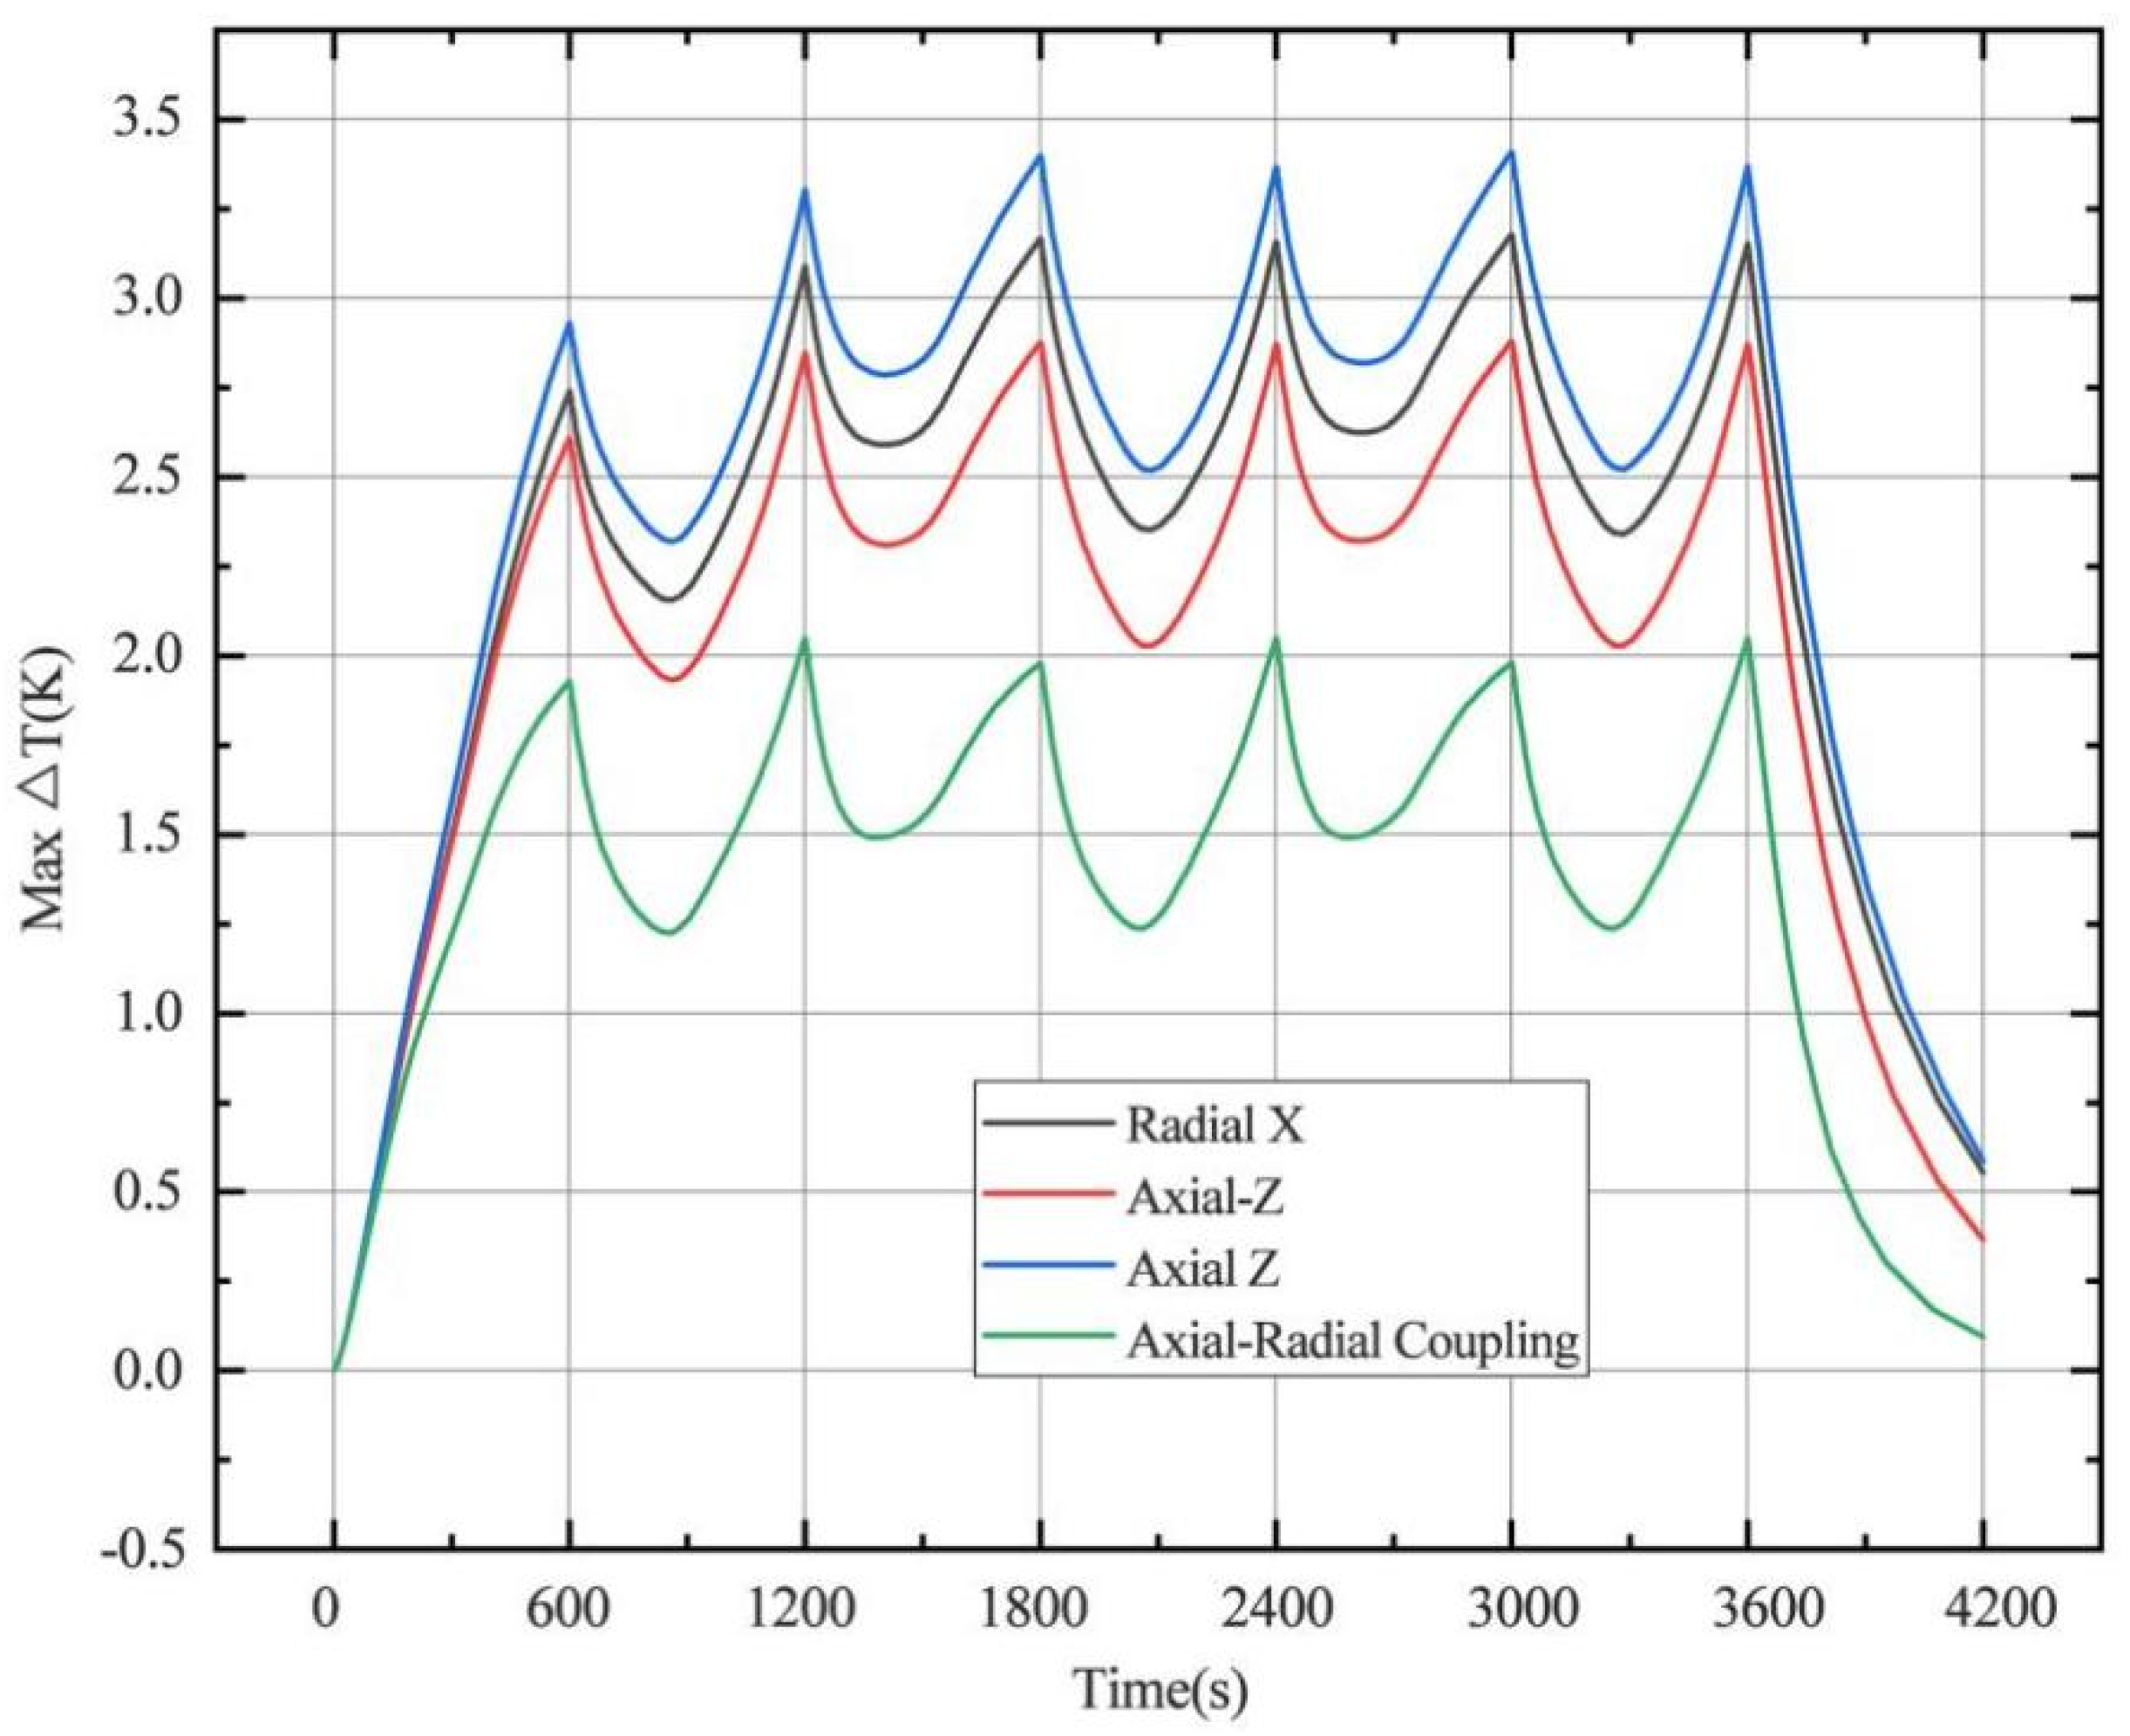
4.2.3. Effect of Airflow Field Direction on Heat Dissipation

The fixed position of the battery and different airflow fields will also influence the heat dissipation effect of the battery. The influence of this factor on the heat dissipation of the battery is studied from four different airflow fields: radial X, axial Z, axial −Z, and axial–radial coupling. Under conditions of 2 C discharge rate, 1 m/s airflow, and L_inlet = 1 × r_batt, the simulation results are shown in Figure 15. The average temperature rise after battery discharge without airflow field heat dissipation is taken as Δ T 0 , the average temperature rise after heat dissipation by different airflow fields is taken as Δ T 1 , and the heat dissipation efficiency of battery E is calculated by Equation (23).
E = Δ T 0 Δ T 1 Δ T 0 × 100 % .
The calculation results of heat dissipation efficiency of batteries with different airflow fields after discharge are shown in Table 4, and the variation of maximum temperature rise with time is shown in Figure 16.
According to the calculation results of the simulation data, the average temperature rise and the maximum temperature rise are: −Z > X > Z > axial–radial coupling; the heat dissipation efficiency is: −Z < X < Z < axial–radial coupling. The axial–radial coupling has the best heat dissipation effect, while axial −Z has the worst heat dissipation effect. Under the condition of radial X, the temperature on the positive electrode is lower than on the negative electrode, which is due to the influence of the positive battery cap, so that the heat dissipation near the positive electrode is better. The battery cap is steel, and it is directly connected with the battery cell, which improves the heat dissipation efficiency. In the case of the single airflow field, the cooling effect is best when air enters from the bottom of the battery in the axial direction, because the bottom of the battery’s heat dissipation is poor during the operation of the cell. In this way, the cathode is close to the inlet, which is more conducive to heat exchange and reduces the overall average temperature and maximum temperature of the battery. The highest temperature inside the battery appears at the connector of the positive pole of the battery. If conditions permit, the axis-diameter coupling can achieve the best heat dissipation effect. Compared with the heat dissipation effect without flow field, its heat dissipation efficiency can reach 92.6%.

5. Conclusions

In this paper, the electrochemical−heat flow coupling model of the NCA lithium-ion battery is established using COMSOL Multiphysics simulation software, and the electrochemical behavior and thermal characteristics are analyzed from the aspects of heat generation and heat dissipation. The main conclusions are as follows:
(1)
By establishing a three-dimensional electrochemical–thermal current coupling model of the lithium-ion battery, it is convenient and accurate to study the thermal characteristics of the lithium-ion battery, which is more conducive to observing the temperature distribution inside the battery under different working conditions and can obtain results that are difficult to measure by traditional experiments.
(2)
The change of charge and discharge rate has a non-linear effect on the temperature of the battery, and the high-rate charge–discharge has a greater effect on the battery temperature. In the condition of short-time continuous charge–discharge cycles, the temperature rise rate is the highest in the first charge–discharge process. After several cycles, the battery temperature is stable. The thickness of battery electrode is directly proportional to the battery capacity and temperature rise.
(3)
Increasing the airflow field is of great help to the heat dissipation of the battery. Increasing the inlet airflow velocity can increase the cooling effect of the battery. The greater the inlet velocity, the better the heat dissipation effect. The closer the inlet flow area is to the battery, the better the heat dissipation effect, but the effect on the battery temperature after exceeding one time of the battery radius is not obvious. In the condition of the single airflow field, the cooling effect is best when air enters the positive electrode from the negative electrode of the battery along the axis. In the future, the temperature distribution in the case of battery groups will be studied, and the airflow field will be added to optimize the heat dissipation of battery packs based on the results obtained.

Author Contributions

Conceptualization, L.Z.; data curation, G.L.; methodology, G.L.; supervision, L.Z.; writing—original draft, G.L.; writing—review and editing, L.Z. All authors have read and agreed to the published version of the manuscript.

Funding

This research was funded by the National Natural Science Foundation of China 51775037.

Institutional Review Board Statement

Not applicable.

Informed Consent Statement

Not applicable.

Data Availability Statement

Not applicable.

Acknowledgments

The authors would like to thank Fuhai Liu for the simulation model in the revised manuscript.

Conflicts of Interest

The authors declare no conflict of interest regarding the publication of this paper. The funders had no role in the design of the study; in the collection, analyses, or interpretation of data; in the writing of the manuscript, or in the decision to publish the results.

Abbreviations

List of Symbols
a s reaction surface area
A e electrode area
C Li +   concentration   ( mol / m 3 )
D diffusion   coefficient   ( m 2 / s )
E OCV open   circuit   potential
E OCV , ref reference   value   of   open   circuit   voltage
F Faraday s   constant   ( C / mol )
H convective heat transfer coefficient of the battery
I current   load   ( A )
I pair current   of   a   single - pair   electrode   ( A )
i 0 exchange   current   density   ( A / cm 2 )
j Li current   reaction   density
k i reaction   rate
L thickness   of   the   electrode   ( μ m )
Q heat   generation   ( W )
Q ohm ohmic heat
Q rea reaction heat
Q act active polarization heat
Q conv heat dissipation rate
r radial   coordinate   in   spherical   particle   ( μ m )
r p radius   of   active   substance
Ttemperature (°C)
T amb ambient   temperature
T sol temperature   solved   by   solid   thermal   model
t time   ( s )
t + transference   coefficient
Greek Letters
α a transfer   coefficients   of   positive   poles
α c transfer   coefficients   of   negative   poles
ε s volume   fraction   of   the   active   material
ε f volume   fraction   of   the   filling   material
η overpotential   ( V )
κ ionic   conductivity   ( S / m )
κ D eff diffusion   conductivity   ( S / m )
λ thermal   conductivity   of   the   battery   shell
ρ i density
σ eff solid - phase   effective   conductivity
σ cc current   collector   conductivity
ϕ s solid - phase   potential   ( V )
ϕ cc current   collector   potential   ( V )
ϕ e electrolyte   potential   ( V )
Subscripts/Superscripts
cc current collector
e electrolyte
f filler
eff effective
s solid
neg negative
pos positive
surfsurface

References

  1. Omariba, Z.B.; Zhang, L.; Kang, H.; Sun, D. Parameter identification and state estimation of lithium-ion batteries for electric vehicles with vibration and temperature dynamics. World Electr. Veh. J. 2020, 11, 50. [Google Scholar] [CrossRef]
  2. Hossain, L.; Hannan, M.A.; Aini, H.; Hoque, M.M.; Ker, P.J.; Saad, M.; Afida, A. A review of state of health and remaining useful life estimation methods for lithium-ion battery in electric vehicles: Challenges and recommendations. J. Clean. Prod. 2018, 205, 115–133. [Google Scholar]
  3. Yan, Y.; Wang, Q.; Jiang, B.; Li, B. A critical review of thermal management models and solutions of lithium-ion batteries for the development of pure electric vehicles. Renew. Sust. Energ. Rev. 2016, 64, 106–128. [Google Scholar]
  4. Maleki, H.; Hallaj, S.A.; Selman, J.R.; Dinwiddie, R.B.; Wang, H. Thermal properties of lithium-ion battery and components. J. Electrochem. Soc. 2015, 146, 947–954. [Google Scholar] [CrossRef]
  5. Zhang, X. Thermal analysis of a cylindrical lithium-ion battery. Electrochim. Acta 2011, 56, 1246–1255. [Google Scholar] [CrossRef]
  6. Duan, X.; Jiang, W.; Zou, Y.; Zeng, S. A coupled electrochemical-thermal-mechanical model for spiral-wound Li-ion batteries. J. Mater. Sci. 2018, 53, 10987–11001. [Google Scholar] [CrossRef]
  7. Xu, M.; Zhang, Z.; Wang, X.; Jia, L.; Yang, L. A pseudo three-dimensional electrochemical–thermal model of a prismatic LiFePO4 battery during discharge process. Energy 2015, 80, 303–317. [Google Scholar] [CrossRef]
  8. Dai, H.; Zhu, L.; Zhu, J.; Wei, X.; Sun, Z. Adaptive Kalman filtering based internal temperature estimation with an equivalent electrical network thermal model for hard-cased batteries. J. Power Sources 2015, 293, 351–365. [Google Scholar] [CrossRef]
  9. Wu, X.; Wang, W.; Sun, Y.; Wen, T.; Du, J. Study on the Capacity Fading Effect of Low-Rate Charging on Lithium-Ion Batteries in Low-Temperature Environment. World Electr. Veh. J. 2020, 11, 55. [Google Scholar] [CrossRef]
  10. Cheng, X.; Nan, S.; Yang, L.; Wang, S. Engineering-Oriented Modeling for Thermal Behaviors of 18650 Li-ion Batteries. Energy Procedia 2017, 105, 4757–4762. [Google Scholar] [CrossRef]
  11. Jaguemont, J.; Omar, N.; Martel, F.; Peter, V.; Mierlo, J.V. Streamline three-dimensional thermal model of a lithium titanate pouch cell battery in extreme temperature conditions with module simulation. J. Power Sources 2017, 367, 24–33. [Google Scholar] [CrossRef]
  12. Du, S.L.; Lai, Y.Q.; Jia, M.; Cheng, Y.; Liu, Y.X. Electrothermal characteristics simulation of cylindrical automotive lithium-ion battery. Chin. J. Nonferr. Metals 2014, 24, 1823–1830. [Google Scholar]
  13. Chen, J. Analysis of Thermal Performance of 18650 Li-Ion Battery Based on an Electrochemical-Thermal Coupling Model. Hans J. Chem. Eng. Technol. 2018, 8, 97–107. [Google Scholar] [CrossRef]
  14. Edouard, C.; Petit, M.; Forgez, C.; Bernard, J.; Revel, R. Parameter sensitivity analysis of a simplified electrochemical and thermal model for Li-ion batteries aging. J. Power Sources 2016, 325, 482–494. [Google Scholar] [CrossRef]
  15. Tran, N.T.; Farrell, T.; Vilathgamuwa, M.; Choi, S.S.; Li, Y. A computationally efficient coupled electrochemical-thermal model for large format cylindrical lithium ion batteries. J. Electrochem. Soc. 2019, 166, A3059–A3071. [Google Scholar] [CrossRef]
  16. Capron, O.; Samba, A.; Omar, N.; Van Den Bossche, P.; Van Mierlo, J. Thermal behaviour investigation of a large and high power lithium iron phosphate cylindrical cell. Energies 2015, 8, 10017–10042. [Google Scholar] [CrossRef] [Green Version]
  17. Chiew, J.; Chin, C.S.; Toh, W.D.; Gao, Z.; Jia, J.; Zhang, C.Z. A pseudo three-dimensional electrochemical-thermal model of a cylindrical LiFePO4/graphite battery. Appl. Therm. Eng. 2019, 147, 450–463. [Google Scholar] [CrossRef] [Green Version]
  18. Ghaznavi, M.; Chen, P. Sensitivity analysis of a mathematical model of lithium e sulfur cells part I: Applied discharge current and cathode conductivity. J. Power Sources 2013, 257, 4–11. [Google Scholar] [CrossRef]
  19. Doyle, M.; Fuller, T.F.; Newman, J. Modeling of Galvanostatic Charge and Discharge of the Lithium/Polymer/Insertion Cell. J. Electrochem. Soc. 1993, 140, 1526–1533. [Google Scholar] [CrossRef]
  20. Fuller, T.F.; Doyle, M.; Newman, J. Simulation and Optimization of the Dual Lithium Ion Insertion Cell. J. Electrochem. Soc. 1994, 141, A1–A10. [Google Scholar] [CrossRef] [Green Version]
  21. Doyle, M.; Gozdz, A.S.; Schmutz, C.N. Comparison of Modeling Predictions with Experimental Data From Plastic Lithium Ion Cells. J. Electrochem. Soc. 1996, 143, 1890–1903. [Google Scholar] [CrossRef]
  22. Hunt, M.J.; Brosa Planella, F.; Theil, F.; Widanage, W.D. Derivation of an effective thermal electrochemical model for porous electrode batteries using asymptotic homogenisation. J. Eng. Math. 2020, 122, 31–57. [Google Scholar] [CrossRef]
  23. Nie, P.; Zhang, S.; Ran, A.; Yang, C.; Chen, S.; Li, Z. Full-cycle electrochemical-thermal coupling analysis for commercial lithium-ion batteries. Appl. Therm. Eng. 2020, 184, 116258. [Google Scholar] [CrossRef]
  24. Hosseinzadeh, E.; Marco, J.; Jennings, P. Electrochemical-Thermal Modelling and Optimisation of Lithium-Ion Battery Design Parameters Using Analysis of Variance. Energies 2017, 10, 1278. [Google Scholar] [CrossRef] [Green Version]
  25. Rao, L.; Newman, J. Heat-generation rate and general energy balance for insertion battery systems. J. Electrochem. Soc. 1997, 144, 2697–2704. [Google Scholar] [CrossRef]
  26. Gu, B.; Wang, C. Thermal-Electrochemical Modeling of Battery System. J. Electrochem. 2000, 147, 2910–2922. [Google Scholar] [CrossRef]
  27. Kim, U.S.; Shin, C.B.; Kim, C.S. Effect of electrode configuration on the thermal behavior of a lithium-polymer battery. J. Power Sources 2009, 180, 909–916. [Google Scholar] [CrossRef]
  28. Ianniciello, L.; Biwolé, P.H.; Achard, P. Electric vehicles batteries thermal management systems employing phase change materials. J. Power Sources 2018, 378, 383–403. [Google Scholar] [CrossRef]
  29. Miranda, D.; Costa, C.M.; Almeida, A.M.; Lanceros-Méndez, S. Computer simulation of the influence of thermal conditions on the performance of conventional and unconventional lithium-ion battery geometries. Energy 2018, 149, 262–278. [Google Scholar] [CrossRef]
  30. Li, J.; Cheng, Y.; Ai, L.; Jia, M.; Du, S.; Yin, B.; Zhang, H. 3D simulation on the internal distributed properties of lithium-ion battery with planar tabbed configuration. J. Power Sources 2015, 293, 993–1005. [Google Scholar] [CrossRef]
  31. Ecker, M.; Käbitz, S.; Laresgoiti, I.; Sauer, D.U. Parameterization of a physico-chemical model of a lithium-ion battery: II. Model validation. J. Electrochem. Soc. 2015, 162, A1836–A1848. [Google Scholar] [CrossRef]
  32. Naoki, N.; Feixiang, W.; Jung, T.; Gleb, Y. Li-ion battery materials: Present and future. Mater. Today 2015, 6, 18. [Google Scholar]
  33. Brown, S.; Mellgren, N.; Vynnycky, M.; Lindbergh, G. Impedance as a Tool for Investigating Aging in Lithium-Ion Porous Electrodes. II. Positive Electrode Examination. J. Electrochem. Soc. 2008, 155, A320. [Google Scholar] [CrossRef]
  34. Nyman, A.; Behm, M.; Lindbergh, G. Electrochemical characterisation and modelling of the mass transport phenomena in LiPF6-EC-EMC. Electrochim. Acta 2008, 53, 6356. [Google Scholar] [CrossRef]
  35. Gerver, R.E.; Meyers, J.P. Three-Dimensional Modeling of Electrochemical Performance and Heat Generation of Lithium-Ion Batteries in Tabbed Planar Configurations. J. Electrochem. Soc. 2011, 158, A835. [Google Scholar] [CrossRef]
  36. Wang, S.; Li, K.; Tian, Y.; Wang, J.; Wu, Y.; Ji, S. An experimental and numerical examination on the thermal inertia of a cylindrical lithium-ion power battery. Appl. Therm. Eng. 2019, 154, 676–685. [Google Scholar] [CrossRef] [Green Version]
  37. Cheng, F.; Roger, L.; Jia, M. Simulation study on heat dissipation structure of power lithium battery module. Chin. J. Nonferr. Metals 2015, 6, 1067–1616. [Google Scholar]
  38. Smith, K.; Wang, C.Y. Solid-state diffusion limitations on pulse operation of a lithium ion cell for hybrid electric vehicles. J. Power Sources 2006, 161, 628–639. [Google Scholar] [CrossRef]
  39. Xu, M.; Zhang, Z.; Wang, X.; Jia, L.; Yang, L. Two-dimensional electrochemical-thermal coupled modeling of cylindrical LiFePO4 batteries. J. Power Sources 2014, 256, 233–243. [Google Scholar] [CrossRef]
  40. Gerd, L.; Ulf, K.; Stefan, G.; Frank, S.; Carsten, A. The Impact of Environmental Factors on the Thermal Characteristic of a Lithium-ion Battery. Batteries 2020, 6, 3. [Google Scholar]
Figure 1. Illustration of the pseudo-two-dimension electrochemical model.
Wevj 12 00250 g001
Figure 2. The 18650 lithium-ion battery for experiment.
Wevj 12 00250 g002
Figure 3. Comparison of simulated and measured battery voltage curves.
Wevj 12 00250 g003
Figure 4. The experimental devices for battery test.
Wevj 12 00250 g004
Figure 5. Comparison of simulated and measured temperature curves.
Wevj 12 00250 g005
Figure 6. The simulated battery load and potential curve (1 C).
Wevj 12 00250 g006
Figure 7. Average temperature changes of batteries at different charge–discharge rates.
Wevj 12 00250 g007
Figure 8. Internal temperature distribution of batteries with different rates. (a) 0.5 C charge–discharge rates; (b) 1 C charge–discharge rates; (c) 2 C charge–discharge rates; (d) 4 C charge–discharge rates.
Wevj 12 00250 g008
Figure 9. Changes in battery temperature and load under the continuous charge–discharge cycle.
Wevj 12 00250 g009
Figure 10. Average temperature changes of batteries at different electrode thickness.
Wevj 12 00250 g010
Figure 11. Comparison of heat dissipation effect with airflow field.
Wevj 12 00250 g011
Figure 12. Average temperature changes of batteries at different inlet airflow velocity.
Wevj 12 00250 g012
Figure 13. Average temperature changes of batteries at different inlet flow area size.
Wevj 12 00250 g013
Figure 14. Internal temperature distribution of batteries at different air velocity and inlet flow area size.
Wevj 12 00250 g014
Figure 15. Comparison of heat dissipation capacity in airflow field direction. (a) radial X airflow field direction; (b) radial Z airflow field direction; (c) radial −Z airflow field direction; (d) axial–radial coupling airflow field direction.
Wevj 12 00250 g015
Figure 16. The effect of airflow field direction on the maximum temperature rise of the battery.
Wevj 12 00250 g016
Table 1. Basic parameters of NCA lithium-ion battery.
Technical ParameterParameter Value
Capacity (Ah)2.9
Operating nominal voltage (V)3.7
Charging cutoff voltage (V)4.2
Discharge cutoff voltage (V)2.5
Positive electrode material Li [ NiCoAl ] O 2
Negative electrode material Li x C 6 MCMB
Electrolyte LiPF 6 / EC : EMC ( 3 : 7 )
Diameter (mm) 18.5 ± 0.2
Height (mm) 64.5 ± 0.5
Table 2. Model parameters.
ParameterPositive Electrode [31,32]Separator [33]Negative Electrode [34,35]
Particle   radius   r   ( μ m )0.25 2.5
Volume fraction of active substances0.42 0.384
Electrolyte volume fraction [23]0.410.370.444
Electrolyte   initial   concentration   ( mol / m 3 ) [23] 1200
Maximum   lithium - ion   concentration   ( mol / m 3 )48,000 31,507
Specific   heat   capacity   ( J / ( kg · K ) )7001978.21437.4
Thermal   conductivity   ( W / ( m · K ) )50.3341.04
Diffusivity   ( m 2 / s) [36] 1.5 × 10 15
Electrode   thickness   ( μ m )403055
Table 3. Effect of electrode thickness on temperature.
Positive   Electrode   Thickness   ( μ m ) Negative   Electrode   Thickness   ( μ m ) Capacity   ( A h / m 2 ) Average Temperature Rise (K)Maximum Temperature Rise (K)
4055.0016.2107.7807.969
4561.8818.2368.8019.015
5068.7520.2629.81910.058
5575.6322.28810.88011.147
6082.5024.31411.96212.257
6589.3826.34513.06313.388
7096.2528.36714.16014.514
Table 4. Comparison of airflow field direction.
Airflow Field DirectionAverage Temperature Rise (K)Maximum Temperature Rise (K)Average Temperature Drop (K)Heat Dissipation Efficiency
No flow field22.91322.95000
Radial X2.9343.15419.9790.872
Axial Z2.4252.87320.4880.894
Axial −Z2.9483.37019.9650.871
Axis-diameter coupling1.7012.05121.2120.926
Publisher’s Note: MDPI stays neutral with regard to jurisdictional claims in published maps and institutional affiliations.

