
Design and Development of a Computational Tool for a Dialyzer by Using Computational Fluid Dynamic (CFD) Model


Abstract
:1. Introduction
2. Development of a Computational Tool
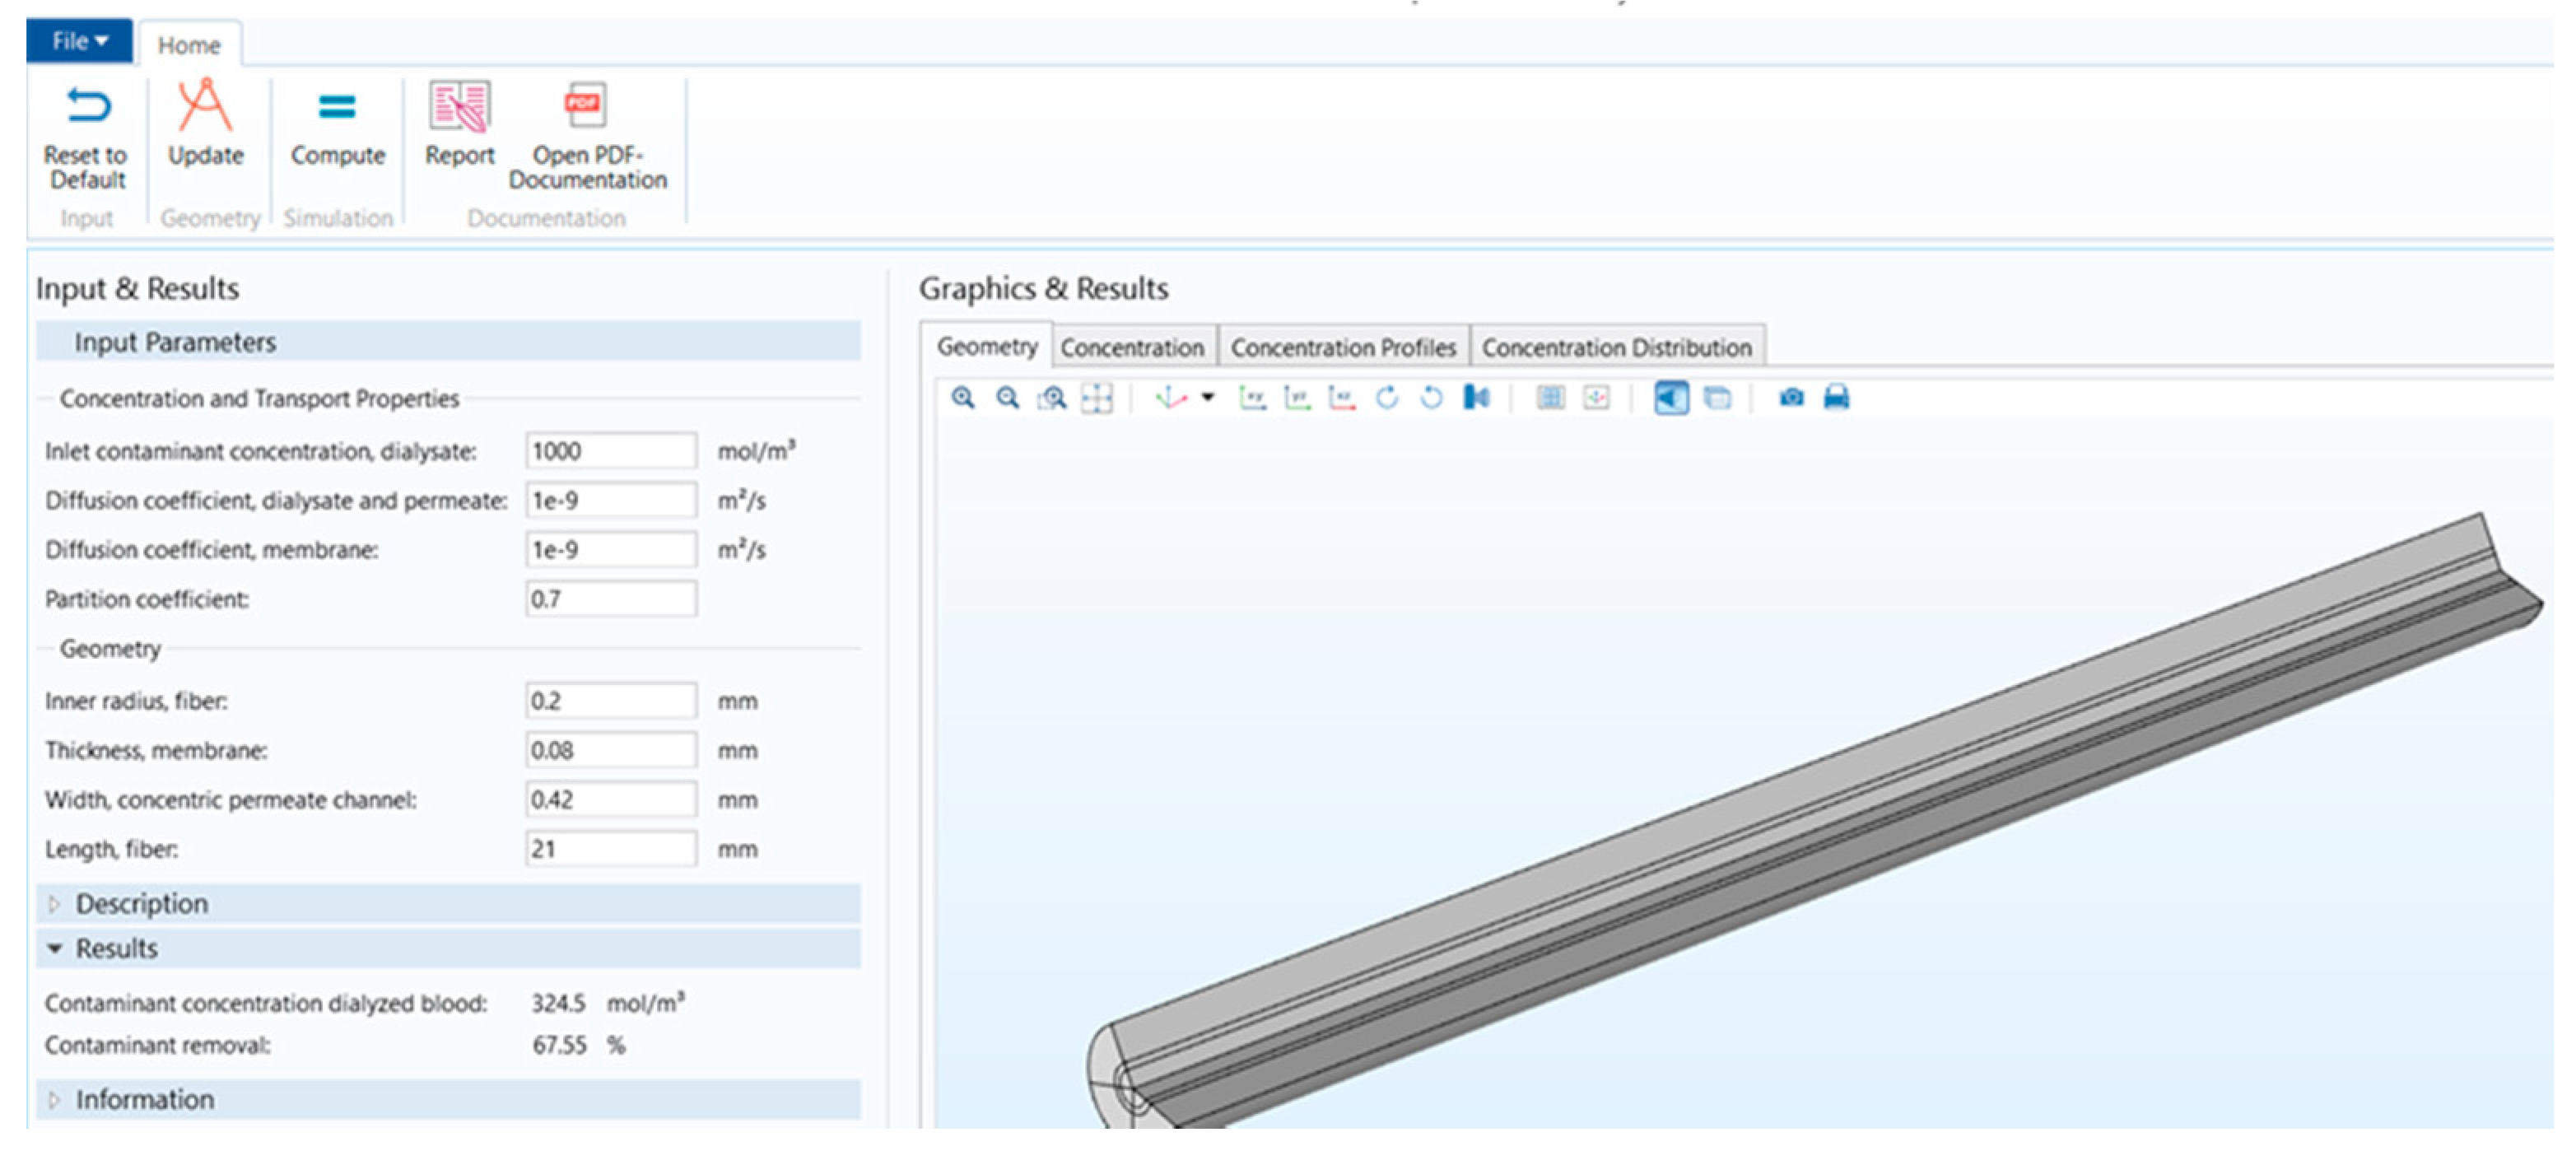
2.1. Stand-Alone Computational Tool vs. COMSOL Application
2.2. Comparison of the Model Parameters
2.3. Comparison of the Input Parameters
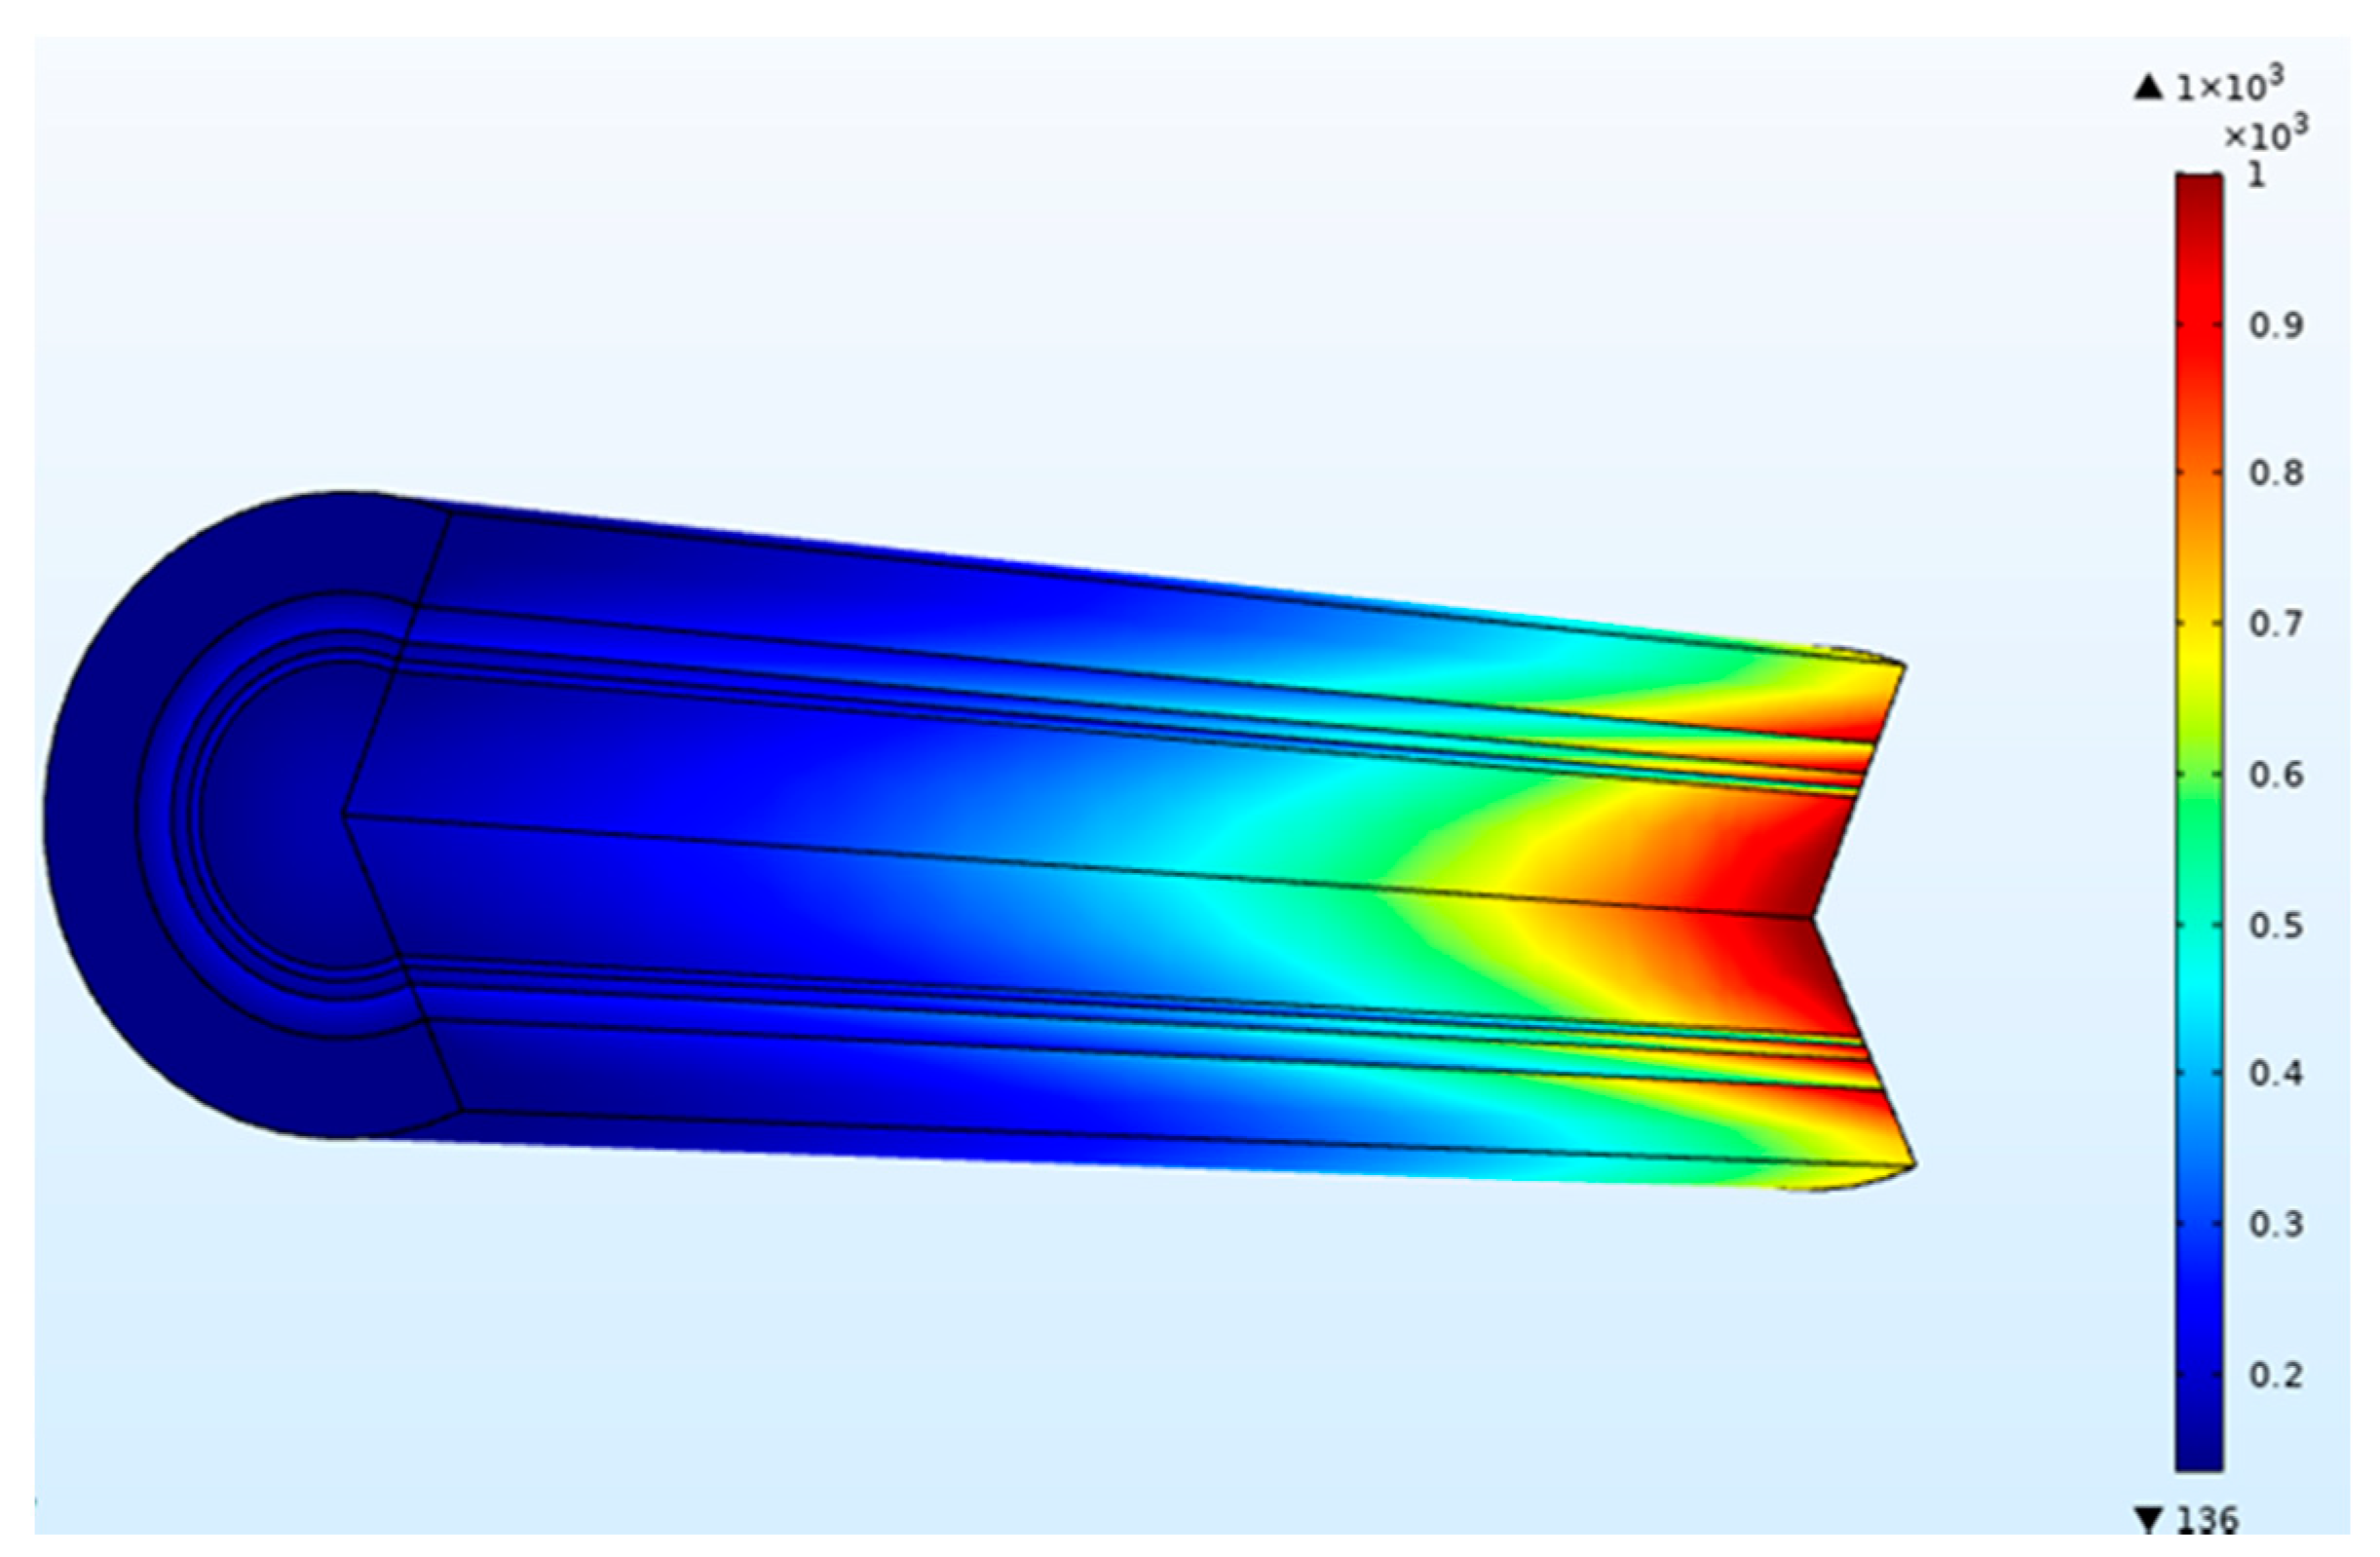
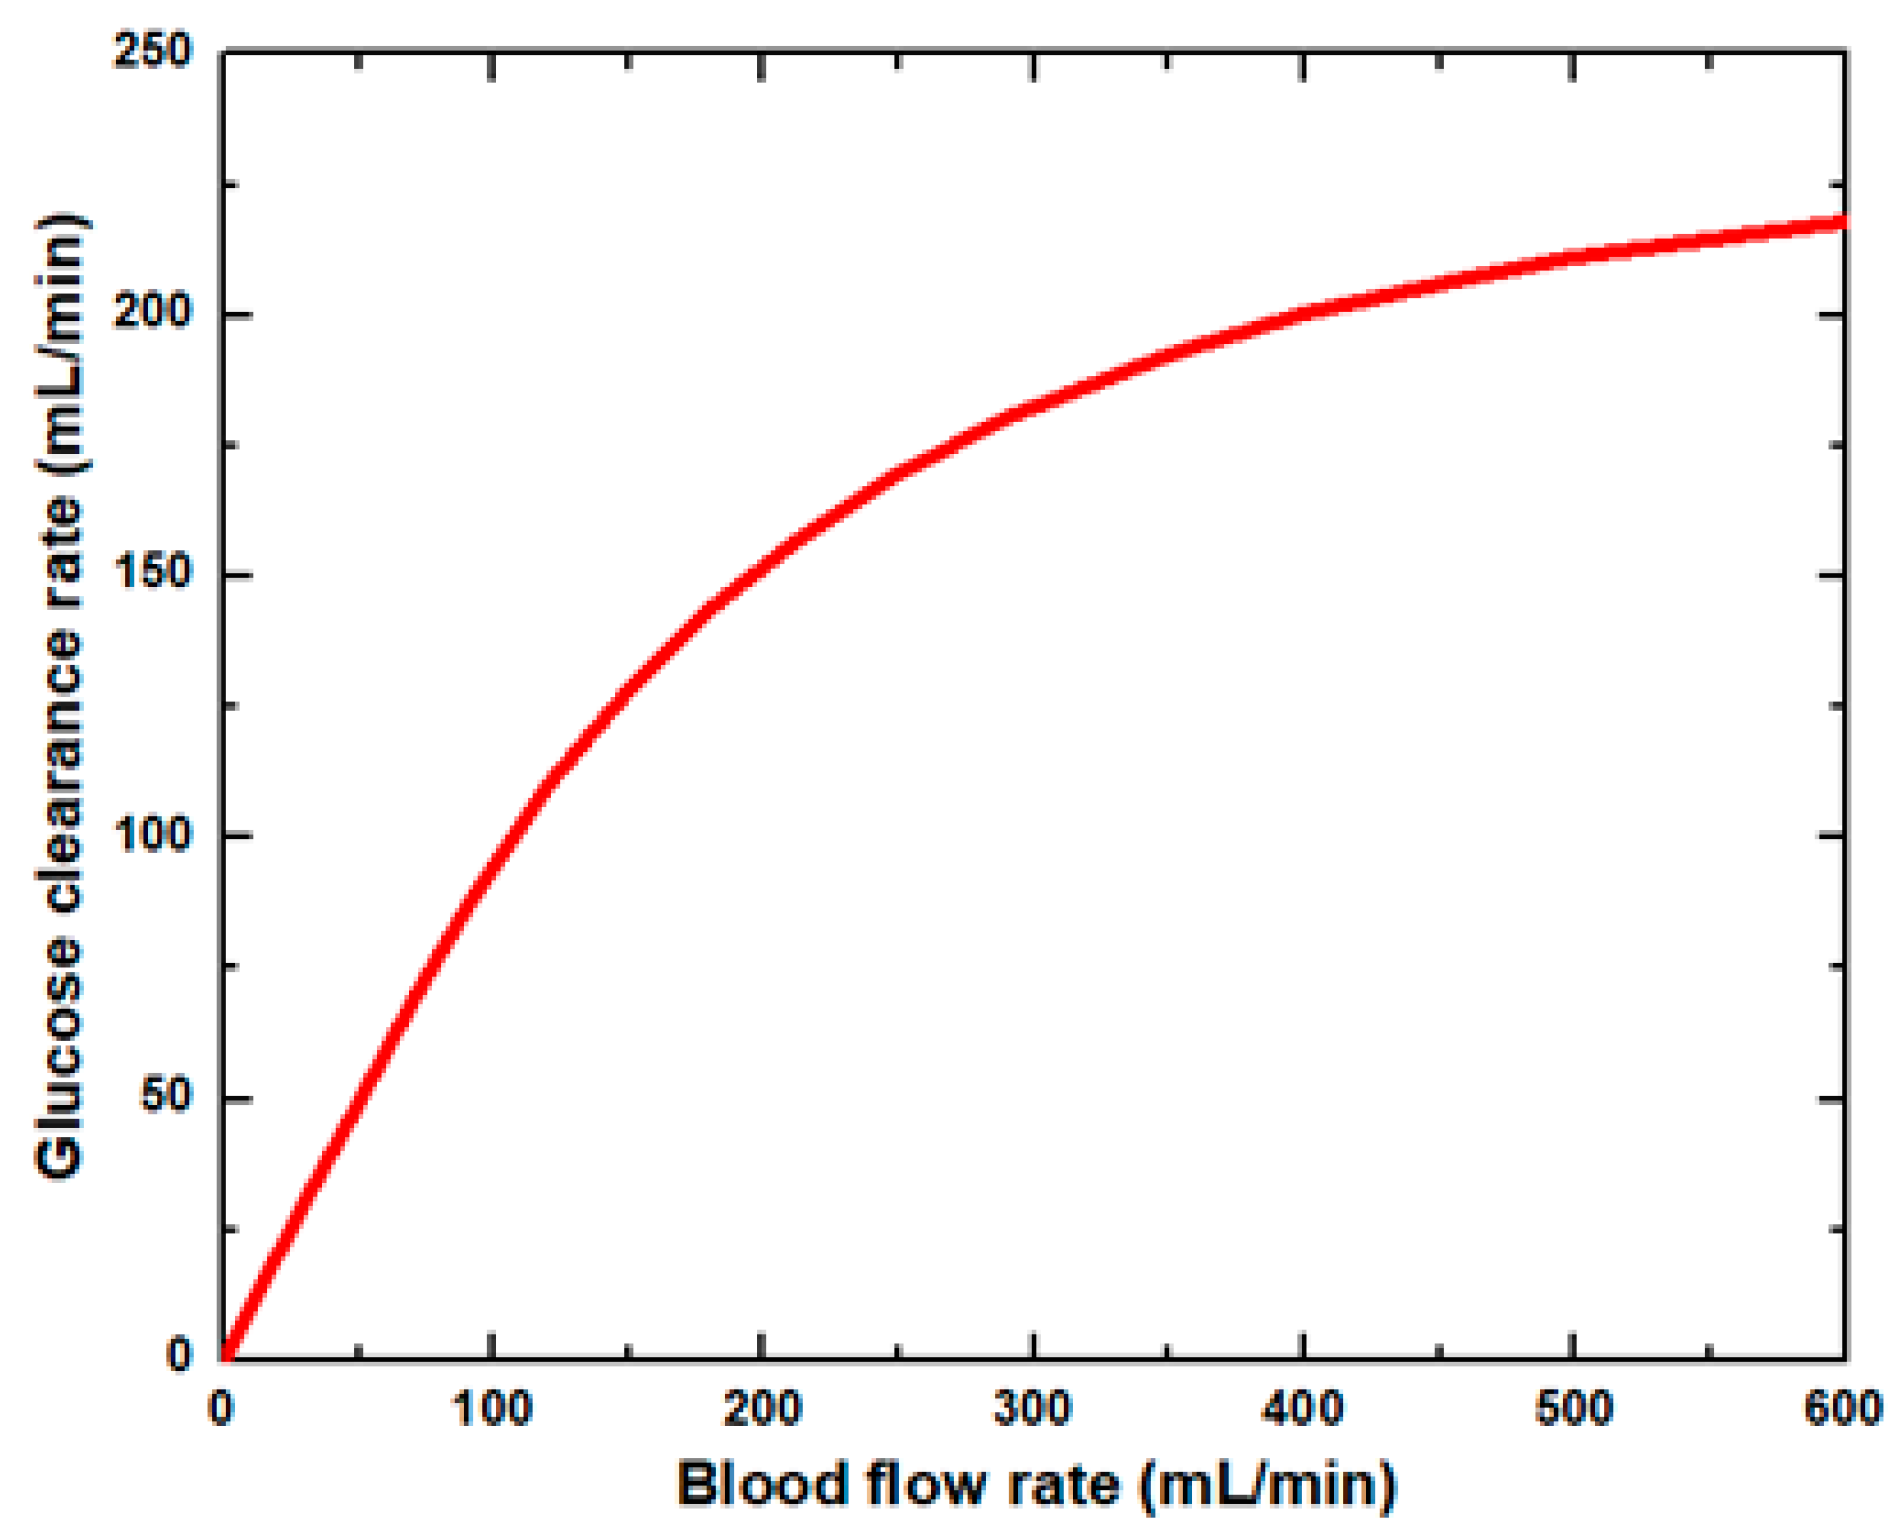
3. Results and Discussion
4. Conclusions
Supplementary Materials
Author Contributions
Funding
Institutional Review Board Statement
Informed Consent Statement
Data Availability Statement
Acknowledgments
Conflicts of Interest
References
- Olson, J.C. Design and Modeling of a Portable Hemodialysis System. Ph.D. Thesis, Georgia Institute of Technology, Atlanta, GA, USA, 2009. [Google Scholar]
- Bethesda, M.D. National kidney and urologic diseases information clearing house. NIH Publ. 2005, 8, 3925. [Google Scholar]
- Hedayat, A.; Szpunar, J.; Kumar, N.A.; Peace, R.; Elmoselhi, H.; Shoker, A. Morphological characterization of the polyflux 210h hemodialysis filter pores. Int. J. Nephrol. 2012, 2012, 1–6. [Google Scholar] [CrossRef] [PubMed]
- Gala-Błądzińska, A.; Tęcza, K.; Żyłka, W.; Prach, P.; Błądziński, M.; Jakubczyk, P. Evaluation of the usefulness of the Monte Carlo method for estimating the optimization of hemodialysis. Phys. Med. 2021, 12, 100035. [Google Scholar] [CrossRef]
- Eloot, S.; Van Biesen, W.; Vanholder, R. A sad but forgotten truth: The story of slow-moving solutes in fast hemodialysis. In Seminars in Dialysis; Blackwell Publishing Ltd.: Oxford, UK, 2012; Volume 25, pp. 505–509. [Google Scholar]
- Eloot, S.; Vierendeels, J.; Verdonck, P. Optimisation of solute transport in dialysers using a three-dimensional finite volume model. Comp. Methods Biomech. Biomed. Eng. 2006, 9, 363–370. [Google Scholar] [CrossRef] [PubMed]
- Gałach, M.; Weryński, A. Development of “virtual patient” model for simulation of solute and fluid transport during dialysis. Bull. Pol. Acad. Sci. Tech. Sci. 2005, 53, 283–292. [Google Scholar]
- Debowska, M.; García-López, E.; Waniewski, J.; Lindholm, B. Therapeutic Removal of Uremic Toxins by Peritoneal Dialysis. Uremic Toxins 2012, 28, 331–357. [Google Scholar]
- Eloot, S.; Vanholder, R.; Dequidt, C.; Van Biesen, W. Removal of Different Classes of Uremic Toxins in APD vs CAPD: A Randomized Cross-Over Study. Perit. Dial. Int. 2015, 35, 436–442. [Google Scholar] [CrossRef] [PubMed] [Green Version]
- Yamamoto, K.I.; Hayama, M.; Matsuda, M.; Yakushiji, T.; Fukuda, M.; Miyasaka, T.; Sakai, K. Evaluation of asymmetrical structure dialysis membrane by tortuous capillary pore diffusion model. J. Membr. Sci. 2007, 287, 88–93. [Google Scholar] [CrossRef]
- Karabelas, A.J.; Kostoglou, M.; Moschona, A.; Sioutopoulos, D.C. Method development for experimental determination οf key fluid-mechanical parameters of haemo-catharsis modules. J. Membr. Sci. 2020, 611, 118353. [Google Scholar] [CrossRef]
- Gomez, M.; Bañon-Maneus, E.; Arias-Guillén, M.; Fontseré, N.; Broseta, J.J.; Ojeda, R.; Maduell, F. Distinct Solute Removal Patterns by Similar Surface High-Flux Membranes in Haemodiafiltration: The Adsorption Point of View. Blood Purif. 2021, 1–9. [Google Scholar] [CrossRef] [PubMed]
- Annan, K. Mathematical modeling for hollow fiber dialyzer: Blood and HCO3−-dialysate flow characteristics. Int. J. Pure Appl. Math. 2012, 79, 425–452. [Google Scholar]
- Boamah, E.K. Mathematical Modeling of the Dynamic Exchange of Solutes in a Prototype Hemodialyzer. Appl. Math. 2020, 11, 845. [Google Scholar] [CrossRef]
- Islam, M.S.; Szpunar, J. Study of dialyzer membrane (polyflux 210h) and effects of different parameters on dialysis performance. Open J. Nephrol. 2013, 3, 161–167. [Google Scholar] [CrossRef] [Green Version]
- Alex, A.F.; Vinoth, R.; Dudhe, R. A Study on Hemodialyzer Membranes using Finite Element Analysis. In Proceedings of the 2020 Advances in Science and Engineering Technology International Conferences (ASET), Dubai, United Arab Emirates, 4 February–9 April 2020; pp. 1–5. [Google Scholar]
- Donato, D.; Boschetti-de-Fierro, A.; Zweigart, C.; Kolb, M.; Eloot, S.; Storr, M.; Krause, B.; Leypoldt, K.; Segers, P. Optimization of dialyzer design to maximize solute removal with a two-dimensional transport model. J. Membr. Sci. 2017, 541, 519–528. [Google Scholar] [CrossRef]
- Yu, J.; Chitalia, V.C.; Akintewe, O.O.; Edwards, A.; Wong, J.Y. Determinants of hemodialysis performance: Modeling fluid and solute transport in hollow-fiber dialyzers. Regen. Eng. Transl. Med. 2019, 7, 291–300. [Google Scholar] [CrossRef]
- Kahshan, M.; Lu, D.; Rahimi-Gorji, M.; Do, H.T. A mathematical model of blood flow in a permeable channel: Application to flat plate dialyzer. Phys. Scr. 2019, 95, 045202. [Google Scholar] [CrossRef]
- Donato, D.; Storr, M.; Krause, B. Design optimization of hollow fiber dialyzers to enhance internal filtration based on a mathematical model. J. Membr. Sci. 2019, 598, 117690. [Google Scholar] [CrossRef]
- Alex, A.F.; Vinoth, R.; Dudhe, R. Modelling and Simulation of High Flux Hemodialyzer Membranes of Different Porosities to Identify the Optimal Membrane Design. In Proceedings of the 2021 Seventh International Conference on Bio Signals, Images, and Instrumentation (ICBSII), Chennai, India, 25–27 March 2021; pp. 1–5. [Google Scholar]
- Multiphysics, C.O. Introduction to COMSOL Multiphysics®; COMSOL Multiphysics: Burlington, MA, USA, 1998. [Google Scholar]
- Available online: https://www.comsol.com/model/separation-through-dialysis-258 (accessed on 15 March 2021).
- Yaqoob, T.; Ahsan, M.; Hussain, A.; Ahmad, I. Computational Fluid Dynamics (CFD) Modeling and Simulation of Flow Regulatory Mechanism in Artificial Kidney Using Finite Element Method. Membranes 2020, 10, 139. [Google Scholar] [CrossRef] [PubMed]


| Parameter | COMSOL Application | Stand-Alone Computational Tool [24] |
|---|---|---|
| Diffusion Coefficient of Solute, D | ) | |
| Membrane Diffusion Coefficient, Dm | ||
| The average velocity of dialysate, Uav-dia | 0.5 mm/s | Determine by Continuity and Navier Stokes equation |
| The average velocity of permeate, Uav-per | 0.8 mm/s | Determine by Continuity and Navier Stokes equation |
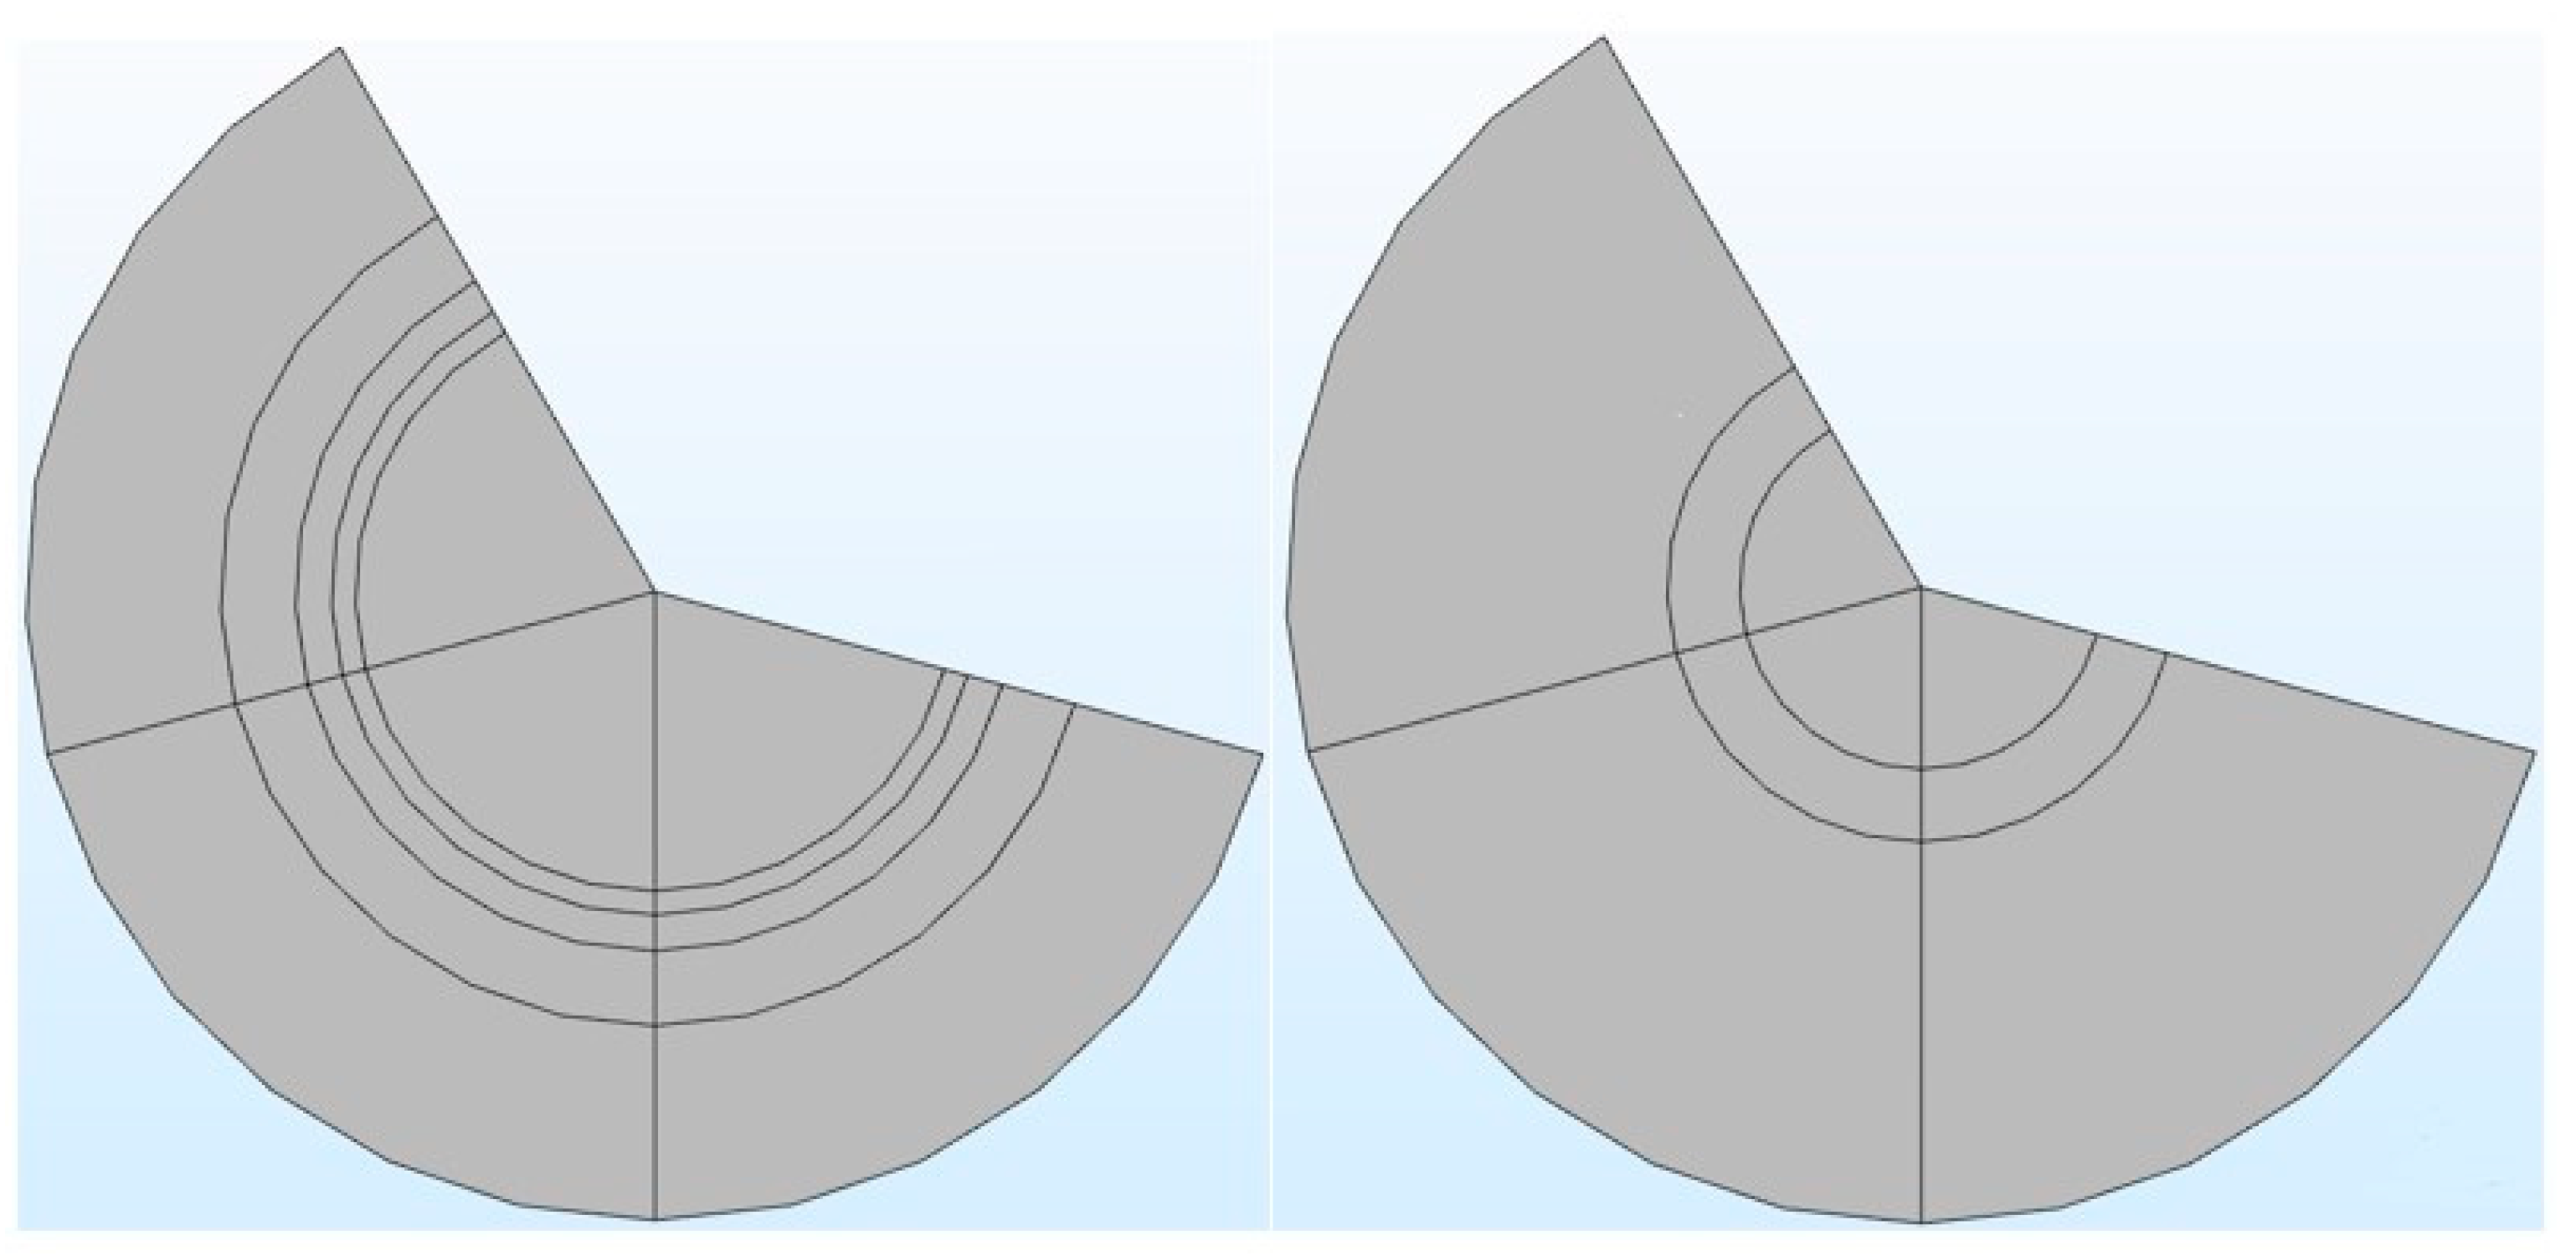
| Membrane Parameters | COMSOL Application | Computational Tool |
|---|---|---|
| The inner radius of the fiber, R1 | ✓ | ✓ |
| Radius up to the outer layer, R2 | ✓ | ✓ |
| The radius of the concentric permeate channel, R3 | ✓ | ✓ |
| Length of the fiber, H | ✓ | ✓ |
| Tortuosity, τ | ✕ | ✓ |
| The porosity of the skin layer, Ɛms | ✕ | ✓ |
| The average diameter of the skin layer pores | ✕ | ✓ |
| Number of fibers, n | ✕ | ✓ |
| Process parameters | ||
| Inlet concentration, | ✓ | ✓ |
| Blood flow rate, Qb | ✕ | ✓ |
| Dialysate flow rate, Qd | ✕ | ✓ |
| Computational Tool Application Results | COMSOL Application Results |
|---|---|
| Urea clearance rates | Contaminant concentration in dialyzed blood |
| Glucose clearance rate | Contaminant removal |
| Endothelin clearance rate | |
| β2-microglobulin | |
| Complement factor D | |
| Albumin | |
| Packing density |
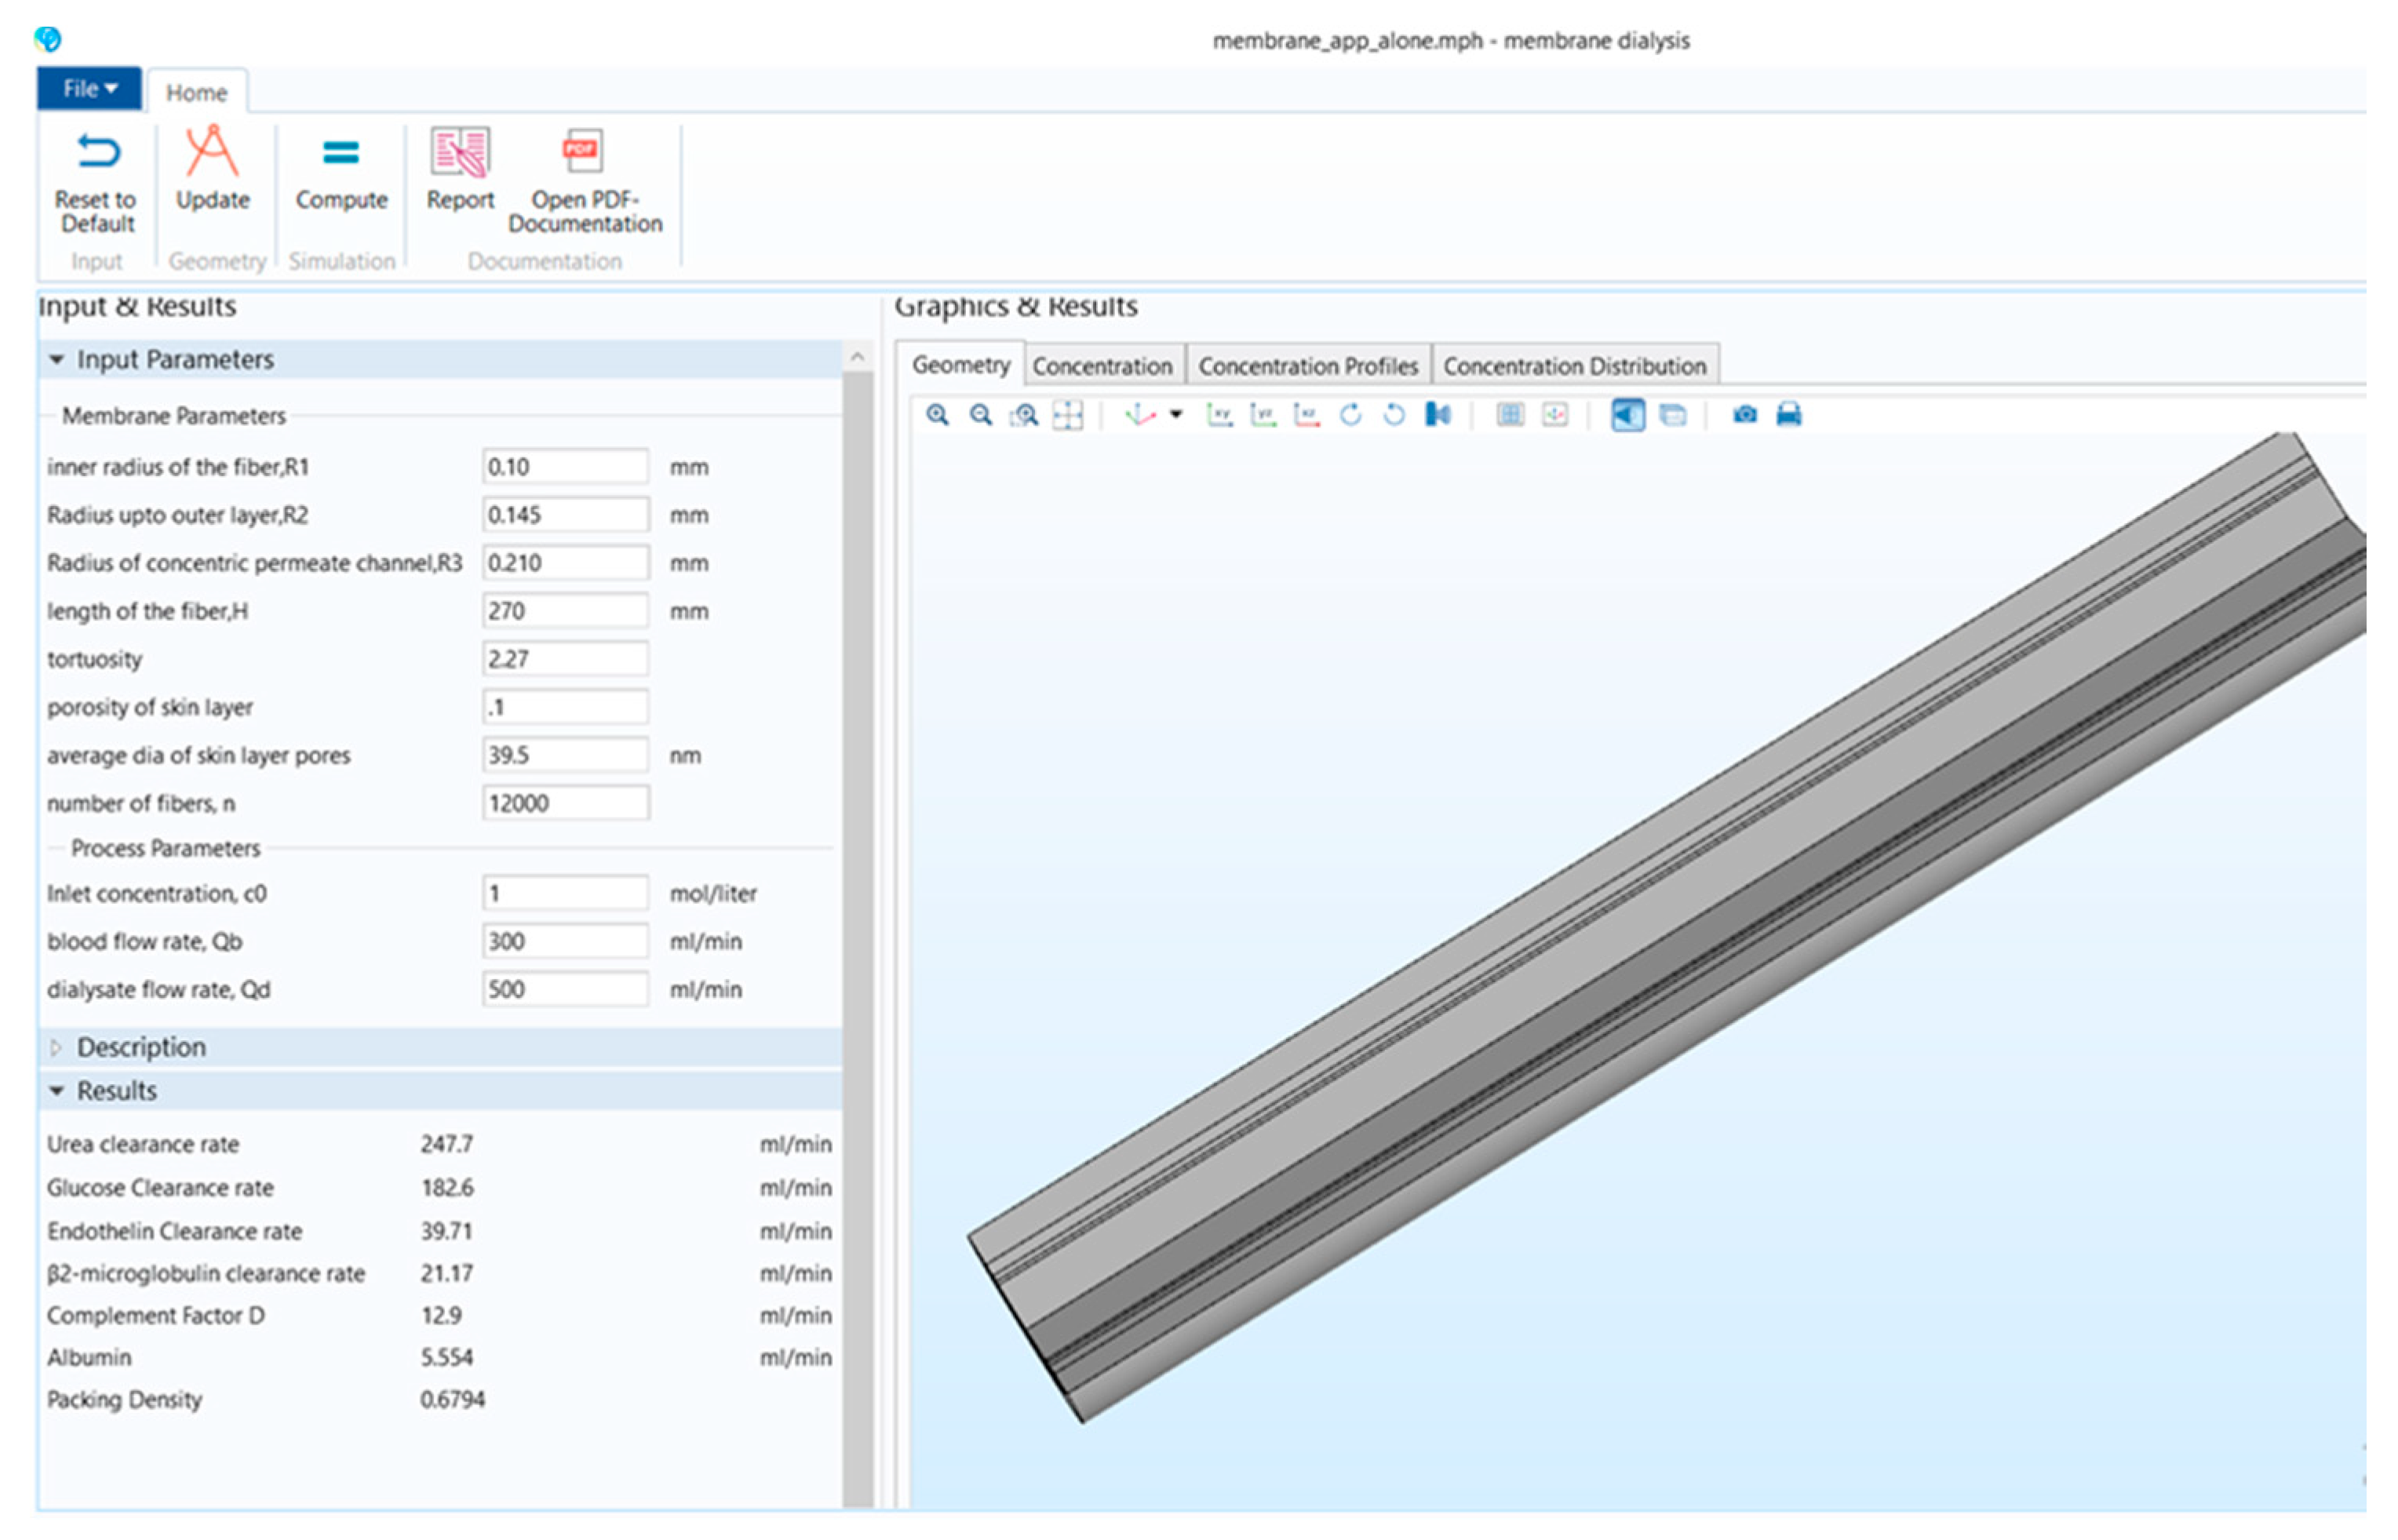
| Input Parameters | Values | Units |
|---|---|---|
| Membrane Parameters | ||
| Inner radius of the fiber (R1) | 0.10 | mm |
| Radius up to outer layer (R2) | 0.145 | mm |
| Radius of concentric permeate channel (R3) | 0.210 | mm |
| Length of the fiber (H) | 270 | mm |
| Tortuosity | 2.27 | |
| Porosity of skin layer | 0.1 | |
| Average diameter of skin layer pores | 39.5 | mm |
| Number of fibers (n) | 12,000 | |
| Process Parameters | ||
| Inlet concentration (c0) | 1 | mol/L |
| Blood flow rate (Qb) | 300 | mol/L |
| Dialysate flow rate (Qd) | 500 | mol/L |
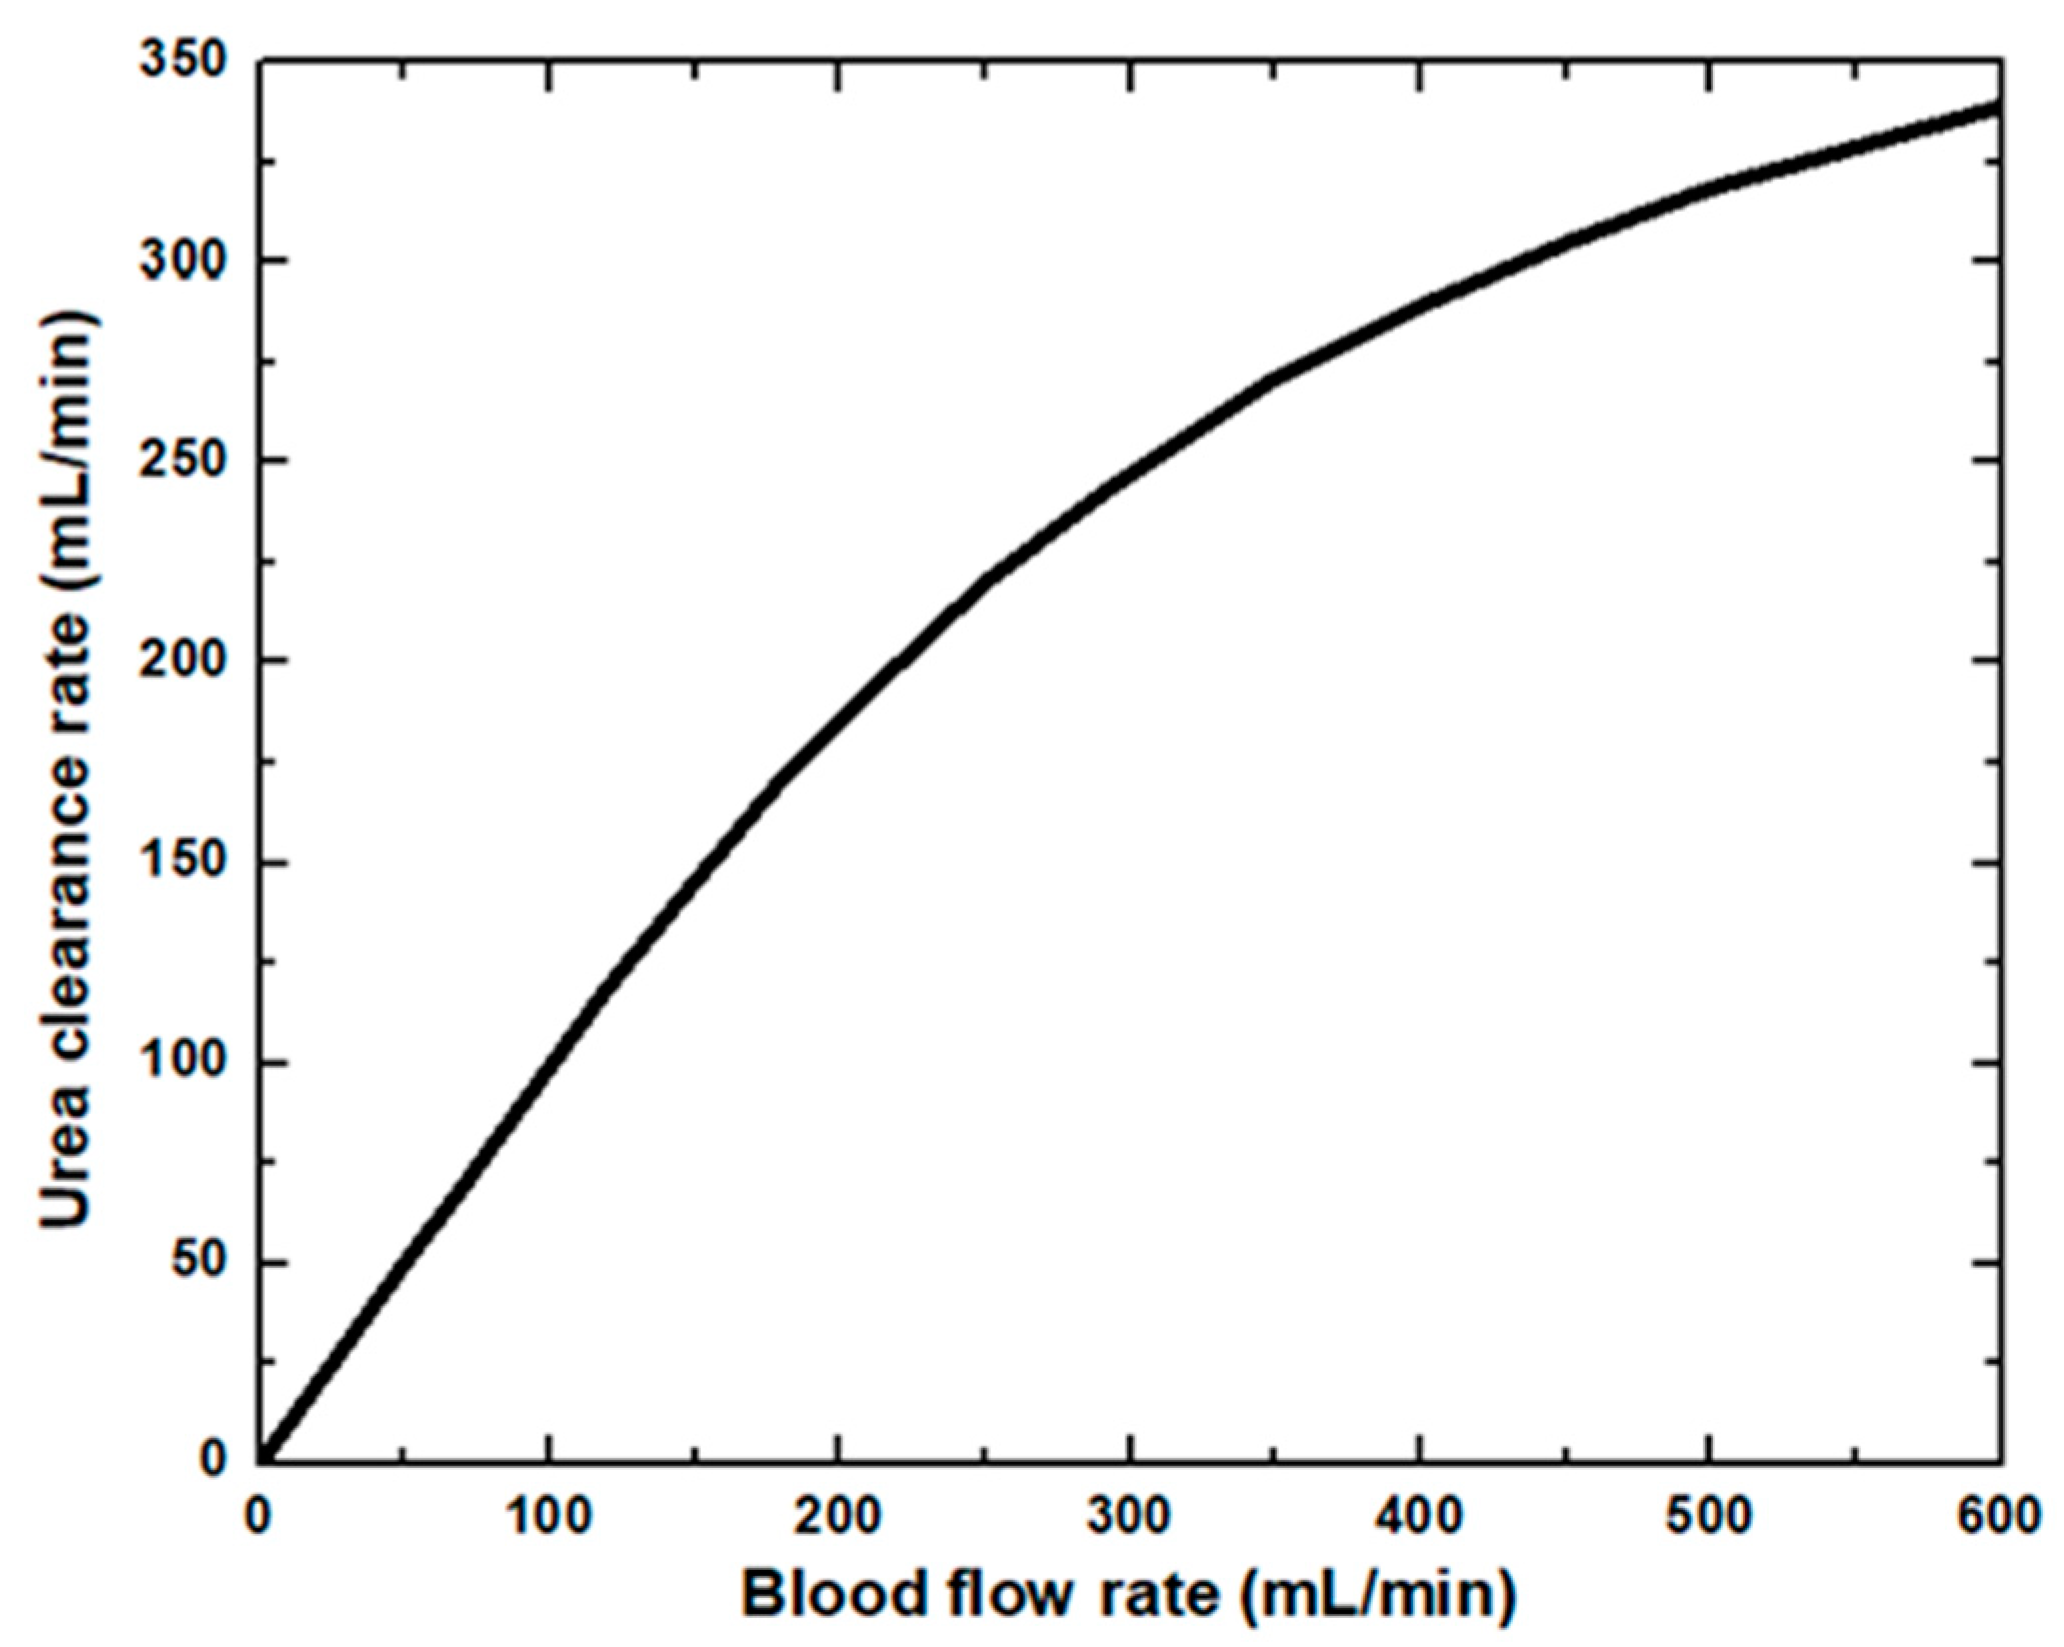
| Blood Flow Rate (mL/min) | Urea Clearance Rate [15] (mL/min) | Urea Clearance Rate [This Study] (mL/min) | Difference (%) | Glucose Clearance Rate [15] (mL/min) | Glucose Clearance Rate [This Study] (mL/min) | Difference (%) |
|---|---|---|---|---|---|---|
| 200 | 187 | 186.2 | 0.43 | 151 | 152.5 | 0.99 |
| 250 | 218 | 220 | 0.92 | 170 | 169.8 | 0.12 |
| 300 | 245 | 247.8 | 1.14 | 183 | 182.6 | 0.22 |
| 350 | 269 | 270.6 | 0.59 | 195 | 192.5 | 1.28 |
| 400 | 288 | 289.5 | 0.52 | 203 | 200.2 | 1.38 |
| 450 | 305 | 305.2 | 0.07 | 209 | 206.2 | 1.34 |
| 500 | 340 | 318.4 | 6.35 | 215 | 211 | 1.86 |
| 550 | 330 | 329.7 | 0.09 | 219 | 214.9 | 1.87 |
| 600 | 340 | 339.3 | 0.21 | 224 | 218.1 | 2.63 |
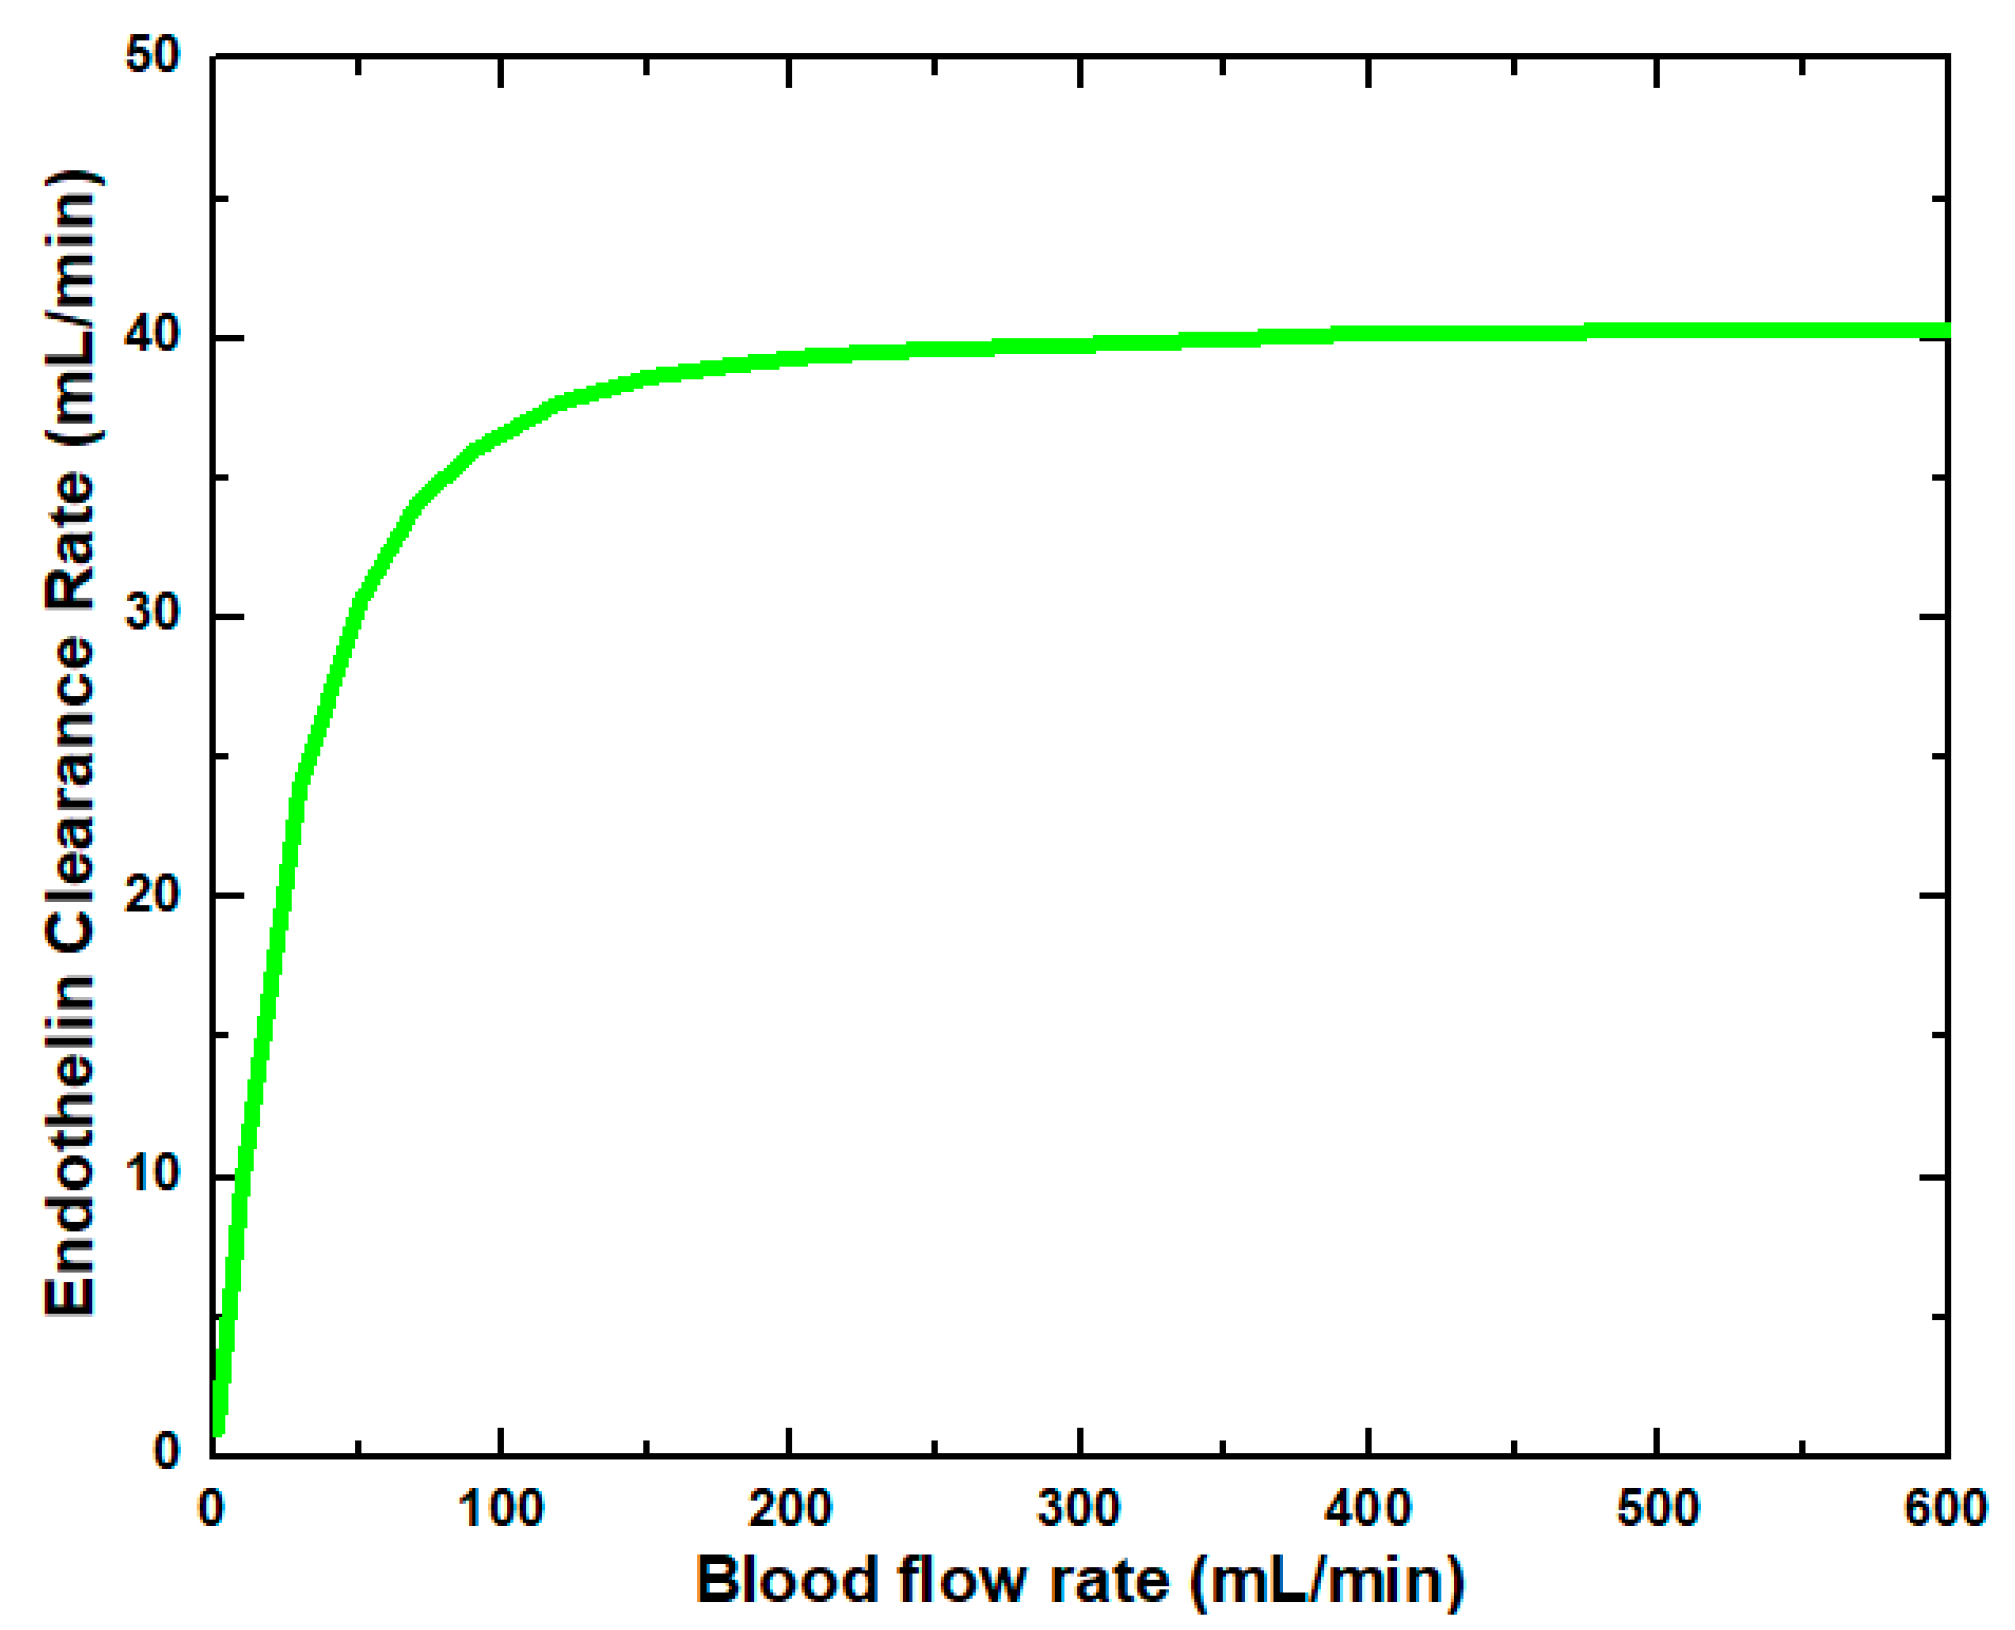
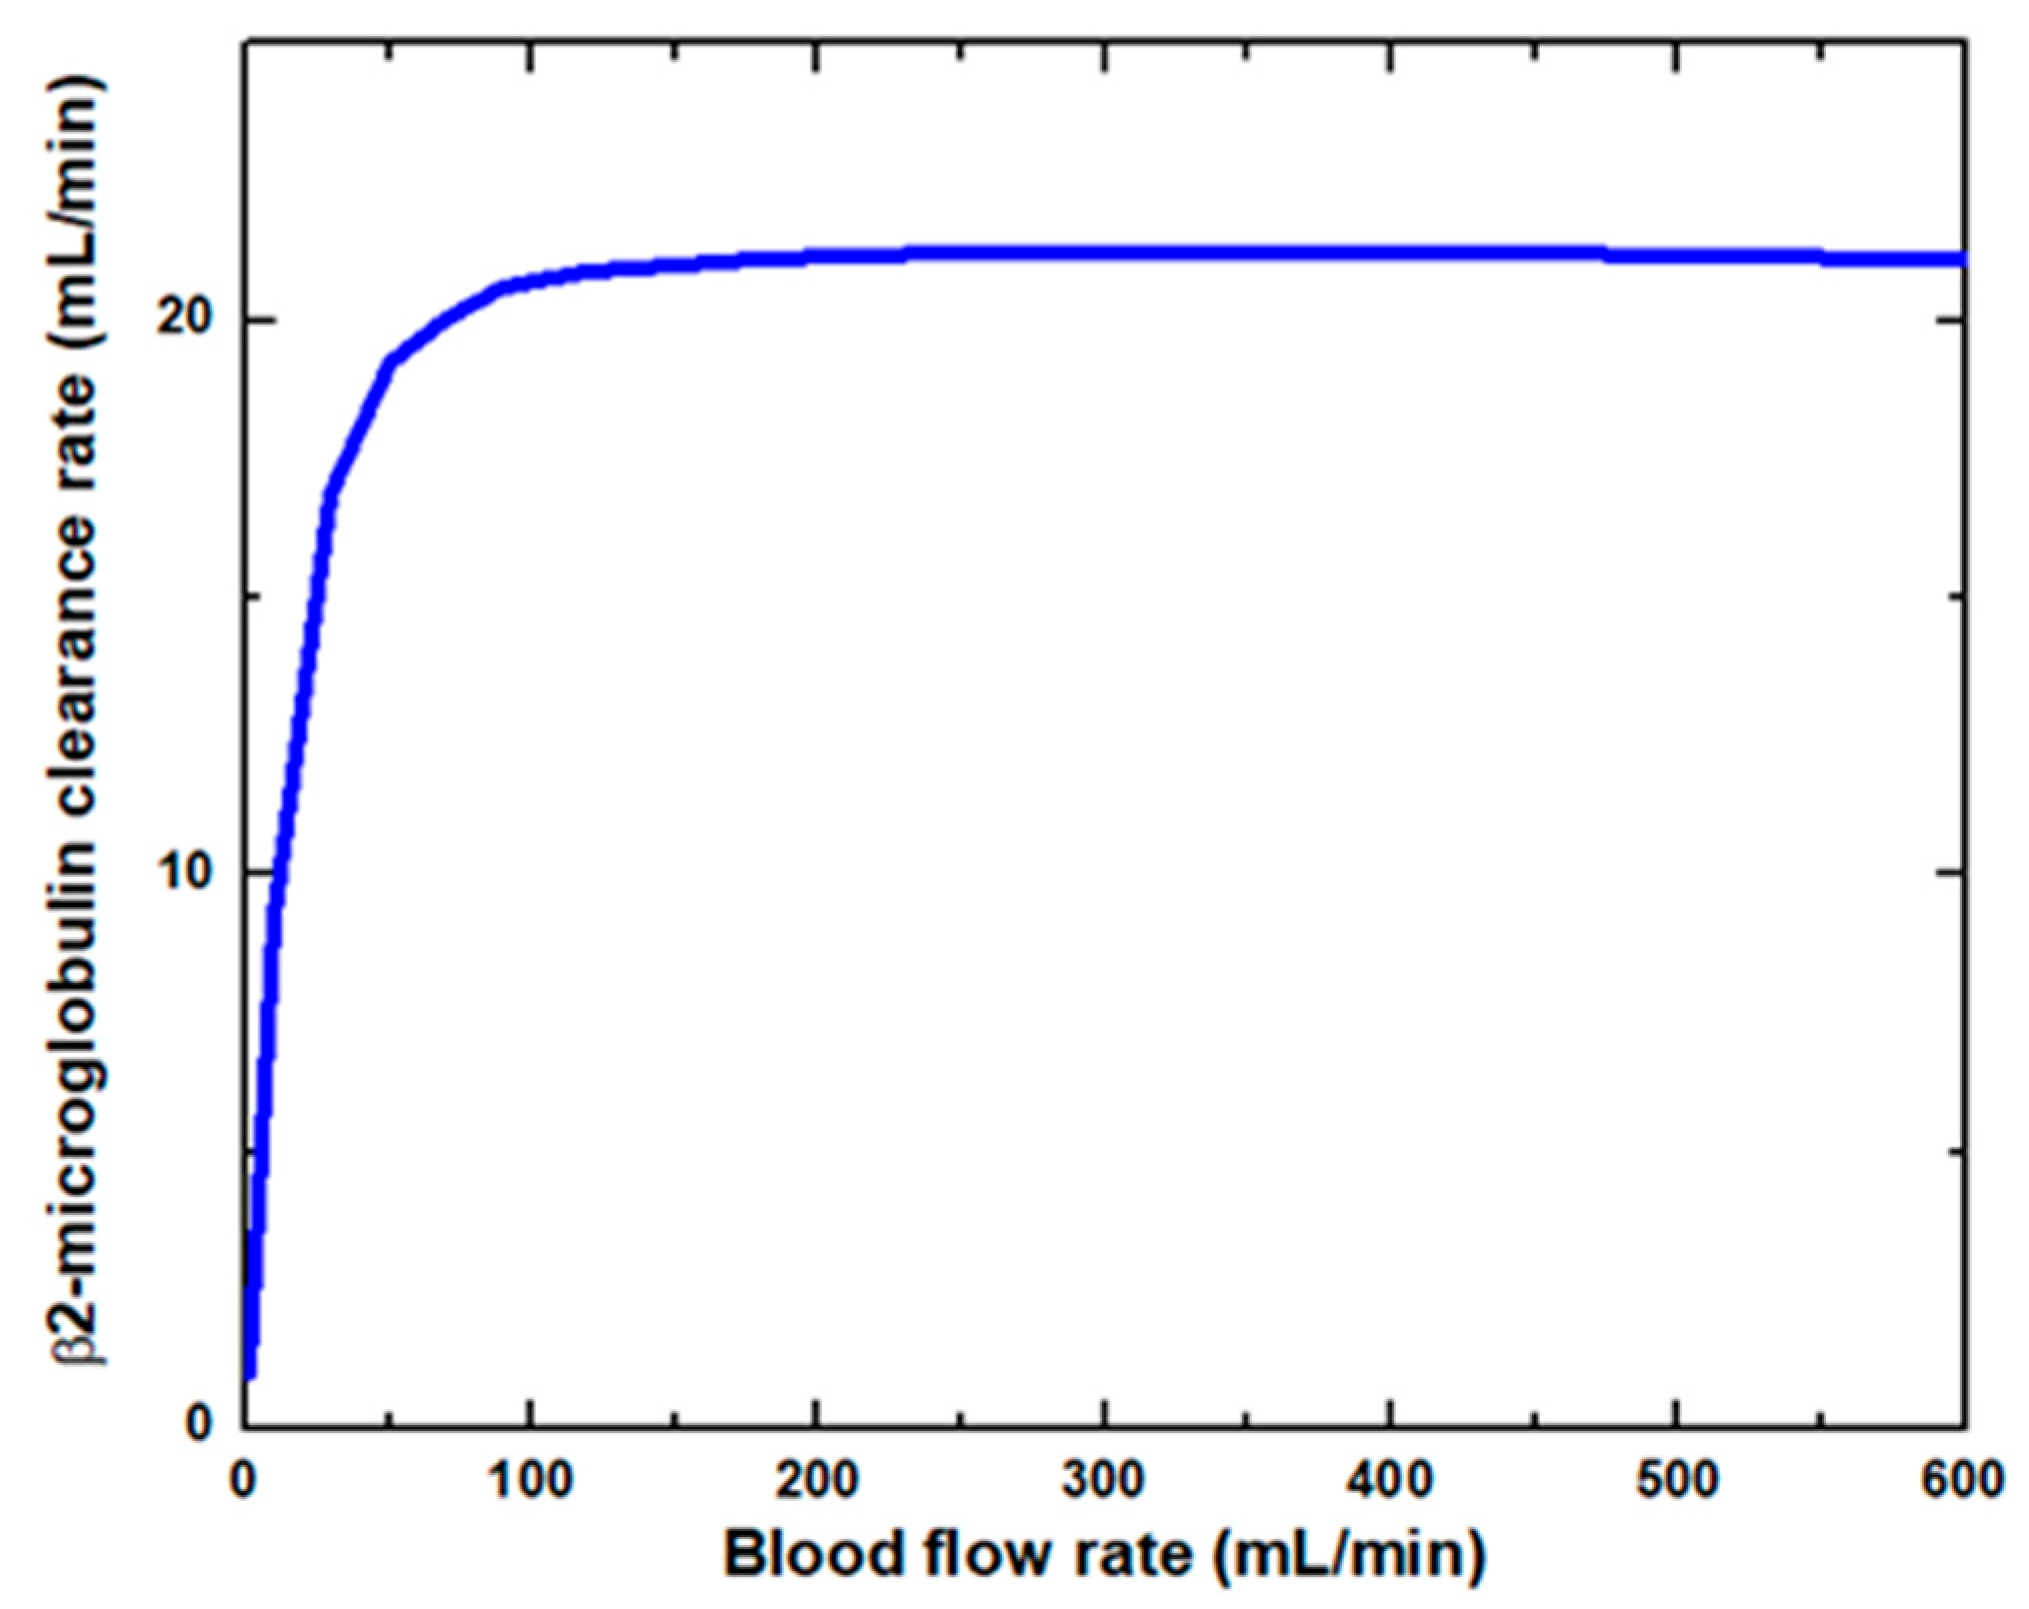
| Dialysate Flow Rate (mL/min) | Endothelin Clearance Rate [15] (mL/min) | Endothelin Clearance Rate [This Study] (mL/min) | Difference (%) | β2-Microglobulin Clearance Rate [15] (mL/min) | β2-Microglobulin Clearance Rate [This Study] (mL/min) | Difference (%) |
|---|---|---|---|---|---|---|
| 200 | 42.8 | 38.95 | 9.00 | 24.07 | 20.63 | 14.29 |
| 300 | 43.55 | 39.51 | 9.28 | 24.32 | 20.89 | 14.10 |
| 400 | 43.67 | 39.86 | 8.72 | 24.57 | 21.08 | 14.20 |
| 500 | 43.8 | 40.14 | 8.36 | 24.32 | 21.22 | 12.75 |
| 600 | 43.8 | 40.39 | 7.79 | 24.69 | 21.32 | 13.65 |
| 700 | 44.04 | 40.59 | 7.83 | 24.81 | 21.4 | 13.74 |
| Data Summary (Urea Clearance Rate) | |||||
|---|---|---|---|---|---|
| Groups | N | Mean | Std. Dev. | Std. Error | |
| Group 1 (Urea clearance rate [15] (mL/min)) | 9 | 280.2222 | 55.0313 | 18.3438 | |
| Group 2 Urea clearance rate [This study] (mL/min)) | 9 | 278.5222 | 52.0702 | 17.3567 | |
| ANOVA Summary (urea clearance rate) | |||||
| Source | Degrees of Freedom DF | Sum of Squares SS | Mean Square MS | F-Statistics Value | p-Value |
| Between Groups | 1 | 13.005 | 13.005 | 0.0045 | 0.9472 |
| Within Groups | 16 | 45,917.9977 | 2869.8749 | ||
| Total: | 17 | 45,931.0027 | |||
| Data Summary (Glucose Clearance Rate) | |||||
|---|---|---|---|---|---|
| Groups | N | Mean | Std. Dev. | Std. Error | |
| Group 1 (Glucose clearance rate [15] (mL/min)) | 9 | 196.5556 | 24.3932 | 8.1311 | |
| Group 2 (Glucose clearance rate [This study] (mL/min)) | 9 | 194.2 | 22.1744 | 7.3915 | |
| ANOVA Summary (Urea clearance rate) | |||||
| Source | Degrees of Freedom DF | Sum of Squares SS | Mean Square MS | F-Statistics Value | p-Value |
| Between Groups | 1 | 24.9698 | 24.9698 | 0.046 | 0.833 |
| Within Groups | 16 | 8693.8578 | 543.3661 | ||
| Total: | 17 | 8718.8276 | |||
Publisher’s Note: MDPI stays neutral with regard to jurisdictional claims in published maps and institutional affiliations. |
© 2021 by the authors. Licensee MDPI, Basel, Switzerland. This article is an open access article distributed under the terms and conditions of the Creative Commons Attribution (CC BY) license (https://creativecommons.org/licenses/by/4.0/).
Share and Cite
Yaqoob, T.; Ahsan, M.; Farrukh, S.; Ahmad, I. Design and Development of a Computational Tool for a Dialyzer by Using Computational Fluid Dynamic (CFD) Model. Membranes 2021, 11, 916. https://doi.org/10.3390/membranes11120916
Yaqoob T, Ahsan M, Farrukh S, Ahmad I. Design and Development of a Computational Tool for a Dialyzer by Using Computational Fluid Dynamic (CFD) Model. Membranes. 2021; 11(12):916. https://doi.org/10.3390/membranes11120916
Chicago/Turabian StyleYaqoob, Tuba, Muhammad Ahsan, Sarah Farrukh, and Iftikhar Ahmad. 2021. "Design and Development of a Computational Tool for a Dialyzer by Using Computational Fluid Dynamic (CFD) Model" Membranes 11, no. 12: 916. https://doi.org/10.3390/membranes11120916
APA StyleYaqoob, T., Ahsan, M., Farrukh, S., & Ahmad, I. (2021). Design and Development of a Computational Tool for a Dialyzer by Using Computational Fluid Dynamic (CFD) Model. Membranes, 11(12), 916. https://doi.org/10.3390/membranes11120916