1. Introduction
Digital technologies and the COVID pandemic have fueled the digital transformation, forcing changes in the structure of the banking industry’s services and products. A successful transition from the old world to the new one requires a focus on multilevel governance (
Leal Filho et al. 2020;
Awan et al. 2020). The digital transformation has shifted the traditional process to a digital-systematized process, giving rise to a new face to the banking sector. However, using modern equipment and software is only one aspect of digital transformation in banking, as it also involves reviewing the management methods, communications, and organizational culture. Internet banking, innovative ancillary application software and databases have called for and enabled secure 24/7 customer transaction services, enhancing the pace of competition in the sector. Many traditional banks around the world are now digital banks dominated by FinTech trends.
With this increased dissemination of technology, populations are forced to use digitalized banking for their routine transactions. Although this might be seen by some as having various benefits, it is a disruption to the norm to which a bank customer has to become accustomed. This variance means that customers need to make some changes to their routine, changes that constitute a risk to maintaining customer satisfaction at previous levels. Offering digital services or products may not satisfy customers. The competitive advantage depends on many aspects such as providing a hassle-free, personalized and cyber-secure experience, economic aspects and the needs of the society at large. Therefore, there is a need to understand the intensity of the risk factors that influence customer satisfaction for digitalized banking services and products.
The banking industry needs to strengthen and ensure the availability of quality web-based technological services to meet the competition and, at the same time, address customer needs (
Zaidi and Rupeika-Apoga 2021). Consumers and businesses that were previously hesitant to switch to or rely on digital channels now enjoy the convenience and speed they provide, thereby increasing the likelihood that this change in habits will become permanent (
Grima et al. 2020). To do this, it is necessary to rethink all internal processes, focusing on the customers’ satisfaction, and think about how they look and work in a digital environment (
Girlando et al. 2021;
Pavia et al. 2021;
Grima et al. 2021a).
In the simplest of terms, the digitalization of the banking business means that the traditional services offered by banks are now offered through digital means. Amongst these services are transferring funds from one bank account to another; viewing and managing your bank account details; requesting information on transactions carried out; checking your bank account balance; managing your loans; paying bills, etc. Digital banking is expected to provide a convenient, easy and secure way of carrying out banking services from the comfort of your home, any time, from your personal computer or laptop and using the bank’s mobile app on your smartphone or tablet. This increases the speed of completing tasks (
Japparova and Rupeika-Apoga 2017). While customers often confuse the difference between online banking, Internet, e-banking, mobile banking and digital banking, digital banking goes beyond other banking models and requires a comprehensive re-engineering of a bank’s internal systems. Digital banking involves the digitization of every program and activity carried out by financial institutions and their customers. Digital banking is the future, potentially encompassing all digital programs and transactions that have ever been undertaken by a financial institution or the customers they serve. Various regulations and guidelines have and are being enacted to protect against cybersecurity and digital fraud (for example, the Digital Operations Resilience Act, which will come into force in 2022). However, what is the intensity by which the main risk factors affect customer satisfaction? Digitalization has opened up banks to the risk of not meeting client expectations and needs. Clients that are the core of every bank are now being asked to do something different, disrupting their way of life—that is, it involves a new risk since customers are asked to deviate from their norm. Therefore, there is a need to understand the intensity of the risk factors that influence customer satisfaction for digitalized banking services and products to facilitate informed management (
Grima et al. 2021b).
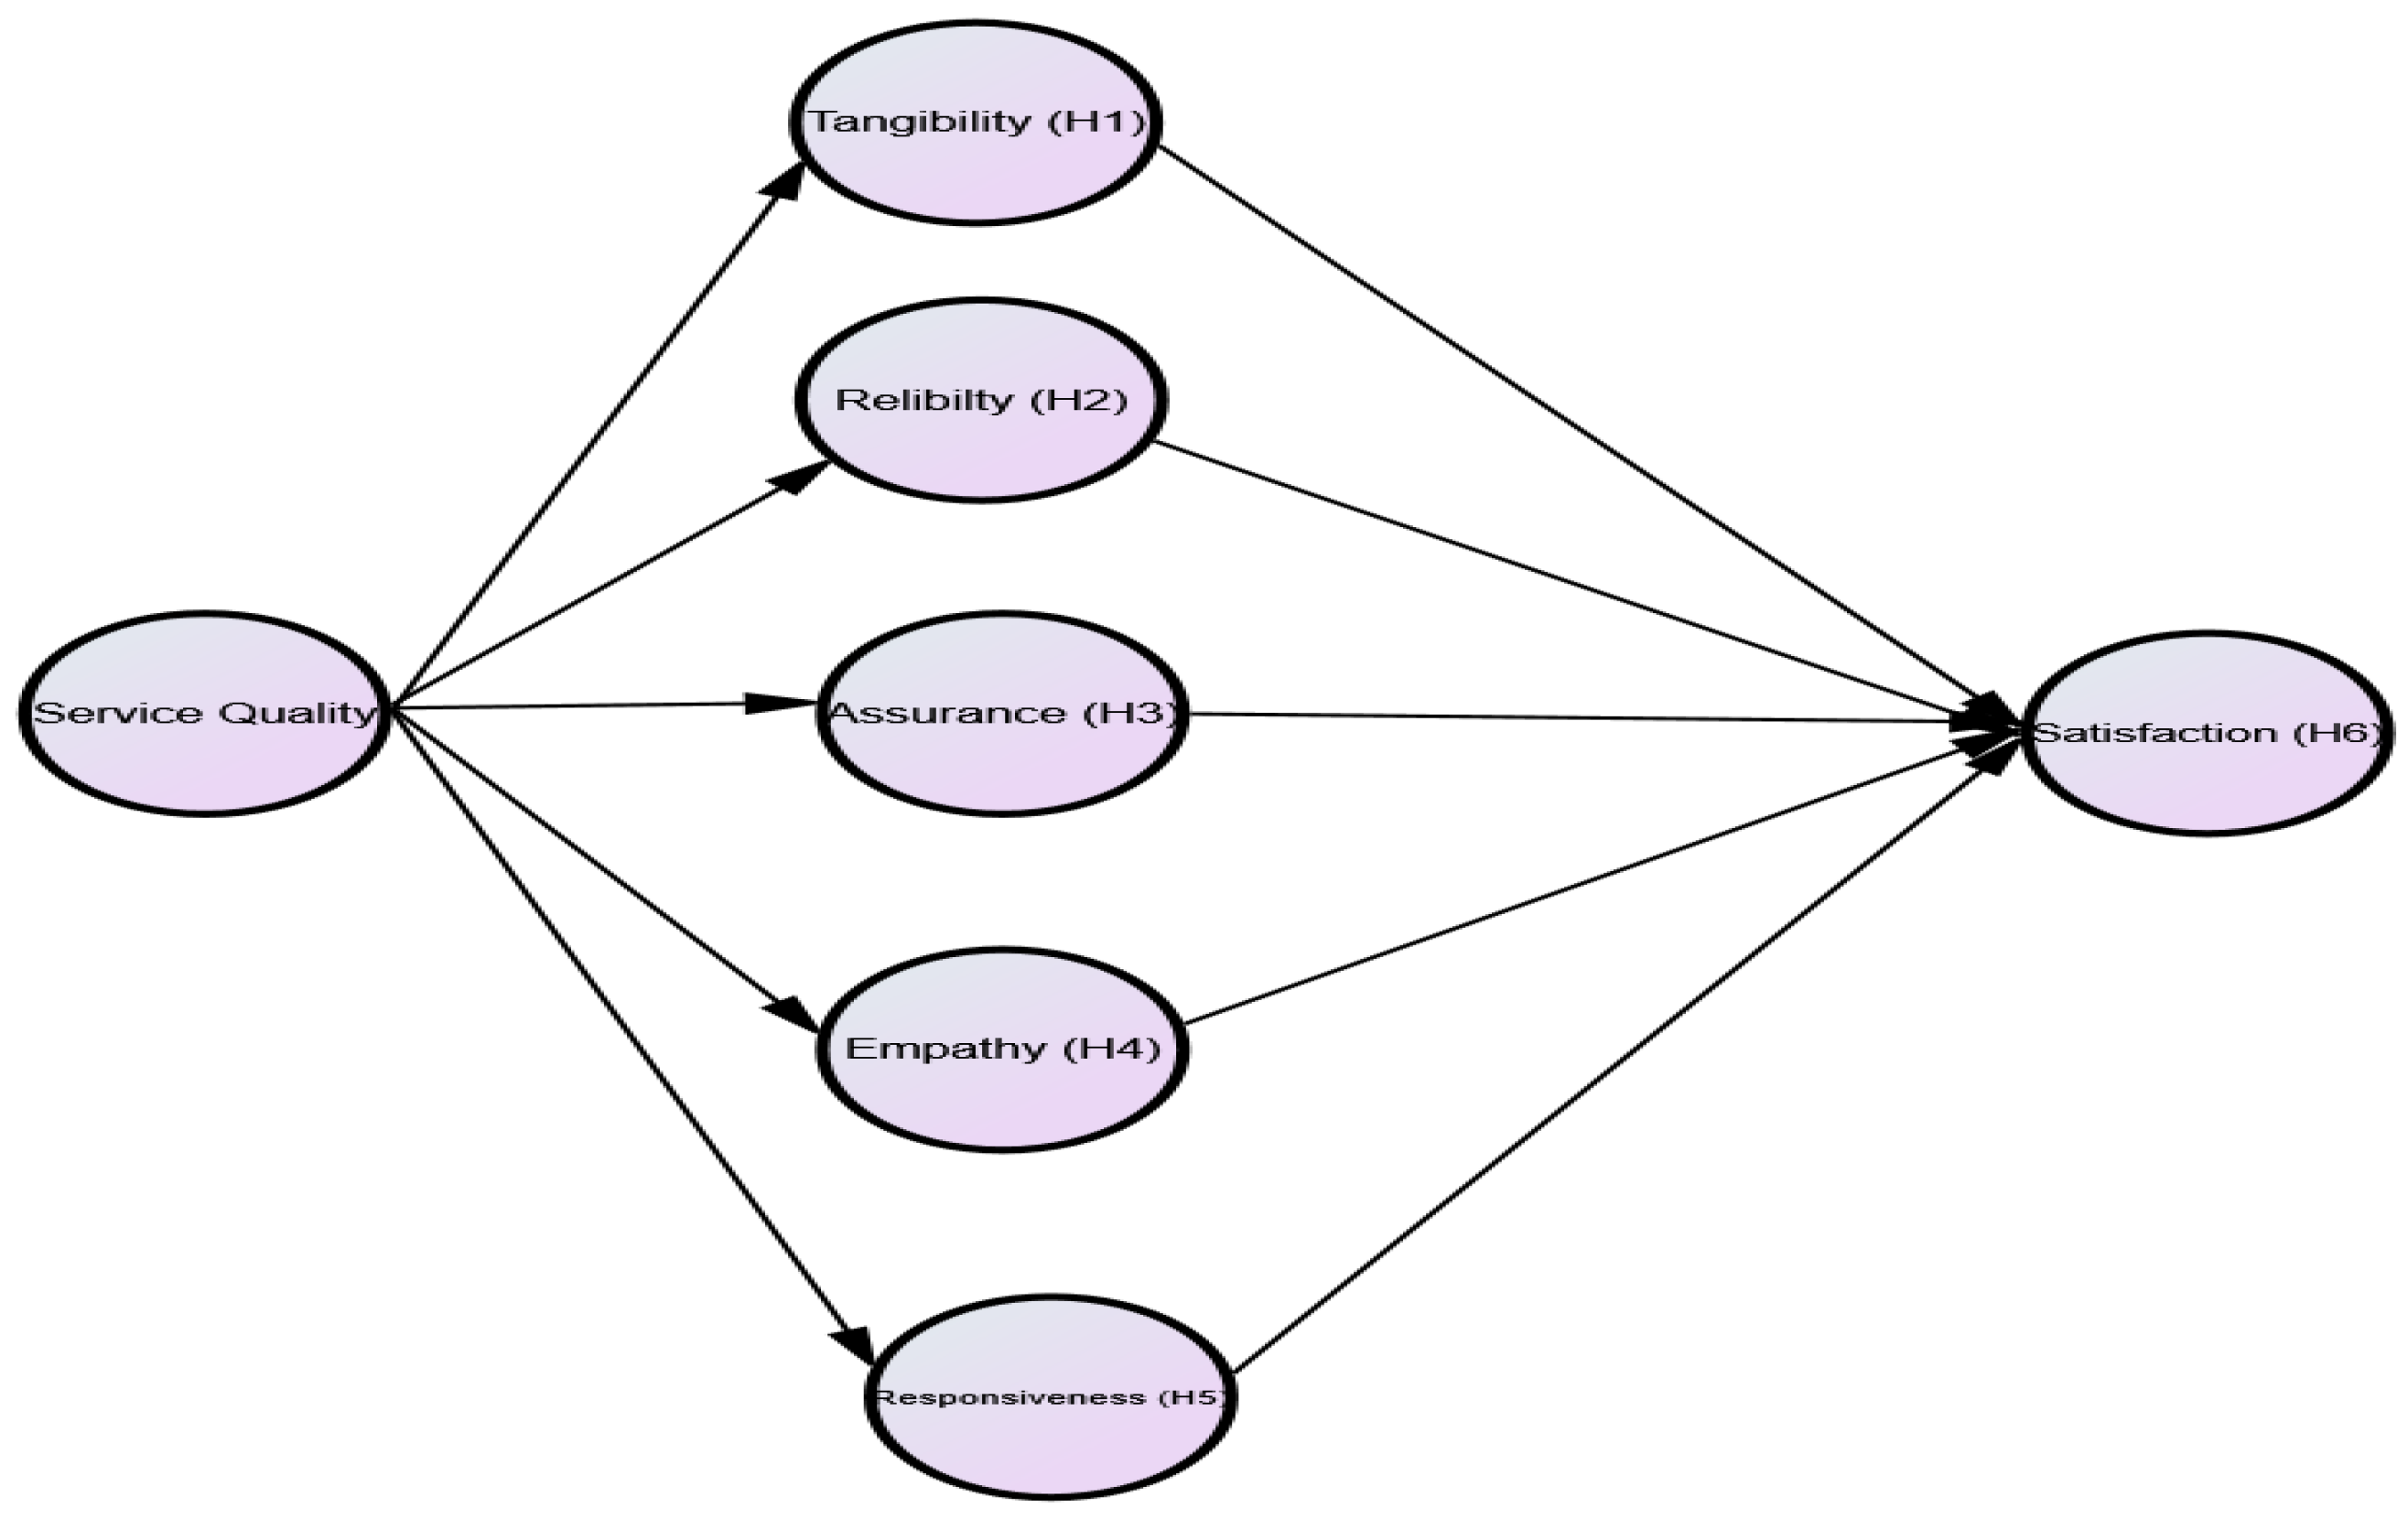
We herein use the SERVQUAL model provided by
Parasuraman et al. (
1988) and
Zeithaml et al. (
1990) to determine the impact intensity of digital banking service quality on customer satisfaction in Northern India, by subjecting it to the five dimensions of service quality suggested in this model; specifically, (1) reliability, (2) assurance, (3) tangibility, (4) empathy and (5) responsiveness. In this study, we seek answers to questions about how the intensity of risk factors affects customer satisfaction with digital banking services and products, applying the five dimensions of service quality.
Research Question (RQ): Which of these five dimensions provide the highest level of risk concerning customer satisfaction?
Risks associated with customer satisfaction arise from the difference between perceived expectations of service and perceived performance of a service, known as quality of service (
Raza et al. 2015;
Toor et al. 2016). This can be defined as the assessment of services provided by the organization to the customers. Service quality is also considered as the judgment of an organization as excellent or superior, based on their performance. It helps in building the perception about the organization’s service in the minds of consumers and assists in retaining a corporate image, catching the attention of new customers and maintaining the profitability position of an organization. Usually, consumers tend to purchase goods and hire services from specific stores and specific experts because they are assured of receiving the best products and services. This creates a level of trust and loyalty among the consumers. The term service quality can also be defined as fulfilling the expectations and needs of the consumers as per their perception and it can be measured through ten major dimensions: Communication, Credibility, Security, Tangibles, Reliability, Responsiveness, Competence, Courtesy, Understanding, and Access (
Parasuraman et al. 1988).
This study aims to fill the gap in the literature on understanding the intensity of the risk factors that influence customer satisfaction for digitalized banking services and products, in a way that facilitates informed management. While the five dimensions of SERVQUAL have become popular and widely used, this framework has also received many theoretical and practical criticisms. Several authors have recently tried to modify the classical model by adding new dimensions (
Zouari and Abdelhedi 2021;
Carrasco et al. 2012;
Tumsekcali et al. 2021;
Lizarelli et al. 2021). We use SERVQUAL to confirm that the classical five dimensions show a statistical relationship with customer satisfaction in the new digital age.
In addition, this study also takes into account the national dimension, as different cultures may relate differently to customer satisfaction (
Pakurár et al. 2019;
Zouari and Abdelhedi 2021). This study adds to the literature on customer satisfaction in the context of the banking sector in the digital age by taking a practical view of the situation of the banks in Northern India. Our findings have practical implications for risk managers, banking practitioners, policymakers and marketing personnel.
We found that customers in the northern region of India are genuinely satisfied with the quality of services provided by banks involved in the digital transformation. Overall, the results of the study show that ‘Reliability’ has a strong impact on customer satisfaction, followed by ‘Tangibility’ and ‘Responsiveness’. Therefore, risk managers and policymakers should give increased attention to these SERVQUAL dimensions when designing or digitalizing new services and products. The study also suggests that all banks should provide accurate, reliable information; timely updates; maintenance of accounts; and error-free transactions while providing digital banking services. In addition, the bank needs to work on providing services that are easy, convenient and visually appealing with error-free transactions to enhance tangibility and responsiveness.
The structure of this paper is as follows. The next section,
Section 2, provides a review of the literature and formulation of the hypotheses. In
Section 3, we explain the methodology; in
Section 4, we lay out the results and findings. Subsequently, in
Section 5, we discuss the findings and conclude.
2. Theoretical Background and Hypotheses
Digital transformation is a process that recognizes that the digital landscape will always change and that consumer expectations will evolve with the landscape’s ability to deliver consistently better results, leading to superior customer satisfaction. Digital technologies have changed consumer habits. Mobile devices, apps, machine learning, automation, and more allow customers to get what they want, virtually the moment they need it. Digital transformation is the integration of digital technology across all areas of the business, revolutionizing the way they work and deliver value to their customers. These new digital technologies have changed customer expectations, resulting in a new type of modern shopper. Today’s consumers are constantly connected, have their applications, and know what they can do with technology (
Rupeika-Apoga and Wendt 2021;
Laidroo et al. 2021).
Digital transformation requires banks to rethink how they interact with their customers and how they are going to meet growing customer needs. As a result, a natural question arises: What models and methods can be used to measure changing customer satisfaction?
In the banking sector, the SERVQUAL model is widely used to measure service quality, which compares the expectations of customers before receiving a service and their perception of actual service delivery (
Carrasco et al. 2012;
Zhou et al. 2021;
Dinçer et al. 2019). SERVQUAL views service quality as an overall assessment of an organization by clients in relation to the quality of the services provided.
Tangibility deals with the physical aspects and represents the appearance of physical facilities, equipment, personnel and communication resources (
Toor et al. 2016). Examples of this aspect in relation to banking include the appearance of bank statements, website design, updated equipment, and staff dealings. Tangibility helps in maintaining a contact between the employee and customer, which ultimately helps enhance the level of customer satisfaction (
Lau et al. 2013).
Reliability represents the ability to perform the services as promised or maintain the same service quality over a period. Reliability helps in maintaining the reputation among consumers, by providing the promised services—for example, error-free transactions and timely updates of accounts. It helps in building trust and confidence among consumers (
Lau et al. 2013).
Assurance deals with ensuring safety, freedom from risk and building trust among consumers (
Rijwani et al. 2017). Banks should be able to provide a commitment to ensure the safety of customer monies, and a clear explanation must be given to the consumers regarding the insurance policies, margins and other services so that consumers are able to feel confident about the services provided (
Lau et al. 2013).
Empathy means giving individual attention to the consumers (
Rijwani et al. 2017). Banks need to cater for the different problems and needs of their customers. Knowledgeable employees must be employed to solve customer problems quickly. Dealing with customer problems is considered as one of the success factors of the service industry (
Lau et al. 2013).
Responsiveness represents responsiveness to consumers, willingness to help them and providing quick services, which ultimately helps gain customer satisfaction (
Toor et al. 2016).
People are using digital services as a new medium to cater for their daily requirements. The first time adoption of digital banking started in Finland with the use of the Automatic Teller Machine (
Worku et al. 2016). The majority of today’s banks provide digital banking facilities as per the needs and requirements of the customers to gain customer satisfaction and enhance their service quality.
Customer satisfaction means meeting the requirements of the customer as per their expectations. Generally, the customer has certain expectations while purchasing a product or hiring a service. If the service or a product meets the expectations of the consumers, ultimately, this leads to a happier and more satisfied customer. If the value of the services delivered is less than or not equal to the expectations of the customers, this leads to dissatisfaction among the consumers (
Toor et al. 2016).
Customer satisfaction brings along loyalty among the consumers, which ultimately helps to gain market shares. If an organization wants its customer to be satisfied, it must understand the needs and expectations of its customers and perform accordingly. Dissatisfaction among customers regarding the product or service will result in a negative impact on the organization, damaging the image of the company and resulting in losing its best employees.
A study by
Karjaluoto et al. (
2002) in Finland identified the different factors that influence customer behavior and attitude formation towards online banking. This study was carried out through the provision of a questionnaire, which resulted in 1167 valid responses. They studied attitude formation using a structural equation model. Results of the study indicated that the most important factor behind the formation of attitude towards online banking is knowledge regarding Information Technology (IT). Knowledge regarding IT is a tangibility aspect.
Raza et al. (
2015) conducted research on internet banking and the level of customer satisfaction in Pakistan using the SERVQUAL model to understand the impact of service quality on customer satisfaction. They collected data from 400 respondents from Karachi city, Pakistan. The respondents were specifically chosen from internet banking users. Inferences have been drawn from the specific study that there exists a positive and direct relationship between reliability, responsiveness and tangibility, and customer satisfaction, whereas empathy had shown less of an effect on customer satisfaction. The researchers emphasized the management of internet banking to take effective measures to make websites more visually appealing and to increase the security and safety of digital information related to all bank accounts.
Chingang Nde and Lukong (
2010), on the other hand, found that the SERVQUAL model is not the best measuring tool when it comes to measuring service quality in grocery stores. This is since the dimensions do not accurately measure the construct in that context. Meanwhile,
Lizarelli et al. (
2021) propose an integrative framework involving SERVQUAL, Analytical Kano (A-Kano), and QFD using fuzzy approaches (Fuzzy Inference System and 2-tuple fuzzy linguistic representation) to design and improve services.
Zouari and Abdelhedi (
2021) propose adding two new dimensions to the existing SERVQUAL model of five dimensions: digitalization and compliance. Although their outcomes lend support to the extended SERVQUAL model, the results are derived based on a relatively average sample size in one country (Tunisia).
Tumsekcali et al. (
2021) extended the SERVQUAL model with two new criteria related to Industry 4.0 and the pandemic to understand and evaluate the service quality of public transport systems.
Awasthi et al. (
2011) presented a hybrid approach based on SERVQUAL and fuzzy TOPSIS for evaluating the service quality of urban transportation systems. This study focuses on determining the dominant and less important dimension/s of the SERVQUAL model that provide the highest level of risk with regard to customer satisfaction. We investigate the impact of five dimensions of service quality on customer satisfaction: reliability, assurance, tangibility, empathy and responsiveness.
Hypothesis 1 (H1). Tangibility has a significant impact on customer satisfaction in Digital Banking.
The above hypothesis has been framed based on the works of the following researchers:
Amin (
2016) has examined the service quality of internet banking and the impact of service quality on customer loyalty and the level of customer satisfaction. The study involved a sample size of 520 respondents of Riyadh, Kingdom of Saudi Arabia. The study revealed that all the dimensions, i.e., personal needs, user-friendliness, site organization and efficiency of websites, have a positive relationship with service quality.
Chong et al. (
2010) have empirically identified the factors that have an impact on the adoption of online banking in Vietnam. They collected sample data of 103 respondents and analyzed them using multiple regression analysis and correlation. The study revealed that factors such as trust, perceived usefulness and government support were significant.
Hypothesis 2 (H2). Reliability has a significant impact on customer satisfaction in Digital Banking.
The above hypothesis has been framed based on the works of the following researchers:
Ozretic-Dosen and Zizak (
2015) critically examined the quality of banking services using the SERVQUAL model by collecting data from 200 students in Zagreb, Croatia. The study revealed that management needs to improve the banking services in the major dimensions, i.e., reliability, assurance and responsiveness.
Loonam and O’Loughlin (
2008) conducted an exploratory study on the e-service quality of banking in Ireland. To fulfil the objective of the study, semi-structured interviews were carried out with digital banking customers selected by using a purposive sample technique. Results of the study revealed that the factors that are more important for digital banking services are trust, access, web usability and flexibility.
Kuisma et al. (
2007) performed research in Finland to identify the reasons behind consumers’ resistance to internet banking. They carried out in-depth interviews with 30 respondents. Findings of the study indicated that the major reasons behind resistance to internet banking are resistance to innovation, feeling of insecurity and lack of information.
Hypothesis 3 (H3). Assurance has a significant impact on customer satisfaction in Digital Banking.
The above hypothesis has been framed based on the works of the following researchers:
Laforet and Li (
2005) carried out a study on understanding market status, and targeted customers and consumer attitudes regarding online banking and mobile banking in China. Data were collected from 300 respondents through questionnaires. The results of the study showed that, in China, the most targeted customers are males rather than females. Perception of risk, knowledge about IT, lack of awareness and understanding among customers were considered as the most important barriers towards online banking.
An empirical study conducted by
Sohail and Shanmugham (
2003) to examine the current trends in e-banking in Malaysia on a sample size of 300 revealed that digital accessibility, e-banking awareness and resistance from consumers are some of the factors that affected the usage of digital banking in Malaysia.
Hypothesis 4 (H4). The empathy aspect has a significant impact on customer satisfaction in Digital Banking.
The above hypothesis has been framed based on the works of the following researchers:
Nui Polatoglu and Ekin (
2001) carried out an exploratory study in Turkey to examine the factors that affect consumers’ and organizations’ acceptance of digital banking. Data were collected from 114 respondents. Two-factor analysis and Cluster analysis were used to analyze the data and results show that internet banking reduces operational costs and leads to high customer satisfaction.
Bauer et al. (
2005) measured the quality of e-banking web portals through an empirical study by constructing a model on the dimensions of cross-buying service quality, security and trust, responsiveness, transaction support, added-value and basic service quality. Through this study, the researchers classified all the dimensions into three different categories: core services, additional services and problem-solving services. Results of the study showed a strong tendency in favor of using web portals as a vital part of providing management solutions regarding e-banking.
Hypothesis 5 (H5). The responsiveness aspect has a significant impact on customer satisfaction in Digital Banking.
The above hypothesis has been framed based on the works of the following researchers:
Rijwani et al. (
2017) performed a study on customers’ satisfaction and the service quality of Indian banking services. The five SERVQUAL dimensions were used by the researchers to examine service quality. They analyzed the data through correlation, regression, reliability analysis and factor analysis to identify the effect of service quality on customer satisfaction. The sample size of the study was 384 respondents. The results of the study identified a direct relationship between service quality and customer satisfaction. Furthermore, it was determined that customer satisfaction was the least affected by reliability but highly dependent upon assurance.
Tharanikaran et al. (
2017) scrutinized the level of customer satisfaction and service quality of electronic banking in the Batticaloa district of Sri Lanka. For the study, data were collected through a questionnaire from 231 respondents. To validate the constructs, unidimensionality, reliability and validity assessments were conducted by the researchers and to test the hypotheses, a one-sample t-test was performed. Results of the study revealed that there is a high degree of service quality and customer satisfaction in the Batticaloa district.
Toor et al. (
2016) investigated the effect of e-banking on customer satisfaction. Data were collected from 264 respondents who are users of e-banking in different cities of Pakistan. The SERVQUAL model, correlation and multiple regression analysis were used to determine the significance level of all the variables for customer satisfaction in e-banking. Results of the study showed a positive relationship between service quality dimensions and customer satisfaction.
Jun and Palacios (
2016) conducted an exploratory study to identify the key dimensions in mobile banking service quality by employing a critical incident technique. The findings of the study indicated that the key dimensions are classified into two categories: mobile banking customer service quality and mobile banking application quality.
Hypothesis 6 (H6). Tangibility, Reliability, Assurance, Empathy and Responsiveness have a significant impact on customer satisfaction in Digital Banking.
Although the SERVQUAL model was developed in 1985, it is still widely used today due to its flexible and universal approach to defining five parameters that influence the overall perception of quality by customers. We believe that reliability, assurance, tangibility, empathy and responsiveness are appropriate metrics for assessing the highest level of risk with regard to customer satisfaction.
3. Data and Methodology
We started by searching for literature in popular databases such as WoS, Scopus, ScienceDirect, Google Scholar and others from 1988 to 2021 using the keywords: SERVQUAL AND Digitalisation OR SERVQUAL AND Banking. As a result, in March 2021, we selected 3707 relevant articles. After applying the PRISMA search strategy (preferred reporting elements for systematic reviews and meta-analysis), 56 literature sources were selected (
Farrugia and Grima 2021).
In order to categorize and organize the findings and results, we reviewed the results, identified duplicates, and used the inclusion and exclusion criteria. We generated tables of articles (n = 56) based on their classification, allowing us to organize them. Manually comparing and contrasting search lists was performed.
By referring to the inclusion/exclusion criteria, we were able to eliminate studies that did not fit our review’s objectives from the search and also discard repeated search items. Our search criteria were determined based on an analysis of the study objectives and a brainstorming session with peers to find the best words to describe the search. We set the search parameters at a high level and used the generic best-fit phrases, which led us to a number of sources. It was understood that if the initial search did not yield significant results, a more narrow syntax would be commissioned. We achieved the most relevant search by implementing a specific syntax, after which we narrowed it to digital banking services customer satisfaction.
We manually checked the results for duplications, removing 2884 articles and screening the remaining 823 using
Braun and Clarke’s (
2006) thematic analysis. Manual screening was conducted to exclude any articles that were not relevant to our study’s scope, resulting in 212 articles, and a second round brought this down to 158 articles. As soon as the qualitative saturation of results was determined (other articles added no value), the repeated article citations were eliminated and we used the best 56 article citations. In this study, we searched and ranked 56 research articles based on their significance and relevance to the study objectives.
We use the SERVQUAL model provided by
Parasuraman et al. (
1988) and
Zeithaml et al. (
1990) to determine the impact intensity of digital banking service quality on customer satisfaction in Northern India, by subjecting it to the five dimensions of service quality suggested in this model; specifically, (1) reliability, (2) assurance, (3) tangibility, (4) empathy and (5) responsiveness. The conceptual framework is summarized in
Figure 1.
To collect data to examine the dimensions of the SERVQUAL model, we created a survey (
Ijadi Maghsoodi et al. 2019;
Awasthi et al. 2011;
Zhou et al. 2021). The survey consisted of 25 statements determined after reviewing the literature on the five dimensions of the SERVQUAL model, as noted in
Table 1, and demographic questions, specifically relating to the respondents’ age, gender, occupation and qualification. The respondents were asked to respond to the 25 statements using a five-point Likert scale in which ‘5’ = Most satisfied/Most likely, ‘4’ = Satisfied/likely, ‘3’ = Neutral, ‘2’ = Dissatisfied/unlikely, ‘1’ = Most dissatisfied/Highly unlikely. We received 222 valid responses, which according to
Hinkin (
1995), is an ideal sample size based on the item-to-response ratio to carry out Structural Equation Modelling, ranging from as low as 1:4 to as high as 1:10 for each scale to be analyzed (i.e., 120–300 responses) (
Deb and Lomo-David 2014;
Hinkin 1995).
The data were collected through a structured survey targeting customers of different banks who are using banking services, between March and June 2021, in the Indian Northern Region. The survey was self-administered over social media such as LinkedIn©, Twitter© and Facebook©; by verbal face-to-face meeting and over the phone; and online communication using Zoom©, MS Teams© and Goto© applications to users of the banking services and products.
We inputted the data into a Microsoft Excel spreadsheet to determine the descriptive frequencies of the participant demographics. We then subjected the other data to Structural Equation Modelling using the Smart PLS (Partial Least Square) version 3 application to determine whether the variables (Tangibility, Reliability, Assurance, Empathy and Responsiveness) have a significant impact on customer satisfaction in digital banking in the Indian banking market.
The resultant 222 sample participants were fairly balanced between males (122) and females (100), with the largest number being between 26 and 40 years of age, followed by those between the age of 18 and 25 (59) and over 41 (28). The majority of respondents were self-employed (105), followed by those who were currently in employment (83), students (21) and others (13). Most of the participants held a post-graduate qualification (140), followed by those with an undergraduate qualification (66) and those with other skills and qualifications (16).
5. Discussion and Conclusions
The purpose of this study is to determine the impact intensity of digital banking service quality on customer satisfaction in the banking sector in North India using the classic five-dimensional SERVQUAL model: specifically, reliability, assurance, tangibility, empathy and responsiveness. We hypothesize and aim to confirm that these five dimensions of the SERVQUAL model have a significant impact on customer satisfaction.
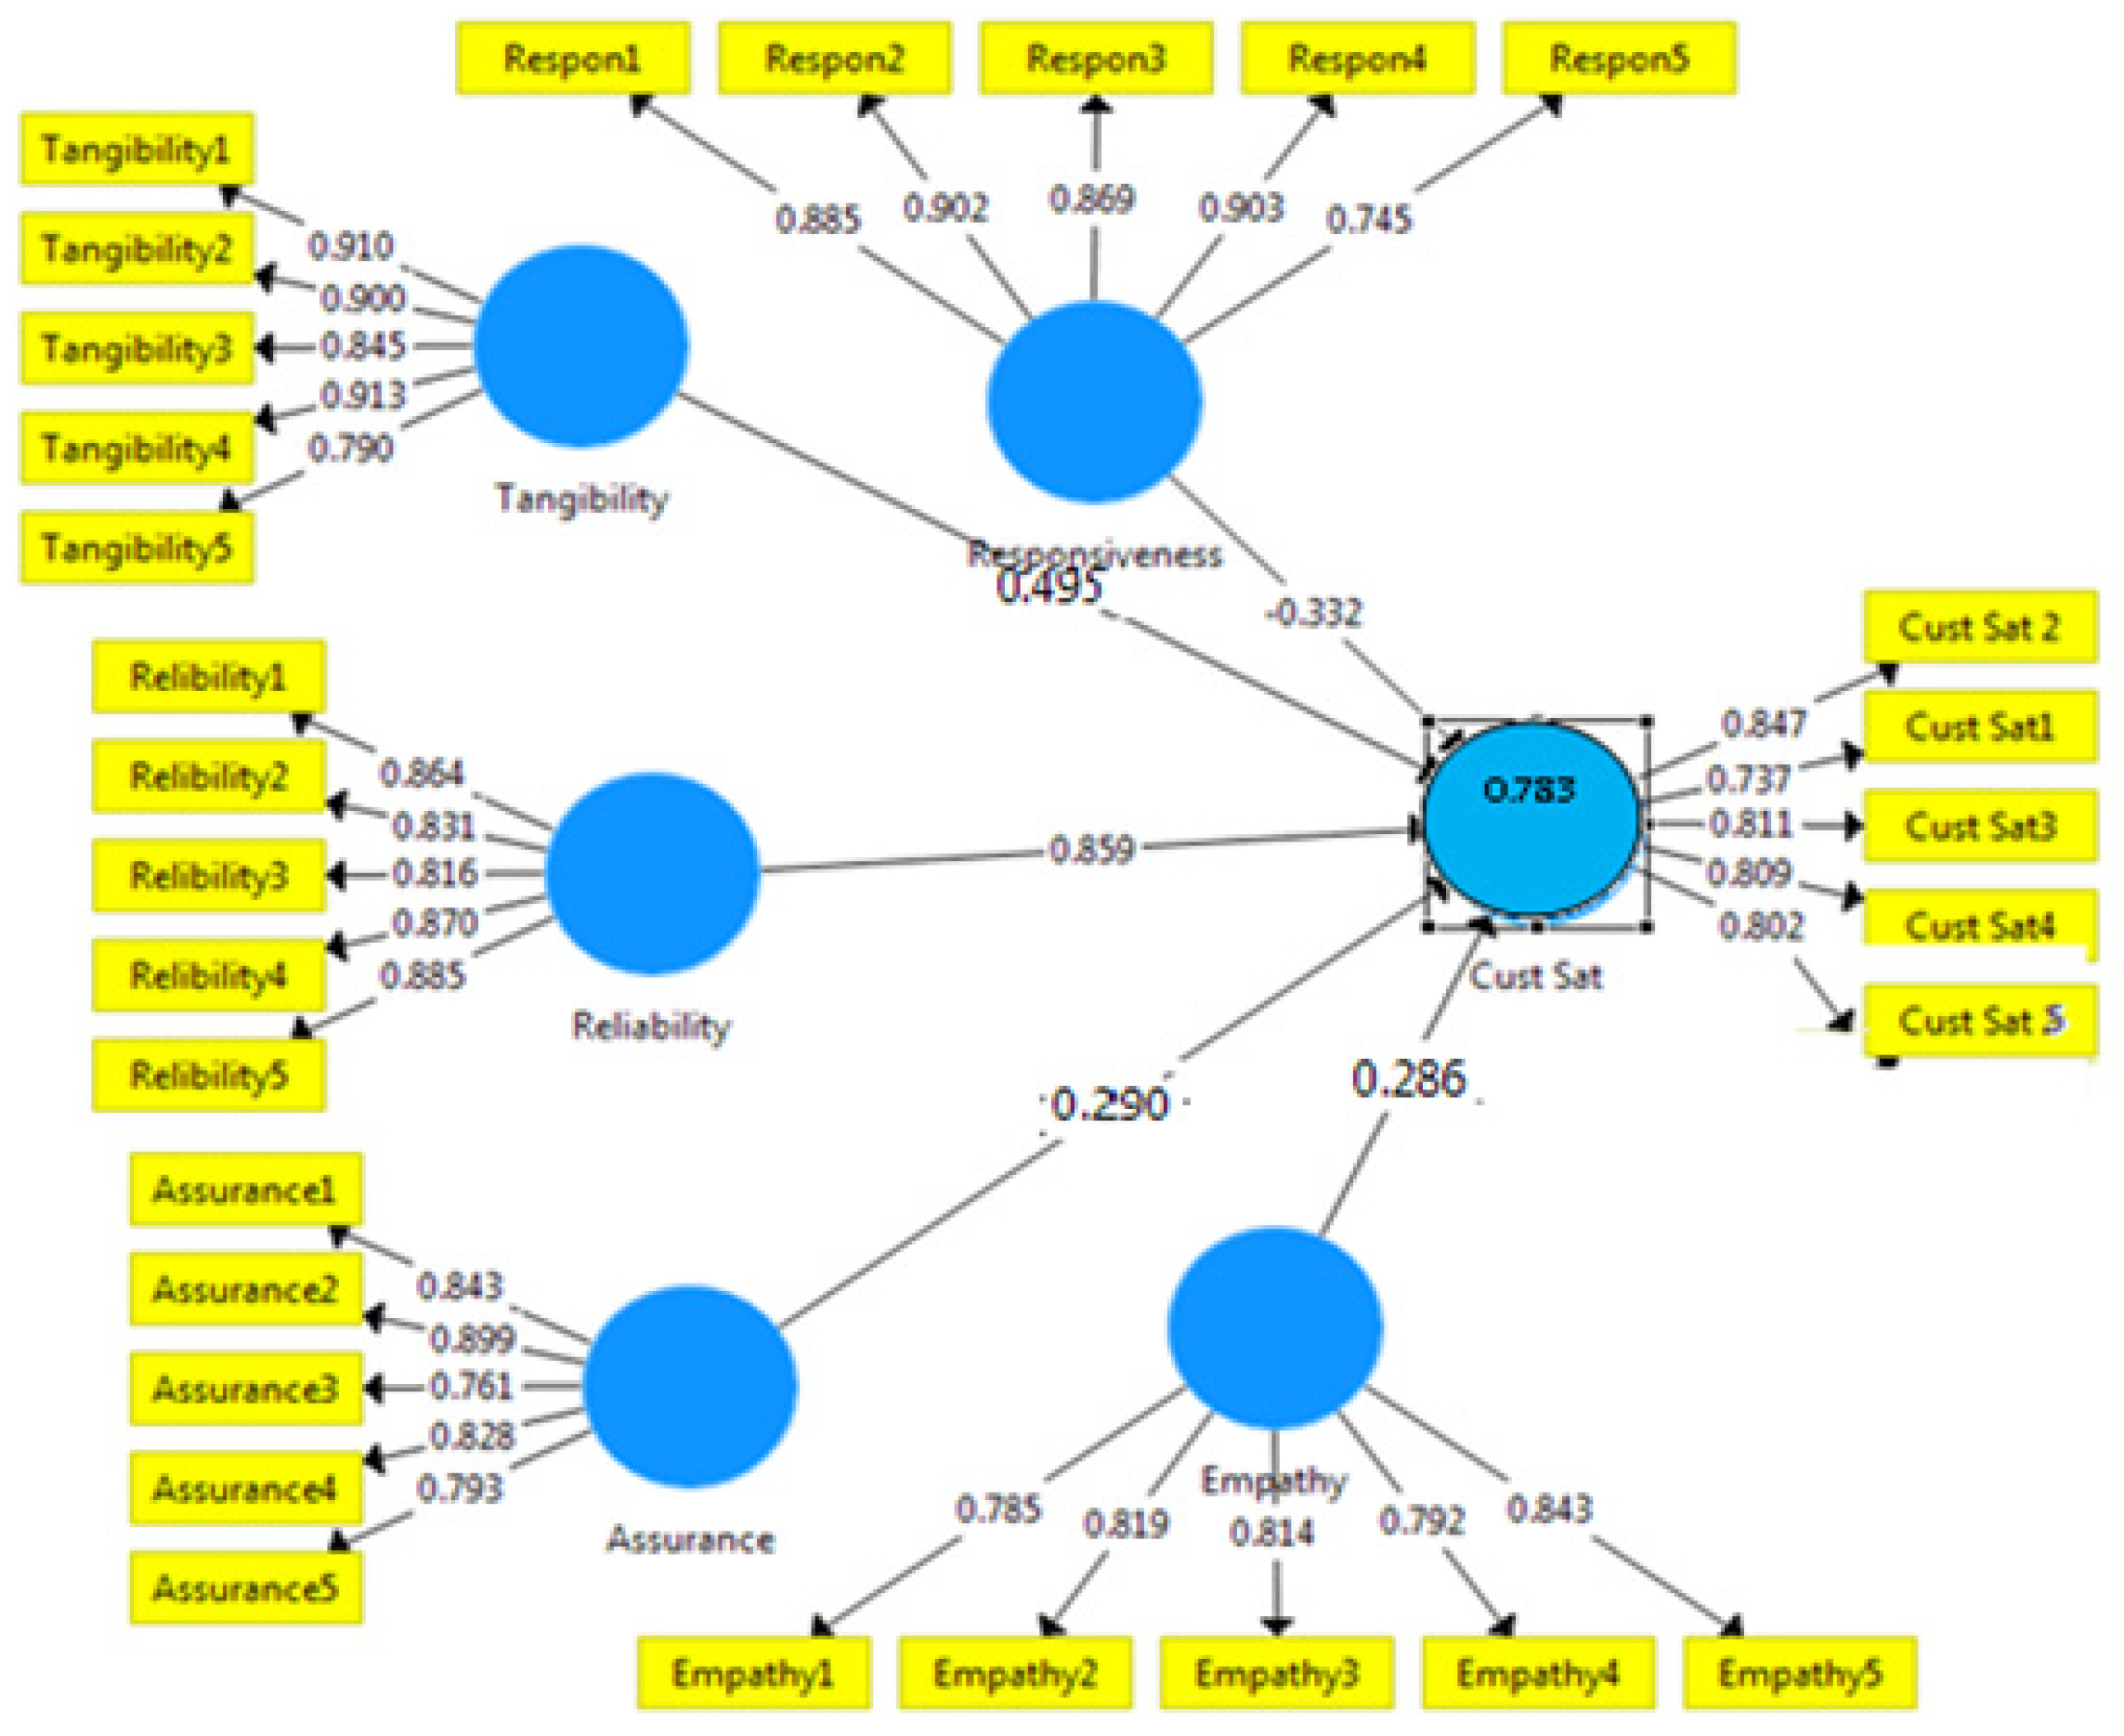
To confirm our hypotheses, we use confirmatory tetrad analysis (CTA) to evaluate the cause–effect relationships between the latent variable and its indicators. With the CTA technique, we formed tetrads for each dimension, taking a combination of four indicators at a time, and then computing the difference between the product of covariances of one pair on another; the results confirmed that all the dimensions of service quality are reflective. In addition, we also determined the dominant and less important dimension/s of the SERVQUAL model that provide the highest level of risk with regard to customer satisfaction. To reflect the strength in the relationship between the service quality dimensions and customer satisfaction, an inner model with path coefficients and coefficient of determination R2 was applied. As per the inner model, ‘Reliability’ has a more dominant and significant relationship (0.859) with customer satisfaction. This confirms H2, meaning that for customers in the new digital age, the ability to deliver services accurately, on time and reliably is assessed as dominant. This requires consistency in the implementation of services, respecting commitments and keeping promises to customers.
‘Tangibility’ (0.459) and ‘Responsiveness’ (0.332) have a less dominant relationship with customer satisfaction as compared to ‘Reliability’, but they still have a significant impact on customer satisfaction. This allows us to confirm H1 and H5. Tangibility relates to the appearance of the facilities, equipment, attitude of staff, materials, and information systems of the bank. This shows that digital-friendly services are considered very important in the new digital age but less important than ‘Reliability’. The significance of ‘Responsiveness’, on the other hand, confirms that customers value the ability to resolve a problem quickly, handle customer complaints effectively, and the willingness to help and satisfy customers.
‘Assurance’ (0.290) and ‘Empathy’ (0.286) have a significant relationship with customer satisfaction. Therefore, we can confirm H3 and H4. Banks need to show credibility and ensure trust from customers, through professional services, excellent technical knowledge, a courtesy attitude and good communication skills. They also need to empathize with clients. However, these skills and attitudes are less important than the previous dimensions mentioned above (reliability, tangibility and responsiveness).
Therefore, as noted above, the analysis reveals that customers in the northern region of India are genuinely satisfied with the service quality of digital banking. Overall, the results of the study proved the fact that ‘Reliability’ has a strong impact on customer satisfaction, followed by ‘Tangibility’ and ‘Responsiveness’. Therefore, they are more important to risk managers and policymakers.
This study also suggests that all banks should provide accurate, reliable information, timely updates, maintenance of accounts, and error-free transactions while providing digital banking services. In addition, banks need to work on providing services that are easy, convenient, and visually appealing with error-free transactions to enhance tangibility and responsiveness. This is consistent with the findings of
Loonam and O’Loughlin (
2008), mentioned above, who have concluded that the most important factors for online banking services are trust, access, web usability and flexibility.
The findings that, in India, customers generally evaluate digital banking service quality based mainly on three dimensions (‘Reliability’, ‘Tangibility’ and ‘Responsiveness’) and give less importance to ‘Assurance’ and ‘Empathy’ are consistent with studies by
Ozretic-Dosen and Zizak (
2015), mentioned above, who found that management needs to improve banking services in these major dimensions, i.e., reliability, assurance and responsiveness, to ensure customer satisfaction.
Similarly,
Raza et al. (
2015) are also of the view that management of internet banking should focus more on creating websites that are visually appealing to attract new customers as well as to retain existing ones. Customers demand more dependable and consistent services from banks. They demand to feel comfortable, confident and assured. Conversely, the study conducted by
Chong et al. (
2010) in Vietnam showed that perceived utility trust and government support were all significantly related to intentions to utilize online banking. Contrary to this, perceived ease of use was not found to be relevant.
The findings by
Dinçer et al. (
2019) show that, in Turkey, the most important dimension is ‘Responsiveness’, whereas costs and earnings are the least important dimension. They also stressed that information technology infrastructure is the most important criterion in customer satisfaction and banks should invest in improving their technological infrastructure to satisfy the expectations of the customers.
Zhou et al.’s (
2021) study on factors affecting service quality and loyalty intention in mobile banking in China showed that provision of a stable, secure and accurate mobile banking system, with fast response and efficient services (e.g., paying, transaction, credit card services, etc.), can ensure customers trust their mobile banking provider.
Pakurár et al. (
2019), on the other hand, found in their study of Jordanian banks that assurance, reliability, access, and employee competencies are the most important dimensions to ensure customer satisfaction followed by responsiveness, empathy and financial aspects; tangibility was the least important.
The authors’ other conclusions discussed above confirm that the five dimensions of the SERVQUAL model are still relevant to identify the impact on customer satisfaction and, therefore, the risk of variance. However, the prevalence of each dimension differs depending on the preferences of customers in different countries. Banks should focus on enhancing consistency in service delivery and adherence to commitments, and keeping promises made to customers. Banks must concentrate on customer trust, primarily to raise awareness that funds are safe and available at the time and in the form that the customer chooses. To build trust, banks must minimize risk and provide safe, reliable, responsive, sustainable and always available services. The pace of digital banking adoption is growing steadily, and the need to scale reliable services has never been greater.
Customer satisfaction depends on a bank’s ability to deliver the right content to the right people at the right time. The channels that banks use to communicate with customers and potential clients are advertising, SEO, drip campaigns, social media, etc. To meet customer needs, marketers must spend more time planning and producing educational written content, making the most of the latest visual storytelling techniques.
The study suggests that all banks should provide accurate, reliable information, timely updates, maintenance of accounts, and error-free transactions while providing digital banking services. In addition, banks need to work on providing services that are easy, convenient and visually appealing with error-free transactions to enhance tangibility and responsiveness.
Finally, the government also plays a role in assisting banks in increasing digital banking acceptance. To increase the acceptance rate towards digital banking and to combat the resistance level of consumers, the government should lay down certain policies related to digital crimes and establish proper and clear arrangements for remedy or compensation of wrongdoing or grievances.
Our study is not without limitations. Although the response rate to our survey is satisfactory, respondents still cover only a subset of customers in India. For future research and discussion in the context of Indian customer satisfaction with digital banking, it would be beneficial to attract more customers from other regions of India. In addition to this research, it would be very interesting to study what factors influence the preferences of customers in different countries, for example, the level of wealth of the country, religion, etc.
Despite these limitations, this paper provides unique analytical evidence on customer satisfaction in the context of the banking sector in the digital age by taking a practical view of the situation of banks in Northern India. Our findings have practical implications for risk managers, banking practitioners, policymakers and marketing personnel. The SERVQUAL model can be similarly used in different regions and countries to help in the development of digital operations, systems and applications, which will ensure customer satisfaction and retention of clients as much as possible.


