Article

Impacts of Temperature Trends and SPEI on Yields of Major Cereal Crops in the Gambia

1
Institute of Environment and Sustainable Development in Agriculture, Chinese Academy of Agricultural Sciences, Beijing 100081, China
2
Institute of Atmospheric Physics, Chinese Academy of Sciences, Beijing 100029, China
*
Author to whom correspondence should be addressed.
Sustainability 2021, 13(22), 12480; https://doi.org/10.3390/su132212480
Submission received: 10 October 2021 / Revised: 1 November 2021 / Accepted: 3 November 2021 / Published: 12 November 2021
(This article belongs to the Topic Climate Change and Environmental Sustainability)

Abstract

:
Variations in the climate constitute a significant threat to the productivity of food crops in the Gambia. A good understanding of the influence of climate variability on crop production is vital for climate resilience and improved food security. This study examined the trends, relationships, and the extent to which growing season temperatures and the SPEI (Standardized Precipitation and Evapotranspiration Index) impacted sorghum, millet, maize, and rice yields in three agro-ecological regions of the Gambia during 1990–2019. Mean temperatures and the SPEI exhibited increasing trends while observed yields showed a decline across all regions. The SPEI had a significant positive relationship with yields, and temperatures were negatively associated with yields. Though yield response to climate variability differs among regions, 20% to 62% of variations in the four crop yields were due to climate trends. The combined effect of the SPEI and temperatures decreased yields from 3.6 kg ha−1 year−1 to 29.4 kg ha−1 year−1, with the most severe decline observed in rice and maize yields in the Sahelian zone. Although uncertainties might arise from not considering related extreme climate events, this study highlights how past climate trends affect cereal yields in the Gambia; thus, any unfavorable change in the local climate could have severe repercussions on the country’s food security. There is a need for concerted efforts to increase investments in adaptation strategies to lessen the effects of the climate for improved crop productivity.

1. Introduction

The productivity of global food crops has experienced changes driven by technological, infrastructural, and management practices [1]. However, this increase in crop production is a non-linear process due to crop yields’ variability characterized by episodes of yield declines and crop failures [2]. Numerous factors such as management, pest and diseases, soil type, and socio-economic crises lead to variations and or decline in crop yields [3]. Nonetheless, anthropogenic greenhouse gas emissions from food production and energy consumption [4,5] are expected to cause an increase in temperatures, changes in precipitation patterns, and increased frequencies of extreme weather events such as droughts and floods [6]. Evidence from a series of empirical and statistical studies [7] indicates that agriculture is one of the most directly sensitive sectors affected by changes in climatic parameters because the weather is an essential input in crop production. Thus, the agricultural sector is projected to continue under severe threat, as droughts and rising temperatures induced by global warming will exert pressure on agricultural resources, consequently affecting the spatial and temporal distribution of crops and crop yields and global food security [8,9]. Considerable evidence regarding the potential impacts of historical and future climate change on yields has been reported [2,4,10]. These impacts are projected to be severe in developing countries where chronic hunger and malnutrition already persist and resources to cope with the effects of climate-induced yield losses and natural disasters are limited [11].
Sub-Saharan Africa, for instance, is considered one of the most susceptible, with 34 of the 50 most climate-vulnerable countries located within the region [12]. Studies by [12,13] indicate that the risk posed by climate change in this region is due to many factors, including the region’s dependency on rain-fed agriculture, rapid population growth, weak institutions, and less economic capacity to adapt to the impacts of the climate. Many agricultural populations in this region are exposed to climate change-induced droughts and rising temperatures [14], exacerbating the already recurrent water scarcity, which will cause further pressure on the future of the African economies and livelihoods and increase food insecurity in the region [15]. The yields of sorghum, millet, and maize are projected to decline by −14.5%, −9.6%, and −5%, respectively, in this region by the end of the 21st century if no adaptation measures are taken [16]. Drought severity and frequency are expected to worsen with the advent of increased climate variability and change with significant impacts in arid and semi-arid regions [17,18].
Like many Sub-Saharan African countries, the Gambian agriculture depends heavily on rain-fed weather conditions, with only three percent of arable land under irrigation, mainly rice cultivation. Crop yields depend highly on the amount and distribution of seasonal rains, which makes the country most vulnerable to increased climate variability incidents [19]. The country is facing pronounced risks of higher temperatures, more erratic but lower rainfall of about a 400-mm decline compared to the 1961–1990 period, more frequent droughts and lengthened dry spells coupled with above-average rains resulting in a decrease in annual crop yield trends [20,21,22]. This situation adversely affects the country’s food security and the livelihood of small-scale subsistence and semi-intensive farmers who form 70 percent of the country’s population.
Before developing any climate-crop prediction model, there is a need to establish a proven relationship and the impacts of historical and current climate variability on crop yields to help design adaptation strategies for improving climate resilience [5,23]. Several studies using empirical models in recent and past decades have shown the significance of climate variability and change (especially precipitation and temperature) in explaining historical and future variations in crop yields at temporal and spatial scales [24,25,26]. Employing a statistical climate–crop yield relationship, the authors in [27] showed the significant impact of growing season temperature and precipitation on cereal crop production in Nepal. The authors of a study conducted in the United States and China [28] use an econometric model that incorporated climate, economic, and technology variables and concluded that climate change would not universally cause negative impacts on maize yields in the United States and China. Despite rapid progress in establishing the relationship and impacts of variations of these climatic variables on crop yields in different agro-ecological zones, a substantial gap exists due to climate dynamics and uncertainties under changing environments [18]. Most of these studies [29,30,31,32] at local and global scales only focused on basic climatic variables such as precipitation and temperatures. In addition to variations in mean climate variables, different studies have identified drought indices linked with prolonged effects and anomalous moisture deficit as recurrent climate hazards affecting crop production with severe societal and economic constraints [33,34,35]. The authors of [36,37] proposed that extreme climate events such as droughts and higher temperatures will significantly have adverse impacts on crop yields more than variations in mean precipitation and temperatures alone.
Studies by [38] revealed that cereal yields mostly have a positive response with increasing precipitation in rain-fed tropical regions like the Gambia, while the rise in temperatures and a decrease in the SPEI has a more adverse effect on yields [39]. A growing number of studies have used drought indices such as the Palmer Drought Severity Index (PDSI) [40], Standardized Precipitation Index (SPI) [41], and most recently, the Standardized Precipitation and Evapotranspiration Index (SPEI) [42] at different time scales to characterize drought events associated with crop yield anomalies and to develop statistical models to predict crop yields [43,44].The SPEI is considered more relevant to crop production because it combines the characteristics of PDSI (which uses temperature) and SPI (which uses precipitation) to assess droughts at multiple time scales [45].
Economic growth in the Gambia is highly correlated with its agricultural growth, owing to its contribution to national food security, about 75% of employment, 70% of its foreign exchange earnings, and 24% of GDP [46]. As reported by the authors of [21,47], variations in temperatures and recurring drought events cause a significant impact on yields and increase the poverty level of the country’s larger population who depends on agriculture as a source of income. Similarly, studies by [48,49] evaluated farmers’ perceptions and adaptations to climate change and variability in some specific regions within the country and indicated that farmers perceived a high increase of temperature and a decrease in rainfall, contributing to a decline in yields. However, studies investigating the impact of historical and/or current climatic trends alongside extreme climate events such as drought are limited, and no such study has been conducted on agro-regional scales in the Gambia so far. Hence, this study aims to establish the trends, relationships, and impacts of temperatures (minimum and maximum) and the SPEI on yields of major cereal crops in the three agro-ecological regions of the Gambia. A better understanding of these impacts is crucial for better decision-making at all levels to minimize climate-related yield losses and geared towards improving crop production and food security.

2. Materials and Methods

2.1. Study Area

The Gambia, located on latitude 13.28 N and 16.34 W, is the smallest country on the Atlantic coast of mainland Africa with a land area of 10,120 km2. The country is divided into 6 administrative regions from east to west. Based on biophysical characteristics and rainfall patterns, these 6 administrative regions are further divided into three main agro-ecological zones (Figure 1), namely, the Sahelian (considered the smallest region located in the central river region north of the country, characterized by 70 days of active crop production during the raining season), the Sudan-Sahelian (considered the largest agro-ecological region comprising of four administrative regions with an active growing season length of 79–119 days), and the Sudano-Guinean zone (comprising of two administrative regions with a growing season length of 120–150 days) [50]. A semi-arid monomodal rainfall characterizes the three regions from June to October. This rainfall season is controlled by the movement of the tropical rain belt (also known as the Intertropical Conversion Zone, ITCZ), which oscillates between the northern and southern tropics over a year, affecting the Gambia when it is in its north position [51]. The total annual rainfall in the three study regions varies enormously, with average amounts ranging from about 700 mm to 920 mm (1975 to 2018 data). The wettest areas have been over the Sudano-Guinean and the driest regions have been the Sahelian zone [52]. Average temperatures in these regions range from 18 °C to 30 °C during the dry season and 23 °C to 33 °C during the wet season, with maximum temperatures in April and May exceeding 40 °C towards the eastern and inland areas of the country [46]. The Gambian primary sector has been (early millet, late millet, maize, sorghum, and rice), semi-intensive cash crop production (groundnuts, cotton, sesame, and horticulture), and traditional livestock rearing. The farming system in these regions is characterized by subsistence mix cropping comprising cereals such as sorghum (Sorghum bicolour (L.) Moench), pearl millet (Pennisetum glaucum (L.) R.Br.), maize (Zea mays L.), and rice (Oryza sativa) and semi-commercial production of legumes such as groundnut (Arachis hypogaea L.) and cowpea (Vigna unguiculata (L.) Walp.). This is alongside traditional livestock rearing, though crops account for a more significant portion of the production [53]. Soils in these regions (most especially the Sudano-Sahelian and Sahelian regions) have low inherent fertility characterized by low cation exchange capacity (CEC), which have over the years been subjected to various types of degradation attributed to soil erosion (wind and water), clearing by burning, and limited incorporation of green manure. Crop yields in these regions have declined drastically during the past decades due to many factors, including erratic and insufficient rainfall, and the low use of mineral and organic fertilizers in a context of decreasing soil fertility combined with soil salinization due to seawater intrusion [19].

2.2. Data Acquisition

The climate data (precipitation, maximum and minimum temperatures) from the 10 weather stations across the country were obtained from the Department of Water Resources from 1990 to 2019 (30 yrs. period). A quality control check was performed, and stations with more than 5% of missing data and outliers were removed. A homogeneity test was also carried out to test the fluctuations in the dataset using the RHtest software package [54]. After that, six synoptic stations with continuous data series representative of the 3 study regions were used for the analysis (Figure 1). Climate variables were used according to the crop growth season because non-growing season climate factors have no direct impacts on yields and may contribute to uncertainties in our study [55]. Annual records of the four cereal crop yields (sorghum, millet, maize, and rice) aggregated according to the agro-ecological regions were acquired from the Planning Service Unit (PSU) under the Ministry of Agriculture for the same period as of the climate record. Outliers were removed and replaced with the mean of the dataset during the study period for the analysis.

2.3. Trend Analysis

The Mann–Kendall test (a non-parametric test), adapted from [56], was used to examine crop yields’ trends and significance level and changes in growing season temperatures and SPEI at one- and three-month timescales. The Mann–Kendall test was calculated using the modified Mk package in R software at a 95% (p < 0.05) significance level. Results indicate positive and negative values as increasing or decreasing monotonic trends, respectively. Sen’s slope was used to quantify the magnitude of trends (temporal change per unit in climate and yield variables) using a simple non-parametric procedure developed by Sen.

2.4. Determination of Drought Severity Index

The widely used standardized precipitation evapotranspiration index (SPEI) was used to express the duration and magnitude of drought. SPEI is a multi-scalar index that uses the differences between precipitation (P) and potential evapotranspiration (PET), thus including the impact of temperature on soil moisture responsible for crop growth. There exist several methods of computing PET, from the simple Thornthwaite or Hargreaves [57,58] to the sophisticated FAO and WMO’s standard accepted Penman–Monteith (PM) [59] method. Due to data limitations, this study used Hargreaves using minimum, maximum air temperature, and geographic coordinates of the stations [57]. This method has been used widely in similar studies performed in Africa and beyond and provides results similar to the complex methods [38,60]; hence this method is recommended in data-scarce regions [61]. The precipitation (Pi) and potential evapotranspiration (PETi) were used to calculate the climatic water balance (Di) at different timescales and for each region as:
D i = P i P E T i
The Di was standardized by the log-logistic distribution series to derive the SPEI values at 1- and 3-month timescales for meteorological (SPEI-1) and agricultural (SPEI-3) drought due to their significance to crop production [62]. Though the 30 years, monthly SPEIs were determined, but only the five month-growing seasons (June–October) was used in further analysis. The SPEI R package (http://cran.r-project.org/web/ (accessed on 20 October packages/SPEI) developed by [63] was used to calculate both the PET, D, and SPEI following previous studies such as [64,65]. The classification of the SPEI values ranging from ≥+2 (extreme wet) to ≤−2 (extreme drought) are presented in Table 1, and the greater the negative value, the more severe the drought condition and vice versa [66].
From the above classification, we determined the probability of wet or drought incidence of a given threshold as the frequency ratio of occurrence of the SPEI category to the total record of SPEIs for the study period.

2.5. Climate–Crop Yield Relationship and Impact Analysis

To determine the relationship and how much variation in crop yields was explained by climate variables, it was necessary to remove or minimize the trend effects of non-climatic factors such as cultivar, management, and technology to eliminate bias due to these trends. Anomalies were obtained by detrending time series in crop yields and climate (Tmin, Tmax, and SPEI), using the first differencing approach applied in many studies [11,67].
Associations between detrended yield and climate were explored through correlation analyses using the corrplot package in R. The correlation results provide initial information on the positive or negative associations, which help to understand the regression results. The SPEI was used instead of precipitation in this study since it produces similar qualitative results with precipitation, and it is more accurate in describing wetness and dryness than precipitation because it accounts for the varying rates of evapotranspiration [60]. Including the SPEI and precipitation in our model would induce collinearity since both were significantly correlated; thus, only the SPEI was used.
Finally, a multi-regression analysis of the detrended yield and climate was performed to quantify the percentage response (r2) of yield variations achieved jointly by precipitation and temperatures. Though less complex than crop simulation models, this method gives the best linear and unbiased estimates among other estimators. It has been used in several studies in Africa [68,69] to study the impact of the climate on crop yields. The regression model adapted from [70] was applied for a single crop in each region as:
Y i j = c o n s t a n t + α × Δ S P E I i j + β × T m a x i j + c × T m i n i j
where Y represents the change in the dependent variable (yield) in region i in year j; α, β and c, are the coefficients of SPEI, maximum and minimum temperatures during the study period. ∆SPEI, ∆Tmax, and ∆Tmin are the observed changes in independent variables (SPEI, maximum and minimum temperatures).

3. Results

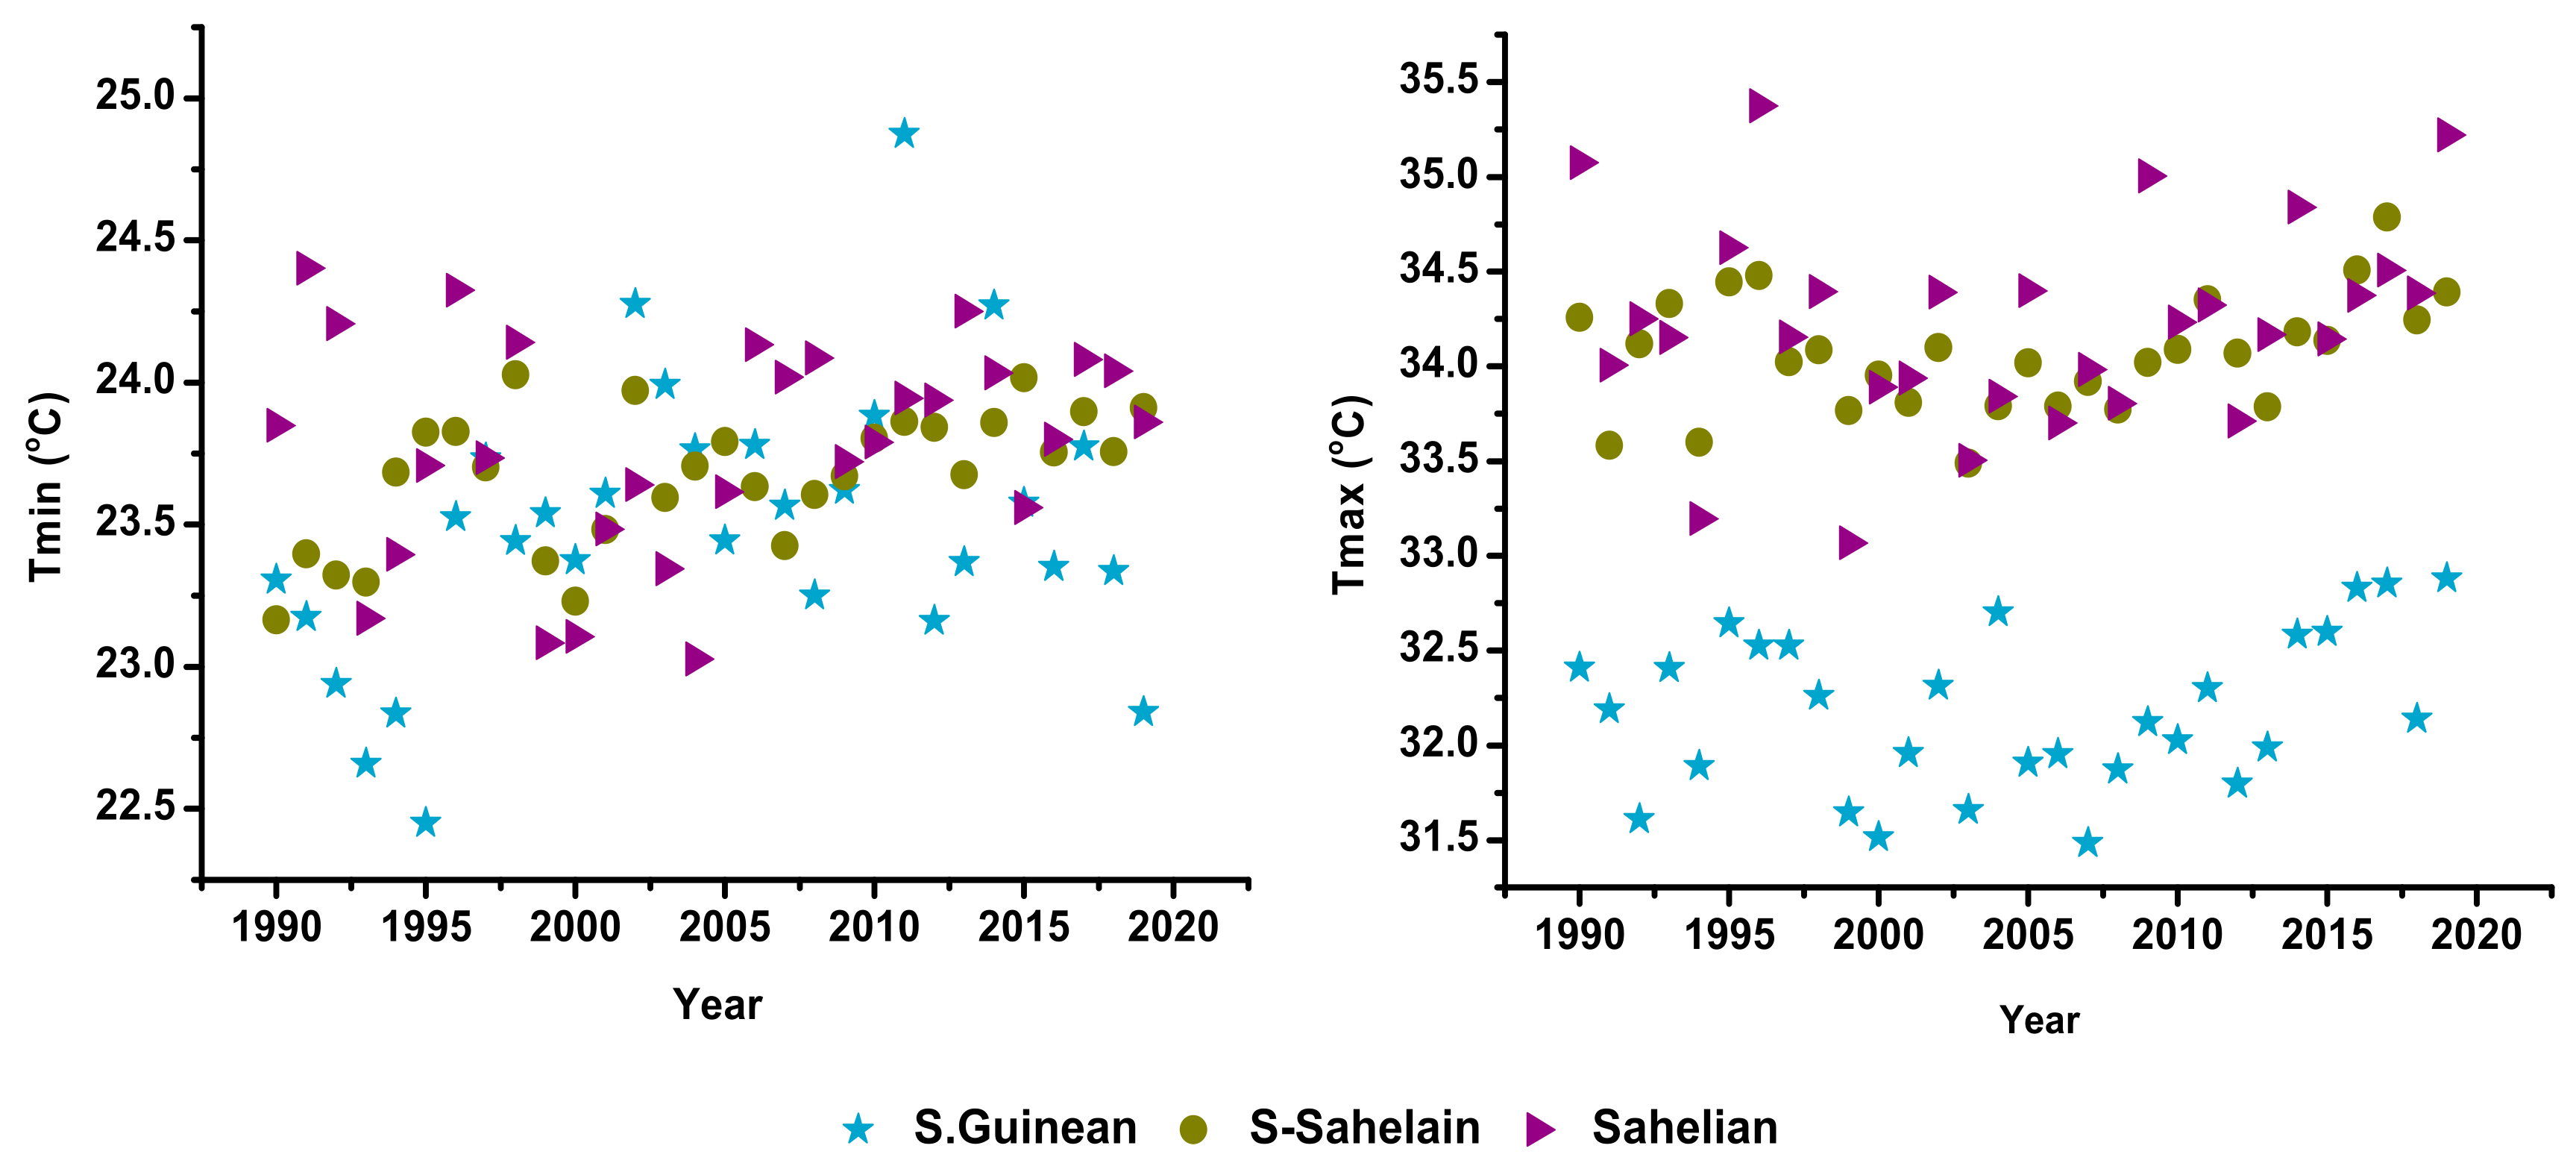
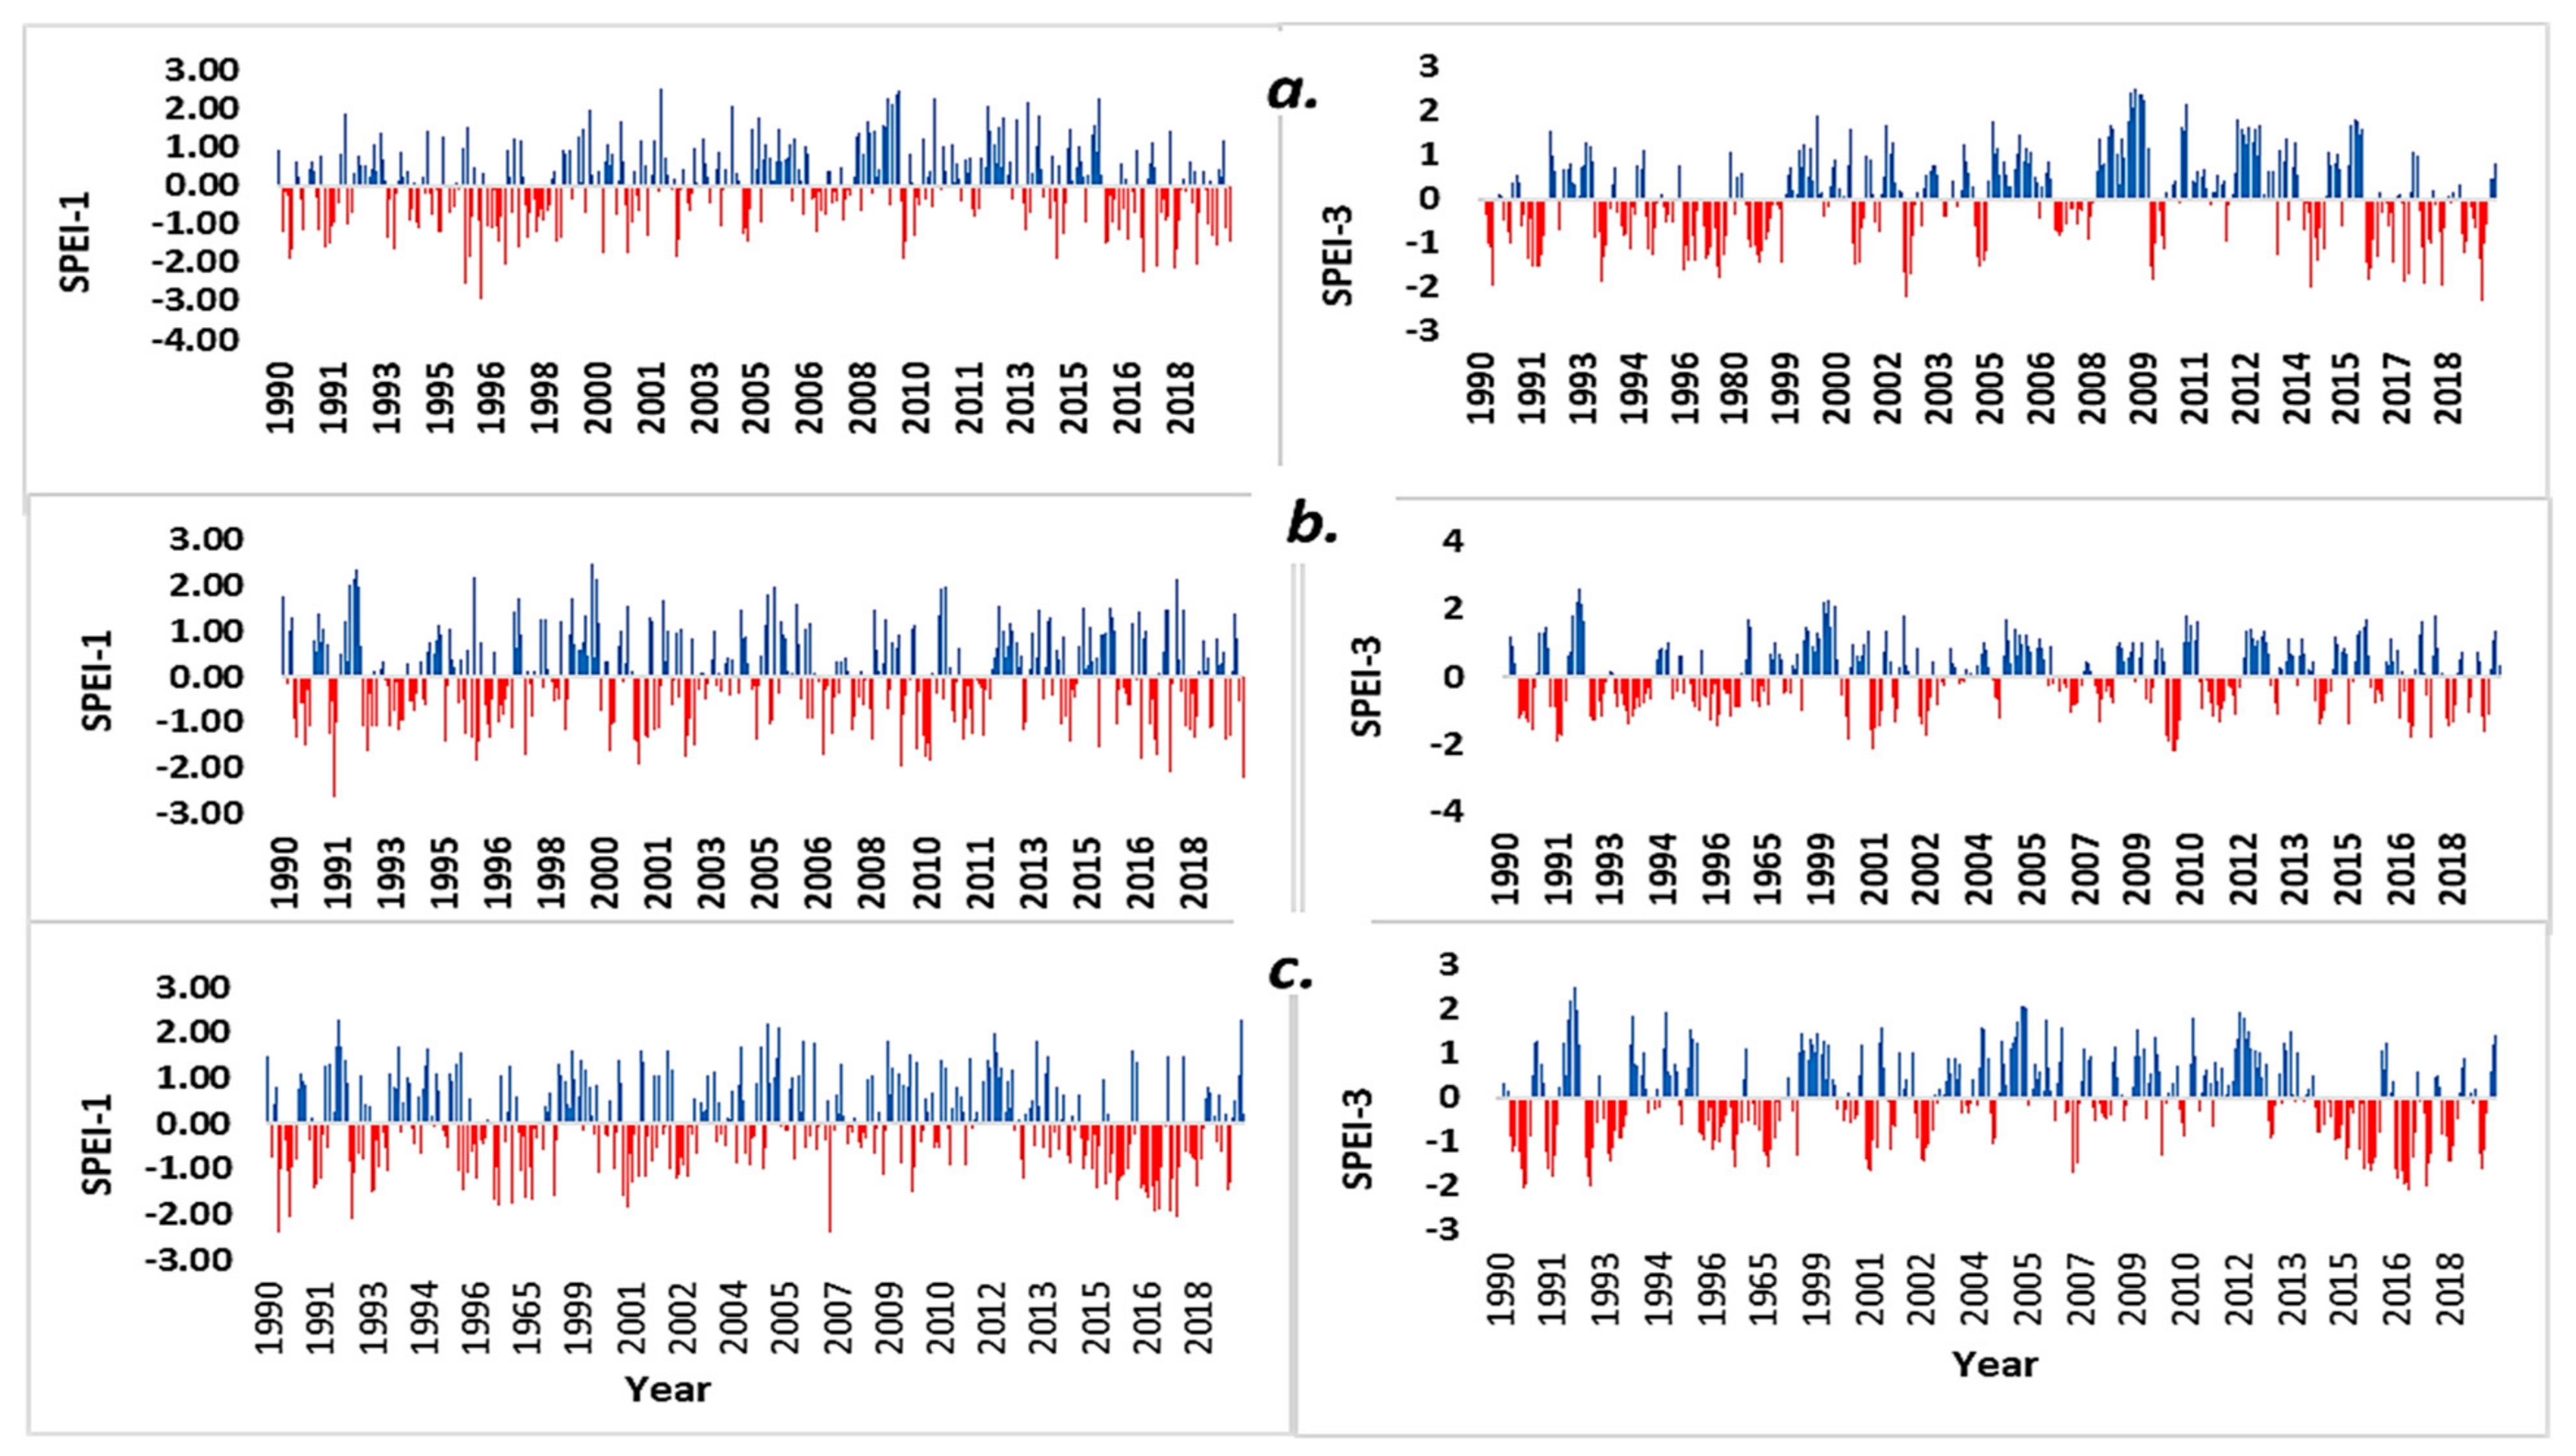
3.1. Observed Trends of Tmin, Tmax, and SPEI

The long-term trends in growing season Tmin, Tmax, and SPEI at 1- and 3-month time scales were assessed for all the three study regions through the Kendall–Tau statistical tests at a 95% significance level and quantified by the Sen’s slope, and are presented in (Table 2). A substantial positive (warming) trend has been observed across the three study regions for mean minimum and maximum air temperatures between 1990–2019. However, this warming trend was significant ((p < 0.05) only for October Tmin in the Sudano-Guinean region and for August, September, and October Tmin in the Sudano-Sahelian region with the minimum average seasonal warming trend of 0.010 °C year −1 observed in the Sahelian region and a maximum trend of 0.019 °C year −1 observed in the Sudano-Sahelian region, respectively. Growing season monthly Tmin exhibited a more significant increasing trend than Tmax. However, a non-significant decreasing (cooling) trend was observed in the maximum air temperatures (Tmax) in August (0.023 °C) and September (0.018 °C) in the Sahelian region and in August Tmin in the Sudano-Sahelian region. The maximum and minimum temperatures patterns show well-defined coherent spatial and temporal characteristics characterized with year-to-year variability. The long-term trends show both below and above-average temperatures during the growing season (Figure 2).
The mean seasonal SPEI-1 and SPEI-3 show an increasing trend over the years for all the regions. The magnitude of changes differed between regions with monthly upward trends varying from 0.04 in July to 0.061 in September for SPEI-1 and from 0.003 in June to 0.055 in September for SPEI-3, with a significant trend mainly found in the Sudano-Sahelian zone (Table 2). August and September, which correspond to the wettest months of the Gambia’s growing season, had the highest monthly SPEI trends across the three regions, with increases in 1- and 3-month lags varying from 0.013 in the S. Guinean to 0.066 in the S. Sahelian.
Figure 3 shows the temporal evolutions of the regional averaged SPEI with 1- and 3-month time scales. The overall trends in the SPEI show variations towards positive and negative lags clustered together, indicating that both wet and dry conditions were observed over the past 30 years. All the regions were exposed to a range of drought conditions during the first 10 years of our study for both SPEI-1 and SPEI-3. The years 1990–1998 presented a period of drought, registering an index of −2.62 in 1991 in the Sudano-Sahelian zone (Figure 3b) and −2.98 in 1996 in the Sudano-Guinean area (Figure 3a). The 1999–2012 period experienced a remarkable shift towards an anomalous increase in wet conditions across all the three regions with a maximum SPEI index of up to 2.44 in 1999 and 2.45 in 2009 in the regions mentioned above, respectively. This situation indicates a favorable shift towards the increase of soil moisture during the period of the study.
To further understand the historical SPEI, drought and wetness severity levels (moderate, severe, and extreme) have been assessed (Figure 4). Our results show monthly droughts ranging from moderate to extreme droughts from 1990 to 1996 across the three regions and alternate drought and floods conditions captured from 1997 onwards with tendencies of monthly dry scenarios becoming frequent, particularly after 2012. The SPEI-1 exhibits a periodic change in the dry/wet conditions more than the SPEI-3; thus, values of the SPEI-1 (Figure 4 (left)) characterize individual monthly conditions and hence the effect of dry/wet conditions does not affect the following month. However, the absolute value of the wet or dry condition of the SPEI increased gradually when the SPEI series was calculated at 3month lags, indicating that previous moisture from the preceding 2 months could be integrated to latter months, thus, highlighting the persistence of alternate dry and wet months (Figure 4 (right)). The above result suggests that the length of extreme events as showed by the SPEI-3 might not be effectively detected with SPEI at a one-month lag; thus, the combination of SPEI-1 and SPEI-3 provide a better explanation of dry/wet conditions.
Similarly, the frequency of probability of drought and wetness occurrence and intensity has been analyzed for each region (Table 3). Abnormal wet and dry conditions were seen in all three regions with a frequency probability from 35 to 39%. The evolution of SPEIs over the three regions was similar, though the Sudano-Sahelian region experienced a more frequent number of drought episodes for both SPEI-1 and 3 than the rest of the regions. The SPEI-1 revealed more dry months across the three regions while the number of wet months increased slightly in the SPEI-3, suggesting an increase of moisture with time scale. The probability of extreme, severe, and moderate drought combined for the two-time scales 18.3%, 20%, and 17.3%, while anomalous wet conditions combined ranges from 15.3%, 17.7, and 21% for the three regions, respectively. Extreme wet and dry conditions were rare compared to moderate drought and wetness, while near-normal conditions were more common with 66.3%, 62.0%, and 61.6% across the three regions for the SPEI-1 and SPEI-3 combined.

3.2. Crop Yield Trends

The country’s average yields declined at an average rate of 13.4 kg ha−1yr−1 for millet, 19.6 kg ha−1yr−1 for maize, and 20 kg ha−1yr−1 for rice, while sorghum yields exhibited a slight increase of 2.5 kg ha−1yr−1 (Figure 5). Except for sorghum, the Mann–Kendall test revealed a significant decreasing trend on the regional average yields of all crops across the three regions. The most considerable yield decrease was observed in the Sahelian and Sudano-Sahelian region for maize (28.1 kg ha−1yr−1 and 19.1 ha−1yr−1) and rice (29 kg ha−1yr−1 and 19 ha−1yr−1), respectively. Average yields and yield trends differed across regions showing high inter-annual variability, with a standard deviation between 131 kg ha−1 for sorghum yields in the Sudano-Guinean region to 428 kg ha−1 for rice in the Sahelian region.

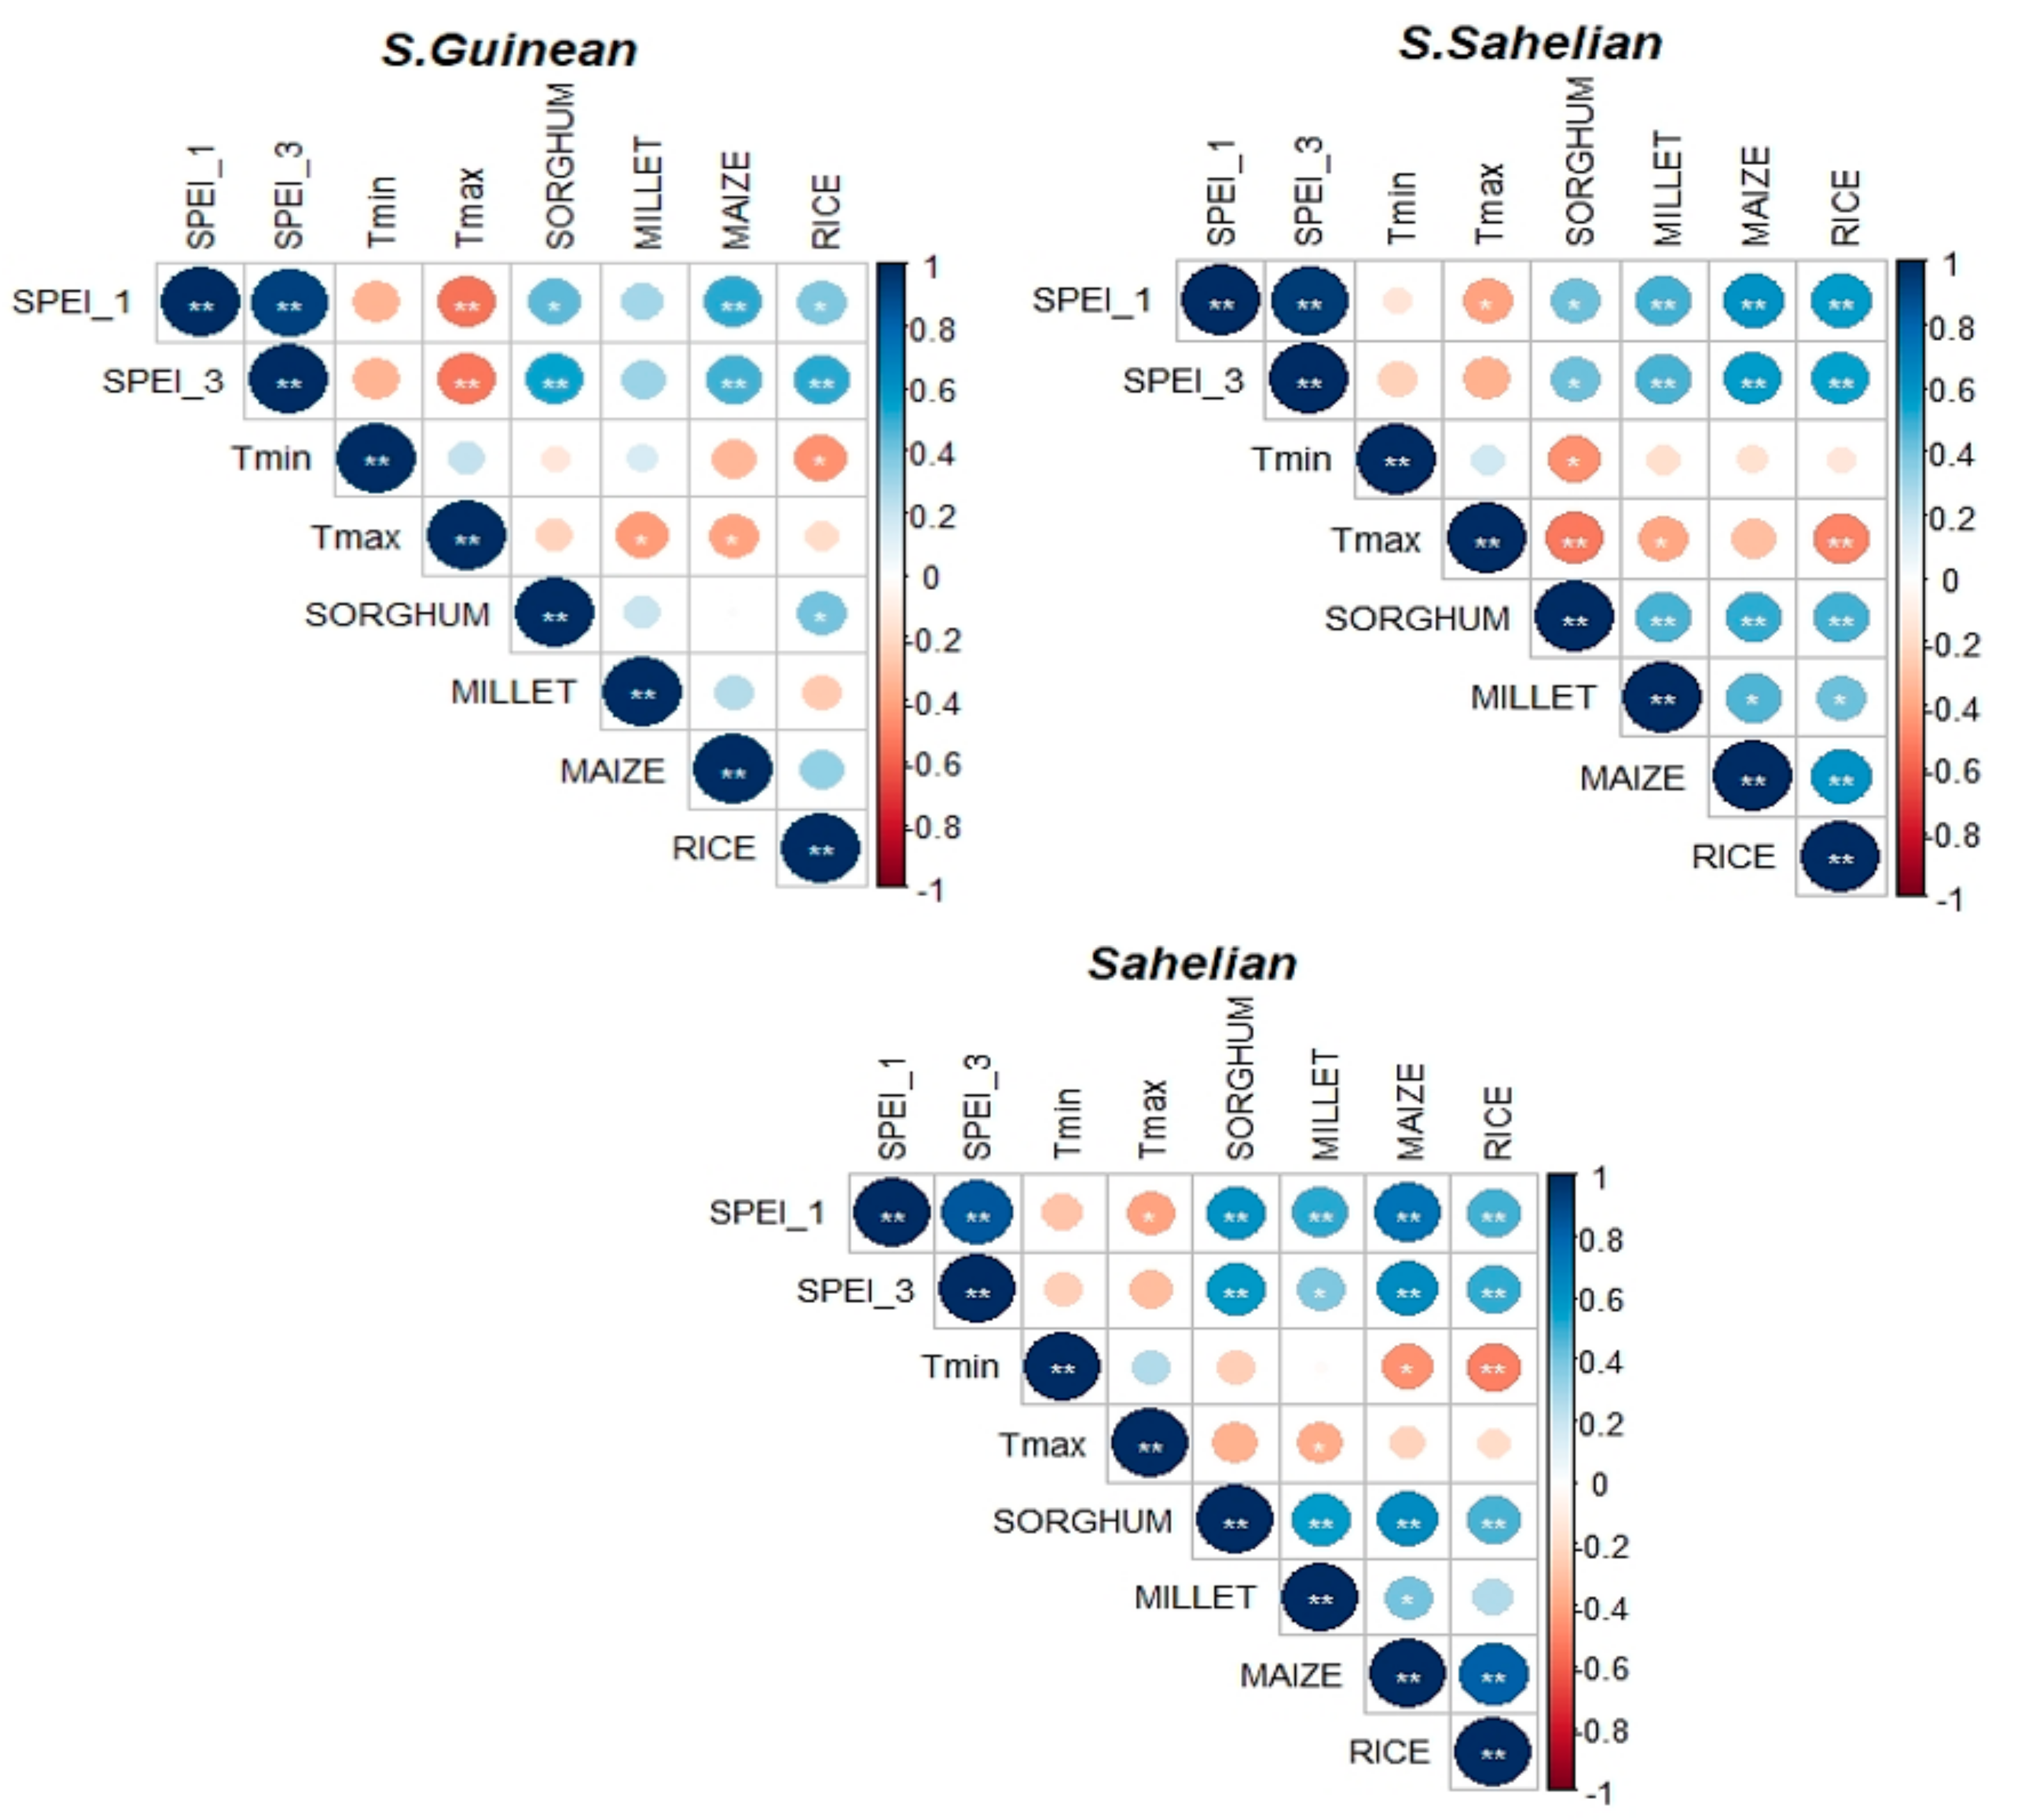
3.3. Climate–Crop Yield Correlation

The correlation analysis showed that maximum and minimum temperatures in the growing season had a generally negative association with detrended crop yield across all the regions, except for Tmin and millet in the S. Guinean zone (Figure 6). For the S. Guinean and Sahelian regions, the strongest (significant) negative correlation values were observed between Tmin and rice yields (0.45 & 0.50), while Tmax revealed a stronger negative relationship with sorghum and rice yields in the S. Sahelian region. The most significant (p-value ≤ 0.05) correlation value (r) between yields and temperatures for the three regions was observed between Tmax and sorghum yields (r = −0.53) in the S. Sahelian region, and the lowest correlation coefficient was observed for Tmin and millet yields (r = −0.03) in the Sahelian region. Conversely, a generally positive and significant correlation (p ≤ 0.05) was observed between yields and SPEIs with detrended crop yields in all of the three regions (Figure 6). The mean SPEI-1 indicated a higher positive association with yields than the SPEI-3, with the maximum correlation recorded for maize yields (r = 0.73) in the Sahelian zone. However, the SPEI-3 exhibited more months with a significant correlation pattern than the SPEI-1.

3.4. Impact of Historical Climate Trends on Yields

The multi-linear regression model represented by the r2 between detrended yields and the climate was used to indicate the degree of yield variation explained by changes in climate trends. Results from the analysis reveal that variations in mean predictors (SPEI-1, Tmin, Tmax) explained from R2 = 0.20 to R2 =0.62 of the year-to-year change in yields for all crops (Table 4). This means that 20% and 62% of the yearly variations in sorghum (kg ha−1) and maize (kg ha−1) yield in the Sudano-Guinean and Sahelian region for the past 30 years can be explained jointly by the variations in SPEI, Tmax, and Tmin. The remaining 80% and 38% can be attributed to other non-climate factors such as seed varieties, financial status, soil characteristics, planting dates, weeds, pests, diseases, etc., omitted in our analysis. As shown in Table 4, the magnitude of climate variability responsible for yield fluctuations was region and crop-specific and thus varied between crops and across regions. For example, climate variables accounted for only 32% of the changes in maize yields in the Sudano-Guinean zone, whereas 62% of the changes in the same crop were accounted for by climate in the Sahelian zone and vice versa.
The regression coefficients indicate that the SPEI-1 index was a significant factor favoring crop yield increase across the three study regions. In contrast, inferred Tmin and Tmax sensitivities mostly impacted yields negatively, though positive effects due to temperatures were observed on some region-specific crops (Table 4).
The yield changes due to the combined impacts of the three climatic trends on crop yields presented in Table 4 were calculated using the equation below for a single crop (e.g., maize in the Sahelian zone) as:
M i j = 23.96 + 424.8 * S P E I .1 208.32 * T m i n + 58.9 * T m a x
where ∆Mij is the estimated yield change of maize in the Sahelian zone, ∆SPEI.1, ∆Tmin, and ∆Tmax are the changes in SPEI-1, minimum and maximum temperatures (°C), and the numbers correspond to the values of the estimated coefficients.
Substituting the trends of the three climate variables between 1990–2019 in Equation (3) implies that a unit change in growing season SPEI at 1-month will lead to an increase of 424.8 kg ha−1 year−1 of maize yield, a unit change in Tmin will lead to a yield decrease of 208.32 kg ha−1 year−1, and a unit change in Tmax will increase yields by 58.9 kg ha−1 year−1, respectively.
Applying the above equation for all crops revealed that the increase in the SPEI-1 trend significantly increased yields across all the study regions (Table 4). These impacts likely depend on the rainfall distribution during the growing season; thus, regular distribution of precipitation, especially during the early part of the rainy season, translated into higher yields than years with inconsistent distribution patterns. Conversely, increasing temperatures, especially Tmin, mostly suppressed yields, particularly in the Sahelian region with the most pronounced impact on rice yields. Nevertheless, warming trends in Tmin and Tmax also favored a yield increase on some region-specific crops, particularly sorghum and millet in the S. Guinean zone and maize and rice in the Sahelian region, respectively. In most instances, the yield impacts were determined by SPEI trends rather than temperatures except for sorghum and millet yields in the S. Sahelian and maize and rice in the Sahelian, where impacts were determined by both SPEI-1 and Tmin, respectively (Table 4).
The estimated impacts of yields due to growing season SPEI-1, Tmin, and Tmax trends across the three study regions are shown in Figure 7. Although varying from one region to the other, yields decreased consistently due to climate trends for all crops (3.6 kg ha−1 year−1 to 29.4 ha−1 year−1) except for sorghum which showed yield gains across the three regions. Rice yields experienced the most significant decrease due to the combined effects of SPEI-1, Tmin, and Tmax in the Sahelian and Sudano-Sahelian regions. These regions are characterized as the most intensive agricultural areas with a higher risk of drought and warming in the Gambia.

4. Discussion

Agriculture contributes 24% of the GDP and 75% of the household income in the Gambia [46]. As in in many parts of the globe [72,73,74], the agricultural sector in the Gambia is expected to be severely affected by climate change characterized by increasing temperatures and the spatio-temporal variation of precipitation patterns, favoring the formation of seasonal and annual droughts [75]. A likely increase in climate events is projected across the world, which will cause serious repercussions on crop yields, affecting the overall GDP of most developing countries and the livelihoods of people, especially those who depend on rainfed agricultural production systems. Hence, this study attempts to analyze the trends and impacts of mean temperatures (Tmin and Tmax) and the Standardized Precipitation Evapotranspiration Index (SPEI) on the four main cereal crops over the three agro-ecological regions in the Gambia 1990–2019, which could support effective agricultural adaptation practices under a changing climate.
Though several studies have been conducted globally and on regional scales relating historical climate impacts and yields, to the best of our knowledge, no such studies, particularly during cropping seasons, have been conducted in the Gambia. Some studies revealed an upward trend in temperature (representing climate warming), considered a major driver in drought frequency and severity across different regions [9,21,76], which aligns with the findings of this work. Tmin is rising faster than Tmax, consistent with studies such as [77,78] with more apparent warming observed in the S. Sahelian region. These warming trends also agree with the study in [79], which indicates an increase in global mean temperatures, likely to affect precipitation patterns, especially in tropical and subtropical regions like the Gambia. In the current context of global warming, this increasing trend in temperatures found in our study could likely exacerbate evapotranspiration, accelerate crop development, and reduce grain filling duration, thereby causing a reduction in grain yields and or seed number [80].
We consider that in the arid regions like the Gambia, where evaporation is large, the SPEI is more appropriate than total precipitation alone to characterize drought evolution because the SPEI captures the combined effects of temperatures and precipitation to assess the role global warming plays in drought evolution. Overall, the time series of the SPEIs at cropping season exhibited an increasing trend across the three regions (significant only in the S. Sahelian region), with alternate dry and wet conditions, at 1- and 3-month lags, representing drought characterization: severity, extent, and duration [81]. This observed increase in the SPEI trend over the three regions can be partially attributed to the partial recovery of recent precipitation patterns in most Sahelian countries [82]. Our assessment agreed with the finding reported by recent studies in Africa and beyond [83,84,85], indicating the variation of wet and drought episodes and more frequent extreme events based on observed long-term data. The frequency of severe and moderately dry conditions compared with wetness was more evident in the SPEI at a 1-month lag in the S. Guinean and S. Sahelian regions than in the Sahelian zone, whereas the percentage of wetness increased with the increase of the SPEI at a 3-months lag. This implies that the magnitude and level of dry and wet conditions increase with the 3-month SPEI time scale, as the SPEI-3 accumulates the impacts of soil moisture conditions from the previous two consecutive months. The alternate increase in dry and wet episodes, along with rising temperatures found in our study and consistent with [71], could likely cause increased soil evaporation and reduced soil moisture during the rainy season. Since trends in wetness/dryness are considered to be mainly determined by the water balance in a region [66], wherein the climate components of warming temperatures found in our study often play a big role, this could likely result in the consistent increase of potential evapotranspiration (PET), which is detrimental to crop growth. Previous studies [86,87] reported a considerable uncertainty related to the SPEI patterns in west African countries like the Gambia with linear trends towards decreases and increases associated with extreme rain events and intra-seasonal variations caused by the El Niño Southern Oscillation (ENSO) events. However, whether statistically significant or not, these climate trends can still have severe consequences for crop production through yield declines, reduced soil moisture, etc., and hence need appropriate attention while assessing the climate impacts on crop yields [88]. Using shorter time scale SPEIs of 1- and 3-months was useful to detect more dry and wet events in our study as both time scales consider only the current month (1-month scale) and the previous 2 months (3-month scale); hence, their responses to the change of climatic variables are more instant. However, a longer time scale is more appropriate to investigate the long-term changing pattern of drought conditions as they reveal a more intuitive presentation of the trend [60].
According to the World Food Program (WFP), cereals account for more than two-thirds of the Gambia’s food energy intake, albeit with varying importance across regions [89]; thus, impacts of climate variability on these crops could have a severe effect on the larger majority of the country’s population who depends on agriculture for livelihood. Consistent with the findings in [90], the yields of all crops in our study (except sorghum) exhibit a downward trend. This finding aligns with the authors of [7,91], who indicate a decline in cereal yields in France and most African sub-regions due to increasing climate variability and change. However, the difference and magnitude of yield reduction across the regions in this study could likely be driven by certain complex environmental, biological, and socio-economic factors that need further investigation.
A clear negative relationship was found between detrended yields, Tmin and Tmax, respectively. This suggests a decrease in crop yields due to heat stress and reductions in net photosynthetic rates [30]. The negative relationship between temperatures and yields can be associated with an increase in evapotranspiration, which reduces the soil moisture needed for optimum crop growth in arid and semi-arid regions like the Gambia, where irrigation is a limiting factor. Studies such as [26,67,92,93] also reported a negative correlation between temperatures and cereal crops. Correlations between yield and growing season mean SPEIs [94] were highly positively significant [38,65], suggesting that SPEI constantly influences crop yields. Significant correlations are more pronounced in the SPEI at 3-month lags than 1-month, with the former indicating the progress of crops’ growth stages; hence, yields depend on all growth stages in a crop cycle, and the later growth stage reflects a long period of water deficit.
The regression model confirms the susceptibility of crop yields to increasing temperatures and mirrors the effect of positive gains from SPEI trends to help compensate for the adverse impact of temperatures. Hence, possible yield declines due to warming trends could, to some extent, be lessened by improved water deficiency through water management and irrigation measures. These findings align with studies such as [95,96,97]. Yield variability due to SPEIs reveals more explanatory power than temperatures, exhibiting the vulnerability of crop yields in these regions to drought events. Cereal yield variability has been linked to variation in precipitation-related droughts or wetness in rain-fed areas, while increased temperatures were associated with yield declines [98,99], similar to the findings of this study. Stress due to high temperatures and low humidity reduces pollen viability and silk receptivity due to desiccation, resulting in poor seed formation and low yield [62]. The regression coefficients revealed both the positive and negative impacts of individual climate trends on yields, though the combined effect of the three observed climate trends decreased yields for all crops except sorghum. Unless addressed through adaptation strategies, observed climate trends will suppress yields for millet, maize, and rice at varying rates across all regions, particularly in the Sahelian and Sudano-Sahelian regions which are considered the areas with the largest population of vulnerable subsistence farmers in the Gambia. Reduction rates per year across all regions were mainly attributed to Tmin and Tmax rather than the SPEI trends. Similar findings were also found in studies by [100,101].

5. Conclusions

Assessing the historical impacts of declining cereal yields in the Gambia, mostly attributed to variations in climatic parameters, is vital to address the various risks of projected climate change. This study gives an insight into the effects of the past 30 years (1990–2019) of mean temperatures (Tmin and Tmax) and the SPEI on major cereals (sorghum, millet, maize, and rice) over the three agro-ecological regions in the Gambia, where no such study has been carried out before. The quantification of the climate change impact on yields using a correlation and regression analysis will help address the core challenges of climate-related yields losses, based on which the influences of expected changes in future climate can be more realistically assessed at regional scales.
The trend analysis results show that during the last 30 years, all of the three agro-ecological zones underwent a region-wide increasing trend and variability in temperatures and the SPEI across all the study regions. SPEIs revealed that all the study regions experienced an alternate episode of droughts and wetness during the main crop growth stages, though near-normal conditions were more frequent than extreme, severe, and moderate drought or flood conditions. The correlation analysis shows that SPEI had a positive (p < 0.05) relationship with all four crops, while temperatures were negatively associated with yields. A unit increase in mean growing season temperatures intrinsically contributed to an estimated decline in yields for almost all crops ranging from an estimate or coefficient of −37.34 kg h−1 year −1 for Tmin on sorghum yields in the Sahelian and −456.92 kg h−1 year −1 for rice yields in the same region. Though the magnitude of these impacts varies among crops and across regions, our study revealed that the combined effect of Tmin, Tmax, and SPEI trends during the last three decades played a determining role in the percentage of yield variations from r2 = 0.20 (20%) for sorghum in the Sudano-Guinean region to r2 = 0.62 (62%) for maize in the Sahelian region, thus suggesting that climatic trends will continue to have a discernible negative impact on the country’s cereal crop production if no adaptation measures are implemented.
Our analysis shows that of the four cereal crops studied, maize and rice yields were the most vulnerable to climate, with the Sahelian region experiencing the highest yield decline in rice (29. 4 kg ha−1 year−1) and maize (21 kg ha−1 year−1) yields. Thus, this heterogeneity of the impact of the climate between crops and across regions suggests that current policies promoting cereal cultivation in the Gambia need to consider each region and crops’ relative vulnerability to the climate. This indicates that every region requires its adaptation strategy or tailor-made intervention action, which should be analyzed in a participative decision-making process. Policies and adaptation measures should include integrated approaches depending on each region’s specific climate parameters, soil type, topography, technology availability, suitability, etc. However, in this study, we showed only the inferred impacts of the mean growing season temperatures (Tmin and Tmax) and the SPEI as influencing factors to yield variability and decline from 1990–2019. Hence, more insights related to the significant decline in yield trends within the study regions may be obtained by including the influence of other climate parameters and or non-climatic factors, such as agronomic practices, agricultural policies, market prices, cultivars, and fertilizers, which were not captured/included in our model.
Although the impact of climate trends on crop yields had mixed effects and involved greater uncertainties, most likely during certain growth stages of the crops studied, the results of this study provide an understanding of the significance of climate trends and set the bibliographic basis for projecting current and future climate impacts on yields in the Gambia. Policymakers can use this information for informed decision-making geared towards improving crop productivity.

Author Contributions

Conceptualization, F.F.J. and Y.L.; methodology, F.F.J. and Y.L.; data collection, F.F.J.; validation, F.F.J., Y.L., and T.Z.; formal analysis, F.F.J., Y.L., and T.Z.; investigation, F.F.J..; resources, Y.L..; data curation, F.F.J. and W.B.; writing—original draft preparation, F.F.J.; writing—review and editing, F.F.J., Y.L., T.Z., and W.H.; visualization, F.F.J., W.B., Y.S., and W.H.; supervision, F.F.J., Y.L., and T.Z.; funding acquisition, Y.L. and Y.S. All authors have read and agreed to the published version of the manuscript.

Funding

This research was funded by China’s National Key Research and Development Program (Grand No. 2017YFD0300400).

Institutional Review Board Statement

Not applicable.

Informed Consent Statement

Not applicable.

Data Availability Statement

The data that support the findings of this study are available upon reasonable request from the corresponding author and/or from the department of water resources and the planning service unit of the Gambia. The data are not yet publicly available due to efforts to publish it in a data journal.

Acknowledgments

We thank the National Key Research and Development Program of China for the financial support, the Department of Water Resources and the Planning Service Unit of the Gambia for their willingness to provide the necessary data for the research.

Conflicts of Interest

All authors declare that they have no financial or personal conflicts of interest that are relevant and/or could influence the content reported in this article.

References

  1. Grassini, P.; Eskridge, K.M.; Cassman, K.G. Distinguishing between yield advances and yield plateaus in historical crop production trends. Nat. Commun. 2013, 4, 2918. [Google Scholar] [CrossRef] [PubMed]
  2. Lobell, D.B.; Schlenker, W.; Costa-Roberts, J. Climate trends and global crop production since 1980. Science 2011, 333, 616–620. [Google Scholar] [CrossRef] [Green Version]
  3. Peña-Gallardo, M.; Vicente-Serrano, S.M.; Quiring, S.; Svoboda, M.; Hannaford, J.; Tomas-Burguera, M.; Martín-Hernández, N.; Domínguez-Castro, F.; El Kenawy, A. Response of crop yield to different time-scales of drought in the United States: Spatio-temporal patterns and climatic and environmental drivers. Agric. For. Meteorol. 2019, 264, 40–55. [Google Scholar] [CrossRef] [Green Version]
  4. Intergovernmental Panel on Climate Change (IPCC). Climate change 2007: The physical science basis. S. Afr. Geogr. J. 2013, 92, 86–87. [Google Scholar] [CrossRef] [Green Version]
  5. Intergovernmental Panel on Climate Change (IPCC). Climate Change 2014: Impacts, Adaptation, and Vulnerability; Impacts, Adaptation, and Vulnerability; Part A: Global and Sectoral Aspects; Contribution of Working Group II to the Fifth Assessment Report of the Intergovernmental Panel on Climate Change; Cambridge University Press: Cambridge, UK; New York, NY, USA, 2014; p. 1132. [Google Scholar]
  6. Araya, A.; Hoogenboom, G.; Luedeling, E.; Hadgu, K.M.; Kisekka, I.; Martorano, L.G. Assessment of maize growth and yield using crop models under present and future climate in southwestern Ethiopia. Agric. For. Meteorol. 2015, 214–215, 252–265. [Google Scholar] [CrossRef]
  7. Gammans, M.; Mérel, P.; Ortiz-Bobea, A. Negative impacts of climate change on cereal yields: Statistical evidence from France. Environ. Res. Lett. 2017, 12, 054007. [Google Scholar] [CrossRef]
  8. Hansen, J.; Ruedy, R.; Sato, M.; Lo, K. Global surface temperature change. Rev. Geophys. 2010, 48, 1–29. [Google Scholar] [CrossRef] [Green Version]
  9. Zewdie, A. Impacts of Climate Change on Food Security: A Literature Review in Sub Saharan Africa. J. Earth Sci. Clim. Change 2014, 5, 8–11. [Google Scholar] [CrossRef]
  10. Mesike, C.S.; Esekhade, T.U. Rainfall variability and rubber production in Nigeria. Afr. J. Environ. Sci. Technol. 2014, 8, 54–57. [Google Scholar] [CrossRef]
  11. Vogel, E.; Donat, M.G.; Alexander, L.V.; Meinshausen, M.; Ray, D.K.; Karoly, D.; Meinshausen, N.; Frieler, K. The effects of climate extremes on global agricultural yields. Environ. Res. Lett. 2019, 14, 054010. [Google Scholar] [CrossRef]
  12. Nkemelang, T.; New, M.; Zaroug, M. Temperature and precipitation extremes under current, 1.5 °C and 2.0 °C global warming above pre-industrial levels over Botswana, and implications for climate change vulnerability. Environ. Res. Lett. 2018, 13, 065016. [Google Scholar] [CrossRef] [Green Version]
  13. Adamgbe, E.M.; Ujoh, F. Effect of Variability in Rainfall Characteristics on Maize Yield in Gboko, Nigeria. J. Environ. Prot. 2013, 04, 881–887. [Google Scholar] [CrossRef] [Green Version]
  14. Yamusa, A.M.; Abubakar, I.U.; Falaki, A.M. Rainfall variability and crop production in the North- western semi-arid zone of Nigeria. J. Soil Sci. Environ. Manag. 2015, 6, 125–131. [Google Scholar] [CrossRef]
  15. Ahmed, M.; Hassan, F.U.; Aslam, M.A.; Akram, M.N.; Akmal, M. Regression model for the study of sole and cumulative effect of temperature and solar radiation on wheat yield. Afr. J. Biotechnol. 2011, 10, 9114–9121. [Google Scholar] [CrossRef] [Green Version]
  16. Ramirez-Villegas, J.; Thornton, P.K. Climate Change Impacts on African Crop Production; CCAFS Working Paper No. 119; CGIAR Research Program on Climate Change, Agriculture and Food Security (CCAFS): Copenhagen, Denmark, 2015; pp. 1–27. [Google Scholar]
  17. Cairns, J.E.; Sonder, K.; Zaidi, P.H.; Verhulst, N.; Mahuku, G.; Babu, R.; Nair, S.K.; Das, B.; Govaerts, B.; Vinayan, M.T.; et al. Maize production in a changing climate. impacts, adaptation, and mitigation strategies. Adv. Agron. 2012, 114, 1–58. [Google Scholar] [CrossRef]
  18. Byakatonda, J.; Parida, B.P.; Kenabatho, P.K.; Moalafhi, D.B. Influence of climate variability and length of rainy season on crop yields in semiarid Botswana. Agric. For. Meteorol. 2018, 248, 130–144. [Google Scholar] [CrossRef]
  19. World Bank. The Gambia Agriculture Engagement Note: Fostering Agriculture-Led Inclusive Growth; World Bank: Washington, DC, USA, 2019; pp. 1–51. [Google Scholar]
  20. Sanneh, E.S.; Hu, A.H.; Hsu, C.W.; Njie, M. Prioritization of climate change adaptation approaches in the Gambia. Mitig. Adapt. Strateg. Glob. Chang. 2014, 19, 1163–1178. [Google Scholar] [CrossRef]
  21. Jaiteh, M.S. Climate Change and Development in the Gambia Challenges to Ecosystem Goods and Services; Center for International Earth Science Information Network (CIESIN): Kanifing, Gambia, 2011; pp. 1–57. [Google Scholar]
  22. Loum, A.; Fogarassy, C. The effects of climate change on cereals yield of production and food security in Gambia. Appl. Stud. Agribus. Commer. 2015, 9, 83–92. [Google Scholar] [CrossRef]
  23. Serdeczny, O.; Adams, S.; Baarsch, F.; Coumou, D.; Robinson, A.; Hare, W.; Schaeffer, M.; Perrette, M.; Reinhardt, J. Climate change impacts in Sub-Saharan Africa: From physical changes to their social repercussions. Reg. Environ. Chang. 2017, 17, 1585–1600. [Google Scholar] [CrossRef]
  24. Omoyo, N.N.; Wakhungu, J.; Oteng’i, S. Effects of climate variability on maize yield in the arid and semi arid lands of lower eastern Kenya. Agric. Food Secur. 2015, 1–13. [Google Scholar] [CrossRef] [Green Version]
  25. Xu, X.; Hu, H.; Tan, Y.; Yang, G.; Zhu, P.; Jiang, B. Quantifying the impacts of climate variability and human interventions on crop production and food security in the Yangtze River Basin, China, 1990–2015. Sci. Total Environ. 2019, 665, 379–389. [Google Scholar] [CrossRef] [PubMed]
  26. Najafi, E.; Pal, I.; Khanbilvardi, R. Climate drives variability and joint variability of global crop yields. Sci. Total Environ. 2019, 662, 361–372. [Google Scholar] [CrossRef]
  27. Bhatt, D.; Maskey, S.; Babel, M.S.; Uhlenbrook, S.; Prasad, K.C. Climate trends and impacts on crop production in the Koshi River basin of Nepal. Reg. Environ. Chang. 2014, 14, 1291–1301. [Google Scholar] [CrossRef] [Green Version]
  28. Li, X.; Takahashi, T.; Suzuki, N.; Kaiser, H.M. The impact of climate change on maize yields in the United States and China. Agric. Syst. 2011, 104, 348–353. [Google Scholar] [CrossRef]
  29. Nicholls, N. Increased Australian wheat yield due to recent climate trends. Nature 1997, 387, 484–485. [Google Scholar] [CrossRef]
  30. Tao, F.; Yokozawa, M.; Liu, J.; Zhang, Z. Climate-crop yield relationships at provincial scales in China and the impacts of recent climate trends. Clim. Res. 2008, 38, 83–94. [Google Scholar] [CrossRef]
  31. Lobell, D.B.; Bänziger, M.; Magorokosho, C.; Vivek, B. Nonlinear heat effects on African maize as evidenced by historical yield trials. Nat. Clim. Chang. 2011, 1, 42–45. [Google Scholar] [CrossRef]
  32. Wei, T.; Cherry, T.L.; Glomrød, S.; Zhang, T. Climate change impacts on crop yield: Evidence from China. Sci. Total Environ. 2014, 499, 133–140. [Google Scholar] [CrossRef] [PubMed] [Green Version]
  33. Intergovernmental Panel on Climate Change (IPCC). Managing the Risks of Extreme Events and Disasters to Advance Climate Change Adaptation; A Special Report of Working Groups I and II of the Intergovernmental Panel on Climate Change. Cambridge University Press: Cambridge, UK; New York, NY, USA, 2012; p. 582. [Google Scholar]
  34. Leng, G.; Tang, Q.; Rayburg, S. Climate change impacts on meteorological, agricultural and hydrological droughts in China. Glob. Planet. Change 2015, 126, 23–34. [Google Scholar] [CrossRef]
  35. Zampieri, M.; Ceglar, A.; Dentener, F.; Toreti, A. Wheat yield loss attributable to heat waves, drought and water excess at the global, national and subnational scales. Environ. Res. Lett. 2017, 12, 064008. [Google Scholar] [CrossRef]
  36. Tubiello, F.N.; Soussana, J.-F.; Howden, S. Crop and pasture response to climate change. Proc. Natl. Acad. Sci. USA 2007, 104, 19686–19690. [Google Scholar] [CrossRef] [PubMed] [Green Version]
  37. Rowhani, P.; Lobell, D.B.; Linderman, M.; Ramankutty, N. Climate variability and crop production in Tanzania. Agric. For. Meteorol. 2011, 151, 449–460. [Google Scholar] [CrossRef]
  38. Shi, W.; Tao, F. Vulnerability of African maize yield to climate change and variability during 1961–2010. Food Secur. 2014, 6, 471–481. [Google Scholar] [CrossRef]
  39. Miyan, M.A. Droughts in asian least developed countries: Vulnerability and sustainability. Weather Clim. Extrem. 2015, 7, 8–23. [Google Scholar] [CrossRef] [Green Version]
  40. Palmer, W.C. Meteorological Drought. U.S. Weather Bur. Res. Pap. 1965, 45, 58. [Google Scholar]
  41. McKee, T.B.; Doesken, N.J.; Kleist, J. The relationship of drought frequency and duration to time scales. In Proceedings of the 8th Conference on Applied Climatology, Boston, MA, USA, 17–22 January 1993; pp. 179–184. [Google Scholar]
  42. Vicente-Serrano, S.M.; Beguería, S.; López-Moreno, J.I. A multiscalar drought index sensitive to global warming: The standardized precipitation evapotranspiration index. J. Clim. 2010, 23, 1696–1718. [Google Scholar] [CrossRef] [Green Version]
  43. Potopová, V.; Štěpánek, P.; Možný, M.; Türkott, L.; Soukup, J. Performance of the standardised precipitation evapotranspiration index at various lags for agricultural drought risk assessment in the Czech Republic. Agric. For. Meteorol. 2015, 202, 26–38. [Google Scholar] [CrossRef]
  44. Lu, J.; Carbone, G.J.; Gao, P. Detrending crop yield data for spatial visualization of drought impacts in the United States, 1895–2014. Agric. For. Meteorol. 2017, 237–238, 196–208. [Google Scholar] [CrossRef]
  45. Wang, Q.; Wu, J.; Li, X.; Zhou, H.; Yang, J.; Geng, G.; An, X.; Liu, L.; Tang, Z. A comprehensively quantitative method of evaluating the impact of drought on crop yield using daily multi-scale SPEI and crop growth process model. Int. J. Biometeorol. 2017, 61, 685–699. [Google Scholar] [CrossRef]
  46. International Fund for Agricultural Development (IFAD). (The) Resilience of Organizations for Transformative Smallholder Agriculture Programme: Project Design Report; International Fund for Agricultural Development (IFAD): Rome, Italy, 2019; pp. 1–377. [Google Scholar]
  47. Yaffa, S. Loss and Damage from Drought in the North Bank Region of The Gambia. In Loss and Damage in Vulnerable Countries Initiative, Case Study Report; United Nations University Institute for Environment and Human Security: Bonn, Germany, 2013; pp. 1–44. [Google Scholar]
  48. Kutir, C. Farmers Awareness and Response to Climate Change: A Case Study of the North Bank Region, The Gambia. J. Econ. Sustain. Dev. 2015, 6, 32–41. [Google Scholar]
  49. Bagagnan, A.R.; Ouedraogo, I.; Fonta, W.M. Perceived climate variability and farm level adaptation in the Central River Region of The Gambia. Atmosphere 2019, 10, 423. [Google Scholar] [CrossRef] [Green Version]
  50. Food and Agriculture Organization of the United Nations (FAO); International Crops Research Institute for the Semi-Arid Tropics (ICRISAT); International Center for Tropical Agriculture (CIAT). Climate-Smart Agriculture in the Gambia; CSA Country Profiles for Africa Series; International Center for Tropical Agriculture (CIAT): Rome, Italy; International Crops Research Institute for the Semi-Arid Tropics (ICRISAT): Hyderabad, India; Food and Agriculture Organization of the United Nations (FAO): Rome, Italy, 2018; pp. 1–26. [Google Scholar]
  51. International Fund for Agricultural Development (IFAD). Republic of The Gambia: Country Strategic Opportunities Programme 2019–2024; Note to Executive Board Representatives Focal points: Executive Board-126th Session; International Fund for Agricultural Development (IFAD): Rome, Italy, 2019; pp. 1–66. [Google Scholar]
  52. Government of The Gambia. The Gambia Annual Climate Report; Government of The Gambia: Banjul, Gambia, 2018; pp. 1–45. [Google Scholar]
  53. Wagner, A.; Hermelin, B.; Bruyeron, O.; Alby-Flores, V.; Faivre-Dupaigre, B.; Kaboré, C.; Ficini, C. Food Security Profile, The Gambia; CSAO-CILSS: Banjul, Gambia, 2008. [Google Scholar]
  54. R Core Team. A Language and Environment for Statistical Computing; R Foundation for Statistical Computing: Vienna, Austria, 2019. [Google Scholar]
  55. Gourdji, S.; Läderach, P.; Valle, A.M.; Martinez, C.Z.; Lobell, D.B. Historical climate trends, deforestation, and maize and bean yields in Nicaragua. Agric. For. Meteorol. 2015, 200, 270–281. [Google Scholar] [CrossRef] [Green Version]
  56. Etana, D.; Snelder, D.J.R.M.; van Wesenbeeck, C.F.A. Trends of Climate Change and Variability in Three Agro-Ecological Settings in Central Ethiopia: Contrasts of Meteorological Data and Farmers’ Perceptions. Climate 2020, 8, 121. [Google Scholar] [CrossRef]
  57. Hargreaves, B.G.H. Reference evapotranspiration. J. Irrig. Drain. Eng. 1994, 120, 1132–1139. [Google Scholar] [CrossRef]
  58. Venkataraman, K.; Nelson, M.; Frandsen, C. Comparison of Two Temperature-Based Methods of Estimating Potential Evapotranspiration (PET) in Texas. In Proceedings of the World Environmental and Water Resources Congress 2016: Hydraulics and Waterways and Hydro-Climate/Climate Change, West Palm Beach, FL, USA, 22–26 May 2016; pp. 699–708. [Google Scholar] [CrossRef]
  59. Allen, R.G.; Pereira, L.S.; Raes, D.; Smith, M. Crop Evapotraspiration Guidelines for Computing Crop Water Requirements; Food and Agriculture Organization of the United Nations: Rome, Italy, 1998; ISBN 9251042195. [Google Scholar]
  60. Fu, J.; Niu, J.; Kang, S.; Adeloye, A.J.; Du, T. Crop production in the Hexi Corridor challenged by future climate change. J. Hydrol. 2019, 579, 124197. [Google Scholar] [CrossRef]
  61. Beguería, S.; Vicente-Serrano, S.M.; Reig, F.; Latorre, B. Standardized Precipitation Evapotranspiration Index (SPEI) revisited: Parameter fitting, evapotranspiration models, tools, datasets and drought monitoring. Int. J. Climatol. 2014, 34, 1–48. [Google Scholar] [CrossRef] [Green Version]
  62. Potopová, V.; Boroneanţ, C.; Boincean, B.; Soukup, J. Impact of agricultural drought on main crop yields in the Republic of Moldova. Int. J. Climatol. 2016, 36, 2063–2082. [Google Scholar] [CrossRef] [Green Version]
  63. Begueria, S.; Serrano, V.; Sawasawa, H. SPEI: Calculation of Standardised Precipitation-Evapotranspiration index. R Package Version 1.7. 2017, 16. [Google Scholar] [CrossRef] [Green Version]
  64. Masupha, T.E.; Moeletsi, M.E. Use of standardized precipitation evapotranspiration index to investigate drought relative to maize, in the Luvuvhu River catchment area, South Africa. Phys. Chem. Earth 2017, 102, 1–9. [Google Scholar] [CrossRef]
  65. Tian, L.; Yuan, S.; Quiring, S.M. Evaluation of six indices for monitoring agricultural drought in the south-central United States. Agric. For. Meteorol. 2018, 249, 107–119. [Google Scholar] [CrossRef]
  66. Tan, C.; Yang, J.; Li, M. Temporal-spatial variation of drought indicated by SPI and SPEI in Ningxia Hui Autonomous Region, China. Atmosphere 2015, 6, 1399–1421. [Google Scholar] [CrossRef] [Green Version]
  67. Karunaratne, A.S.; Wheeler, T. Observed relationships between maize yield and climate in Sri Lanka. Agron. J. 2015, 107, 395–405. [Google Scholar] [CrossRef]
  68. Tunde, A.M.; Usman, B.A.; Olawepo, V.O. Effects of climatic variables on crop production in Patigi L. G. A., Kwara State, Nigeria. J. Geogr. Reg. Plan. 2011, 4, 695–700. [Google Scholar]
  69. Alemayehu, A.; Bewket, W. Local climate variability and crop production in the central highlands of Ethiopia. Environ. Dev. 2016, 19, 36–48. [Google Scholar] [CrossRef]
  70. Poudel, S.; Shaw, R. The relationships between climate variability and crop yield in a mountainous environment: A case study in Lamjung District, Nepal. Climate 2016, 4. [Google Scholar] [CrossRef] [Green Version]
  71. Prabnakorn, S.; Maskey, S.; Suryadi, F.X.; de Fraiture, C. Rice yield in response to climate trends and drought index in the Mun River Basin, Thailand. Sci. Total Environ. 2018, 621, 108–119. [Google Scholar] [CrossRef]
  72. Shiru, M.S.; Shahid, S.; Dewan, A.; Chung, E.S.; Alias, N.; Ahmed, K.; Hassan, Q.K. Projection of meteorological droughts in Nigeria during growing seasons under climate change scenarios. Sci. Rep. 2020, 10, 1–18. [Google Scholar] [CrossRef]
  73. Ahammed, S.J.; Homsi, R.; Khan, N.; Shahid, S.; Shiru, M.S.; Mohsenipour, M.; Ahmed, K.; Nawaz, N.; Alias, N.E.; Yuzir, A. Assessment of changing pattern of crop water stress in Bangladesh. Environ. Dev. Sustain. 2020, 22, 4619–4637. [Google Scholar] [CrossRef]
  74. Sediqi, M.N.; Shiru, M.S.; Nashwan, M.S.; Ali, R.; Abubaker, S.; Wang, X.; Ahmed, K.; Shahid, S.; Asaduzzaman, M.; Manawi, S.M.A. Spatio-temporal pattern in the changes in availability and sustainability ofwater resources in Afghanistan. Sustainability 2019, 11, 5836. [Google Scholar] [CrossRef] [Green Version]
  75. Cao, Y.; Chen, S.; Wang, L.; Zhu, B.; Lu, T.; Yu, Y. An agricultural drought index for assessing droughts using awater balance method: A case study in Jilin Province, Northeast China. Remote Sens. 2019, 11, 66. [Google Scholar] [CrossRef] [Green Version]
  76. Adhikari, U.; Nejadhashemi, A.P.; Woznicki, S. Climate change and eastern Africa: A review of impact on major crops. Food Energy Secur. 2015, 4, 110–132. [Google Scholar] [CrossRef]
  77. Zhou, L.; Dickinson, R.E.; Tian, Y.; Fang, J.; Li, Q.; Kaufmann, R.K.; Tucker, C.J.; Myneni, R.B. Evidence for a significant urbanization effect on climate in China. Proc. Natl. Acad. Sci. USA 2004, 101, 9540–9544. [Google Scholar] [CrossRef] [PubMed] [Green Version]
  78. Padma Kumari, B.; Londhe, A.L.; Daniel, S.; Jadhav, D.B. Observational evidence of solar dimming: Offsetting surface warming over India. Geophys. Res. Lett. 2007, 34, 1–5. [Google Scholar] [CrossRef]
  79. Yaro, J.A.; Hesselberg, J. Adaptation to Climate Change and Variability in Rural West Africa; Yaro, J.A., Hesselberg, J., Eds.; Springer International Publishing: Cham, Switzerland, 2016; ISBN 978-3-319-31497-6. [Google Scholar]
  80. Roudier, P.; Sultan, B.; Quirion, P.; Berg, A. The impact of future climate change on West African crop yields: What does the recent literature say? Glob. Environ. Chang. 2011, 21, 1073–1083. [Google Scholar] [CrossRef] [Green Version]
  81. Lloyd-Hughes, B. A spatio-temporal structure-based approach to drought characterisation. Int. J. Climatol. 2012, 32, 406–418. [Google Scholar] [CrossRef] [Green Version]
  82. Vondou, D.A.; Guenang, G.M.; Djiotang, T.L.A.; Kamsu-Tamo, P.H. Article trends and interannual variability of extreme rainfall indices over Cameroon. Sustainability 2021, 13, 1–12. [Google Scholar] [CrossRef]
  83. Hamal, K.; Sharma, S.; Khadka, N.; Haile, G.G.; Joshi, B.B.; Xu, T.; Dawadi, B. Assessment of drought impacts on crop yields across Nepal during 1987–2017. Meteorol. Appl. 2020, 27, 1–18. [Google Scholar] [CrossRef]
  84. Tao, H.; Borth, H.; Fraedrich, K.; Su, B.; Zhu, X. Drought and wetness variability in the Tarim River Basin and connection to large-scale atmospheric circulation. Int. J. Climatol. 2014, 34, 2678–2684. [Google Scholar] [CrossRef]
  85. Haile, G.G.; Tang, Q.; Leng, G.; Jia, G.; Wang, J.; Cai, D.; Sun, S.; Baniya, B.; Zhang, Q. Long-term spatiotemporal variation of drought patterns over the Greater Horn of Africa. Sci. Total Environ. 2020, 704, 135299. [Google Scholar] [CrossRef]
  86. Panthou, G.; Vischel, T.; Lebel, T. Recent trends in the regime of extreme rainfall in the Central Sahel. Int. J. Climatol. 2014, 34, 3998–4006. [Google Scholar] [CrossRef]
  87. Reay, D.; Sabine, C.; Smith, P.; Hymus, G. Spring-time for sinks. Nature 2007, 446, 727–728. [Google Scholar] [CrossRef]
  88. Kukal, M.S.; Irmak, S. Climate-Driven Crop Yield and Yield Variability and Climate Change Impacts on the U.S. Great Plains Agricultural Production. Sci. Rep. 2018, 8, 3450. [Google Scholar] [CrossRef] [PubMed] [Green Version]
  89. Urban Market Assessment in The Gambia A feasibility study on cash and vouchers September 2011 Table of Contents List of Acronyms Acknowledgments. 2011. Available online: https://reliefweb.int/report/gambia/urban-market-assessment-gambia-feasibility-study-cash-and-vouchers (accessed on 20 October 2021).
  90. Gibba, A. The Competitiveness of Gambia’s Agricultural Products in International Trade: An Incentive for Economic Progress. Ph.D. Thesis, Doctoral School of Management and Business Administration Sciences, Szent Istvan University, Godollo, Hungary, 2017. [Google Scholar]
  91. Niang, I.; Ruppel, O.C.; Abdrabo, M.A.; Essel, A.; Lennard, C.; Padgham, J.; Urquhart, P. Africa. In Climate Change 2014 Impacts, Adaptation and Vulnerability; Part B Reg. Asp. Work. Gr. II Contrib. to Fifth Assess. Rep. Intergov. Panel Clim. Chang.: Cambridge University Press: Cambridge, UK, 2015; pp. 1199–1266. [Google Scholar] [CrossRef]
  92. Traore, B.; Corbeels, M.; van Wijk, M.T.; Rufino, M.C.; Giller, K.E. Effects of climate variability and climate change on crop production in southern Mali. Eur. J. Agron. 2013, 49, 115–125. [Google Scholar] [CrossRef]
  93. Mumo, L.; Yu, J.; Fang, K. Assessing Impacts of Seasonal Climate Variability on Maize Yield in Kenya. Int. J. Plant Prod. 2018, 12, 297–307. [Google Scholar] [CrossRef]
  94. Liu, X.; Pan, Y.; Zhu, X.; Yang, T.; Bai, J.; Sun, Z. Drought evolution and its impact on the crop yield in the North China Plain. J. Hydrol. 2018, 564, 984–996. [Google Scholar] [CrossRef]
  95. Leng, G.; Huang, M. Crop yield response to climate change varies with crop spatial distribution pattern. Sci. Rep. 2017, 7, 1463. [Google Scholar] [CrossRef] [PubMed]
  96. Kotir, J.H. Climate change and variability in Sub-Saharan Africa: A review of current and future trends and impacts on agriculture and food security. Environ. Dev. Sustain. 2011, 13, 587–605. [Google Scholar] [CrossRef]
  97. Lobell, D.B.; Field, C.B. Global scale climate-crop yield relationships and the impacts of recent warming. Environ. Res. Lett. 2007, 2, 2. [Google Scholar] [CrossRef]
  98. Matiu, M.; Ankerst, D.; Menzel, A. Interactions between temperature and drought in global and regional crop yield variability during 1961–2014. PLoS ONE 2017, 12, e0178339. [Google Scholar] [CrossRef] [PubMed] [Green Version]
  99. Bapuji Rao, B.; Santhibhushan Chowdary, P.; Sandeep, V.M.; Rao, V.U.M.; Venkateswarlu, B. Rising minimum temperature trends over India in recent decades: Implications for agricultural production. Glob. Planet. Chang. 2014, 117, 1–8. [Google Scholar] [CrossRef]
  100. Waha, K.; Müller, C.; Rolinski, S. Separate and combined effects of temperature and precipitation change on maize yields in sub-Saharan Africa for mid- to late-21st century. Glob. Planet. Chang. 2013, 106, 1–12. [Google Scholar] [CrossRef]
  101. Ahmed, K.F.; Wang, G.; Yu, M.; Koo, J.; You, L. Potential impact of climate change on cereal crop yield in West Africa. Clim. Chang. 2015, 133, 321–334. [Google Scholar] [CrossRef]
Figure 1. Agro-ecological regions and the spatial distribution of the weather stations used in the study.
Sustainability 13 12480 g001
Figure 2. Spatial and temporal variability and distribution of Tmin and Tmax in the growing season of the three (3) agro-ecological regions.
Sustainability 13 12480 g002
Figure 3. Temporal variations of SPEI-1 and SPEI-3 at the 3 study regions (a) Sudano-Guinean, (b) Sudano-Sahelian, (c) Sahelian.
Sustainability 13 12480 g003
Figure 4. Temporal and spatial variation of wet and dry conditions from 1990–2019 based on SPEI-1(left) and SPEI-3 (right) values. The months June–October corresponds to the 5-month growing season. The climatic events are classified into two main groups: dryness (orange) and wetness (green). The color level displays the degrees of condition ranging from moderate to extreme. Adapted from the authors of [71].
Sustainability 13 12480 g004
Figure 5. Time series of sorghum, millet, maize, and rice yields from 1990 to 2019.
Sustainability 13 12480 g005
Figure 6. Pearson’s correlation between crop yields, SPEIs, Tmin, and Tmax for 1990–2019. * p-value ≤ 0.05, ** p-value ≤ 0.01. The blue colors denote the positive values and the orange colors denote the negative values, respectively.
Sustainability 13 12480 g006
Figure 7. Estimated impacts of climate trends from the multiple linear regression for 1990–2019 on crop yields (kg ha−1 y−1).
Sustainability 13 12480 g007
Table 1. SPEI classifications corresponding to wet and dry conditions used in this study [66].
SPEI ValueSPEI Classification
≥2.00Extreme wet (EW)
1.50 to 1.99Severe wet (SW)
1.49 to 1.00Moderate wet (MW)
0.99 to −0.99Normal (N)
−1.00 to −1.49Moderate drought (MD)
−1.50 to −1.99Severe drought (SD)
≤−2.00Extreme drought (ED)
Table 2. Annual trend slopes of Tmin, Tmax, and SPEIs in the growing season for the three agro-ecological regions from 1990 to 2019.
TminTmax
JunJulAug.Sep.Oct.MeanJunJulAug.Sep.Oct.Mean
S. Guinean0.0250.018−0.0060.0180.029 *0.0170.0030.0270.0060.0050.0100.014
S. Sahelian0.000.000.018 **0.015 *0.038 **0.019 *0.0330.000.011−0.0070.010.011
Sahelian0.0080.0060.0000.0160.0170.0100.0410.025−0.023−0.0180.0130.010
SPEI-1SPEI-3
JunJulAug.Sep.Oct.MeanJunJulAug.Sep.Oct.Mean
S. Guinean0.0110.0040.0360.0130.0080.0130.0030.0090.0250.0290.0360.021
S. Sahelian−0.0030.0290.049 **0.061 **0.0060.029 *−0.0110.0170.066 **0.055 **0.0470.034 *
Sahelian−0.0150.0210.0320.038 *−0.0080.010−0.0160.0160.0370.0420.0340.021
** p-value ≤ 0.01, * p-value ≤ 0.05. The green and red colors represent positive and negative values, respectively. The different shades of green colors represent the significant and non-significant trends at the 95% confidence interval.
Table 3. Probabilities of experiencing anomalous dry and wet conditions in the 3 regions from 1990 to 2019.
CategorySPEI-1SPEI-3
S. GuineanS. SahelianSahelianS. GuineanS. SahelianSahelian
FPFPFPFPFPFP
Extreme drought10.00650.03320.01350.03300.0020.013
Severe drought110.07340.02630.0270.04750.03350.033
Moderate drought180.12210.14200.133130.086250.167200.133
Extreme wet40.02620.01310.00630.0220.01320.013
Severe wet30.02040.02680.05380.05350.03370.047
Moderate wet150.10180.12240.16130.086220.147210.14
Normal980.653960.64920.6131010.67910.606930.62
Table 4. Multiple linear regressions relating crop yields, SPEI-1, Tmin, and Tmax.
Sorghum Millet Maize Rice
EstimateSig.EstimateSig.EstimateSig.EstimateSig.
Intercept1.57 −4.86 −2.843 −13.1
S. GuineanSPEI−1168.250.04 *72.880.38108.520.0893.80.18
Tmin6.350.95162.260.11−72.980.32−168.980.06
Tmax16.370.89−233.30.07−74.1480.4228.60.78
R20.2 0.26 0.32 0.27
Sig.0.13 0.05 * 0.021 * 0.046 *
Intercept6.763 −7.53 −17.6 −11.357
S. SahelianSPEI-144.90.2172.320.05 *155.50.002 **96.670.015 *
Tmin−235.680.027 *−48.050.63−57.70.67−8.850.93
Tmax−167.070.03 *−89.540.23−34.210.72−142.970.07
R20.44 0.29 0.38 0.41
Sig.0.001 ** 0.032 * 0.007 ** 0.004 **
Intercept−1.798 −6.68 −23.96 −29.3
SahelianSPEI-1297.980.004 **190.70.016 *424.760.00 **377.490.03 *
Tmin−37.3380.7380.5170.34−208.320.03 *−456.920.02 *
Tmax−43.950.51−65.10.2258.910.3159.060.61
R20.39 0.32 0.62 0.38
Sig.0.006 ** 0.02 * 0.000 ** 0.006 **
* p < 0.05, ** p < 0.01.
Publisher’s Note: MDPI stays neutral with regard to jurisdictional claims in published maps and institutional affiliations.

