Article

Based on Multi-Activity Integrated Strategy to Screening, Characterization and Quantification of Bioactive Compounds from Red Wine

1
School of Pharmacy, Shenyang Pharmaceutical University, Shenyang 110016, China
2
NMPA Key Laboratory for Quality Research and Evaluation of Traditional Chinese Medicine, Shenzhen Institute for Drug Control, Shenzhen 518057, China
*
Authors to whom correspondence should be addressed.
These authors contributed equally to this work.
Molecules 2021, 26(21), 6750; https://doi.org/10.3390/molecules26216750
Submission received: 3 September 2021 / Revised: 2 November 2021 / Accepted: 5 November 2021 / Published: 8 November 2021

Abstract

:
According to French Paradox, red wine was famous for the potential effects on coronary heart disease (CHD), but the specific compounds against CHD were unclear. Therefore, screening and characterization of bioactive compounds from red wine was extremely necessary. In this paper, the multi-activity integrated strategy was developed and validated to screen, identify and quantify active compounds from red wine by using ultra high performance liquid chromatography-fraction collector (UHPLC-FC), ultra fast liquid chromatography-quadrupole-time-of-flight/mass spectrometry (UFLC-Q-TOF/MS) and bioactive analysis. UHPLC-FC was employed to separate and collect the components from red wine, which was further identified by UFLC-Q-TOF/MS to acquire their structural information. Furthermore, the active fractions were tested for antioxidant activity, inhibitory activity against thrombin and lipase activities in vitro by the activity screening kit. As the results, there were 37 fractions had antioxidant activity, 22 fractions had thrombin inhibitory activity and 28 fractions had lipase inhibitory activity. Finally, 77 active components from red wine were screened and 12 ingredients out of them were selected for quantification based on the integration of multi-activity. Collectively, the multi-activity integrated strategy was helpful for the rapid and effective discovery of bioactive components, which provided reference for exploring the health care function of food.

1. Introduction

As a nutritious drink recommended by World Health Organization (WHO), red wine was widely recognized for its role in health care. According to Ben Cao Gang Mu (Compendium of Materia Medica) record, the famous classic book of traditional Chinese medicine, red wine could treat cold coagulation and blood stasis. Modern pharmacological studies showed that red wine had the function of antioxidant, anticoagulant and lipid-lowering [1,2], which can prevent cardiovascular and cerebrovascular diseases such as coronary heart disease (CHD) [3,4].
It was widely believed that the mechanisms of CHD were the result of the interaction of many complex factors, among them the “response to injury hypothesis” had been recognized by researchers [5,6], which stated that the initial damage was the arterial endothelium, further leading to endothelial dysfunction [7]. Indeed, the occurrence of CHD was caused by many factors such as oxidative stress response, hyperlipidemia and platelet aggregation [8]. There were three main methods to treat CHD including pharmacotherapy, interventional therapy and operation [9,10]. Although these methods hold the potential effects for CHD, these methods would also lead some side effects such as common complications after coronary intervention included bleeding, pulmonary embolism, infection and so on. Besides, long term use of some medicines as nitroglycerin would also generate drug resistance and migraine pain [11]. Therefore, prevention CHD has become the trend of medical development.
The famous French paradox proved that red wine can prevent CHD [3]. Accumulated studies demonstrated that extracts from red wine possessed antioxidant activity, anti-coagulation and lipid-lowering efficacy, which corresponded to the pathogenesis of CHD. Traditional methods for isolating and evaluating components were most carried out on animal and cell models, which were time-consuming, labor-intensive, expensive and hardly to be used for the direct screening [12]. The developed methods for screening active compounds were extracted, the single component from sample and evaluated the biological activity by pharmacological means. Animal model was the most important screening manner in the part of bioactive components evaluation, which can clearly response to the efficacy of ingredients in the whole body. However, the method was high cost and low efficiency. Besides, compared with the animal model, cellular model was relatively cheap and convenient, but it had higher requirement on instrumentation [13]. Therefore, it was urgent to establish a fast, portable and accurate method to screen and identify the bioactive ingredients from red wine. Ultra high performance liquid chromatography (UHPLC) was used to separate the components of food with appropriate chromatographic conditions and the fraction collector was used to enrich compounds automatically in the fixed-time interval according to the retention time in the UHPLC chromatogram. Compared with HPLC, UHPLC exhibited higher separation and narrower chromatographic peak. At the same time, ACQUITY UPLC column (HSS T3, 1.8 μm, 2.1 mm × 100 mm, Waters, Ireland) could withstand 100% water mobile phase and the particle size was only 1.8 microns, which was adapted to separation of complex samples especially for the strong polar compounds from red wine. Indeed, some researches showed that ultra high performance liquid chromatography-fraction collector (UHPLC-FC) could quickly separate and enrich compounds. Moreover, ultra fast liquid chromatography-quadrupole-time-of-flight/mass spectrometry (UFLC-Q-TOF/MS) was used to identify the components for obtaining structural information [12]. Accordingly, integrated the UHPLC-FC and UFLC-Q-TOF/MS could be used for quickly separating, enriching and identifying the potential active compounds from complex samples.
In this study, UHPLC-FC was used to separate, collect and enrich the fractions from red wine. Then antioxidant activity, inhibitory activity against thrombin and lipase activities of all fractions were performed for evaluating activities. Furthermore, UFLC-Q-TOF/MS was used to identify the components in fractions from red wine (Figure 1). As the results, 77 potential active components from red wine were screened and 12 ingredients out of them were selected for quantification based on integration of the multi-activity. Accordingly, the multi-activity integrated strategy was significant for the rapid and effective discovery of the potential bioactive components from red wine to prevent CHD, which provided reference for exploring the health care function of food.

2. Result and Discussion

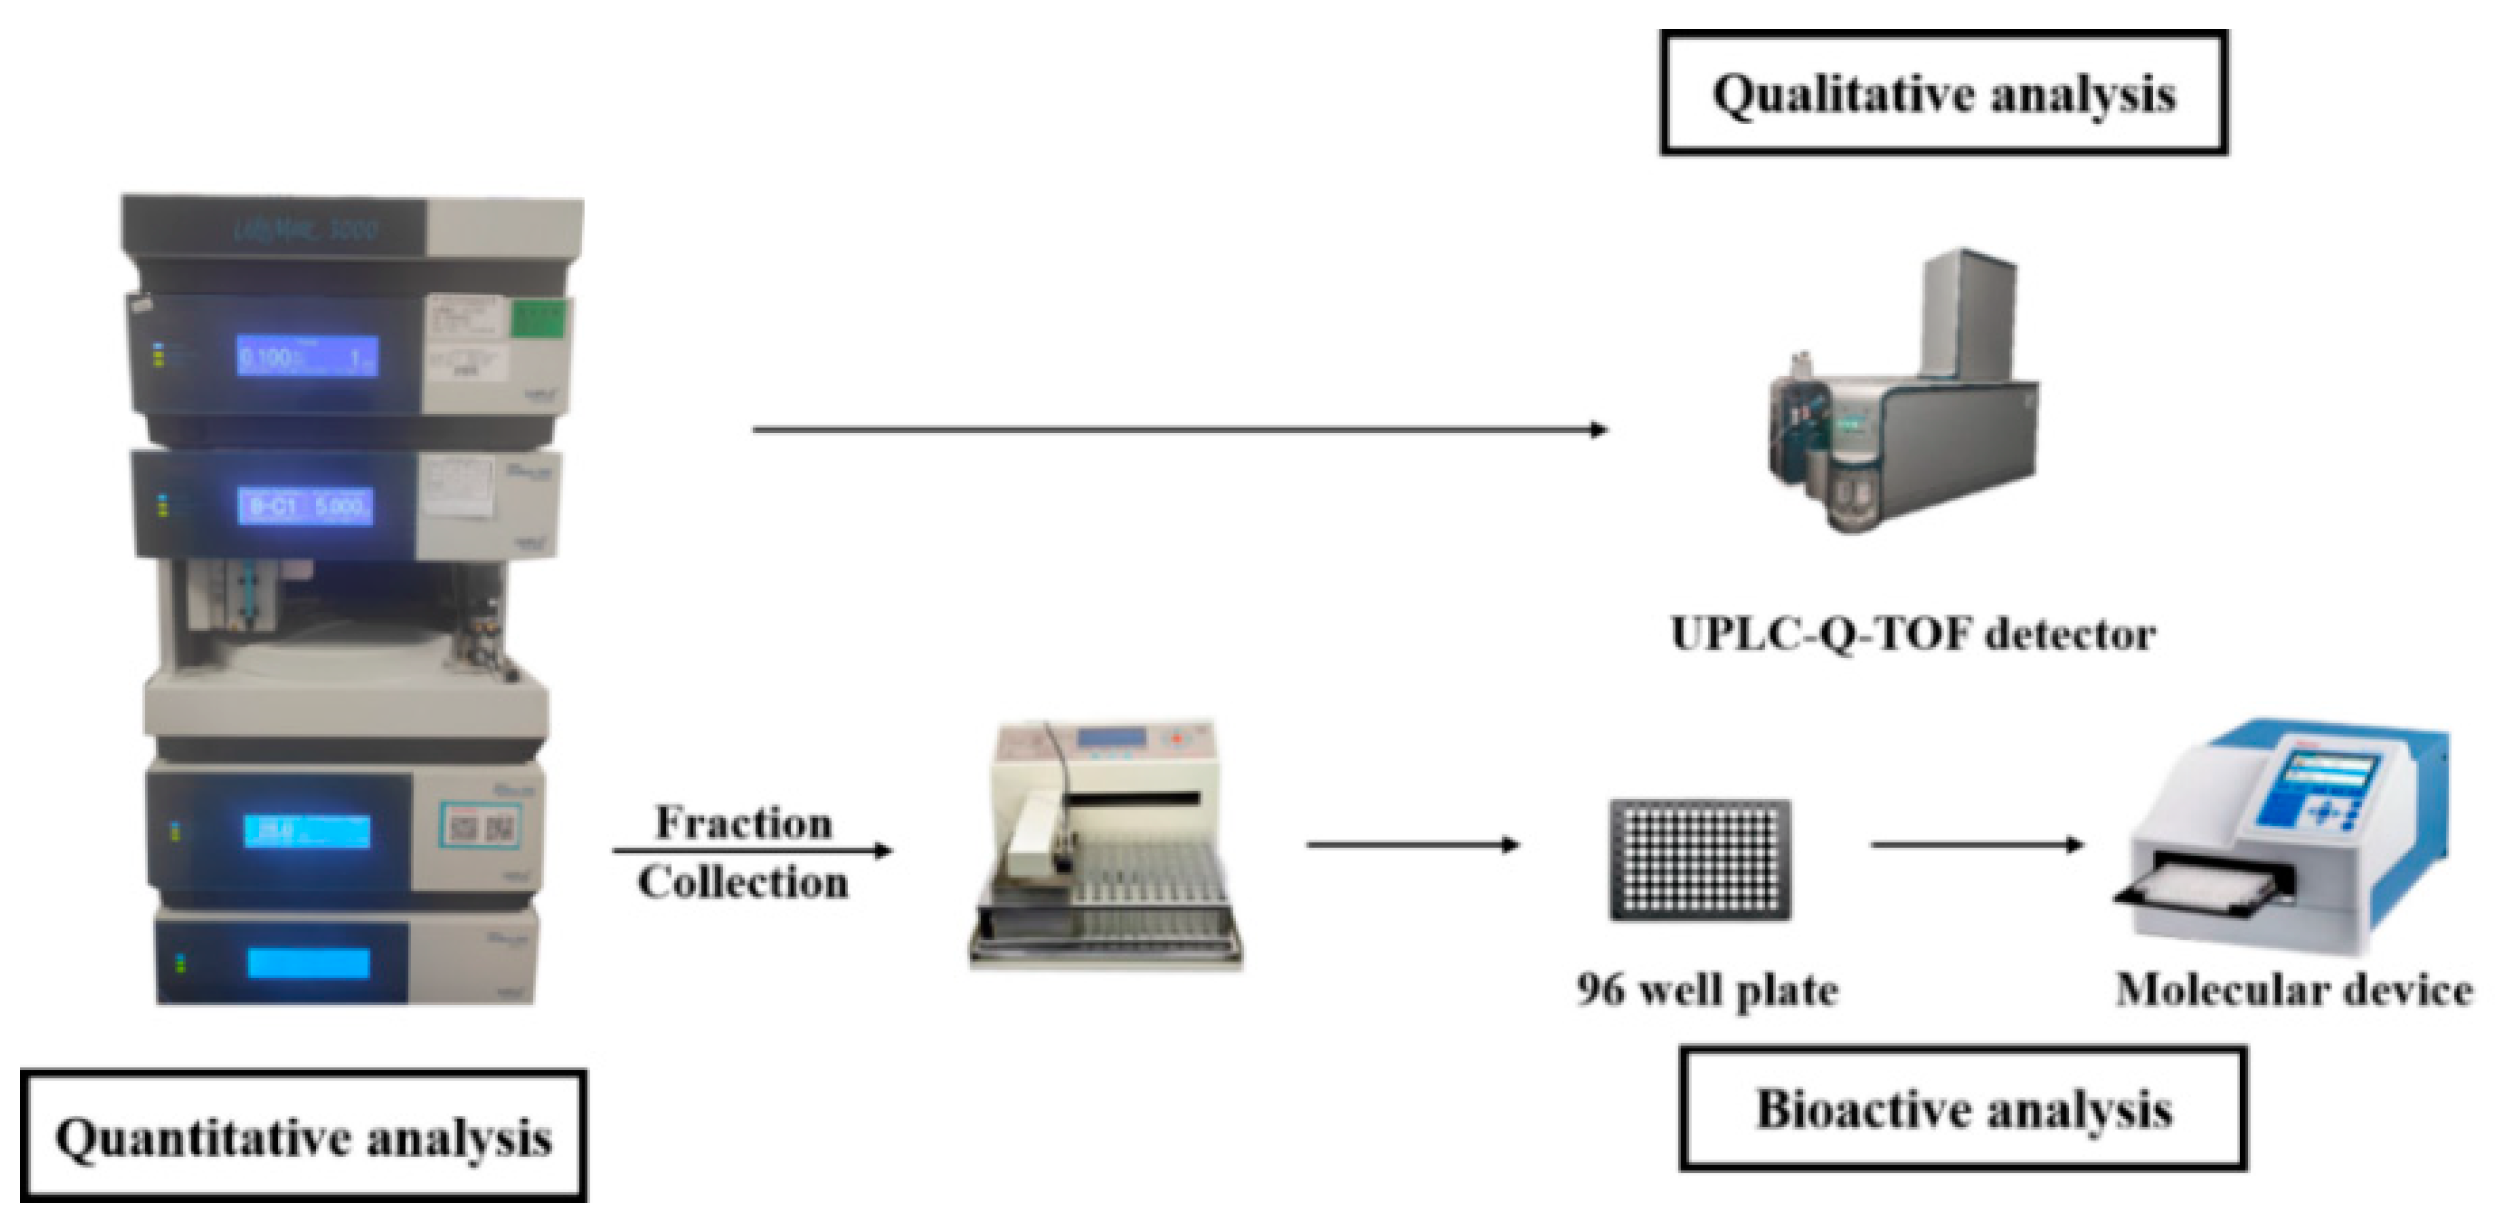
2.1. Establishment of Multi-Activity Integrated Strategy

In the study, an ultra high performance liquid chromatography-photo-diode array-fraction collector (UHPLC-PDA-FC) system was used to establish multi-activity integrated strategy for screening and evaluating the potentially bioactive components from red wine. The sample was divided into sixty fractions (60 s per fraction) by UHPLC-PDA-FC. Sixty fractions were used to screen the antioxidant activity, thrombin inhibitory activity and lipase inhibitory activity. The multi-activity integrated chromatogram consisted of chromatogram and multi-targets integrated column diagram of antioxidant activity, inhibitory activity of thrombin and lipase were established (Figure 2) and the detail data was listed in Table 1. The multi-activity integrated strategy could discover bioactive components rapidly and efficiently, which could be used for the identification and screening the active compounds from nutraceutical. According to the activities results, the activities were higher at 20 to 30 min, indicating that these kinds of ingredients may be the main active compounds from red wine.

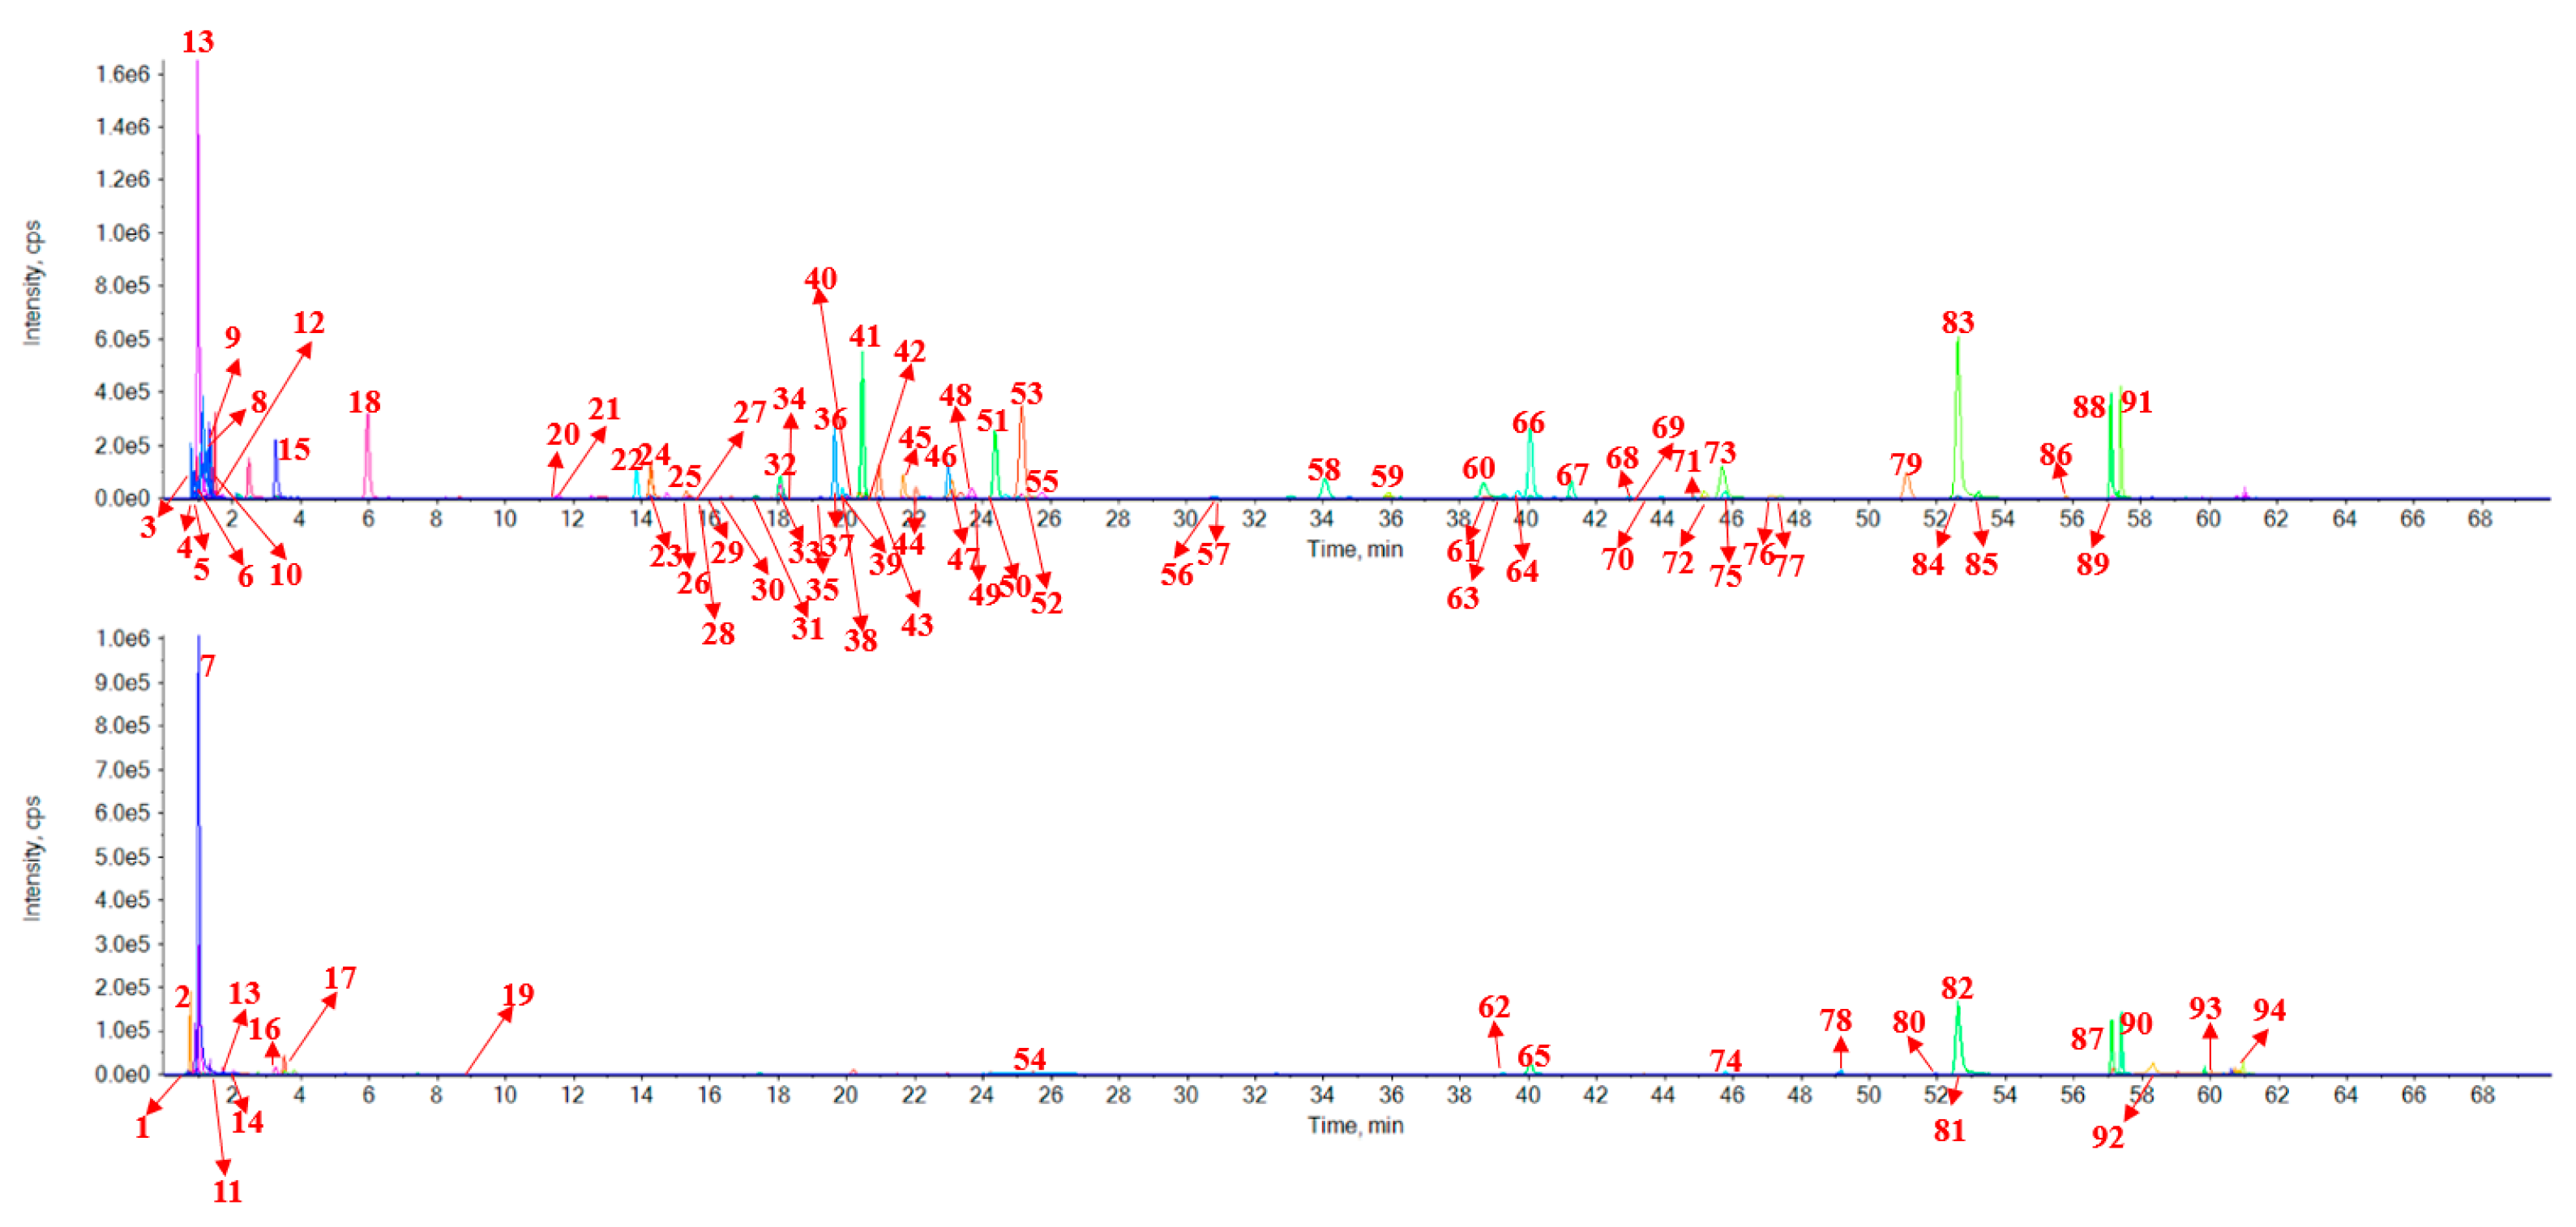
2.2. Identification of 94 Components from Red Wine

The components from red wine with antioxidant activity or inhibitory potential against thrombin and lipase activities were analyzed by UFLC-Q-TOF/MS to obtain structural information. The molecular compositions of ingredients were identified according to the literature and exact molecular weight. The peak number, retention time, MS/MS fragmentation ions information and identification of 94 components from red wine were listed in Table 2. The extracted ion chromatogram of positive and negative ions was illustrated in Figure 3. Peak 1 gave the mass spectrum ion at 116.0702 (C5H9NO2) with MS/MS fragment of 70.0647 (C4H7N) [M+H-HCOOH]+, which was detected to be D-proline [14,15,16]. Peaks 11 (C4H9N) [M+H-HCOOH]+ and 14 (C5H3N) [M+H-HCOOH]+ were based on the same regular. Therefore, peaks 11 and 14 were identified as L-valine (C5H11NO2) [14] and niacin (C6H5NO2) [17]. Peak 2 had the mass spectrum ion at 175.1189 (C6H14N4O2) with MS/MS fragment of 70.0652 [M+H-HCOOH-2NH2-CN]+, which was detected to be L-arginine [14]. Peak 3 had a molecular weight of 179.0562 (C6H12O6) with fragments of 99.0087 (C4H4O3) [M-H-3H2O-C2HO], 71.0137 (C3H4O2) [M-H-3H2O-C2HO-CO] and 59.0139 (C2H4O2) [M-H-3H2O-C2HO-CO-CH2]. Therefore, it was identified as D-glucose. Peak 4 had mass spectrum ion at 181.072 (C6H14O6) with MS/MS experiment gave fragmentation information for 83.0143 [M-H-C3H2O3] and 71.0140 [M-H-C3H6O3-H2O], which could be identified as D-mannitol [18]. Peak 5 had major ions at m/z 191.0199 (C6H8O7) and the MS/MS fragments were 85.0296 (C4H6O2) [M-H-2CO2-H2O] and 59.0134 (C3H8O) [M-H-3CO2]. Therefore, it was identified as citric acid [19]. Peak 6 was identified as tartaric acid by its characteristic fragmentation pattern, which MS/MS spectra ions m/z 105.0217 (C3H6O4) [M-H-CO2] and 87.0085 (C3H4O3) [M-H-CO2-H2O] were observed [20]. By the similar regular pattern, peak 40 (C9H8O3) had the MS/MS fragment of m/z 119.0502 (C8H8O) [M-H-CO2]. Therefore, Peak 40 was identified as 2-hydroxycinnamic acid [21]. Peak 7, the molecular weight was 138.0548 (C7H7NO2) and the fragment ions observed included m/z 120.0433 (C6H7N) [M+H-H2O]+, 78.0339 (C6H6) [M+H-HCOOH-NH2]+, which was identified to be 4-aminobenzoic acid [22]. Peak 8 gave a mass spectrum ion at 341.1088 (C12H22O11) with MS/MS fragments of 161.0459 (C6H9O5) [M-H-C6H11O5-H2O] and 71.0137 (C3H4O2) [M-H-C9H14O8-H2O], which was detected to be trehalose [23]. The molecular weight of peak 9 was 149.0455 (C5H10O5). In the MS/MS experiment, the predominant ions appeared at 75.0221 (C3H7O2) [M-H-C2H3O3] and 59.0133 (C2H2O2) [M-H-C3H8O2]. By comparing the characteristic fragmentation pattern with the reported in references, it can be identified as D-ribose. Peaks 10 (C4H6O5) was identified as L-malic acid [24] which the H2O was removed at first, and then the CO2 was removed. MS/MS fragment of L-malic acid was 115.0018 (C4H4O4) [M-H-H2O] and 71.0137 (C3H4O2) [M-H-H2O-CO2]. Peaks 12 (C7H10O5) was identified as shikimic acid. MS/MS fragment was 137.0225 (C7H6O3) [M-H-2H2O]. The molecular weight of peak 13 was 150.0586 (C5H11NO2S) and ion m/z 74.0243 (C3H8O2) [M+H-NH3-C2S]+ was observed in MS/MS spectra, which could be identified as L-methionine [16]. Peak 15 had a molecular weight of 117.0192 (C4H6O4), which produced the MS/MS ions as 99.9254 (C3H6O2) [M-H-CO2] and 73.0291 (C3H4O) [M-H-CO2-H2O]. Hence, it can be identified as succinic acid [25]. Peak 33 had the same fragment (73.0273 [M-H-C3H5O2]) with peak 15. The other fragment was 55.0191 [M-H-C3H5O2-H2O], which can be identified as dimethyl succinate [25]. Peaks 18, 21, 23, 24, 25, 29, 31, 32, 33, 39, 42, 43, 49, 50, 52, 55, 56, 60 and 61 were in the similar regular pattern with peak 15, the parent ion was removed one or more CO2 and H2O. Peaks 18 (125.0244 [M-H-CO2], 107.0156 [M-H-CO2-H2O] and 79.0189 [M-H-CO2-H2O-CO]), 21 (109.0298 [M-H-CO2] and 91.0298 [M-H-CO2-H2O]), 23 (135.0560 [M-H-CO2] and 89.0194 [M-H-CO2-CH3CO]), 24 (135.0454 [M-H-CO2] and 117.0351 [M-H-CO2-H2O]), 25 (109.0298 [M-H-CO2] and 91.0298 [M-H-CO2-H2O]), 29 (93.0340 [M-H-CO2]), 31 (163.0400 [M-H-2CO2] and 119.0503 [M-H-3CO2]), 32 (119.0498 [M-H-CO2] and 93.0347 [M-H-CO2-H2O]), 33 (163.0400 [M-H-2CO2] and 119.0498 [M-H-3CO2]), 39 (108.0212 [M-H-CO2-CH3]), 42 (193.0490 [M-H-2CO2-C2H5O] and 117.0341 [M-H-3CO2-C2H5O-CH3-H2O]), 43 (135.0449 [M-H-CO2]), 49 (119.0527 [M-H-CO2] and 103.0565 [M-H-CO2-H2O]), 50 (93.0470 [M-H-CO2] and 65.0473 [M-H-CO2-CO]), 52 (123.0436 [M-H-CO2] and 108.0212 [M-H-CO2-H2O]), 55 (119.0503 [M-H-CO2] and 93.0347 [M-H-CO2-H2O]), 56 (123.0450 [M-H-CO2]), 60 (257.0110 [M-H-CO2] and 229.0126 [M-H-CO2-CO]) and 61 (109.0286 [M-H-CO2-C2H2]) were the same regular, which were identified as gallic acid [20], protocatechuic acid [23], acetylsalicylic acid [26], caftaric acid [20], gentisic acid [23], 4-hydroxybenzoic acid [27], p-coutaric acid [28], m-coumaric acid [28], coutaric acid [28], vanillic acid [27], fertaric acid [28], caffeic acid [28], desaminotyrosine [29], 2-hydroxybenzoic acid [28], 3-hydroxy-4-methoxybenzoic acid [30,31], p-coumaric acid [28], homogentisic acid [23], ellagic acid [32] and dihydrocaffeic acid [33]. Peak 79 had the major first-order mass spectrum at m/z 270.0662 (C11H12O4). The MS/MS fragments were the same as peak 43 of 179.0433 [M-H-CH3] and 135.0446 [M-H-CH3-CO2]. Therefore, it was identified as ethyl caffeate [28]. Peak 16 showed the mass spectrum ion at m/z 165.0547 (C9H8O3) and the product ion was 119.0479 [M+H-HCOOH]+, which could be identified as trans-4-hydroxycinnamic acid [20]. Peak 17 gave a mass spectrum ion at 138.0548 (C8H11NO) with the MS/MS fragments at 121.0616 [M+H-NH3]+ and 95.0561 [M+H-NH3-C2H4]+, which was detected to be tyramine [34,35]. Peak 19 showed the mass spectrum ion at 141.0182 with the MS/MS fragments at 95.0127 [M+H-HCOOH]+, which could be identified as coumalic acid. Peak 20 gave [M−H] ion at m/z 153.0558. In MS/MS mode, the produced ions were m/z 123.0085 [C8H10O3-CH2O] and 108.0221 [C8H10O3-CH2OH-CH3], which can be identified as hydroxytyrosol [36]. Peaks 22 and 37 were a type of isomer which yielded the same ion at 305.0246 [M−H] in the first-order mass spectrum. They had the same prominent ion at 125.0246 [C15H14O7-C9H8O4]. They were speculated to be (−)-epigallocatechin [25] and (+)-gallocatechin [25] based on their retention times. Peak 26 had the [M−H] ion at m/z 137.0255. The product ion was 108.0213 [M-H-CHO]. Therefore, peak 26 was identified as protocatechualdehyde. Peak 27 had the mass spectrum ion at 181.0506 (C9H10O4) with MS/MS fragment of 135.0453 [M-H-CH3-H2O], which was identified as homovanillic acid [34,37]. Peak 28 showed mass spectrum ion at 183.0299 (C8H8O5). The product fragment ions were 124.0234 [M-H-CO2-CH3] and 95.0136 [M-H-CO2-CH3-CHO]. Hence, it was identified as methyl gallate [38,39]. Peak 30 gave [M−H] ion at m/z 353.0877 and MS/MS produced ions were at m/z 191.0616 [M-H-C6H5O5] and 135.0439 [M-H-C6H5O5-CO], it can be identified as chlorogenic acid [27,40]. Peak 35 was identified as benzoic acid by the MS spectra ion 121.0296 and MS/MS spectra ions m/z 92.0265 [M-H-CHO] and 108.0212 [M-H-CH]. Peaks 36, 38, 46 and 57 had same molecular weight of C30H26O12, which illustrated that they were isomers. Base on the MS/MS spectra, peak 36 (407.0775 [M-H-C8H8O3-H2O], 289.0714 [M-H-C15H13O6]), 38 (407.0768 [M-H-C8H8O3-H2O], 289.0709 [M-H-C15H13O6]), 46 (425.0893 [M-H-C8H8O3], 407.0782 [M-H-C8H8O3-H2O], 289.0721 [M-H-C15H13O6]) and 57 (425.0886 [M-H-C8H8O3], 407.0789 [M-H-C8H8O3-H2O], 289.0734 [M-H-C15H13O6]) were detected, which could be identified as procyanidin B1 [41], procyanidin B3 [41], procyanidin B2 [41] and procyanidin B7 [41] by comparing the retention time of the reference standards and literatures. Peak 41 had a molecular weight of 289.0713 (C15H14O6) with fragments of 245.0843 [M-H-CO2], 203.0713 [M-H-H2O-C3O2] and 151.0401 [M-H-C8H10O2], therefore it was identified as catechin [23]. Based on the same fragment, peaks 44 (289.0735 [M-H-C7H2O4], 151.0386 [M-H-C7H4O4-C8H10O2]), 51 (203.0710 [M-H-H2O-C3O2], 187.0396 [M-H-C4H6O3] and 151.0401 [M-H-C8H10O2]), 58 (316.0225 [M-H-C6H11O5], 271.0249 [M-H-C6H11O5-CO-H2O] and 151.0034 [M-H-C14H16O9]), 64 (285.0413 [M-H-C6H11O5] and 151.0041 [M-H-C14H8O7]), 66 (301.0352 [M-H-C6H10O5], 255.0296 [M-H- C6H10O5-C2H2O] and 151.0034 [M-H-C14H11O9]), 67 (330.0381 [M-H-C6H11O5], 315.0155 [M-H-C6H11O5-CH3], 271.0249 [M-H-C6H11O5-CH3-CO-H2O] and 151.0034 [M-H-C15H18O9]), 68 (151.0020 [M-H-C14H16O7]), 69 (285.0413 [M-H-C6H11O5] and 151.0041 [M-H-C14H8O7]), 70 (301.0379 [M-H-C6H10O5] and 151.0039 [M-H-C6H10O5-C7H6O2-CO]), 72 (301.0372 [M-H-C6H10O5], 255.0293 [M-H-C6H10O5-C2H2O] and 151.0016 [M-H-C14H11O9]), 73 (245.0504 [M-H-H2O-2CO] and 151.0035 [M-H-C8H6O4]), 75 (315.0530 [M-H-C6H10O5], 271.0255 [M-H-C8H14O6] and 151.0034 [M-H-C15H18O8]), 83 (151.0034 [M-H-C8H6O3]), 85 (316.0231 [M-H-CH3] and 151.0016 [M-H-C9H8O4]), 86 (151.0034 [M-H-C8H8O]), 88 (151.0034 [M-H-C8H6O2]) and 91 (300.0270 [M-H-CH3] and 151.0016 [M-H-C9H8O3]) were identified as the type of ion of 151.0037 (C7H4O4), which were the characteristic fragment of flavonoid components. Indeed, they were epicatechin gallate [23], epicatechin [23], myricetin-3-O-galactoside [23], quercitrin [28], quercetin-3-O-glucuronide [28], laricitrin-3-O-glucoside [37], luteolin-3’-glucoside [23], astilbin [38], isoquercitrin [22], astragalin [38], myricetin [21], isorhamnetin-3-O-glucoside [28], quercetin [22], laricitrin [37], naringenin [23], kaempferol [22] and isorhamnetin [28]. Peak 45 had the mass spectrum ion at 197.0454 (C9H10O5) with MS/MS ions at 182.0256 [M-H-CH3], 167.0014 [M-H-CH3-CO2], 138.0317 [M-H-CH3-CO2-CH3] and 123.0090 [M-H-CH3-2CO2-CH3], which can be identified as syringic acid [27]. Peak 47 produced [M−H] at m/z 325.0926 with the molecular formula C15H18O8. A loss of C6H10O5 in MS/MS was confirmed to be a hexose neutral loss. The other ions were 145.0294 [M-H-C6H10O5-H2O] and 117.0343 [M-H-C6H10O5-CO]. Peak 47 was tentatively identified as p-coumaric acid glucoside [28]. Peak 48 had the major ions at m/z 189.0769 (C8H14O5) and the MS/MS fragment was 71.0503 [M-H-C2H5-CO2-C2H5O]. Therefore, it was identified as diethyl malate [24]. Peak 53 was identified as ethyl gallate by its characteristic fragmentation pattern, which MS/MS spectra ions m/z 169.0142 [C9H10O5-C2H4] and 125.0239 [C9H10O5-C2H4-CO2] were observed [28]. Peak 54 had the MS ion of 493.1341 and the MS/MS spectra ions of m/z 331.0822 [M-H-C6H10O5] and 316.0553 [M-H-C6H10O5-CH3]. Hence, peak 54 was tentatively identified as malvidin-3-O-glucoside [41]. By the similar regular pattern, peaks 62 (303.0510 [M-H-C6H10O5] and 316.0553 [M-H-C6H10O5-2H2O-CO]), 65 (303.0510 [M-H-2C6H10O5]), 74 (317.0648 [M-H-C6H10O5] and 302.0429 [M-H-C6H10O5-CH3]), 78 (303.0767 [M-H-C6H10O5-CO2]) and 80 (477.1196 [M-H-C9H10O3] and 331.0874 [M-H-C9H10O3-C6H10O5]) were displayed in MS/MS spectra, which could be identified as delphinidin-3-O-glucoside [42,43], delphinidin-3,5-O-diglucoside [44], petunidin-3-O-glucoside [41], delphindin-3-O-(6-O-acetylglucoside) [44] and malvidin-3-O-(6-O-coumaroylglucoside) [44]. Peak 59 gave the [M−H] ion at the m/z 389.1242 with MS/MS spectra ions m/z 227.0994 [M-H-C6H10O5] and 143.0505 [M-H-C6H10O5-C2H2O-C2H2O]. Peak 59 was tentatively identified as trans-piceid [23]. By the similar regular pattern, peaks 72 (227.0994 [M-H-C6H10O5] and 185.0606 [M-H-C6H10O5-C2H2O]), 76 (185.0587 [M-H-C6H10O5-C2H2O] and 143.0501 [M-H-C6H10O5-C2H2O-C2H2O]) and 84 (143.0504 [M-H-C6H10O5-C2H2O-C2H2O]) were displayed in MS/MS spectra, which can be identified as cis-piceid [23], trans-resveratrol [23] and resveratrol [23] with their different retention times. Peak 63 showed the mass spectrum ion at 463.0884 (C21H20O12). The product fragment ions were 301.0379 [M-H-C6H10O5], 300.0277 [M-H-C6H11O5], 271.0245 [M-H-C6H10O5-CHO], 243.0291[M-H-C6H10O5-CHO2] and 151.0031 [M-H-C6H10O5-C7H6O2-CO]. Therefore, it was identified as hyperoside [23]. Peak 77 gave a mass spectrum ion at 435.1300 (C21H24O10) with MS/MS fragments of 273.0769 [M-H-C6H12O6], 179.0349 [M-H-C15H14O5] and 167.0352 [M-H-C6H12O6-C7H6O], which was detected to be phloridzin [45]. Peak 81 had a molecular weight of 303.0497 (C15H10O7) with fragments of 285.0398 [M+H-H2O]+, 257.0456 [M+H-H2O-CO]+, 229.0492 [M+H-H2O-2CO]+ and 153.0188 [M+H-C8H5O3]+, therefore it was identified as morin [46]. Peak 82 had the mass spectrum ion at 303.0497 and MS/MS experiment gave fragmentations information at 229.0492 [M-H-CO-2H2O] and 153.0188 [M-H-C8H6O3],which can be identified as delphinidin [28]. By the similar regular pattern, peaks 87 (213.0559 [M-H-2H2O-CO] and 137.0233 [M-H-C8H6O3]) and 90 (229.0498 [M-H-2H2O-CO-CH3] and 153.0188 [M-H-CH3-C8H6O3]) were showed in MS/MS spectra, which can be identified as cyanidin [28] and petunidin [28]. Peak 89 was identified as syringetin with MS/MS spectra ions m/z 330.0385 [M-H-CH3] and 315.0153 [M-H-C2H6] [47]. Peak 92, the molecular weight was 193.1588 (C13H20O) and the fragment ion was observed at m/z 56.9419 [M+H-C10H15]+, which was identified as ionone [48]. Peak 93 had a molecular weight of 173.1536 (C10H20O2) with fragment of 76.0221 [M+H-HCOOH]+, therefore it was identified as ethyl caprylate (C10H20O2). The molecular weight of peak 94 was 195.1748. MS/MS ions of m/z 177.1634 [M+H-H2O]+ and 163.0394 [M+H-H2O-CH2]+ were observed, which revealed that it was theaspirane. Moreover, the MS spectrums of all compounds were shown in Supplementary Materials (Figures S1–S94).

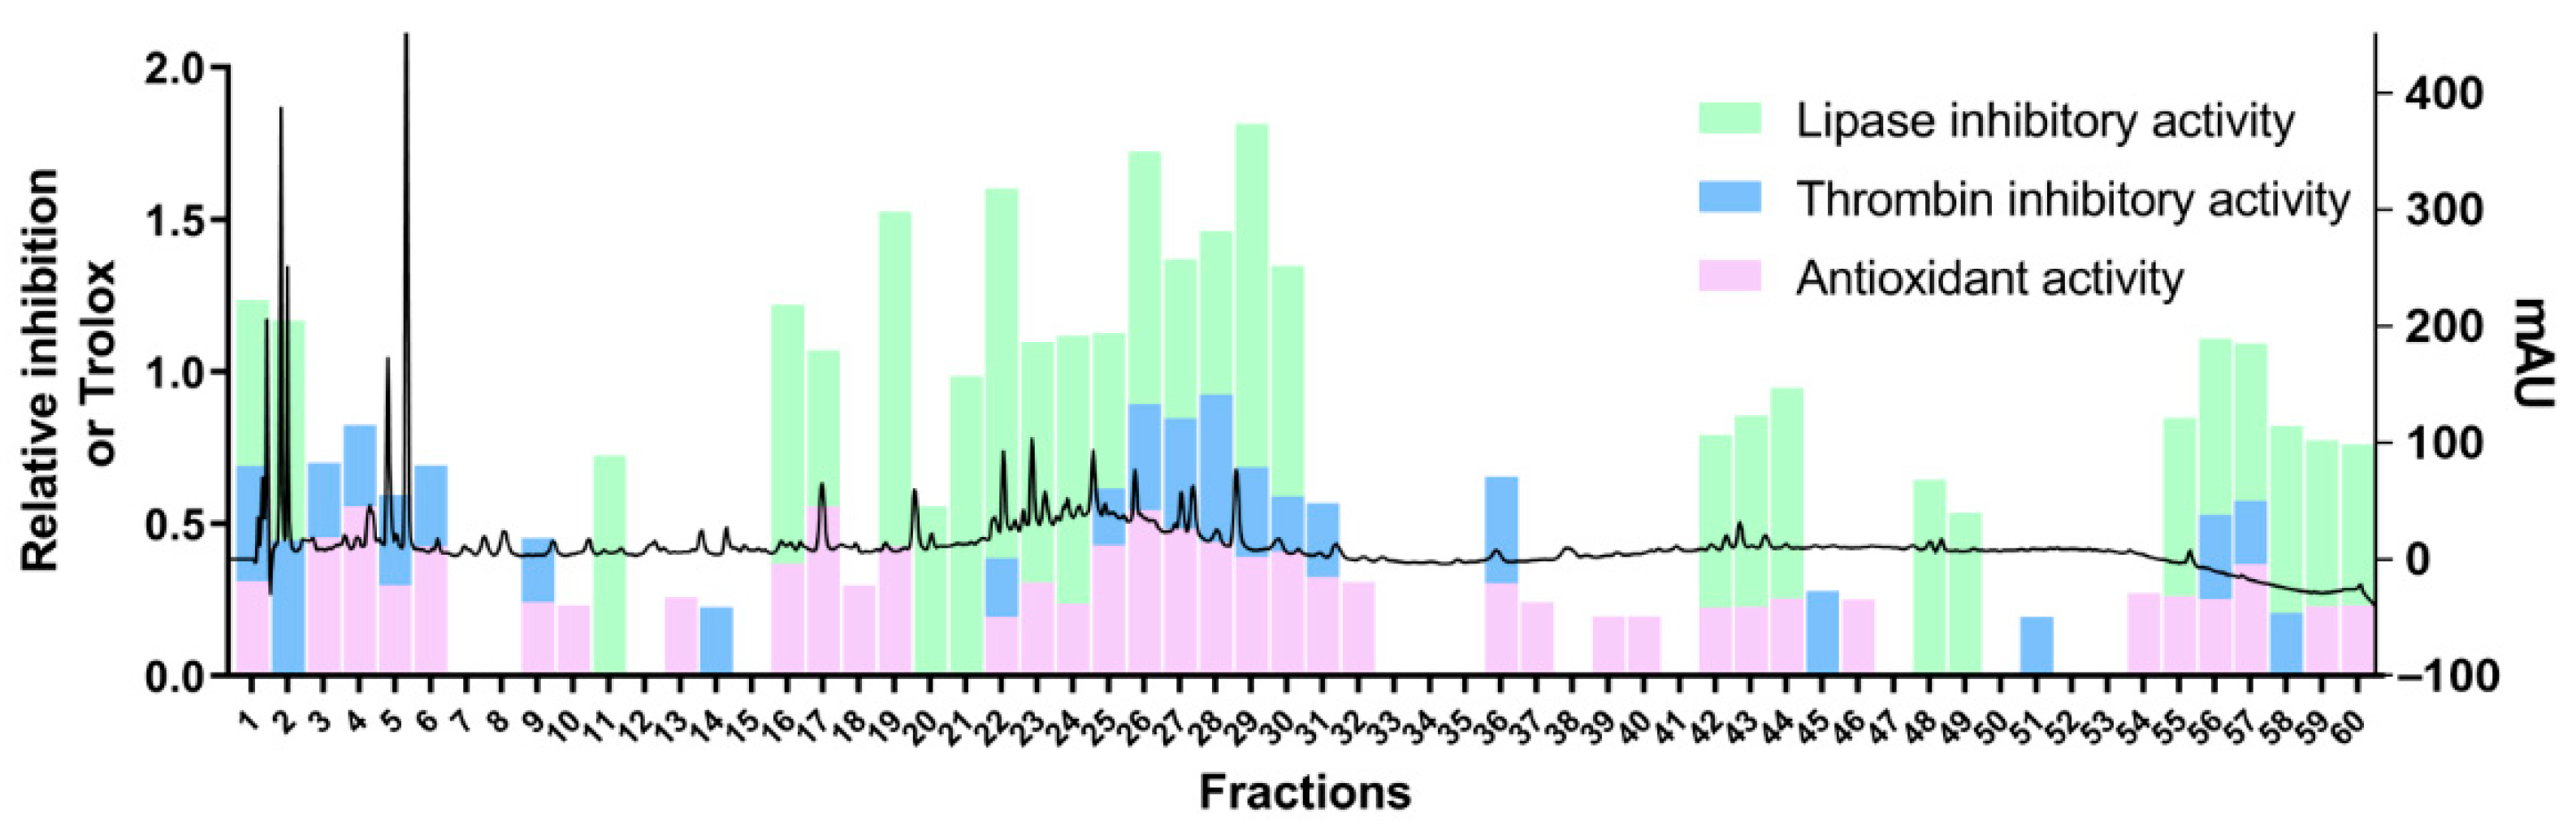
2.3. Active Ingredients of Red Wine
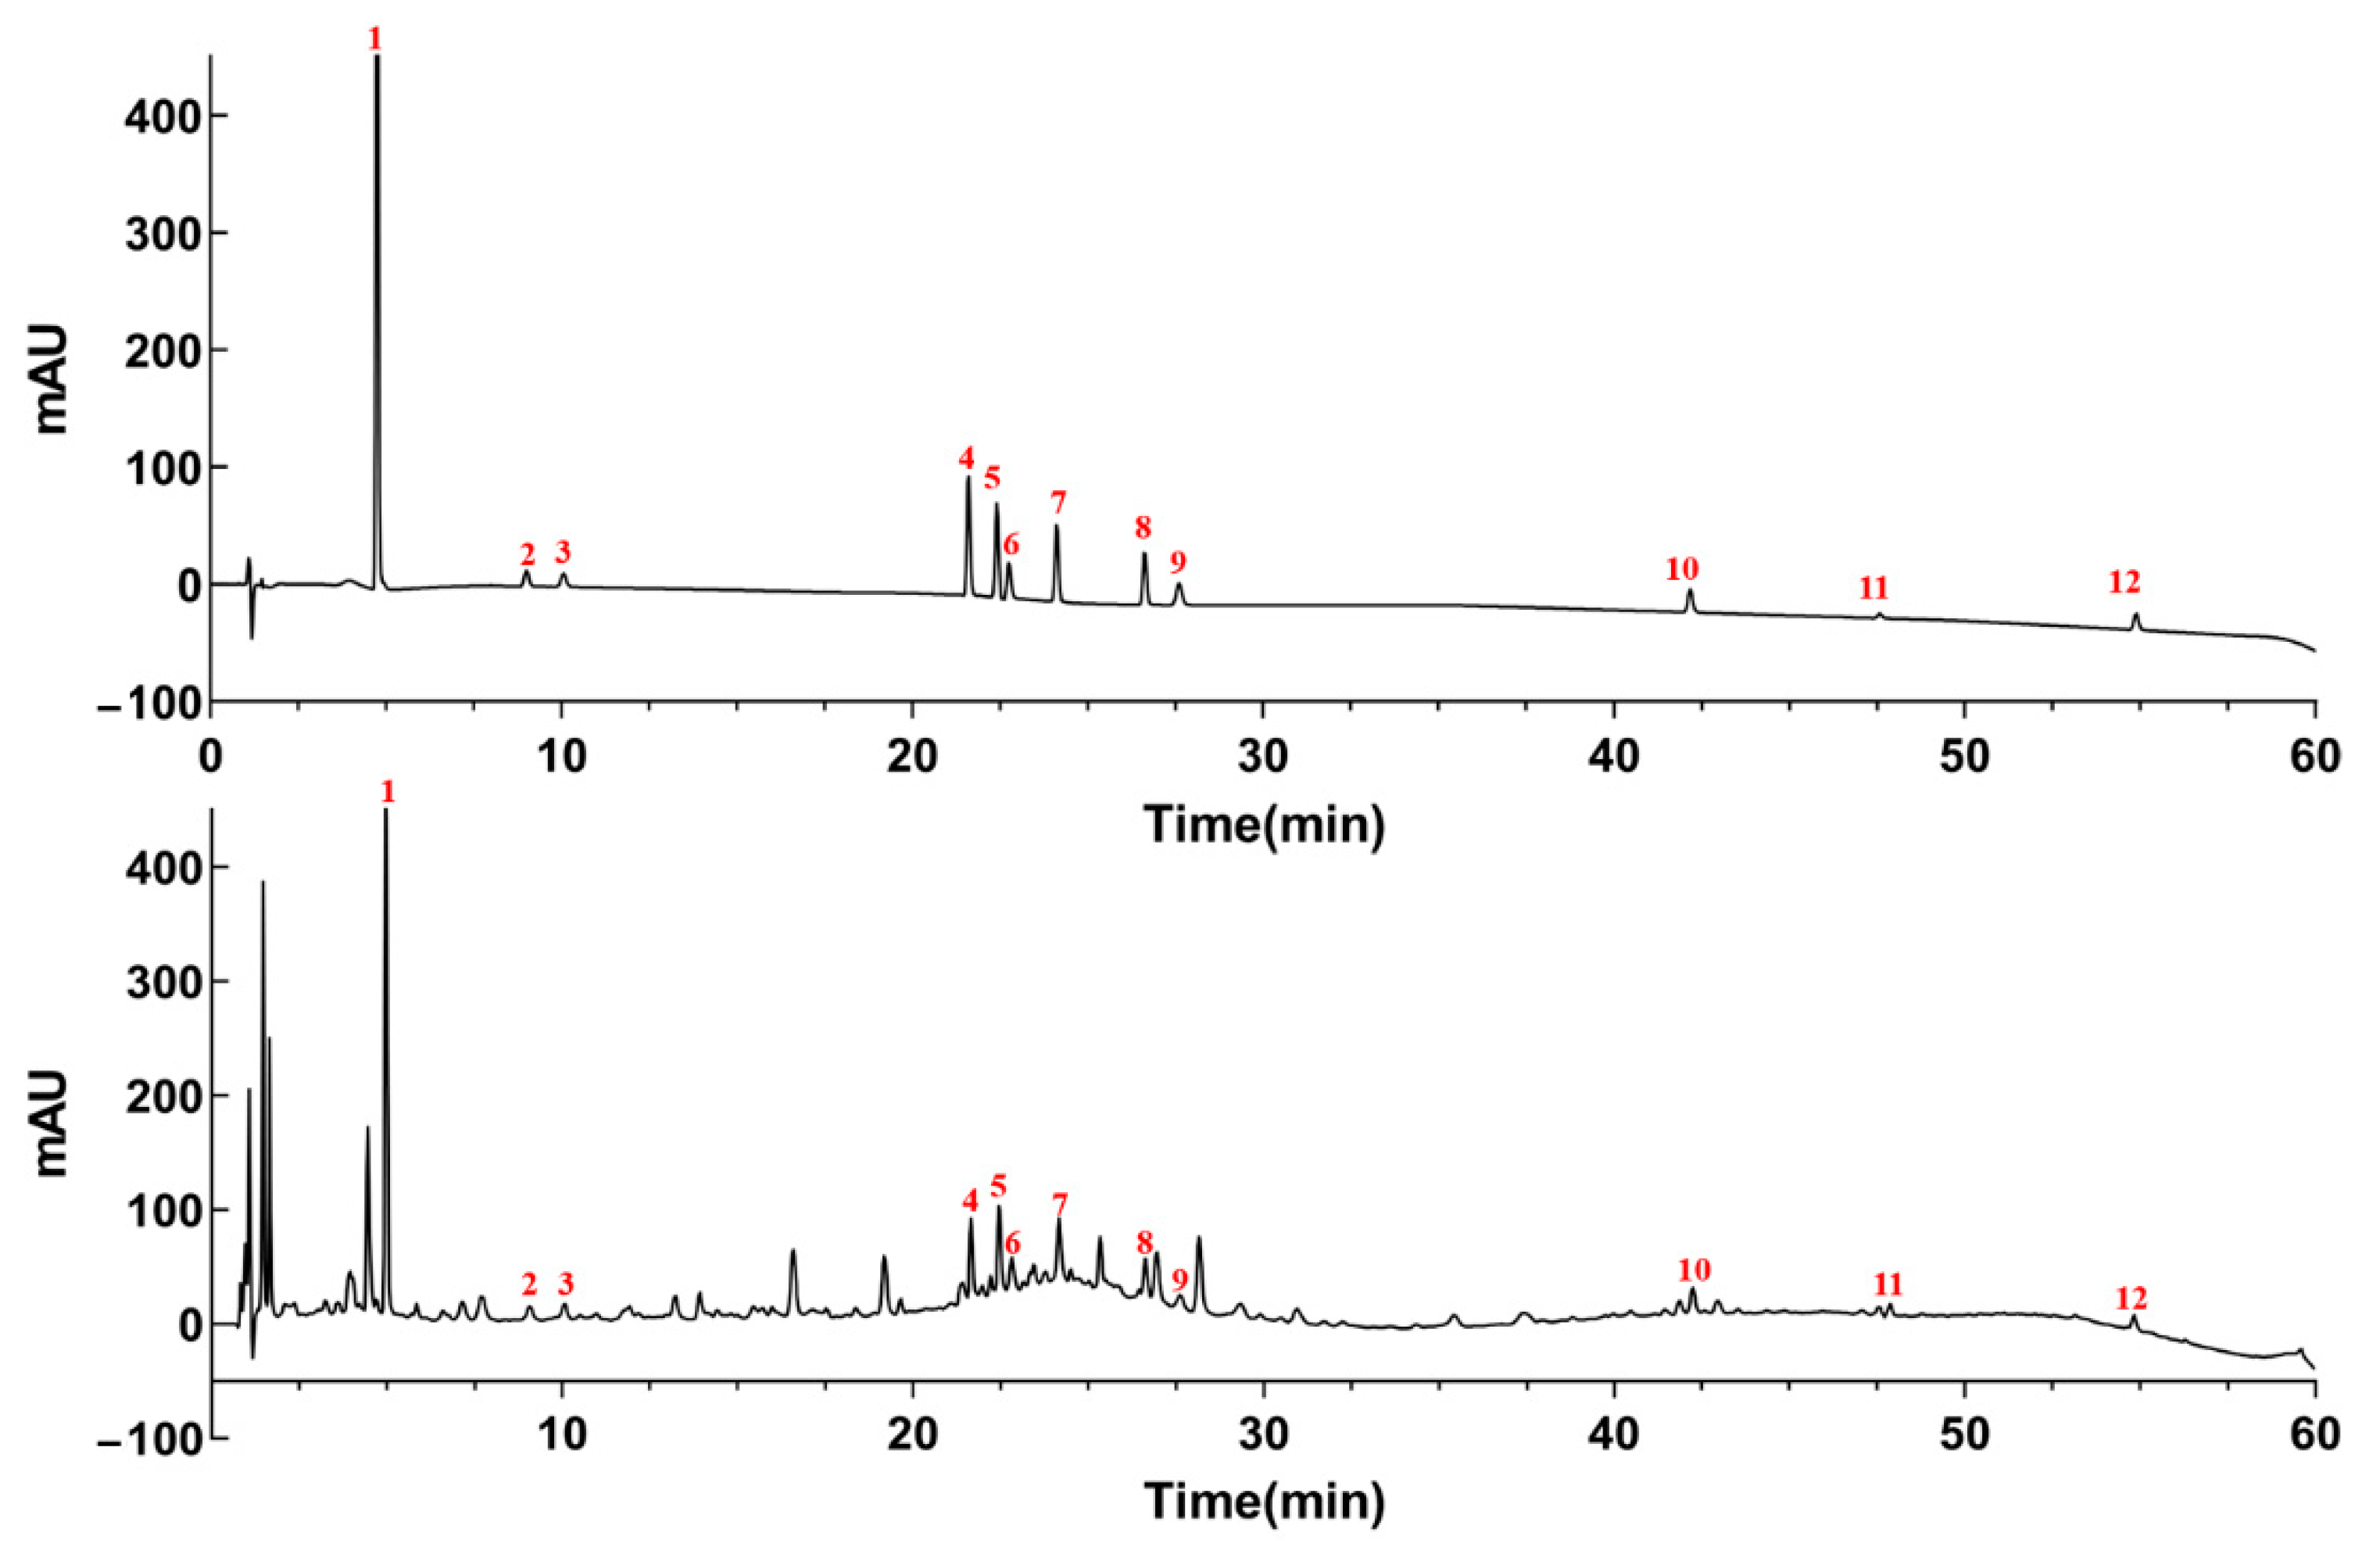
The analytical data of active fractions with antioxidant activity, inhibitory activity of thrombin or lipase and 94 compounds of mass spectrometry were correlated according to retention times and peaks order. In all, 77 compounds were screened for the prevention and treatment of CHD. The corresponding relationship between fraction number and peak number of the potential active components was shown in Table 3. These active components were concentrated in phenolic acids and flavonoids. Phenolic acids were retained during 20–30 min, which had higher antioxidant and inhibitory activity against thrombin and lipase. Flavonoids were retained during 42–60 min, which had stronger antioxidant and inhibitory activity against lipase. Besides, five ensemble approaches were considered to screen the quantitative composition. The ingredients had multi-activity at the same time; the compounds had a strong single activity; the reference substance was easy to obtain; the activity of this ingredient has been reported many times in literature; the compound was abundant, respectively. The five ensemble approaches were applicated for selecting active ingredients to the quality evaluation of red wine. 63 compounds had multiple activities; 13 compounds had a strong single activity, which were protocatechuic acid, (+)-catechin gallate, (+)-epigallocatechin, acetylsalicylic acid, caftaric acid, chlorogenic acid, benzoic acid, procyanidin B7, trans-piceid, astragalin, cis-piceid, ethyl caffeate and malvidin-3-O-(6-O-coumaroylglucoside). According to the reference substance was easy to obtain and the activity of this ingredient has been reported many times in literature, a total of 19 compounds were screened, which were succinic acid, gallic acid, coumalic acid, procyanidin B1, (−)-epigallocatechin, vanillic acid, catechin, caffeic acid, syringic acid, epicatechin, p-coumaric acid, quercetin-3-O-glucuronide, isoquercitrin, isorhamnetin-3-O-glucoside, trans-resveratrol, quercetin, protocatechuic acid, (+)-catechin gallate and (+)-epigallocatechin. Finally, based on the content of the compound from red wine, 12 compounds were screened for further determination, which were gallic acid, coumalic acid, proanthocyanidin B1, catechin, caffeic acid, isoquercitrin, protocatechin, syringic acid, epicatechin, p-coumaric acid, isorhamnetin-3-O-glucoside and quercetin.

2.4. UHPLC Analysis

The UHPLC conditions were considered to obtain better chromatographic separation. The different concentrations of acid (0.03%, 0.05% and 0.1% trifluoroacetic acid, 0.05% formic acid, 0.05% acetic acid and pure water), column temperatures (25, 30 and 35 °C) and detection wavelength (210, 220, 254 and 280 nm) were optimized. By comparing resolutions and the peak shapes, the better separation was achieved when 0.1% trifluoroacetic acid was selected as mobile phase, the column temperature and flow rate were optimal at 30 °C and 0.3 mL min−1, respectively. The UHPLC chromatogram was shown in Figure 4.

2.5. Method Validation

The precision, linearity, stability, accuracy, LODs and LOQs were validated. The RSD values of intra-day and inter-day precision were all less than 2.2% and 4.8%, respectively. Overall, 12 components were stable within 24 h at room temperature, and RSDs were less than 2.9%. The calibration curves of the 12 compounds were of high correlation coefficient (r > 0.999) under the concentration ranges. The LODs were ranged from 0.04 to 0.75 μg/mL and LOQs were ranged from 0.12 to 2.0 μg/mL for the 12 compounds, respectively. The results were shown in (Table 4). As can be seen from Table 5, the recoveries of the 12 compounds were in the range of 83.4–106% and RSDs values were not more than 4.3%. All these values were found in an acceptable range, indicating that the method was accurate, reproducible and reliable for quantification of bioactive compounds from red wine.

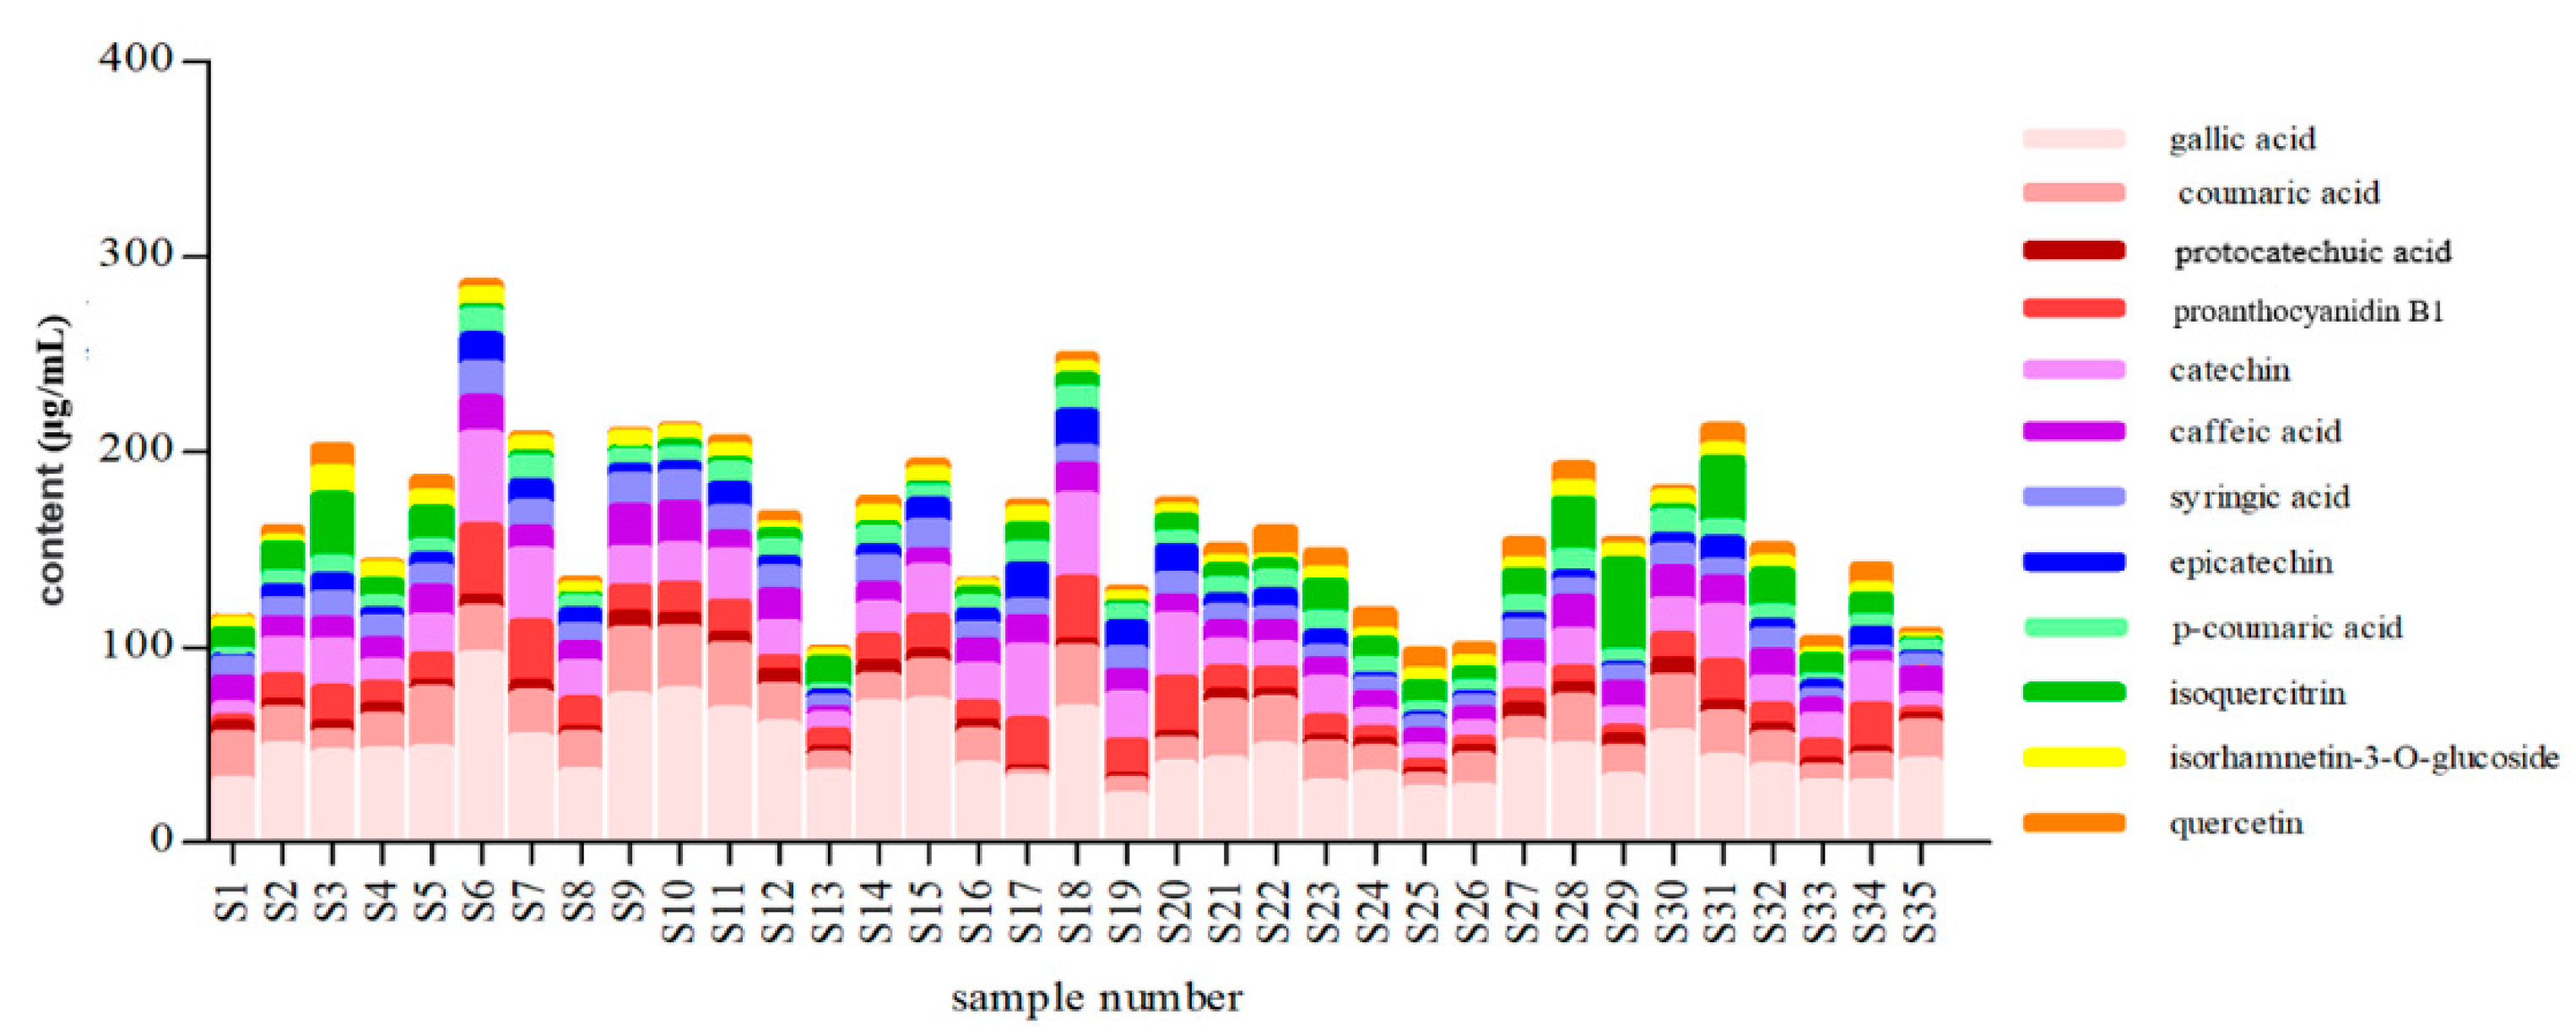
2.6. Contents of the Bioactive Components from Red Wine

UHPLC was applied to analyze the bioactive components in triplicates from red wine. The results showed that among the bioactive compounds, gallic acid was in the highest amounts of 46.94 μg/mL. The contents of coumalic acid (18.93 μg/mL), proanthocyanidin B1 (14.19 μg/mL), catechin (19.37 μg/mL), caffeic acid (12.05 μg/mL) and isoquercitrin (10.21 μg/mL) were in the range of 10.21–19.37 μg/mL. Protocatechin (4.768 μg/mL), syringic acid (9.87 μg/mL), epicatechin (7.148 μg/mL), p-coumaric acid (8.18 μg/mL), isorhamnetin-3-O-glucoside (6.460 μg/mL) and quercetin (5.353 μg/mL) were in low contents. Contents of 35 batches red wine were shown in (Figure 5). These components may be considered to be the main bioactive compounds from red wine and had the antioxidant activity, inhibitory activities of and lipase.

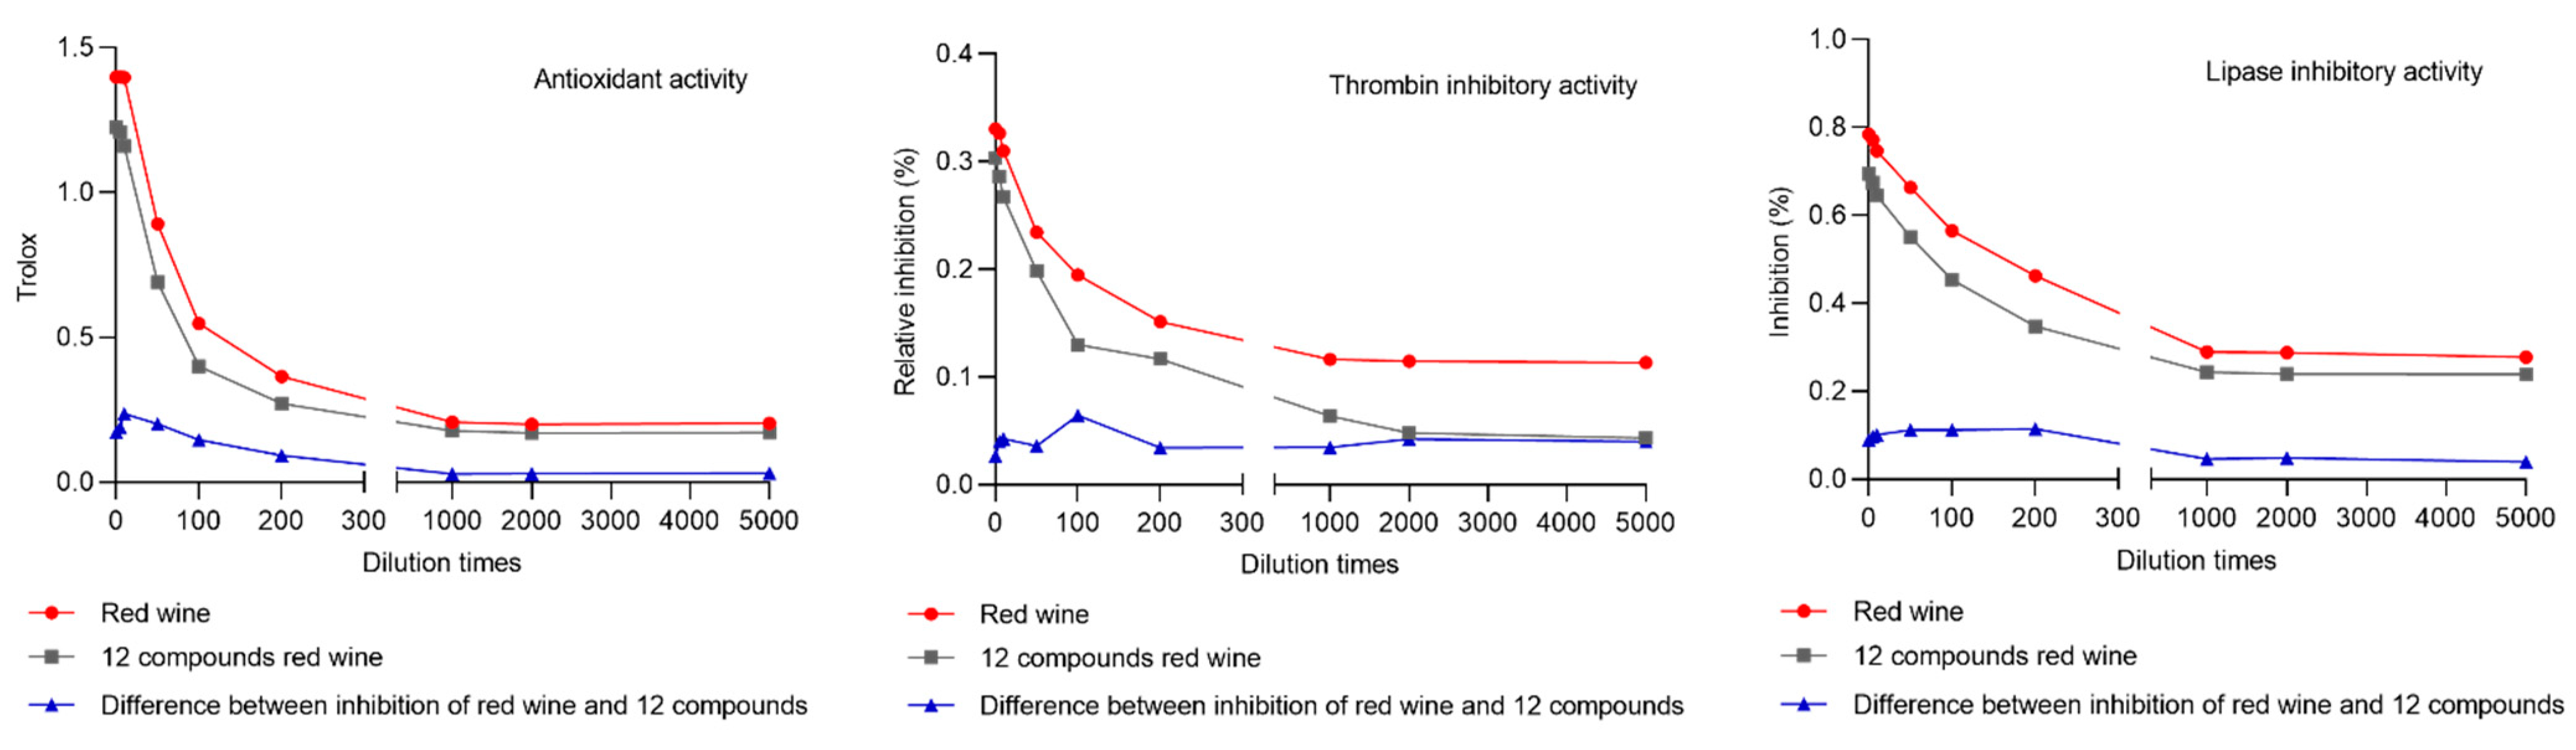
2.7. Confirmation the Activity of the 12 Compounds

In order to verify that the compounds in the obtained fractions, 12 active compounds mixture were contrasted for red wine in terms of antioxidant activity, thrombin inhibitory activity and lipase inhibitory activity. The results indicated that inhibition of selected 12 compounds had reached almost 90% of red wine. The inhibition ratios of 12 compounds mixture and red wine were displayed in Figure 6. Moreover, the difference between inhibition of red wine and 12 compounds mixture were also shown in Figure 6. Comparing the inhibition ratio of red wine and 12 compounds which concentrations were the same as red wine, it was shown that the inhibition ratios of 12 compounds were similar to red wine, which was verified that the screening 12 compounds could reflect the total activity of red wine in terms of antioxidant activity, thrombin inhibitory activity and lipase inhibitory activity. Accordingly, the blindness of selecting quantitative component was avoided, which could further provide reference for screening and quantification the active ingredients from nutraceutical and traditional Chinese medicine.

2.8. The Application of Multi-Activity Integrated Strategy

Red wine contained many ingredients, which had different activities such as antioxidant, anticoagulant and lipid-lowering. CHD was the results of the interaction of many complex factors. Hence, the multi-activity of red wine was corresponding to the multiple pathogenesis of CHD. Indeed, the multi-activity integrated strategy of red wine was successfully established to quality evaluation of red wine based on the screened 12 bioactive compounds to prevent CHD. Additionally, the multi-activity integrated strategy may help to discover bioactive components rapidly and efficiently, which provided reference for exploring active ingredients in food.

3. Materials and Methods

3.1. Reagents and Chemical

HPLC-grade Acetonitrile (ACN) and methanol (MeOH) were purchased from Merck (Darmstadt, Germany). Trifluoroacetic acid (TFA) was obtained from Guangzhou Chemical Reagent Factory (Guangzhou, China). Reference Standards including gallic acid (98.1%), catechin (99.2%), caffeic acid (99.7%), epicatechin (99.7%), isoquercitrin (98.0%) and quercetin (98.0%) were provided from National Institutes for Food and Drug Control (Beijing, China). Coumalic acid (98.0%), proanthocyanidin B1 (98.0%) and syringic acid (98.0%) were purchased from Chengdu Chroma-Biotechnology Co., Ltd. (Sichuan, China). P-coumaric acid (98.0%) and isorhamnetin-3-O-glucoside (98.0%) were offered by Shanghai Tauto Biotech Co., Ltd. (Shanghai, China). The water used in this study was purified by a Milli-Q water purification system (MA, USA). Total Antioxidant Capacity Assay Kit (ABTS) was supplied from Beyotime (Shanghai, China). Thrombin Inhibitor Screening Kit (Fluorometric) was obtained from Biovision (San Francisco, CA, USA). Lipase (TypeII, L3126) was purchased from Solarbio Science Co. Ltd. (Beijing, China) and 4-Methylumbelliferyl Oleate (4-MUO) was provided by Sigma-Aldrich (St. Louis, MO, USA). Red wine (2018 vintage, the central valley of Chile, alcoholic degree 13.0% (v/v)) was made of cabernet sauvignon, which was obtained from Ole’ Boutique Supermarket (Shenzhen, Guangdong, China).

3.2. Sample and Standard Solution Preparation

The red wine was analyzed immediately after the bottle opening. The sample (2 mL) was filtrated through a 0.22 μm polyvinylidene fluoride membrane. Appropriate amounts of gallic acid, catechin, caffeic acid, epicatechin, isoquercitrin, coumalic acid, proanthocyanidin B1, syringic acid, p-coumaric acid and isorhamnetin-3-O-glucoside were precisely weighed and dissolved with methanol to prepare standards solutions of 1 mg/mL. All the samples and standard solutions were stored at 4 °C in the dark for analysis.

3.3. Preparation of the Red Wine Fractions

Fraction collector (BSZ-100, Shanghai Jiapeng Technology Instrument, Shanghai, China) was used to prepare fractions. The red wine sample was injected into the UHPLC system for separation. Then fractions were collected every 60 s by setting the fraction collector and evaporated to dryness by nitrogen gas. The residues were dissolved by methyl alcohol:water (1:1).

3.4. UHPLC Analysis

The UHPLC analysis was performed using an Dionex ultra high performance liquid chromatograph (Dionex UltiMate 3000, Thermo, MA, USA) equipped with a Dionex UltiMate 3000 pump, a Dionex UltiMate 3000 autosampler and a Dionex UltiMate 3000 diode array detector. The chromatographic separation was achieved on an ACQUITY UPLC column (HSS T3, 1.8 μm, 2.1 mm× 100 mm, Waters, Ireland) [49] at 30 °C. The mobile phase was composed of water containing 0.1% TFA (A) [50] and methanol (B) at a flow rate of 0.3 mL/min. The elution program was conducted as follows: 0–15 min at 0–6% B; 15–20 min at 6–11% B; 20–30 min at 11–11% B; 30–45 min at 11–20% B; 45–55 min at 20–30% B; 55–60 min at 30–90% B. The injection volume was 2 μL. DAD wavelength was set as 220 nm. Method validation was accorded to the Chinese Pharmacopeia guidelines, which were included linearity, limits of detection (LOD), limits of quantification (LOQ), repeatability, precision, stability and recovery.

3.5. UFLC/Q-TOF-MS Analysis

The identification was performed on a hybrid quadrupole time-of-flight tandem mass spectrometry (Exion-LCTM/X500R QTOF, AB SCIEX, Foster City, CA) equipped with an electrospray ionization (ESI) interface. The mass spectrometer was operated both in positive and negative ion mode. The parameters were set as following: the ion spray voltage of 5500/−4500 V; turbo spray temperature (TEM) of 550 °C; declustering potential (DP) of ±70 V; collision energy (CE) of ±40 V; nebulizer gas (gas 1) of 50 psi; heater gas (gas 2) of 50 psi and curtain gas of 30 psi [20,43]. Nitrogen was kept as the nebulizer and auxiliary gas. TOF/MS and TOF/MS-MS were scanned with the mass range of m/z 100–1200 and 50–1200, respectively. The experiments were run with 200 ms accumulation time for TOF/MS and 80 ms accumulation time for TOF/MS-MS. Continuous recalibration was carrying out at each 3 h. In addition, dynamic background subtraction (DBS) trigger information-dependent acquisition (IDA) was used to trigger acquisition of MS/MS of low-level constituents. The accurate mass and composition for the precursor ions and fragment ions were analyzed using the SCIEX OS software integrated with the instrument.

3.6. Antioxidant Activity Assay

After collection fractions, the antioxidant activity was tested for the 60 fractions by Total Antioxidant Capacity Assay Kit (ABTS). ABTS was oxidized to ABTS cation radical (ABTS•+) with appropriate oxidizing agent. The red wine has inhibited the production of ABTS•+ that can be detected by the absorbance at 734 nm. Initially, 0.4 mL ABTS stock solution was mixed with 0.4 mL of the oxidizing agent solution for the preparation of the radical. This solution was maintained at room temperature for 12–16 h in an amber bottle. Subsequently, the mixture was diluted in PBS to obtain an absorbance of approximately 0.7 ± 0.05. Finally, 200 μM ABTS was mixed with different fraction. The absorbance change at 734 nm was measured after 5 min. The reaction solution with PBS instead of test sample was used as a control test. The total antioxidant activity was expressed as Trolox-equivalent Antioxidant Capacity (TEAC) equivalent [51,52].

3.7. Thrombin Inhibitory Activity Assay

The inhibitory activity against thrombin was assessed by Thrombin Inhibitor Screening Kit (Fluorometric). Thrombin inhibitor screening principle was utilized the ability of thrombin to cleave a synthetic AMC-based peptide substrate to release AMC, which can be detected by measuring fluorescence intensity at Ex/Em = 350/450 nm. In the presence of thrombin inhibitors, the extent of cleavage reaction was reduced or completely abolished. The loss in fluorescence intensity can be correlated to the amount of inhibitor present in the assay solution. At first, the thrombin enzyme solution was prepared as 48 μL thrombin assay buffer and 2 μL thrombin enzyme stock solution in each well. Then, fractions were dissolved by methyl alcohol:water (1:1) and diluted to 10 times with thrombin assay buffer. The 10 μL diluted fractions or thrombin inhibitor control were added into the thrombin enzyme containing wells. The thrombin inhibitor control was consisted of 1 μL thrombin inhibitor and 9 μL thrombin assay buffer to thrombin enzyme well. The sample was incubated at room temperature for 15 min. Finally, the thrombin substrate solution was added into each well, which was consisted of 35 μL thrombin assay buffer and 5 μL thrombin substrate. Fluorescence was measured in a kinetic mode for 30–60 min at 37 °C (Ex/Em = 350/450 nm). The time points (T1 = 5 min, T2 = 10 min) were chosen in the linear range of the plot and obtain the corresponding values for the fluorescence (RFU1, RFU2). Irreversible inhibitors that inhibit the thrombin activity completely at the tested concentration will have ΔRFU = 0 and will show 100% relative inhibition. The inhibition (%) was calculated by (slope of enzyme control − slope of fraction)/slope of enzyme control × 100% [53].

3.8. Lipase Inhibitory Activity Assay

In this study, the inhibition of each fraction was assayed by measuring the fluorescence intensity of 4-methylumbelliferyl oleate (4-MU) (the hydrolytic product of 4-MUO). The assay was performed according to the method described with slight modifications. Initially, the concentrations of trypsin (0.83–30,000 U/mL) and time were investigated to establish linear range with the concentration of 4-MUO at 0.1 mM. Then, 25 μL fractions and 25 μL lipase solutions were mixed together and 50 μL 4-MUO was added to the mixture. Finally, the amount of 4-MU was measured by microplate reader at an excitation wavelength of 355 nm and an emission wavelength of 460 nm after incubating at 25 °C for 30 min. The inhibition of pancreatic lipase activity was calculated as follows: inhibition (%) = [(Acontrol − Asample)/Acontrol − (Acontrol − Acontrol sample)/Acontrol] × 100%, where Asample was the fluorescence of the reactions with added fraction, Acontrol was the control, and Acontrol sample was the fluorescence of the solvent of the fraction [12,54].

3.9. Statistical Analyses

The results of precision and recovery have been measured in triplicates and the stability have been measured in sextuplicate, which were expressed as mean and RSD. The content of 12 compounds have been measured in triplicates and expressed as mean.

4. Conclusions

In this study, the multi-activity integrated strategy was proposed to screen, identify and quantify components from red wine for prevention of CHD via UHPLC-FC and UFLC-Q-TOF/MS. The multi-activity integrated strategy of red wine was established and verified the availability of screening the preventing CHD compounds from the complex sample. Red wine exhibited potential antioxidant activity and inhibitory activity against thrombin and lipase, which could be used to prevent CHD. In addition, the system had advantages over traditional methods in screening potential active compounds. The multi-activity integrated strategy may help to discover bioactive components rapidly and efficiently, which provided reference for exploring the health care function in food.

Supplementary Materials

The following are available online: Figures S1–S94: The MS spectrums of all compounds.

Author Contributions

Conceptualization, K.B.; data collection and methodology, Y.G., X.-a.Y., J.W., G.Y. and B.W.; data analysis, Y.G. and X.-a.Y.; writing—original draft preparation, Y.G. and X.-a.Y.; writing—review and editing, T.W. and K.B. All authors have read and agreed to the published version of the manuscript.

Funding

This research was funded by National Natural Science Foundation of China (No. 82104357).

Institutional Review Board Statement

Not applicable.

Informed Consent Statement

Not applicable.

Data Availability Statement

The MS spectrums of all compounds were shown in supplementary materials (Figures S1–S94).

Conflicts of Interest

The authors declare no conflict of interest.

Sample Availability

The informations of samples were shown in Supplementary Materials (Table S1).

References

  1. Rodrigo, R.; Miranda, A.; Vergara, L. Modulation of endogenous antioxidant system by wine polyphenols in human disease. Clin. Chim. Acta 2011, 412, 410–424. [Google Scholar] [CrossRef] [PubMed]
  2. Castaldo, L.; Narváez, A.; Izzo, L.; Graziani, G.; Gaspari, A.; Di Minno, G.; Ritieni, A. Red wine consumption and cardiovascular health. Molecules 2019, 24, 3626. [Google Scholar] [CrossRef] [Green Version]
  3. Renaud, S.D.; de Lorgeril, M. Wine, alcohol, platelets, and the French paradox for coronary heart disease. Lancet 1992, 339, 1523–1526. [Google Scholar] [CrossRef]
  4. Snopek, L.; Mlcek, J.; Sochorova, L.; Baron, M.; Hlavacova, I.; Jurikova, T.; Sochor, J. Contribution of red wine consumption to human health protection. Molecules 2018, 23, 1684. [Google Scholar] [CrossRef] [PubMed] [Green Version]
  5. World Health Statistics 2019: Monitoring Health for the SDGs, Sustainable Development Goals. Available online: https://apps.who.int/iris/handle/10665/324835 (accessed on 21 May 2019).
  6. Liu, P.; Zhou, B.; Gu, D.; Zhang, L.; Han, Z. Endothelial progenitor cell therapy in atherosclerosis: A double-edged sword. Ageing Res. Rev. 2009, 8, 83–93. [Google Scholar] [CrossRef] [PubMed]
  7. Ceriello, A.; Assaloni, R.; Da Ros, R.; Maier, A.; Piconi, L.; Quagliaro, L.; Esposito, K.; Giugliano, D. Effect of atorvastatin and irbesartan, alone and in combination, on postprandial endothelial dysfunction, oxidative stress, and inflammation in type 2 diabetic patients. Circulation 2005, 111, 2518–2524. [Google Scholar] [CrossRef]
  8. Pothineni, N.; Subramany, S.; Kuriakose, K.; Shirazi, L.F.; Romeo, F.; Shah, P.K.; Mehta, J.L. Infections, atherosclerosis, and coronary heart disease. Eur. Heart J. 2017, 38, 3195–3201. [Google Scholar] [CrossRef]
  9. Yan, Y.L.; Qiu, B.; Hu, L.J.; Jing, X.D.; Liu, Y.J.; Deng, S.B.; Du, J.L.; She, Q. Efficacy and safety evaluation of intensive statin therapy in older patients with coronary heart disease: A systematic review and meta-analysis. Eur. J. Clin. Pharmacol. 2013, 69, 2001–2009. [Google Scholar] [CrossRef]
  10. Divakaran, S.; Loscalzo, J. The role of nitroglycerin and other nitrogen oxides in cardiovascular therapeutics. J. Am. Coll. Cardiol. 2017, 70, 2393–2410. [Google Scholar] [CrossRef]
  11. Demartini, C.; Greco, R.; Zanaboni, A.M.; Sances, G.; De Icco, R.; Borsook, D.; Tassorelli, C. Nitroglycerin as a comparative experimental model of migraine pain: From animal to human and back. Prog. Neurobiol. 2019, 177, 15–32. [Google Scholar] [CrossRef]
  12. Chang, Y.X.; Ge, A.H.; Donnapee, S.; Li, J.; Bai, Y.; Liu, J.; Gao, X.M. The multi-targets integrated fingerprinting for screening anti-diabetic compounds from a Chinese medicine Jinqi Jiangtang Tablet. J. Ethnopharmacol. 2015, 164, 210–222. [Google Scholar] [CrossRef]
  13. Huang, X.; Kong, L.; Li, X.; Chen, X.; Guo, M.; Zou, H. Strategy for analysis and screening of bioactive compounds in traditional Chinese medicines. J. Chromatogr. B 2004, 812, 71–84. [Google Scholar] [CrossRef]
  14. Kang, H.J.; Yang, H.J.; Kim, M.J.; Han, E.S.; Kim, H.J.; Kwon, D.Y. Metabolomic analysis of meju during fermentation by ultra performance liquid chromatography-quadrupole-time of flight mass spectrometry (UPLC-Q-TOF MS). Food Chem. 2011, 127, 1056–1064. [Google Scholar] [CrossRef]
  15. He, Q.; Huang, S.; Wu, Y.; Zhang, W.; Wang, F.; Cao, J.; Ou, W.B. Comparative study on the composition of free amino acids and derivatives in the two botanical origins of an edible Chinese herb “Xiebai”, i.e., Allium chinense G. Don and Allium macrostemon Bunge species. Food Res. Int. 2018, 106, 446–457. [Google Scholar] [CrossRef]
  16. Konya, Y.; Taniguchi, M.; Fukusaki, E. Novel high-throughput and widely-targeted liquid chromatography–time of flight mass spectrometry method for d-amino acids in foods. J. Biosci. Bioeng. 2017, 123, 126–133. [Google Scholar] [CrossRef]
  17. Cellar, N.A.; McClure, S.C.; Salvati, L.M.; Reddy, T.M. A new sample preparation and separation combination for precise, accurate, rapid, and simultaneous determination of vitamins B1, B2, B3, B5, B6, B7, and B9 in infant formula and related nutritionals by LC-MS/MS. Anal. Chim. Acta. 2016, 934, 180–185. [Google Scholar] [CrossRef]
  18. Hu, H.; Xiao, L.; Zheng, B.; Wei, X.; Ellis, A.; Liu, Y.M. Identification of chemical markers in Cordyceps sinensis by HPLC-MS/MS. Anal. Bioanal Chem. 2015, 407, 8059–8066. [Google Scholar] [CrossRef] [PubMed] [Green Version]
  19. Li, Z.; Wang, Y.; Ouyang, H.; Lu, Y.; Qiu, Y.; Feng, Y.; Yang, S. A novel dereplication strategy for the identification of two new trace compounds in the extract of Gastrodia elata using UHPLC/Q-TOF-MS/MS. J. Chromatogr. B 2015, 988, 45–52. [Google Scholar] [CrossRef] [PubMed]
  20. Ramabulana, A.T.; Steenkamp, P.; Madala, N.; Dubery, I.A. Profiling of chlorogenic acids from bidens pilosa and differentiation of closely related positional isomers with the aid of UHPLC-QTOF-MS/MS-based in-source collision-induced dissociation. Metabolites 2020, 10, 178. [Google Scholar] [CrossRef]
  21. Fattahi, A.; Shakeri, A.; Tayarani-Najaran, Z.; Kharbach, M.; Segers, K.; Heyden, Y.V.; Asili, J. UPLC-PDA-ESI-QTOF-MS/MS and GC-MS analysis of Iranian Dracocephalum moldavica L. Food Sci. Nutr. 2021. [Google Scholar] [CrossRef] [PubMed]
  22. Dhananjeyan, M.R.; Bykowski, C.; Trendel, J.A.; Sarver, J.G.; Ando, H.; Erhardt, P.W. Simultaneous determination of procaine and para-aminobenzoic acid by LC-MS/MS method. J. Chromatogr. B 2007, 847, 224–230. [Google Scholar] [CrossRef] [PubMed]
  23. Kıvrak, İ. Analytical methods applied to assess chemical composition, nutritional value and in vitro bioactivities of Terfezia olbiensis and Terfezia claveryi from Turkey. Food Anal. Methods 2015, 8, 1279–1293. [Google Scholar] [CrossRef]
  24. Boğa, M.; Ertaş, A.; Yılmaz, M.A.; Kızıl, M.; Çeken, B.; Haşimi, N.; Deveci, Ö. UHPLC-ESI-MS/MS and GC-MS analyses on phenolic, fatty acid and essential oil of Verbascum pinetorum with antioxidant, anticholinesterase, antimicrobial and DNA damage protection effects. Iran. J. Pharm. Res. 2016, 15, 393–405. Available online: https://www.ncbi.nlm.nih.gov/pmc/articles/PMC5149026/ (accessed on 11 July 2021).
  25. Jeszka-Skowron, M.; Zgoła-Grześkowiak, A.; Frankowski, R. Cistus incanus a promising herbal tea rich in bioactive compounds: LC-MS/MS determination of catechins, flavonols, phenolic acids and alkaloids—A comparison with Camellia sinensis, Rooibos and Hoan Ngoc herbal tea. J. Food Compost Anal. 2018, 74, 71–81. [Google Scholar] [CrossRef]
  26. Gajula, R.; Pilli, N.R.; Ravi, V.B.; Maddela, R.; Inamadugu, J.K.; Polagani, S.R.; Busa, S. Simultaneous determination of atorvastatin and acetylsalicylic acid in human plasma by LC-MS/MS: Its pharmacokinetic application. Sci. Pharm. 2012, 80, 923–940. [Google Scholar] [CrossRef] [Green Version]
  27. Hossain, M.B.; Rai, D.K.; Brunton, N.P.; Martin-Diana, A.B.; Barry-Ryan, C. Characterization of phenolic composition in Lamiaceae spices by LC-ESI-MS/MS. J. Agric. Food Chem. 2010, 58, 10576–10581. [Google Scholar] [CrossRef]
  28. Kammerer, D.; Claus, A.; Carle, R.; Schieber, A. Polyphenol screening of pomace from red and white grape varieties (Vitis vinifera L.) by HPLC-DAD-MS/MS. J. Agric. Food Chem. 2004, 52, 4360–4367. [Google Scholar] [CrossRef] [PubMed]
  29. Peng, J.; Guo, K.; Xia, J.; Zhou, J.; Yang, J.; Westaway, D.; Li, L. Development of Isotope labeling liquid chromatography mass spectrometry for mouse urine metabolomics: Quantitative metabolomic study of transgenic mice related to Alzheimer’s disease. J. Proteome Res. 2014, 13, 4457–4469. [Google Scholar] [CrossRef] [PubMed]
  30. Domínguez-Fernández, M.; Yang, P.Y.T.; Ludwig, I.A.; Clifford, M.N.; Cid, C.; Rodriguez-Mateos, A. In vivo study of the bioavailability and metabolic profile of (poly) phenols after sous-vide artichoke consumption. Food Chem. 2022, 367, 130620. [Google Scholar] [CrossRef]
  31. Zhang, H.; Shao, Y.; Bao, J.; Beta, T. Phenolic compounds and antioxidant properties of breeding lines between the white and black rice. Food Chem. 2015, 172, 630–639. [Google Scholar] [CrossRef] [PubMed]
  32. Yan, L.; Yin, P.; Ma, C.; Liu, Y. Method development and validation for pharmacokinetic and tissue distributions of ellagic acid using ultrahigh performance liquid chromatography-tandem mass spectrometry (UPLC-MS/MS). Molecules 2014, 19, 18923–18935. [Google Scholar] [CrossRef] [PubMed] [Green Version]
  33. Nuengchamnong, N.; Krittasilp, K.; Ingkaninan, K. Characterisation of phenolic antioxidants in aqueous extract of Orthosiphon grandiflorus tea by LC-ESI-MS/MS coupled to DPPH assay. Food Chem. 2011, 127, 1287–1293. [Google Scholar] [CrossRef]
  34. Dall’Asta, M.; Calani, L.; Tedeschi, M.; Jechiu, L.; Brighenti, F.; Del Rio, D. Identification of microbial metabolites derived from in vitro fecal fermentation of different polyphenolic food sources. Nutrition 2012, 28, 197–203. [Google Scholar] [CrossRef]
  35. Todoroki, K.; Ishii, Y.; Miyauchi, C.; Kitagawa, S.; Min, J.Z.; Inoue, K.; Toyo’oka, T. Simple and sensitive analysis of histamine and Tyramine in Japanese soy sauces and their intermediates using the stable isotope dilution HILIC-MS/MS method. J. Agric. Food Chem. 2014, 62, 6206–6211. [Google Scholar] [CrossRef] [PubMed]
  36. Mazzotti, F.; Benabdelkamel, H.; Di Donna, L.; Maiuolo, L.; Napoli, A.; Sindona, G. Assay of tyrosol and hydroxytyrosol in olive oil by tandem mass spectrometry and isotope dilution method. Food Chem. 2012, 135, 1006–1010. [Google Scholar] [CrossRef]
  37. Liu, Z.; Ezernieks, V.; Reddy, P.; Elkins, A.; Krill, C.; Murphy, K.; Spangenberg, G. A simple GC-MS/MS method for determination of smoke taint-related volatile phenols in grapes. Metabolites 2020, 10, 294. [Google Scholar] [CrossRef] [PubMed]
  38. Schmidt, L.; Heck, N.D.V.; Ferreira, I.; Göethel, G.; Somacal, S.; Emanuelli, T.; Augusti, P.R. Ochratoxin A presence in Cabernet Sauvignon wine changes antioxidant activity in vitro and oxidative stress markers in vivo. Food Addit. Contam. Part A Chem. Anal. Control Expo. Risk Assess 2020, 37, 1755–1764. [Google Scholar] [CrossRef]
  39. Arimboor, R.; Arumughan, C. HPLC-DAD-MS/MS profiling of antioxidant flavonoid glycosides in sea buckthorn (Hippophae rhamnoides L.) seeds. Int. J. Food Sci. Nutr. 2012, 63, 730–738. [Google Scholar] [CrossRef]
  40. Hong, Y.; Liao, X.; Chen, Z. Determination of bioactive components in the fruits of Cercis chinensis Bunge by HPLC-MS/MS and quality evaluation by principal components and hierarchical cluster analysis. J. Pharm. Anal. 2020. [Google Scholar] [CrossRef]
  41. Hubner, A.; Sobreira, F.; Vetore Neto, A.; Pinto, C.A.S.D.O.; Dario, M.F.; Díaz, I.E.C.; Bacchi, E.M. The synergistic behavior of antioxidant phenolic compounds obtained from winemaking waste’s valorization, increased the efficacy of a sunscreen system. Antioxidants 2019, 8, 530. [Google Scholar] [CrossRef] [Green Version]
  42. Zhang, Q.F.; Guo, Y.X.; Zheng, G.; Wang, W.J. Chemical constituents comparison between Rhizoma Smilacis Glabrae and Rhizoma Smilacis Chinae by HPLC-DAD-MS/MS. Nat. Prod. Res. 2013, 27, 277–281. [Google Scholar] [CrossRef] [PubMed]
  43. Tetik, M.A.; Sevindik, O.; Kelebek, H.; Selli, S. Screening of key odorants and anthocyanin compounds of cv. Okuzgozu (Vitis vinifera L.) red wines with a free run and pressed pomace using GC-MS-Olfactometry and LC-MS-MS. J. Mass Spectrom. 2018, 53, 444–454. [Google Scholar] [CrossRef] [PubMed]
  44. Ha, T.J.; Park, J.E.; Lee, K.S.; Seo, W.D.; Song, S.B.; Lee, M.H.; Lee, J.H. Identification of anthocyanin compositions in black seed coated Korean adzuki bean (Vigna angularis) by NMR and UPLC-Q-Orbitrap-MS/MS and screening for their antioxidant properties using different solvent systems. Food Chem. 2021, 346, 128882. [Google Scholar] [CrossRef] [PubMed]
  45. Sun, J.; Liang, F.; Bin, Y.; Li, P.; Duan, C. Screening non-colored phenolics in red wines using liquid chromatography/ultraviolet and mass spectrometry/mass spectrometry libraries. Molecules 2007, 12, 679–693. [Google Scholar] [CrossRef] [PubMed] [Green Version]
  46. Liu, J.; Mu, Y.; Xiong, S.; Sun, P.; Deng, Z. A UPLC-MS/MS method for comparative pharmacokinetics study of morusin and morin in normal and diabetic rats. Biomed. Chromatogr. 2019, 33, e4516. [Google Scholar] [CrossRef]
  47. De Rosso, M.; Panighel, A.; Vedova, A.D.; Gardiman, M.; Flamini, R. Characterization of non-anthocyanic flavonoids in some hybrid red grape extracts potentially interesting for industrial uses. Molecules 2015, 20, 18095–18106. [Google Scholar] [CrossRef] [Green Version]
  48. Ferreira, V.; López, R.; Cacho, J.F. Quantitative determination of the odorants of young red wines from different grape varieties. J. Agric. Sci. 2000, 80, 1659–1667. [Google Scholar] [CrossRef]
  49. Yang, L.; Jiang, H.; Xing, X.; Yan, M.; Guo, X.; Man, W.; Yang, L. A biosensor-based quantitative analysis system of major active ingredients in Lonicera japonica thunb. Using UPLC-QDa and chemometric analysis. Molecules 2019, 24, 1787. [Google Scholar] [CrossRef] [Green Version]
  50. Abass, K.; Reponen, P.; Mattila, S.; Pelkonen, O. Metabolism of α-thujone in human hepatic preparations in vitro. Xenobiotica 2011, 41, 101–111. [Google Scholar] [CrossRef]
  51. Thaipong, K.; Boonprakob, U.; Crosby, K.; Cisneros-Zevallos, L.; Byrne, D.H. Comparison of ABTS, DPPH, FRAP, and ORAC assays for estimating antioxidant activity from guava fruit extracts. J. Food Compost. Anal. 2006, 19, 669–675. [Google Scholar] [CrossRef]
  52. Jasprica, I.; Bojic, M.; Mornar, A.; Besic, E.; Bucan, K.; Medic-Saric, M. Evaluation of antioxidative activity of croatian propolis samples using DPPH· and ABTS·+ stable free radical assays. Molecules 2007, 12, 1006–1021. [Google Scholar] [CrossRef] [PubMed] [Green Version]
  53. Baburajeev, C.P.; Mohan, C.D.; Pandey, V.; Rangappa, S.; Shivalingegowda, N.; Kalash, L.; Rangappa, K.S. Synthesis of CC, CN coupled novel substituted dibutyl benzothiazepinone derivatives and evaluation of their thrombin inhibitory activity. Bioorg. Chem. 2019, 87, 142–154. [Google Scholar] [CrossRef] [PubMed]
  54. Liu, P.K.; Weng, Z.M.; Ge, G.B.; Li, H.L.; Ding, L.L.; Dai, Z.R.; Hou, J. Biflavones from Ginkgo biloba as novel pancreatic lipase inhibitors: Inhibition potentials and mechanism. Int. J. Biol. Macromol. 2018, 118, 2216–2223. [Google Scholar] [CrossRef] [PubMed]
Figure 1. Schematic diagram of principle for screening active ingredient.
Molecules 26 06750 g001
Figure 2. The multi-activity integrated chromatogram of antioxidant activity, inhibitory activity of thrombin and inhibitory activity of lipase. The chromatogram of red wine was shown in superstratum, substratum was a column diagram of each fraction for the three activities.
Molecules 26 06750 g002
Figure 3. The extracted ion chromatogram of positive and negative ions.
Molecules 26 06750 g003
Figure 4. The typical reference chromatogram (top) and the typical chromatogram of red wine (bottom). gallic acid (1), coumalic acid (2), protocatechuic acid (3), proanthocyanidin B1 (4), catechins (5), caffeic acid (6), syringic acid (7), epicatechin (8), p-coumaric acid (9), isoquercitrin (10), isorhamnetin 3-O-glucoside (11) and quercetin (12).
Molecules 26 06750 g004
Figure 5. The content of 12 compounds from red wine (n = 3).
Molecules 26 06750 g005
Figure 6. The inhibition ratios of red wine and 12 active compounds mixture with different dilution times and the difference between inhibition of red wine and 12 compounds mixture.
Molecules 26 06750 g006
Table 1. The data of antioxidant activity (expressed in Trolox), thrombin inhibitory activity (expressed in inhibition) and lipase inhibitory activity (expressed in inhibition).
Antioxidant Activity Inhibition (Trolox (%))Thrombin Inhibitory Activity Inhibition (%)Lipase Inhibitory Activity Inhibition (%)
F131.0737.8269.67
F2no44.4287.30
F345.3524.65no
F455.6426.68no
F529.6329.77no
F642.5626.61no
F7nonono
F8nonono
F924.0821.21no
F1023.10nono
F11nono87.35
F12nonono
F1325.70nono
F14no22.44no
F15nonono
F1636.79no100.20
F1755.64no66.44
F1829.63nono
F1942.56no124.96
F20nono70.68
F21nono113.43
F2219.3419.22136.53
F2330.56no94.14
F2423.59no103.15
F2542.8718.5666.12
F2654.3235.0697.89
F2748.3136.2167.39
F2843.8848.4768.79
F2939.0329.44127.97
F3040.8318.0790.74
F3132.3124.49no
F3230.82nono
F33nonono
F34nonono
F35nonono
F3630.3635.12no
F3724.07nono
F38nonono
F3919.44nono
F4019.48nono
F41nonono
F4222.28no71.92
F4322.64no77.88
S4425.36no84.26
F45no27.81no
F4625.08nono
F47nonono
F48nono79.38
F49nono68.49
F50nonono
F51no19.33no
F52nonono
F53nonono
F5427.09nono
F5525.94no73.85
F5625.2727.6672.88
F5736.6820.9166.70
F58no20.6576.42
F5922.80no69.65
F6023.21no67.84
Table 2. UFLC/Q-TOF-MS data and identification 94 compounds from red wine.
Peak No.RT (min)IonFound at MassMS/MS Fragmentation IonsFormulaIdentificationppm
10.70[M+H]+116.070270.0647C5H9NO2D-proline0.8
20.76[M+H]+175.118970.0652C6H14N4O2L-arginine−0.3
30.79[M−H]179.056299.0087, 71.0137, 59.0139C6H12O6D-glucose0.3
40.88[M-H]181.072083.0143, 71.0140, 59.0140C6H14O6D-mannitol1.5
50.96[M−H]191.019985.0296, 59.0134C6H8O7citric acid1.0
60.99[M−H]149.0091105.0217, 87.0085, 72.9928C4H6O6tartaric acid−0.7
71.04[M+H]+138.0548120.0433, 92.0495, 78.0339C7H7NO24-aminobenzoic acid−1.5
81.12[M−H]341.1088161.0459, 71.0137, 59.0138C12H22O11trehalose−0.3
91.15[M−H]149.045575.0221, 59.0133C5H10O5D-ribose−0.2
101.31[M−H]133.0142115.0018, 71.0136C4H6O5L-malic acid−0.5
111.33[M+H]+118.086272.0809C5H11NO2L-valine−0.4
121.48[M−H]173.0454137.0225, 93.0343C7H10O5shikimic acid−1.0
131.71[M+H]+150.058674.0243, 61.0108C5H11NO2SL-methionine1.8
142.03[M+H]+124.039380.0506, 55.9346C6H5NO2niacin0.2
153.27[M−H]117.019299.9254, 73.0291C4H6O4succinic acid−1.2
163.51[M+H]+165.0547119.0479, 95.0503, 77.0388, 59.9302C9H8O3trans-4-hydroxycinnamic acid0.7
173.85[M+H]+137.0913121.0616, 103.0616, 95.0561, 91.0556, 77.0391C8H11NOtyramine−0.5
185.97[M−H]169.0141125.0244, 107.0156, 79.0186C7H6O5gallic acid−1.0
198.77[M+H]+141.0182123.0080, 95.0127, 67.0187, 55.9453C6H4O4coumalic acid−0.1
2011.49[M−H]153.0558123.0085, 108.0221, 95.0139, 78.9590C8H10O3hydroxytyrosol0.2
2111.57[M−H]153.0194109.0298, 91.0298, 65.0029C7H6O4protocatechuic acid0.3
2213.85[M−H]305.0664179.0360, 165.0194, 137.0243, 125.0246C15H14O7(+)-gallocatechin−1.0
2314.27[M−H]179.0349135.0560, 89.0394, 79.0550C9H8O4acetylsalicylic acid−0.7
2414.27[M−H]179.0348161.0263, 135.0454, 117.0351C13H12O9caftaric acid−1.0
2515.05[M−H]153.0194123.0061, 109.0298, 91.0298C7H6O4gentisic acid0.4
2615.21[M−H]137.0255108.0213C7H6O3protocatechualdehyde−2.7
2715.31[M−H]181.0506135.0453C9H10O4homovanillic acid0.0
2815.43[M−H]183.0299124.0234, 95.0136C8H8O5methyl gallate0.0
2915.90[M−H]137.024493.0340C7H6O34-hydroxybenzoic acid0.4
3016.32[M−H]353.0877191.0616, 179.0341, 135.0439C16H18O9chlorogenic acid−0.2
3117.36[M−H]295.0458163.0400, 119.0503, 87.0094C13H12O8p-coutaric acid0.1
3218.08[M−H]163.0401119.0498, 93.0347C9H8O3m-coumaric acid0.2
3318.08[M−H]295.0458163.0400, 119.0498C13H12O8coutaric acid−0.4
3418.15[M−H]145.050773.0273, 55.0191C6H10O4dimethyl succinate 0.6
3519.24[M−H]121.0296108.0212, 92.0265C7H6O2benzoic acid0.8
3619.66[M−H]577.1346425.0864, 407.0775, 289.0714, 161.0238, 125.0243C30H26O12procyanidin B1−0.9
3719.89[M−H]305.0664245.0462, 219.0652, 139.0401, 125.0244C15H14O7(−)-epigallocatechin0.2
3819.98[M−H]577.1346407.0768, 289.0709C30H26O12procyanidin B30.0
3920.01[M−H]167.0350108.0212C8H8O4vanillic acid0.2
4020.21[M−H]163.0400119.0502, 93.0343C9H8O32-Hydroxycinnamic acid−0.1
4120.47[M−H]289.0713245.0843, 203.0713, 151.0401, 109.0294C15H14O6catechin−1.5
4220.58[M−H]325.0563193.0490, 117.0341C14H14O9fertaric acid−0.5
4320.98[M−H]179.0349135.0449, 89.0393C9H8O4caffeic acid−1.0
4421.90[M−H]441.0186289.0735, 217.0167, 191.0337, 151.0386C22H18O10epicatechin gallate2.2
4522.06[M−H]197.0454182.0256, 167.0014, 138.0317, 123.0090, 95.0142C9H10O5syringic acid−0.3
4623.01[M−H]577.1346425.0893, 407.0782, 289.0721C30H26O12procyanidin B2−0.7
4723.11[M−H]325.0926163.0394, 145.0294, 117.0343C15H18O8p-coumaric acid glucoside−0.5
4823.37[M−H]189.076971.0503C8H14O5diethyl malate0.3
4923.69[M−H]165.0556119.0527, 103.0565C9H10O3desaminotyrosine−0.5
5024.37[M−H]137.024493.0470, 65.0473C7H6O32-hydroxybenzoic acid2.2
5124.38[M−H]289.0713203.0710, 187.0396, 151.0401, 123.0449, 109.0290C15H14O6epicatechin−0.7
5224.68[M−H]167.0350123.0436, 108.0212C8H8O43-hydroxy-4-methoxybenzoic acid2.5
5325.16[M−H]197.0454169.0142, 125.0239, 79.0184C9H10O5ethyl gallate−0.9
5425.32[M]+493.1341331.0822, 316.0553C23H25O12malvidin-3-O-glucoside0.1
5525.74[M−H]163.0401119.0503, 93.0347C9H8O3p-coumaric acid−0.6
5630.75[M−H]167.0350123.0450, 65.0024C8H8O4homogentisic acid0.8
5730.80[M−H]577.1346425.0886, 407.0789, 289.0734C30H26O12procyanidin B70.6
5834.06[M−H]479.0826316.0225, 271.0249, 151.0034C21H20O13myricetin-3-O-galactoside−1.0
5935.93[M−H]389.1242227.0716, 185.0606, 143.0505C20H22O8trans-piceid−0.2
6038.70[M−H]300.9987257.011, 229.0126, 145.0295C14H6O8ellagic acid−0.9
6138.84[M−H]181.0506109.0286, 65.0032C9H10O4dihydrocaffeic acid0.5
6239.28[M]+465.1036303.051, 229.0488C21H21O12delphinidin-3-O-glucoside1.9
6339.31[M−H]463.0884301.0379, 271.0245, 243.0291, 151.0031C21H20O12hyperoside0.4
6439.71[M−H]449.1090285.0413, 151.0041C21H22O11quercitrin0.2
6539.83[M]+627.1462303.0351C27H31O17delphinidin-3,5-O-diglucoside1.1
6640.08[M−H]477.0670301.0352, 255.0296, 151.0034C21H18O13quercetin-3-O-glucuronide−0.9
6741.28[M−H]493.0985330.0381, 315.0155, 271.0249, 151.0034C22H22O13laricitrin-3-O-glucoside−0.6
6842.86[M−H]447.0936301.0372, 271.0256, 255.0295, 151.0020C21H20O11luteolin -3’-glucoside1.2
6942.98[M−H]449.1090285.0413, 151.0041C21H22O11astilbin0.9
7043.45[M−H]463.0884301.0379, 255.0305, 151.0039C21H20O12isoquercitrin0.8
7144.78[M−H]447.0936301.0372, 255.0293, 151.0016C21H20O11astragalin0.8
7245.19[M−H]389.1242227.0994, 185.0606C20H22O8cis-piceid0.0
7345.72[M−H]317.0300245.0504, 137.0241, 109.0292, 151.0035C15H10O8myricetin−0.9
7445.77[M]+479.1193317.0648, 302.0429, 285.0362, 153.0184C22H23O12petunidin-3-O-glucoside1.9
7545.80[M−H]477.1041315.0530, 300.0263, 271.0255, 243.0306, 151.0036C22H22O12isorhamnetin-3-O-glucoside0.6
7647.17[M−H]227.0715185.0587, 143.0501, 115.0556C14H12O3trans-resveratrol0.6
7747.42[M−H]435.1300273.0769, 179.0349, 167.0352C21H24O10phloridzin0.7
7849.16[M]+507.1141303.0767, 187.0626, 113.0234C23H23O13delphindin-3-O-(6-O-acetylglucoside)1.6
7951.13[M−H]207.0662179.0433, 135.0446C11H12O4ethyl caffeate−0.6
8051.94[M]+639.1719477.1176, 419.0853, 331.0874C32H31O14malvidin-3-O-(6-O-coumaroylglucoside)1.7
8152.60[M+H]+303.0497285.0398, 257.0456, 229.0492, 153.0188C15H10O7morin−0.8
8252.60[M]+303.0497229.0492, 153.0188C15H11O7delphinidin−0.8
8352.63[M−H]301.0351245.0447, 229.0513, 151.0034, 121.0292C15H10O7quercetin−1.0
8452.67[M−H]227.0715143.0504C14H12O3resveratrol−0.9
8553.23[M−H]331.0459316.0231, 271.0251, 178.9991, 151.0039C16H12O8laricitrin0.0
8655.82[M−H]271.0613229.0500, 177.0190, 151.0048, 119.0618C15H12O5naringenin0.4
8757.10[M]+287.0549213.0559, 153.0180, 137.0233C15H11O6cyanidin−0.3
8857.12[M−H]285.0403239.0356, 187.0403, 151.004C15H10O6kamepferol−0.6
8957.32[M−H]345.0618330.0385, 315.0153, 259.0252, 187.0394C17H14O8syringetin0.6
9057.39[M]+317.0656229.0498, 153.0188C16H13O7petunidin0.0
9157.41[M−H]315.0508300.0270, 271.0241, 255.0299, 227.0241, 151.0036C16H12O7isorhamnetin−0.6
9258.32[M+H]+193.158856.9419C13H20Oionone0.6
9360.04[M+H]+173.153676.0221C10H20O2ethyl caprylate0.2
9460.96[M+H]+195.1748177.1634, 107.0855, 77.0387C13H22Otheaspirane2.1
Table 3. The corresponding relationship between fraction number and peak number of the 77 potential active components.
Fraction Number Peak NumberIdentificationAntioxidant ActivityThrombin Inhibitory ActivityLipase Inhibitory Activity
F15, 6, 10, 12citric acid, tartaric acid, L-malic acid, shikimic acidyesyesyes
F212shikimic acid yesyes
F315, 16succinic acid, trans-4-hydroxycinnamic acidyesyes
F417tyramineyesyes
F518gallic acidyesyes
F618gallic acidyesyes
F919coumalic acidyesyes
F1021protocatechuic acidyes
F1121protocatechuic acid yes
F1322(+)-gallocatechinyes
F1423, 24acetylsalicylic acid, caftaric acid yes
F1625, 26, 27, 28gentisic acid, protocatechualdehyde, homovanillic acid, methyl gallateyes yes
F17294-hydroxybenzoic acidyes yes
F1830chlorogenic acidyes
F1931p-coutaric acidyes yes
F2032, 33, 34m-coumaric acid, coutaric acid, dimethyl succinate yes
F2135benzoic acid yes
F2236, 37, 38procyanidin B1, (−)-epigallocatechin, procyanidin B3yesyesyes
F2339, 40, 41, 42, 43vanillic acid, 2-Hydroxycinnamic acid, catechin, fertaric acid, caffeic acidyes yes
F2444epicatechin gallateyes yes
F2545syringic acidyesyesyes
F2646, 47, 48procyanidin B2, p-coumaric acid glucoside, diethyl malateyesyesyes
F2749, 50, 51desaminotyrosine, 2-hydroxybenzoic acid, epicatechinyesyesyes
F2853, 54ethyl gallate, malvidin-3-O-glucosideyesyesyes
F2955p-coumaric acidyesyesyes
F3055p-coumaric acidyesyesyes
F3156homogentisic acidyesyes
F3257procyanidin B7yes
F3658myricetin-3-O-galactosideyesyes
F3759trans-piceidyes
F3960, 61ellagic acid, dihydrocaffeic acidyes
F4062, 63delphinidin-3-O-glucoside, hyperosideyes
F4265, 66delphinidin-3,5-O-diglucoside, quercetin-3-O-glucuronideyes yes
F4367, 68, 69, 70laricitrin-3-O-glucoside, luteolin -3-O-glucoside, astilbin, isoquercitrinyes yes
F4470isoquercitrinyes yes
F4571astragalin yes
F4672cis-piceidyes
F4873, 74, 75myricetin, petunidin-3-O-glucoside, isorhamnetin-3-O-glucoside yes
F4976, 77trans-resveratrol, phloridzin yes
F51778delphindin-3-O-(6-O-acetylglucoside) yes
F5479, 80ethyl caffeate, malvidin-3-O-(6-O-coumaroylglucoside)yes
F5581, 82, 83, 84morin, delphinidin, quercetin, resveratrolyes yes
F5685laricitrinyesyesyes
F5785laricitrinyesyesyes
F5886naringenin yesyes
F5987cyanidinyes yes
F6088, 89, 90kamepferol, syringetin, petunidinyes yes
Table 4. Precision, stability, linearity, LODs and LOQs of 12 compounds from red wine.
AnalytesPrecisionStabilityLinearityLOQ
(μg/mL)
LOD
(μg/mL)
Intra-Day, RSD (%), (n = 3)Inter-Day RSD (%) (n = 9)RSD (%) (n = 6)Range (μg/mL)Equationr2
LowMiddleHigh
gallic acid2.22.21.33.42.520.00~320.0y = 0.3627x + 0.08310.99980.120.040
coumalic acid3.21.51.94.41.86.030~96.48y = 0.2339x − 0.00780.99942.00.75
protocatechuic acid4.92.21.74.21.11.005~16.08y = 0.1498x + 0.02900.99930.120.040
proanthocyanidin B13.62.11.84.62.26.000~96.0y = 0.1156x + 0.01210.99960.500.12
catechin5.01.32.03.32.56.030~96.5y = 0.2149x + 0.02880.99970.120.040
caffeic acid2.52.31.34.72.23.000~48.00y = 0.2645x + 0.04280.99920.120.040
syringic acid4.82.42.14.81.82.973~47.56y = 0.5234x + 0.03000.99970.250.08
epicatechin4.22.01.24.42.93.030~48.48y = 0.3627x + 0.08310.99980.500.12
p-coumaric acid4.41.71.44.12.13.015~48.24y = 0.2339x + 0.00780.99940.250.08
isoquercitrin4.61.91.34.61.80.2500~64.64y = 0.1495x + 0.04310.99940.250.08
isorhamnetin-3-O-glucoside5.02.11.73.32.30.990~15.84y = 0.1156x + 0.01210.99960.500.12
quercetin4.32.62.24.62.50.7500~31.46y = 0.2166x − 0.00940.99950.750.25
Table 5. The recovery of 12 compounds from red wine (n = 3).
AnalytesOriginal
(μg)
Spiked
(μg)
Found
(μg)
Recovery
(%)
RSD
(%)
gallic acid29.3420.0045.8199.81.8
40.0068.8597.01.4
60.0089.1499.81.0
coumalic acid9.7246.03014.6587.84.1
12.0621.1995.12.2
18.0926.7786.73.1
protocatechuic acid3.2981.0053.72083.44.3
2.0104.86490.62.5
3.0156.33898.41.4
proanthocyanidin B19.0276.00014.0189.74.0
12.0021.58103.62.3
18.0026.2794.12.1
catechin11.433.00014.1597.73.6
6.00017.50100.10.7
9.00020.61100.00.3
caffeic acid6.5392.9729.3396.33.4
5.94513.14105.02.1
8.91815.2698.91.0
syringic acid6.2042.9738.9797.73.4
5.94512.0897.53.2
8.91814.95101.71.8
epicatechin3.92230306.932101.21.6
6.06010.04101.90.7
9.09013.18105.91.4
p-coumaric acid4.4733.0157.590105.63.6
6.03010.1592.51.1
9.04513.78100.60.6
isoquercitrin8.8024.04012.7598.13.2
8.08016.7598.82.1
12.1220.6498.81.9
isorhamnetin-3-O-glucoside3.1440.99004.05398.11.1
1.9805.12397.42.6
2.9706.019102.12.4
quercetin3.1461.9664.92895.51.6
3.9336.95096.71.3
5.8998.8292.24.1
Publisher’s Note: MDPI stays neutral with regard to jurisdictional claims in published maps and institutional affiliations.

