
Flame-Made La2O3-Based Nanocomposite CO2 Sensors as Perspective Part of GHG Monitoring System

 ,
,  , and
, and 
Abstract
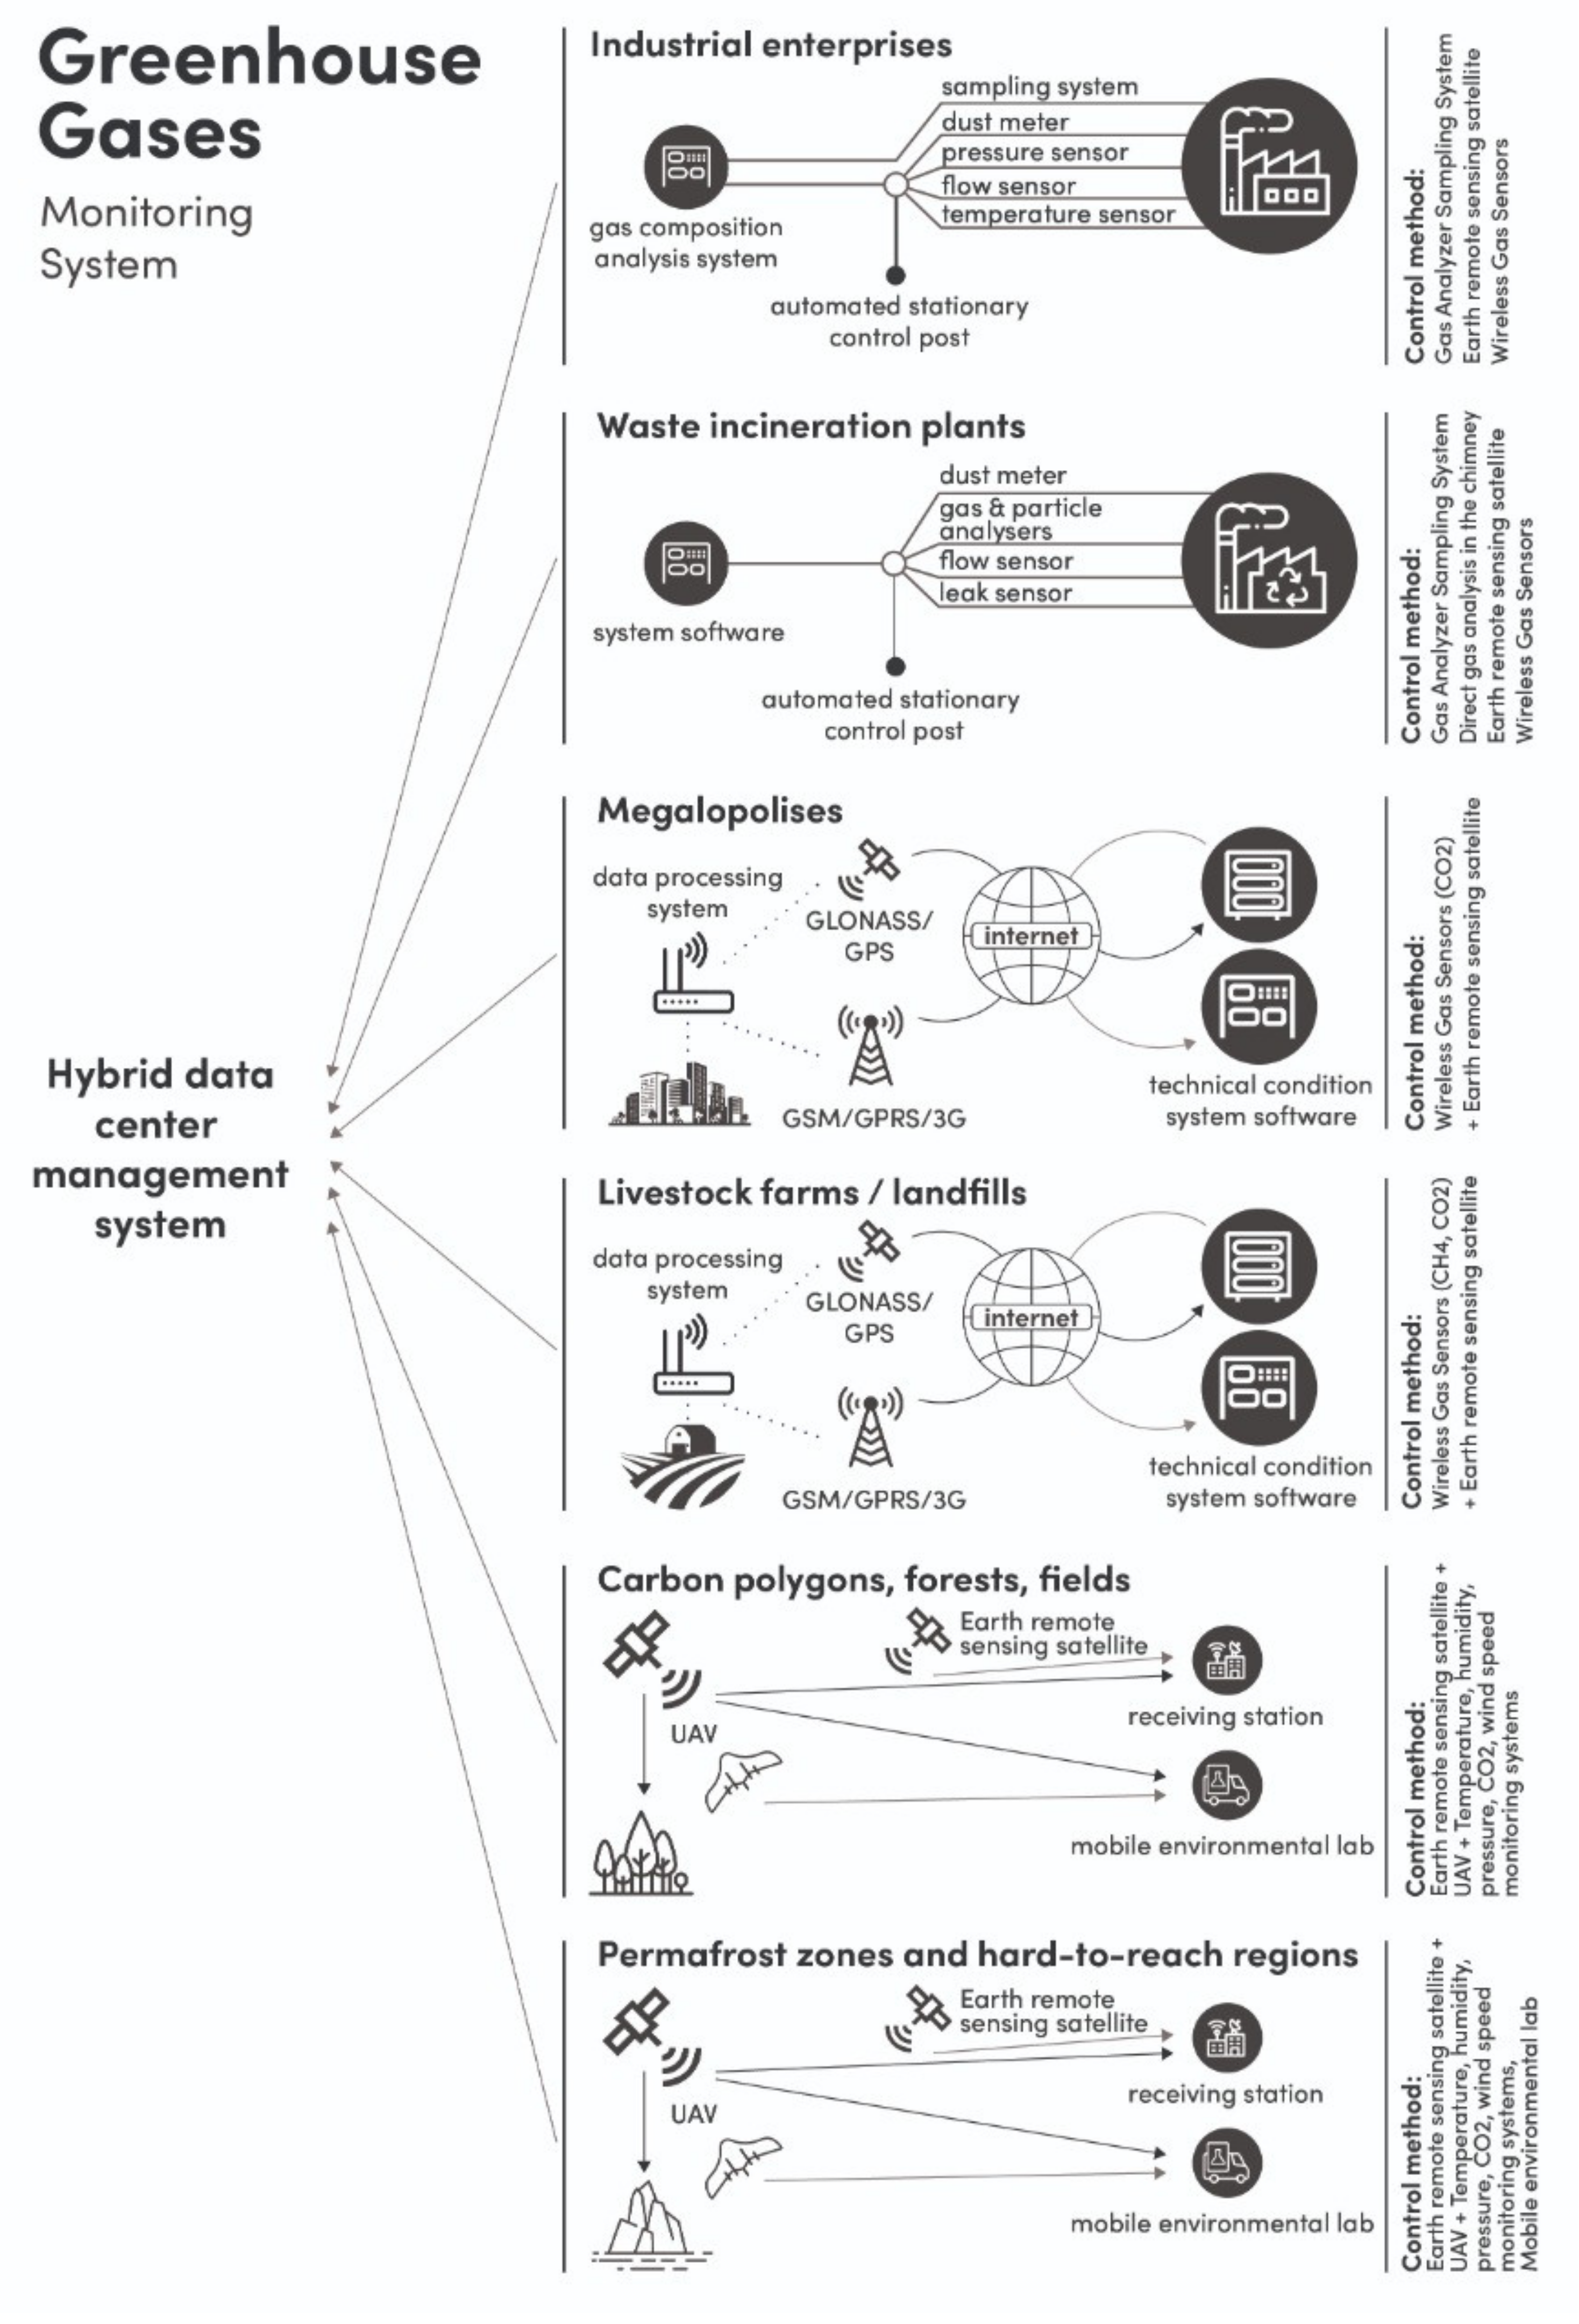
1. Introduction
2. Materials and Methods
3. Results and Discussion
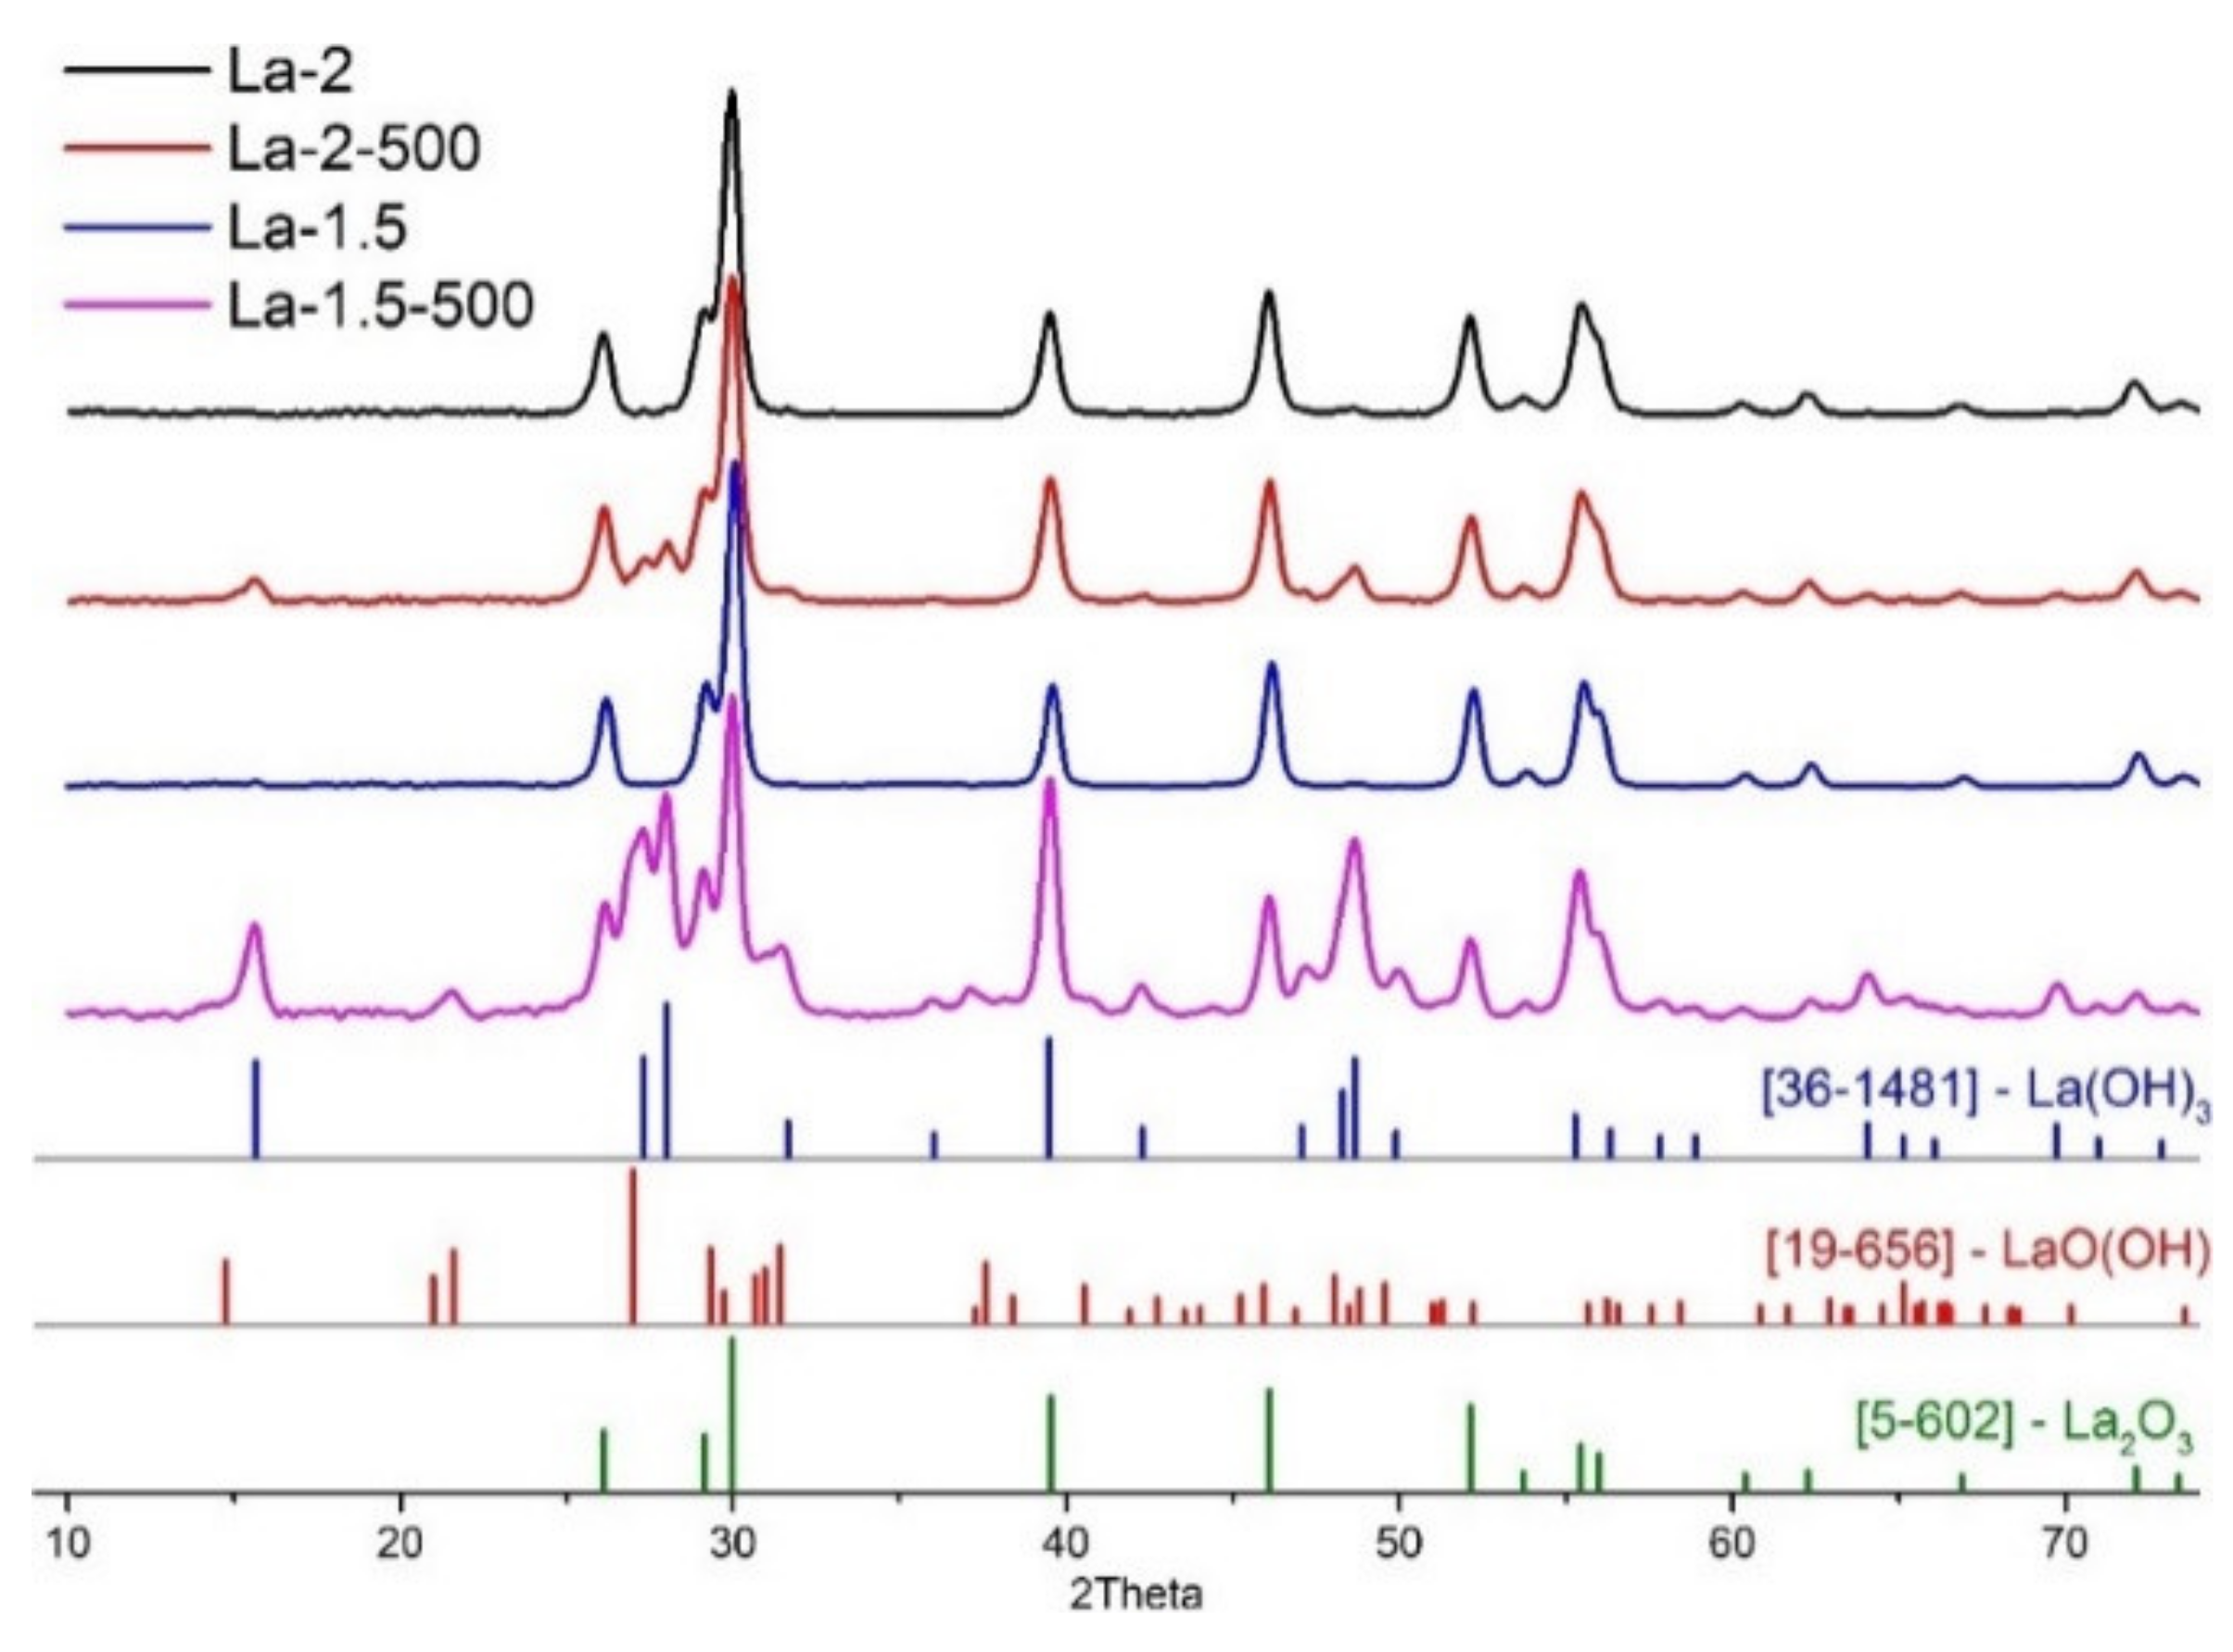
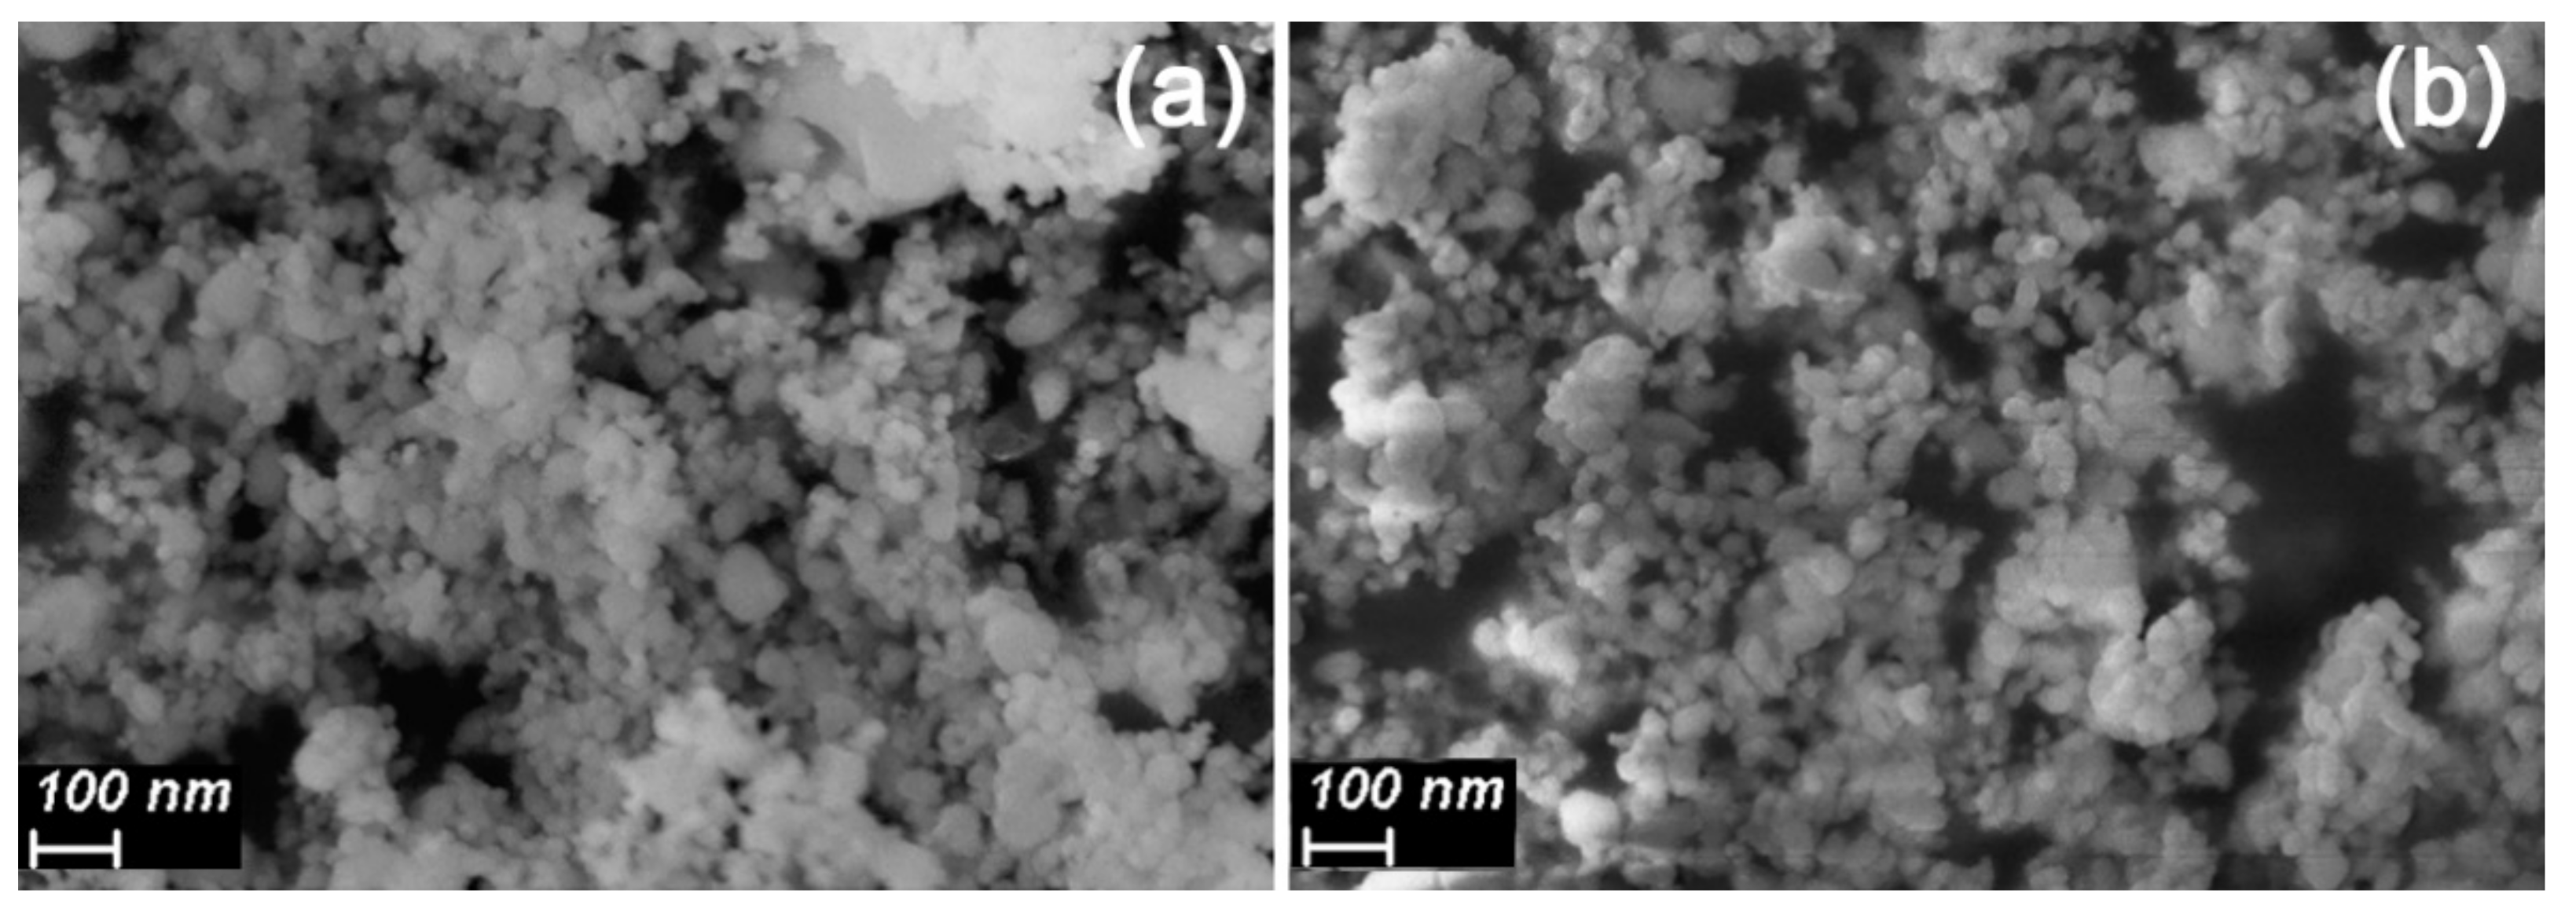
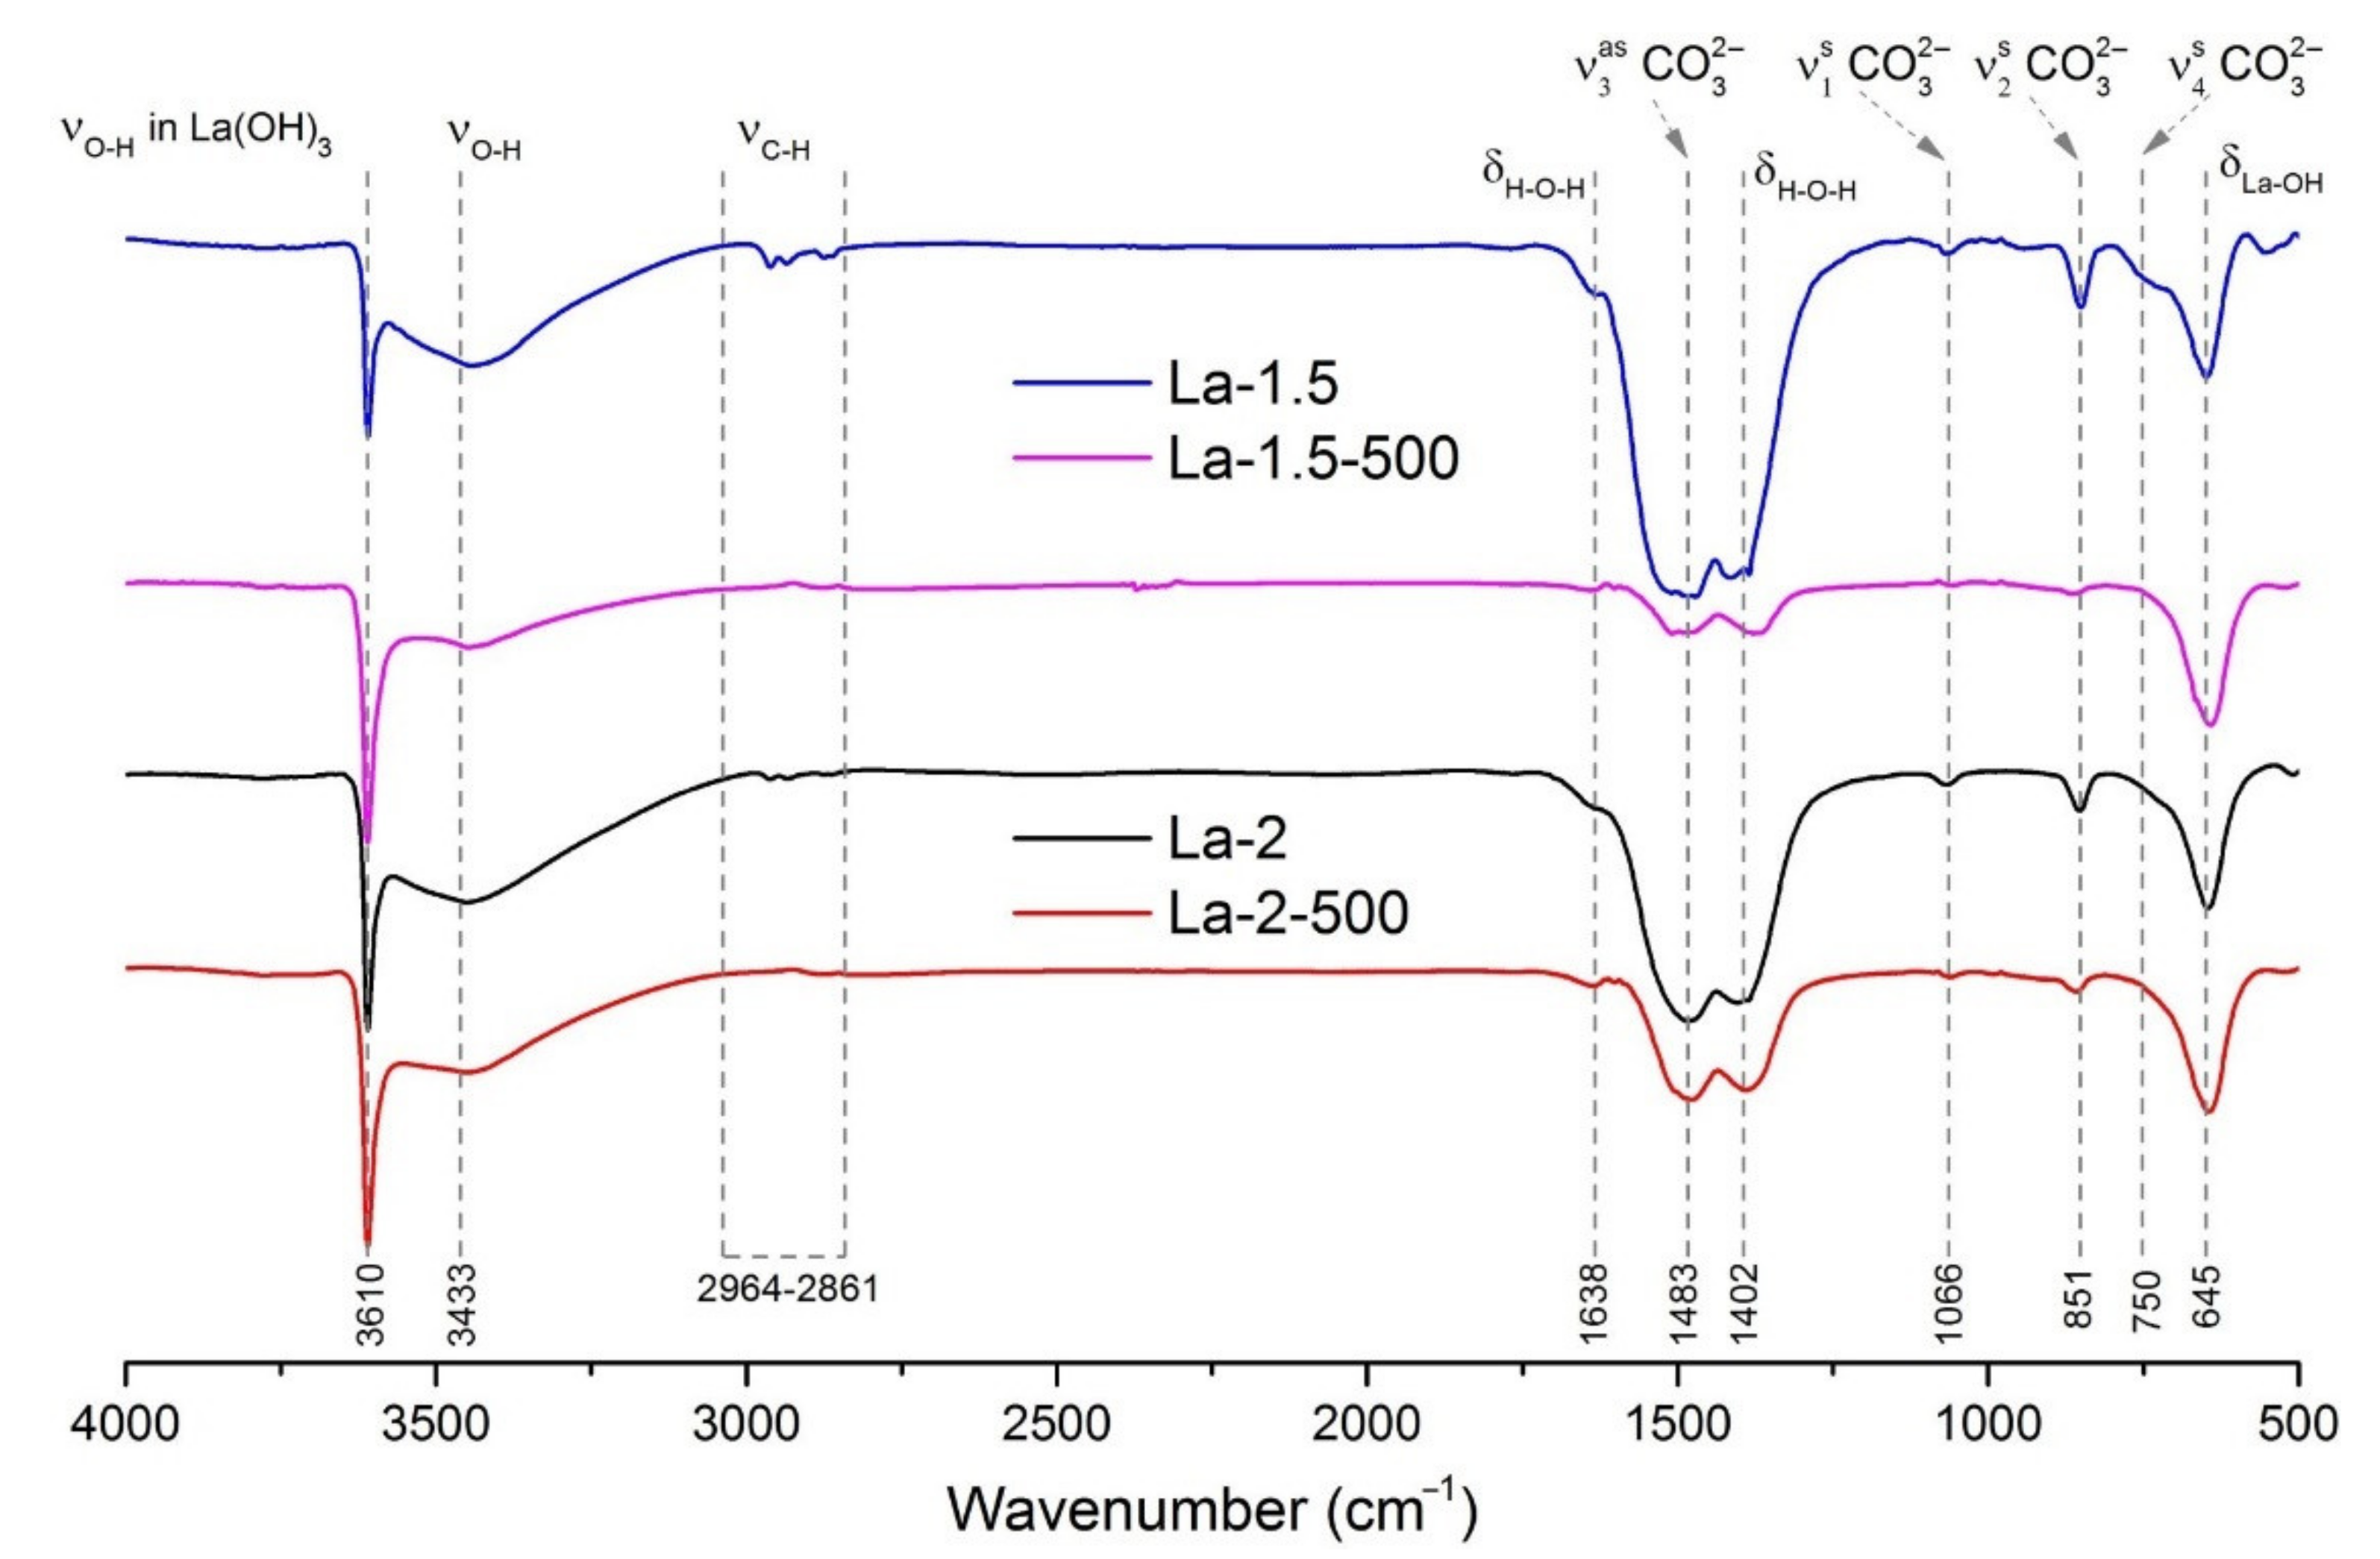
3.1. Materials Morphology and Phase Composition
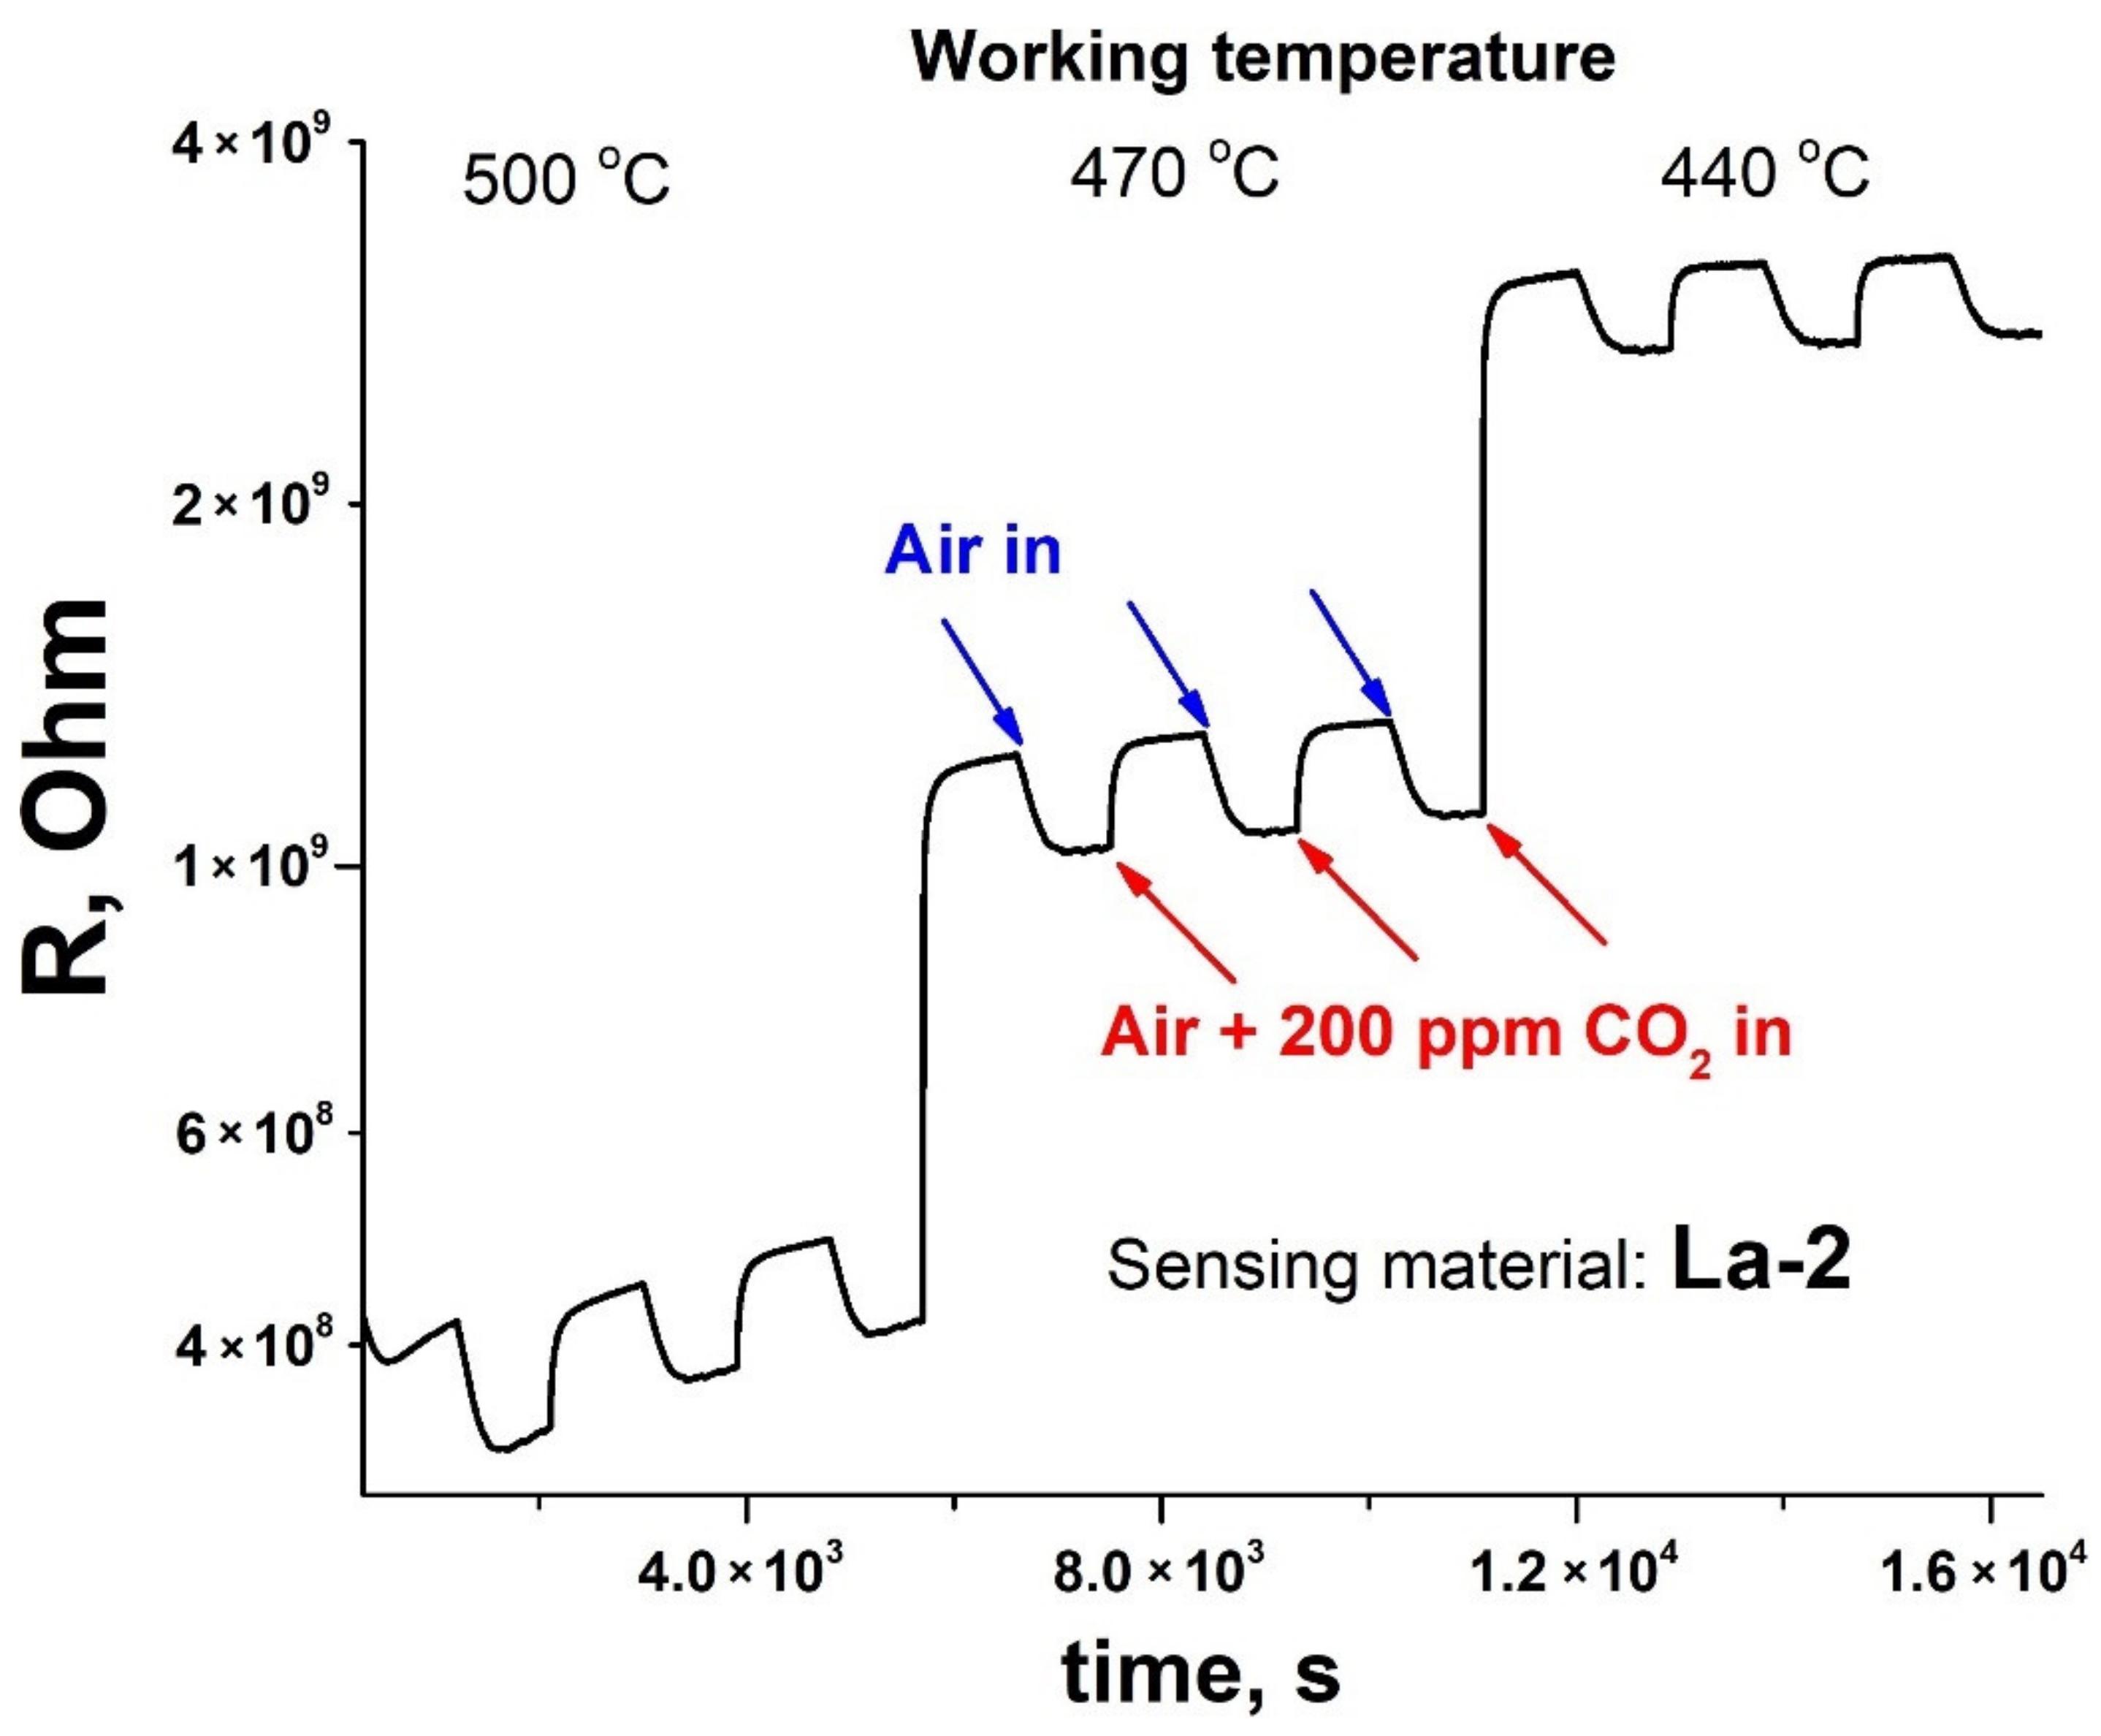
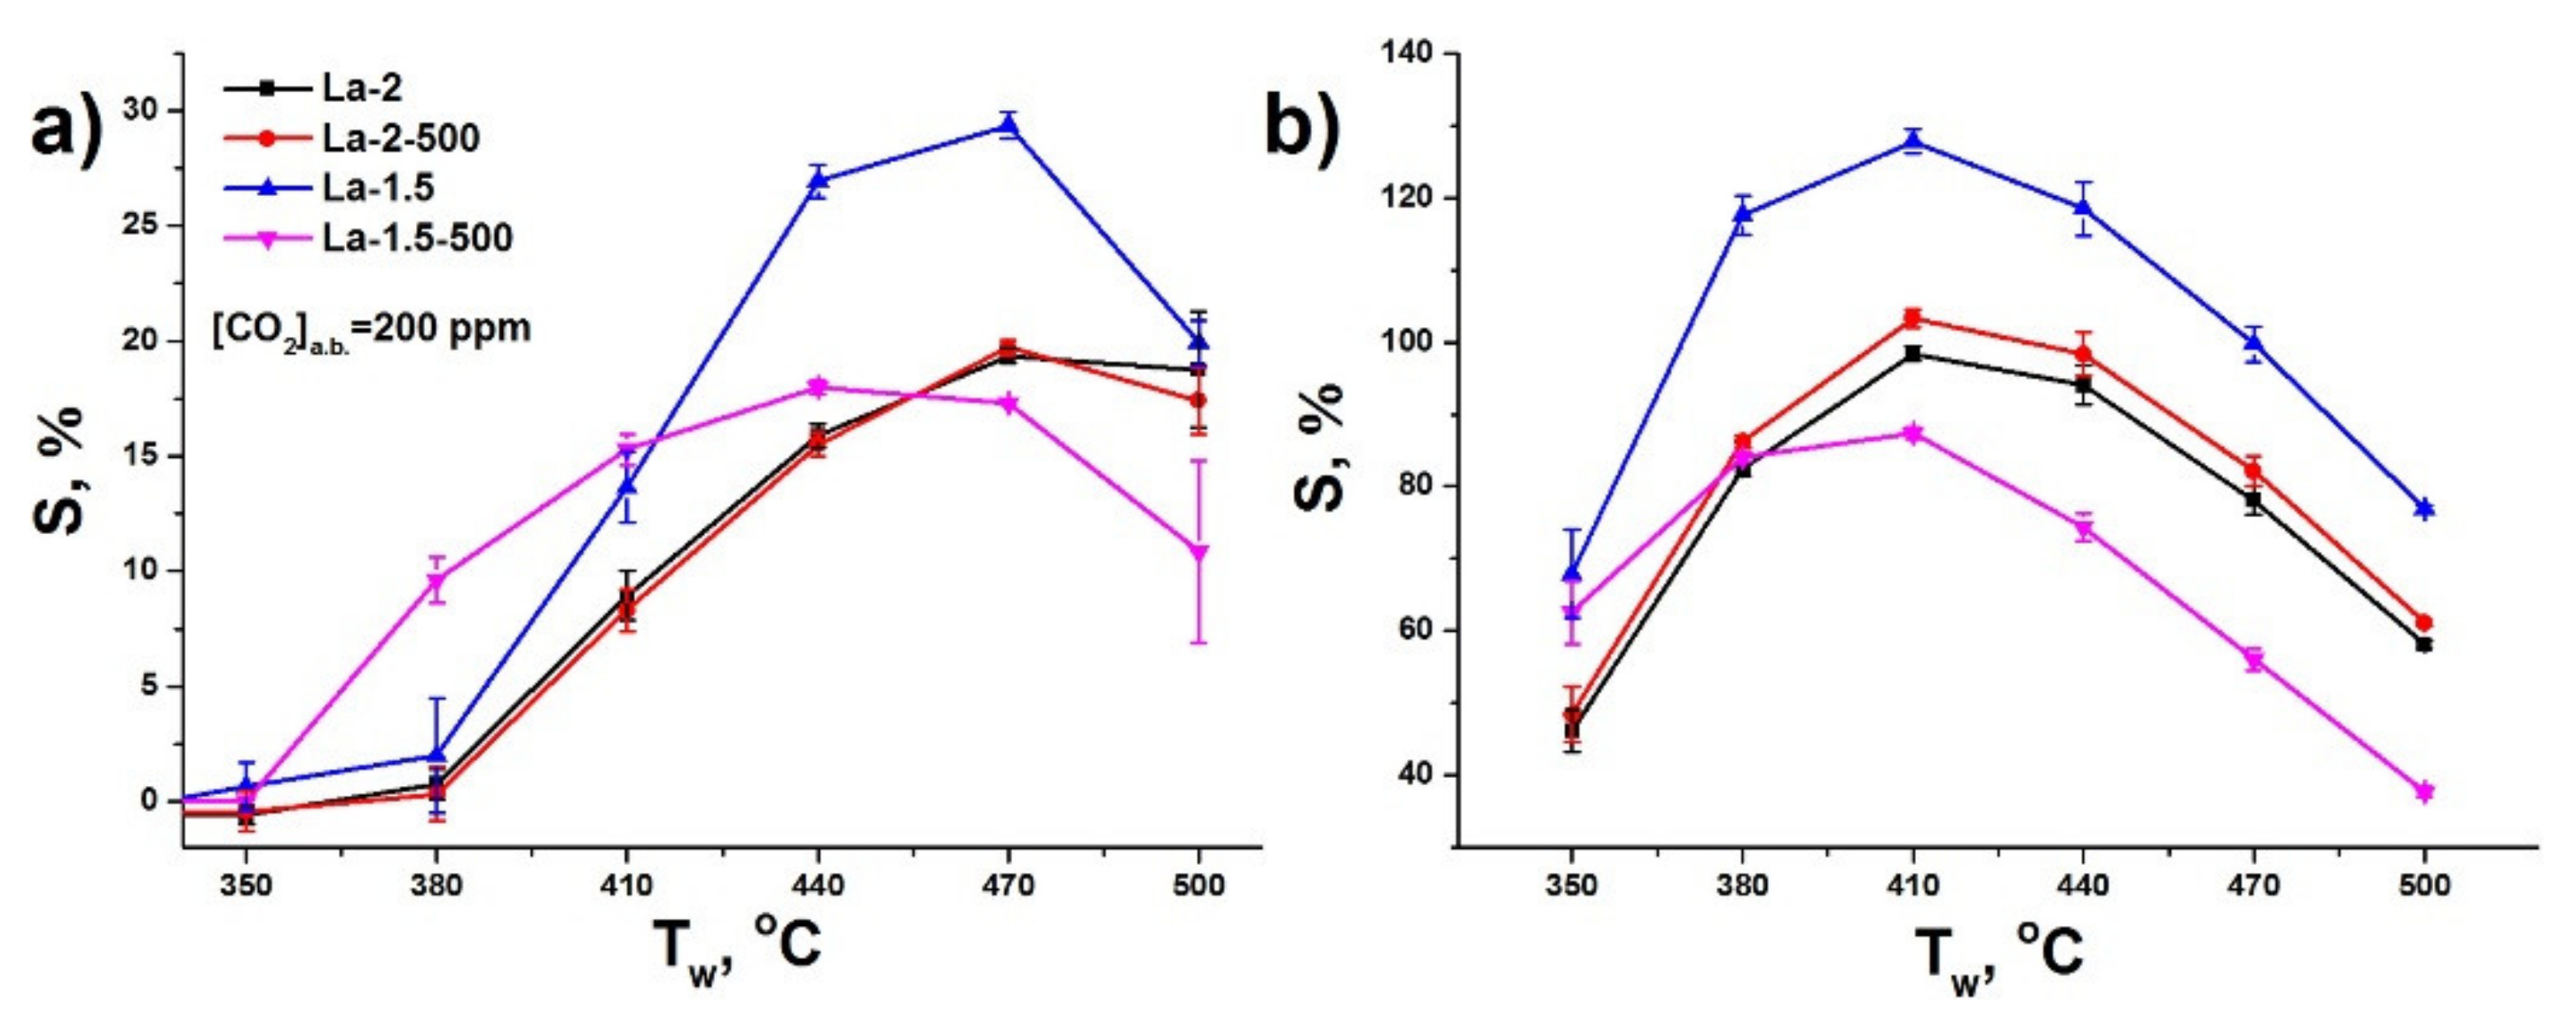
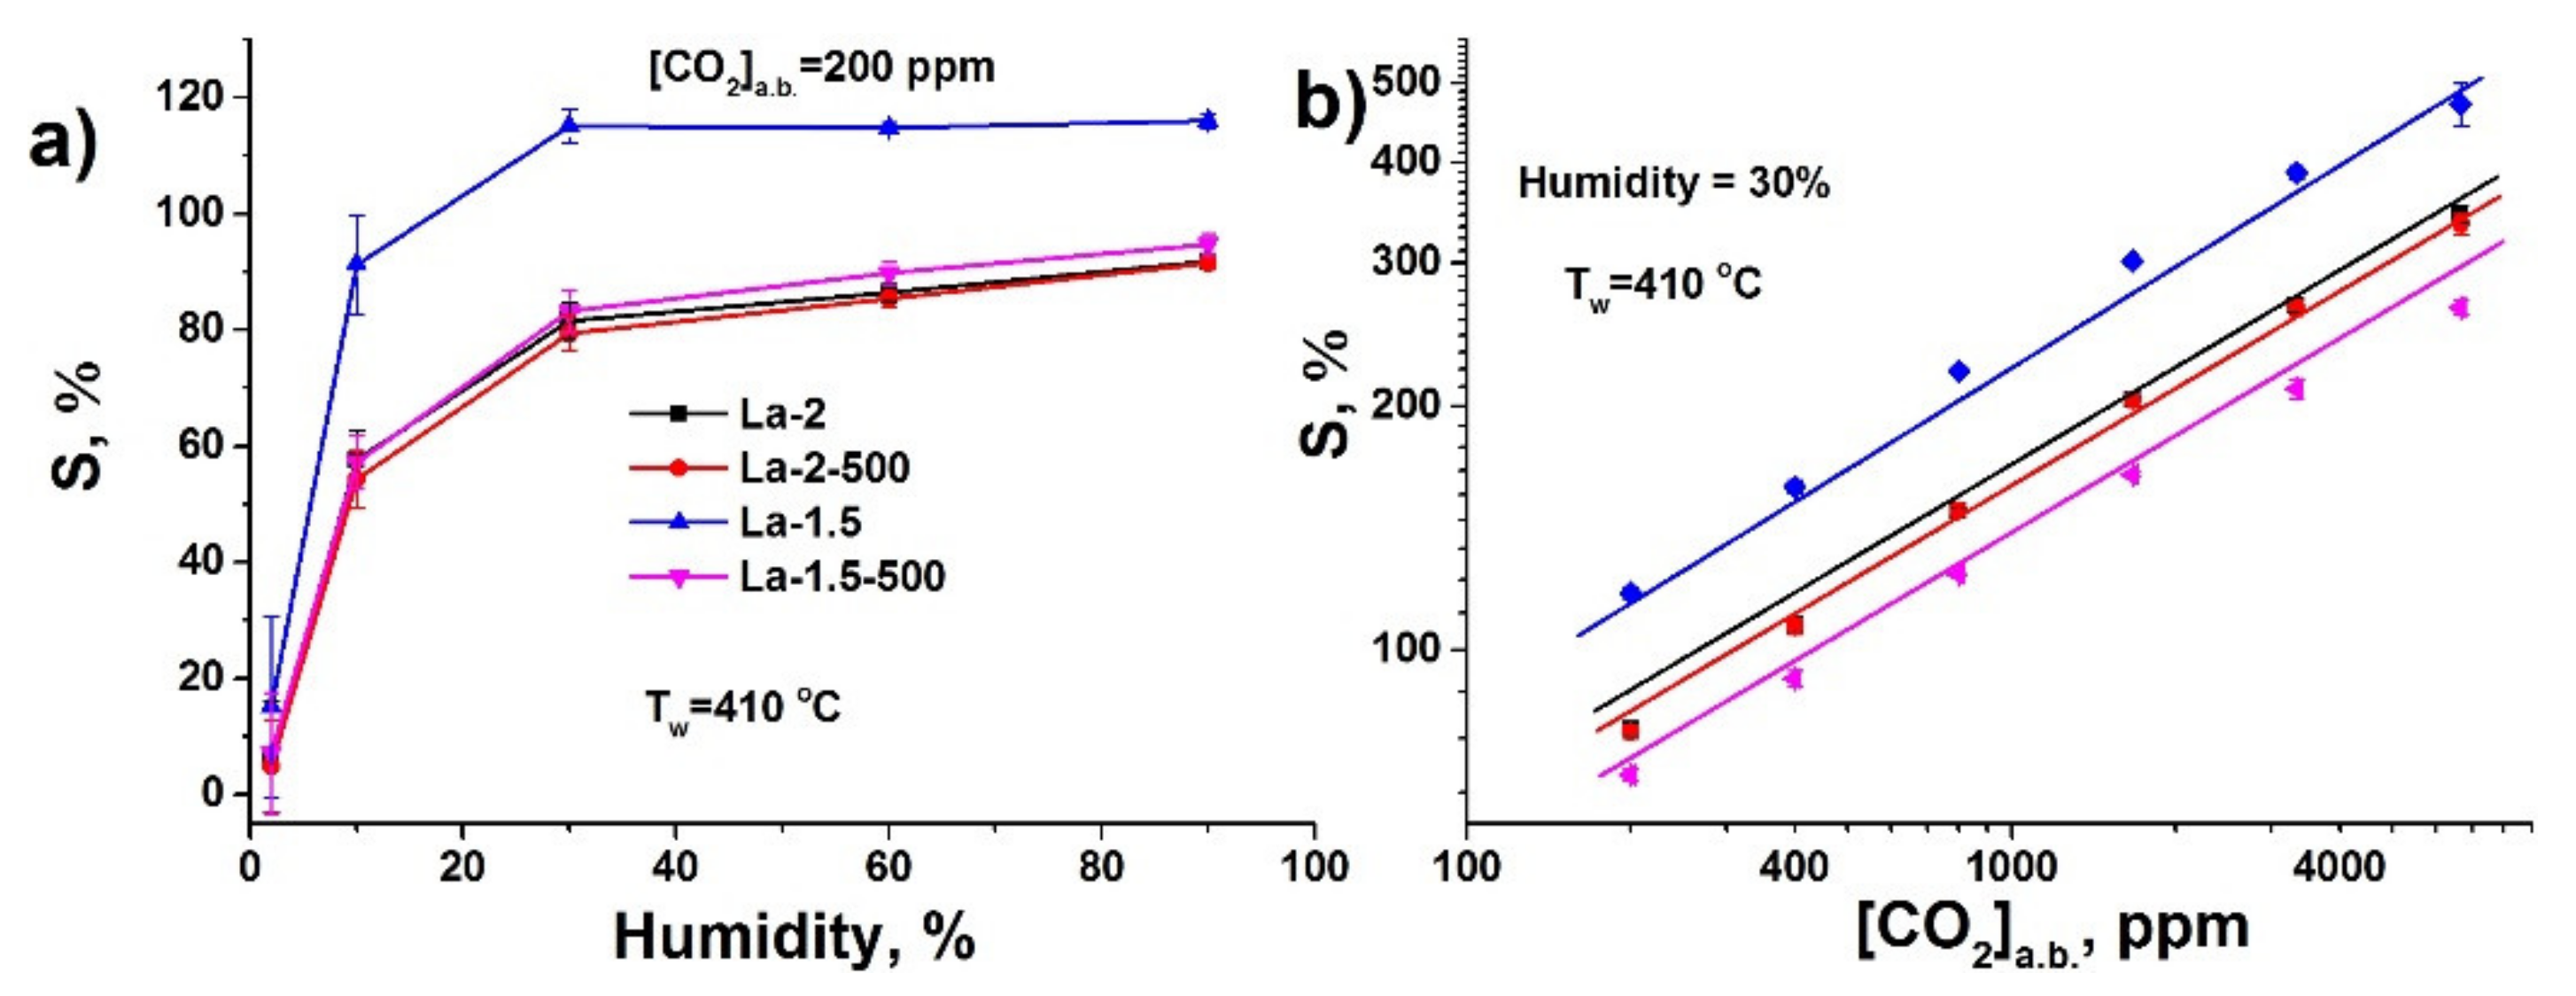
3.2. Gas Sensor Properties
4. Conclusions
Author Contributions
Funding
Institutional Review Board Statement
Informed Consent Statement
Data Availability Statement
Acknowledgments
Conflicts of Interest
References
- Pearson, P.N.; Palmer, M.R. Atmospheric carbon dioxide concentrations over the past 60 million years. Nature 2000, 406, 695–699. [Google Scholar] [CrossRef]
- Rae, J.W.B.; Zhang, Y.G.; Liu, X.Q.; Foster, G.L.; Stoll, H.M.; Whiteford, R.D.M. Atmospheric CO2 over the past 66 million years from marine archives. Annu. Rev. Earth Plant. Sci. 2021, 49, 609–641. [Google Scholar] [CrossRef]
- Tong, D.; Zhang, Q.; Zheng, Y.X.; Caldeira, K.; Shearer, C.; Hong, C.P.; Qin, Y.; Davis, S.J. Committed emissions from existing energy infrastructure jeopardize 1.5 degrees C climate target. Nature 2019, 572, 373–377. [Google Scholar] [CrossRef] [PubMed]
- Pendrill, F.; Persson, U.M.; Godar, J.; Kastner, T.; Moran, D.; Schmidt, S.; Wood, R. Agricultural and forestry trade drives large share of tropical deforestation emissions. Glob. Environ. Chang. 2019, 56, 1–10. [Google Scholar] [CrossRef]
- Mitchell, J.F.B.; Johns, T.C.; Ingram, W.J.; Lowe, J.A. The effect of stabilising atmospheric carbon dioxide concentrations on global and regional climate change. Geophys. Res. Lett. 2000, 27, 2977–2980. [Google Scholar] [CrossRef]
- Fuglestvedt, J.S.; Masson-Delmotte, V.; Zhai, P.; Pirani, A.; Fuglestvedt, J.S.; Masson-Delmotte, V.; Zhai, P.; Pirani, A. Towards the sixth assessment report of the intergovernmental panel on climate change (IPCC). AGUFM 2016, 2016, U14A-02. [Google Scholar]
- IEA. Global Energy Review. 2021. Available online: https://www.iea.org/reports/global-energy-review-2021 (accessed on 21 September 2021).
- IEA. CO2 Emissions-Global Energy Review 2021-Analysis. Available online: https://www.iea.org/reports/global-energy-review-2021/co2-emissions (accessed on 21 September 2021).
- Paris Agreement. Available online: https://unfccc.int/sites/default/files/english_paris_agreement.pdf (accessed on 21 September 2021).
- Statistical Review of World Energy 2020, 69th Edition. Available online: https://www.bp.com/content/dam/bp/business-sites/en/global/corporate/pdfs/energy-economics/statistical-review/bp-stats-review-2020-full-report.pdf (accessed on 21 September 2021).
- Statistical Review of World Energy 2021, 70th Ed. Available online: https://www.bp.com/content/dam/bp/business-sites/en/global/corporate/pdfs/energy-economics/statistical-review/bp-stats-review-2021-full-report.pdf (accessed on 21 September 2021).
- IEA. Net Zero by 2050—A Roadmap for the Global Energy Sector. Available online: https://www.iea.org/reports/net-zero-by-2050 (accessed on 21 September 2021).
- IEA. World Energy Outlook 2020-Analysis. Available online: https://www.iea.org/reports/world-energy-outlook-2020 (accessed on 21 September 2021).
- Carbon Dioxide Emissions Embodied in International Trade—OECD. Available online: https://www.oecd.org/sti/ind/carbondioxideemissionsembodiedininternationaltrade.htm (accessed on 21 September 2021).
- Regulation (Eu) 2021/1119 of the European Parliament and of the Council. Available online: https://eur-lex.europa.eu/legal-content/EN/TXT/?uri=CELEX%3A32021R1119&qid=1632217752018 (accessed on 21 September 2021).
- Bravkov, P.V.; Durdyeva, A.A.; Zhdaneev, O.V.; Zuev, S.S.; Korenev, V.V.; Frolov, K.N.; Chuboksarov, V.S. Technical Policy Issues of the Fuel and Energy Complex of the Russian Federation; Zhdaneev, O.V., Ed.; Nauka: Moscow, Russia, 2020; p. 304. [Google Scholar]
- EIB Project Carbon Footprint Methodologies. Available online: https://www.eib.org/attachments/strategies/eib_project_carbon_footprint_methodologies_en.pdf (accessed on 21 September 2021).
- Greenhouse Gas Assessment Emissions Methodology Publications. Available online: https://publications.iadb.org/publications/english/document/Greenhouse-Gas-Assessment-Emissions-Methodology.pdf (accessed on 21 September 2021).
- IPCC National Greenhouse Gas Inventories Programme. Available online: https://www.ipcc-nggip.iges.or.jp/support/Primer_2006GLs.pdf (accessed on 21 September 2021).
- Antolín, D.; Medrano, N.; Calvo, B.; Pérez, F. A wearable wireless sensor network for indoor smart environment monitoring in safety applications. Sensors 2017, 17, 365. [Google Scholar] [CrossRef]
- Delebarre, C.; Pujolle, T.; Cousin, G.; Domon, A.; Froux, J.; Jourdan, J. Wireless low cost CO2 monitoring system design and evaluation using non dispersive infrared sensor. Wirel. Sens. Netw. 2018, 10, 119–130. [Google Scholar] [CrossRef][Green Version]
- Lohani, D.; Acharya, D. Real time in-vehicle air quality monitoring using mobile sensing. In Proceedings of the 2016 IEEE Annual India Conference (INDICON), Bangalore, India, 16–18 December 2016. [Google Scholar] [CrossRef]
- Jin, M.; Liu, S.; Schiavon, S.; Spanos, C. Automated mobile sensing: Towards high-granularity agile indoor environmental quality monitoring. Build. Environ. 2018, 127, 268–276. [Google Scholar] [CrossRef]
- IEA. Greenhouse Gas Emissions from Energy: Overview-Analysis. Available online: https://www.iea.org/reports/greenhouse-gas-emissions-from-energy-overview (accessed on 21 September 2021).
- Noumonvi, K.D.; Ferlan, M.; Eler, K.; Alberti, G.; Peressotti, A.; Cerasoli, S. Estimation of carbon fluxes from eddy covariance data and satellite-derived vegetation indices in a karst grassland (Podgorski Kras, Slovenia). Remote Sens. 2019, 11, 649. [Google Scholar] [CrossRef]
- Lin, C.; Thomson, G.; Popescu, S.C. An IPCC-compliant technique for forest carbon stock assessment using airborne LiDAR-derived tree metrics and competition index. Remote Sens. 2016, 8, 528. [Google Scholar] [CrossRef]
- Predictors of Measurement Accuracy in the Remote Sensing of CO2 Emissions. Available online: https://www3.epa.gov/ttnchie1/conference/ei20/session7/dwinters.pdf (accessed on 21 September 2021).
- Gautam, Y.K.; Sharma, K.; Tyagi, S.; Ambedkar, A.K.; Chaudhary, M.; Singh, B.P. Nanostructured metal oxide semiconductor-based sensors for greenhouse gas detection: Progress and challenges. R. Soc. Open Sci. 2021, 8, 201324. [Google Scholar] [CrossRef]
- Mallia, D.V.; Mitchell, L.E.; Kunik, L.; Fasoli, B.; Bares, R.; Gurney, K.R.; Mendoza, D.L.; Lin, J.C. Constraining urban CO2 emissions using mobile observations from a light rail public transit platform. Environ. Sci. Technol. 2020, 54, 15613–15621. [Google Scholar] [CrossRef]
- Berman, E.S.F.; Fladeland, M.; Liem, J.; Kolyer, R.; Gupta, M. Greenhouse gas analyzer for measurements of carbon dioxide, methane, and water vapor aboard an unmanned aerial vehicle. Sens. Actuators B 2012, 169, 128–135. [Google Scholar] [CrossRef]
- Zenevich, S.; Gazizov, I.; Churbanov, D.; Plyashkov, Y.; Spiridonov, M.; Talipov, R.; Rodin, A. A concept of 2U spaceborne multichannel heterodyne spectroradiometer for greenhouse gases remote sensing. Remote Sens. 2021, 13, 2235. [Google Scholar] [CrossRef]
- Suzuki, T.; Sackmann, A.; Oprea, A.; Weimar, U.; Barsan, N. Chemoresistive CO2 gas sensors based on La2O2CO3: Sensing mechanism insights provided by operando characterization. ACS Sens. 2020, 5, 2555–2562. [Google Scholar] [CrossRef] [PubMed]
- Collier-Oxandale, A.; Casey, J.G.; Piedrahita, R.; Ortega, J.; Halliday, H.; Johnston, J.; Hannigan, M.P. Assessing a low-cost methane sensor quantification system for use in complex rural and urban environments. Atmos. Meas. Tech. 2018, 11, 3569–3594. [Google Scholar] [CrossRef] [PubMed]
- Smith, K.R.; Edwards, P.M.; Evans, M.J.; Lee, J.D.; Shaw, M.D.; Squires, F.; Wilde, S.; Lewis, A.C. Clustering approaches to improve the performance of low cost air pollution sensors. Faraday Discuss. 2017, 200, 621–637. [Google Scholar] [CrossRef] [PubMed]
- Collier-Oxandale, A.M.; Thorson, J.; Halliday, H.; Milford, J.; Hannigan, M. Understanding the ability of low-cost MOx sensors to quantify ambient VOCs. Atmos. Meas. Tech. 2019, 12, 1441–1460. [Google Scholar] [CrossRef]
- Weissert, L.F.; Alberti, K.; Miskell, G.; Pattinson, W.; Salmond, J.A.; Henshaw, G.; Williams, D.E. Low-cost sensors and microscale land use regression: Data fusion to resolve air quality variations with high spatial and temporal resolution. Atmos. Environ. 2019, 213, 285–295. [Google Scholar] [CrossRef]
- Moltchanov, S.; Levy, I.; Etzion, Y.; Lerner, U.; Broday, D.M.; Fishbain, B. On the feasibility of measuring urban air pollution by wireless distributed sensor networks. Sci. Total Environ. 2015, 502, 537–547. [Google Scholar] [CrossRef] [PubMed]
- Spinelle, L.; Gerboles, M.; Villani, M.G.; Aleixandre, M.; Bonavitacola, F. Field calibration of a cluster of low-cost commercially available sensors for air quality monitoring. Part B: NO, CO and CO2. Sens. Actuators B Chem. 2017, 238, 706–715. [Google Scholar] [CrossRef]
- Spinelle, L.; Gerboles, M.; Villani, M.G.; Aleixandre, M.; Bonavitacola, F. Field calibration of a cluster of low-cost available sensors for air quality monitoring. Part A: Ozone and nitrogen dioxide. Sens. Actuators B Chem. 2015, 215, 249–257. [Google Scholar] [CrossRef]
- Borrego, C.; Ginja, J.; Coutinho, M.; Ribeiro, C.; Karatzas, K.; Sioumis, T.; Katsifarakis, N.; Konstantinidis, K.; De Vito, S.; Esposito, E.; et al. Assessment of air quality microsensors versus reference methods: The EuNetAir joint exercise—part II. Atmos. Environ. 2018, 193, 127–142. [Google Scholar] [CrossRef]
- Borrego, C.; Costa, A.M.; Ginja, J.; Amorim, M.; Coutinho, M.; Karatzas, K.; Sioumis, T.; Katsifarakis, N.; Konstantinidis, K.; De Vito, S.; et al. Assessment of air quality microsensors versus reference methods: The EuNetAir joint exercise. Atmos. Environ. 2016, 147, 246–263. [Google Scholar] [CrossRef]
- Michel, C.R.; Lopez Contreras, N.L.; Martinez Preciado, A.H. CO2 and CO gas sensing properties of nanostructured BiOCl ribbons doped with gold nanoparticles. Sens. Actuators B Chem. 2012, 173, 100–105. [Google Scholar] [CrossRef]
- Deepa, S.; Prasanna Kumari, K.; Thomas, B. Contribution of oxygen-vacancy defect-types in enhanced CO2 sensing of nanoparticulate Zn-doped SnO2 films. Ceram. Int. 2017, 43, 17128–17141. [Google Scholar] [CrossRef]
- Xiong, Y.; Xue, Q.; Ling, C.; Lu, W.; Ding, D.; Zhu, L.; Li, X. Effective CO2 detection based on LaOCl-doped SnO2 nanofibers: Insight into the role of oxygen in carrier gas. Sens. Actuators B Chem. 2017, 241, 725–734. [Google Scholar] [CrossRef]
- Jeong, Y.J.; Balamurugan, C.; Lee, D.W. Enhanced CO2 gas-sensing performance of ZnO nanopowder by la loaded during simple hydrothermal method. Sens. Actuators B Chem. 2016, 229, 288–296. [Google Scholar] [CrossRef]
- Hunge, Y.M.; Yadav, A.A.; Kulkarni, S.B.; Mathe, V.L. A multifunctional ZnO thin film based devises for photoelectrocatalytic degradation of terephthalic acid and CO2 gas sensing applications. Sens. Actuators B Chem. 2018, 274, 1–9. [Google Scholar] [CrossRef]
- Aboud, A.A.; Al-Kelesh, H.; Rouby, W.M.A.E.; Farghali, A.A.; Hamdedein, A.; Khedr, M.H. CO2 responses based on pure and doped CeO2 nanopellets. J. Mater. Res. Technol. 2018, 7, 14–20. [Google Scholar] [CrossRef]
- Colak, H.; Karaköse, E. Synthesis and characterization of different dopant (Ge, Nd, W)-doped ZnO nanorods and their CO2 gas sensing applications. Sens. Actuators B Chem. 2019, 296, 126629. [Google Scholar] [CrossRef]
- Ding, D.; Lu, W.; Xiong, Y.; Pan, X.; Zhang, J.; Ling, C.; Du, Y.; Xue, Q. Facile synthesis of La2O2 CO3 nanoparticle films and its CO2 sensing properties and mechanisms. Appl. Surf. Sci. 2017, 426, 725–733. [Google Scholar] [CrossRef]
- Juang, F.R.; Chen, B.Y. Effect of adding ZHS microcubes on ZnO nanorods for CO2 gas sensing applications. Solid. State. Electron. 2020, 164, 107711. [Google Scholar] [CrossRef]
- Hsu, K.C.; Fang, T.H.; Hsiao, Y.J.; Chan, C.A. Highly response CO2 gas sensor based on AuLa2O3 doped SnO2 nanofibers. Mater. Lett. 2020, 261, 127144. [Google Scholar] [CrossRef]
- Wang, D.; Chen, Y.; Liu, Z.; Li, L.; Shi, C.; Qin, H.; Hu, J. CO2-sensing properties and mechanism of nano-SnO2 thick-film sensor. Sens. Actuators B Chem. 2016, 227, 73–84. [Google Scholar] [CrossRef]
- Kim, M.Y.; Choi, Y.N.; Bae, J.M.; Oh, T.S. Carbon dioxide sensitivity of La-doped thick film tin oxide gas sensor. Ceram. Int. 2012, 38, S657–S660. [Google Scholar] [CrossRef]
- Yadav, A.A.; Lokhande, A.C.; Kim, J.H.; Lokhande, C.D. Highly sensitive CO2 sensor based on microrods-like La2O3 thin film electrode. RSC Adv. 2016, 6, 106074–106080. [Google Scholar] [CrossRef]
- Marsal, A.; Dezanneau, G.; Cornet, A.; Morante, J.R. A new CO2 gas sensing material. Sens. Actuators B Chem. 2003, 95, 266–270. [Google Scholar] [CrossRef]
- Djerdj, I.; Haensch, A.; Koziej, D.; Pokhrel, S.; Barsan, N.; Weimar, U.; Niederberger, M. Neodymium dioxide carbonate as a sensing layer for chemoresistive CO2 sensing. Chem. Mater. 2009, 21, 5375–5381. [Google Scholar] [CrossRef]
- Chen, G.; Han, B.; Deng, S.; Wang, Y.; Wang, Y. Lanthanum dioxide carbonate La2O2CO3 nanorods as a sensing material for chemoresistive CO2 gas sensor. Electrochim. Acta 2014, 127, 355–361. [Google Scholar] [CrossRef]
- Wang, X.; Qin, H.; Sun, L.; Hu, J. CO2 sensing properties and mechanism of nanocrystalline LaFeO3 sensor. Sens. Actuators B Chem. 2013, 188, 965–971. [Google Scholar] [CrossRef]
- Wang, X.; Chen, Y.; Qin, H.; Li, L.; Shi, C.; Liu, L.; Hu, J. CO2 sensing of La0.875Ca0.125FeO3 in wet vapor: A comparison of experimental results and first-principles calculations. Phys. Chem. Chem. Phys. 2015, 17, 13733–13742. [Google Scholar] [CrossRef] [PubMed]
- Diagne, E.H.A.; Lumbreras, M. Elaboration and characterization of tin oxide-lanthanum oxide mixed layers prepared by the electrostatic spray pyrolysis technique. Sens. Actuators B Chem. 2001, 78, 98–105. [Google Scholar] [CrossRef]
- Rudraswamy, S.B.; Bhat, N. Optimization of RF sputtered Ag-doped BaTiO3-CuO mixed oxide thin film as carbon dioxide sensor for environmental pollution monitoring application. IEEE Sens. J. 2016, 16, 5145–5151. [Google Scholar] [CrossRef]
- Zhang, W.; Xie, C.; Zhang, G.; Zhang, J.; Zhang, S.; Zeng, D. Porous LaFeO3/SnO2 nanocomposite film for CO2 detection with high sensitivity. Mater. Chem. Phys. 2017, 186, 228–236. [Google Scholar] [CrossRef]
- Tanvir, N.B.; Yurchenko, O.; Laubender, E.; Pohle, R.; Sicard, O.V.; Urban, G. Zinc peroxide combustion promoter in preparation of CuO layers for conductometric CO2 sensing. Sens. Actuators B Chem. 2018, 257, 1027–1034. [Google Scholar] [CrossRef]
- Marsal, A.; Cornet, A.; Morante, J.R. Study of the CO and humidity interference in La doped tin oxide CO2 gas sensor. Sens. Actuators B Chem. 2003, 94, 324–329. [Google Scholar] [CrossRef]
- Trung, D.D.; Toan, L.D.; Hong, H.S.; Lam, T.D.; Trung, T.; Van Hieu, N. Selective detection of carbon dioxide using LaOCl-functionalized SnO2 nanowires for air-quality monitoring. Talanta 2012, 88, 152–159. [Google Scholar] [CrossRef]
- Van Hieu, N.; Khoang, N.D.; Trung, D.D.; Toan, L.D.; Van Duy, N.; Hoa, N.D. Comparative study on CO2 and CO sensing performance of LaOCl-coated ZnO nanowires. J. Hazard. Mater. 2013, 244, 209–216. [Google Scholar] [CrossRef]
- Xiong, Y.; Zhang, G.; Zhang, S.; Zeng, D.; Xie, C. Tin oxide thick film by doping rare earth for detecting traces of CO2: Operating in oxygenfree atmosphere. Mater. Res. Bull. 2014, 52, 56–64. [Google Scholar] [CrossRef]
- Yadav, A.A.; Lokhande, A.C.; Kim, J.H.; Lokhande, C.D. Improvement in CO2 sensing characteristics using Pd nanoparticles decorated La2O3 thin films. J. Ind. Eng. Chem. 2017, 49, 76–81. [Google Scholar] [CrossRef]
- Suzuki, T.; Sackmann, A.; Lauxmann, F.; Berthold, C.; Weimar, U.; Barsan, N. CO2 sensing with gas sensors based on rare-earth compounds: Material exploration. Sens. Actuators B Chem. 2020, 317, 128128. [Google Scholar] [CrossRef]
- Krivetskiy, V.; Zamanskiy, K.; Beltyukov, A.; Asachenko, A.; Topchiy, M.; Nechaev, M.; Garshev, A.; Krotova, A.; Filatova, D.; Maslakov, K.; et al. Effect of aupd bimetal sensitization on gas sensing performance of nanocrystalline sno2 obtained by single step flame spray pyrolysis. Nanomaterials 2019, 9, 728. [Google Scholar] [CrossRef] [PubMed]
- Levan, T.; Che, M.; Tatibouet, J.M.; Kermarec, M. Infrared study of the formation and stability of La2O2CO3 during the oxidative coupling of methane on La2O3. J. Catal. 1993, 142, 18–26. [Google Scholar] [CrossRef]
- Jeevanandam, P.; Koltypin, Y.; Palchik, O.; Gedanken, A. Synthesis of morphologically controlled lanthanum carbonate particles using ultrasound irradiation. J. Mater. Chem. 2001, 11, 869–873. [Google Scholar] [CrossRef]
- Yamazoe, N.; Shimanoe, K. Theory of power laws for semiconductor gas sensors. Sens. Actuators B Chem. 2008, 128, 566–573. [Google Scholar] [CrossRef]
- Yang, L.; Marikutsa, A.; Rumyantseva, M.; Konstantinova, E.; Khmelevsky, N.; Gaskov, A. Quasi similar routes of NO2 and NO sensing by nanocrystalline WO3: Evidence by in situ drift spectroscopy. Sensors 2019, 19, 3405. [Google Scholar] [CrossRef] [PubMed]


| Material | Synthesis Method | C (CO2), ppm | Operating Temperature, °C | Response 1 | Ref. |
|---|---|---|---|---|---|
| BiOCl-Au | Surfactant assisted | 400 | 300 | 63 | [42] |
| ZnO-SnO2 | Spray pyrolysis | 500 | 300 | 90 | [43] |
| LaOCl-SnO2 | Electrospinning | 1000 | 300 | 270 | [44] |
| La2O3-ZnO | Hydrothermal | 5000 | 400 | 65 | [45] |
| ZnO | Spray pyrolysis | 400 | 350 | 64 | [46] |
| CdO-CeO2 | Co-precipitation | 800 | 250 | 45 | [47] |
| WO3-ZnO | Mechanochemical | 1000 | 450 | 65 | [48] |
| La2O2CO3 | Hydrothermal | 5000 | 300 | 62 | [49] |
| ZnO-SnO2 | Hydrothermal | 1000 | 150 | 350 | [50] |
| La2O3-SnO2-Au | Electrospinning | 100 | 300 | 10 | [51] |
| SnO2 | Co-precipitation | 2000 | 240 | 30 | [52] |
| SnO2 | Mechanochemical | 1000 | 400 | 10 | [53] |
| La2O3 | Chemical bath | 350 | 250 | 55 | [54] |
| LaOCl | Sol-gel | 2000 | 260 | 240 | [55] |
| NdO2CO3 | Sol-gel | 1000 | 350 | 300 | [56] |
| La2O3CO3 | Co-precipitation | 3000 | 325 | 600 | [57] |
| LaFeO3 | Sol-gel | 2000 | 300 | 120 | [58] |
| LaCaFeO3 | Sol-gel | 1000 | 320 | 70 | [59] |
| LaOCl-SnO2 | Electrostatic spray pyrolysis | 2000 | 425 | 40 | [60] |
| CuO-BaTiO3 | Magnetron sputtering | 1000 | 250 | 80 | [61] |
| LaFeO3-SnO2 | Mixing | 4000 | 250 | 170 | [62] |
| ZnO-CuO | Mixing | 4000 | 300 | 30 | [63] |
| SnO2-LaOCl | Impregnation | 2000 | 350 | 150 | [64] |
| SnO2-LaOCl | Drop-coating | 4000 | 400 | 580 | [65] |
| ZnO-LaOCl | Drop-coating | 2000 | 400 | 250 | [66] |
| SnO2-La2O3 | Impregnation | 500 | 250 | 30 | [67] |
| La2O3-Pd | Dipping | 500 | 250 | 40 | [68] |
| La2O2CO3 | Thermal decomposition | 500 | 300 | 700 | [69] |
| Material | O2 Flow, L/min | Post-Synthetic Annealing | Ssurf, m2/g | Phase Composition, XRD | I3610/I1483, FTIR |
|---|---|---|---|---|---|
| La-2 | 2 | -- | 42 | La2O3 | 1.05 |
| La-2-500 | 2 | 500 °C, 24 h | 31 | La2O3, La(OH)3 | 2.12 |
| La-1.5 | 1.5 | -- | 27 | La2O3 | 0.56 |
| La-1.5-500 | 1.5 | 500 °C, 24 h | 27 | La2O3, La(OH)3, LaO(OH) | 5.12 |
Publisher’s Note: MDPI stays neutral with regard to jurisdictional claims in published maps and institutional affiliations. |
© 2021 by the authors. Licensee MDPI, Basel, Switzerland. This article is an open access article distributed under the terms and conditions of the Creative Commons Attribution (CC BY) license (https://creativecommons.org/licenses/by/4.0/).
Share and Cite
Andreev, M.; Platonov, V.; Filatova, D.; Galitskaya, E.; Polomoshnov, S.; Generalov, S.; Nikolaeva, A.; Amelichev, V.; Zhdaneev, O.; Krivetskiy, V.; et al. Flame-Made La2O3-Based Nanocomposite CO2 Sensors as Perspective Part of GHG Monitoring System. Sensors 2021, 21, 7297. https://doi.org/10.3390/s21217297
Andreev M, Platonov V, Filatova D, Galitskaya E, Polomoshnov S, Generalov S, Nikolaeva A, Amelichev V, Zhdaneev O, Krivetskiy V, et al. Flame-Made La2O3-Based Nanocomposite CO2 Sensors as Perspective Part of GHG Monitoring System. Sensors. 2021; 21(21):7297. https://doi.org/10.3390/s21217297
Chicago/Turabian StyleAndreev, Matvey, Vadim Platonov, Darya Filatova, Elena Galitskaya, Sergey Polomoshnov, Sergey Generalov, Anastasiya Nikolaeva, Vladimir Amelichev, Oleg Zhdaneev, Valeriy Krivetskiy, and et al. 2021. "Flame-Made La2O3-Based Nanocomposite CO2 Sensors as Perspective Part of GHG Monitoring System" Sensors 21, no. 21: 7297. https://doi.org/10.3390/s21217297
APA StyleAndreev, M., Platonov, V., Filatova, D., Galitskaya, E., Polomoshnov, S., Generalov, S., Nikolaeva, A., Amelichev, V., Zhdaneev, O., Krivetskiy, V., & Rumyantseva, M. (2021). Flame-Made La2O3-Based Nanocomposite CO2 Sensors as Perspective Part of GHG Monitoring System. Sensors, 21(21), 7297. https://doi.org/10.3390/s21217297