Abstract
The global and regional land use/cover changes (LUCCs) are experiencing widespread changes, particularly in Baghdad City, the oldest city of Iraq, where it lacks ecological restoration and environmental management actions at present. To date, multiple land uses are experiencing urban construction-related land expansion, population increase, and socioeconomic development. Comprehensive evaluation and understanding of the effect of urban sprawl and its rapid LUCC are of great importance to managing land surface resources for sustainable development. The present research applied remote sensing data, such as Landsat-5 Thematic Mapper and Landsat-8 Operation Land Imager, on selected images between July and August from 1985 to 2020 with the use of multiple types of software to explore, classify, and analyze the historical and future LUCCs in Baghdad City. Three historical LUCC maps from 1985, 2000, and 2020 were created and analyzed. The result shows that urban construction land expands quickly, and agricultural land and natural vegetation have had a large loss of coverage during the last 35 years. The change analysis derived from previous land use was used as a change direction for future simulation, where natural and anthropogenic factors were selected as the drivers’ variables in the process of multilayer perceptron neural network Markov chain model. The future land use/cover change (FLUCC) modeling results from 2030 to 2050 show that agriculture is the only land use type with a massive decreasing trend from 1985 to 2050 compared with other categories. The entire change in urban sprawl derived from historical and FLUCC in each period shows that urban construction land increases the fastest between 2020 and 2030. The rapid urbanization along with unplanned urban growth and rising population migration from rural to urban is the main driver of all transformation in land use. These findings facilitate sustainable ecological development in Baghdad City and theoretically support environmental decision making.
1. Introduction
Human socioeconomic development activity is the connection between human population increase and residential expansion, and the general tendency of global urbanization is the source of excessive remarkable variations in the urban land, intimidating the land use/cover change (LUCC) sustainability of a regional area [1,2,3]. Approximately 60% of the world’s city population will increase by 2050, as predicted by the United Nations [4,5,6,7]. To date, urban population growth has immensely impacted the entire world, leading to huge changes in land use/cover, which has become a major concern in natural resource management and sustainable development in large cities [8]. Many land surfaces are being transformed and substituted into urban construction land for residential and other human demands [9]. LUCC is defined as the land adaptation from its original use into another land use type in the same area due to the complex association between human activity and environmental physiology, which is the main key effect of regional and global environments [10,11]. These variations straightly contradict the principle of sustainability by leading to several negative impacts, such as fragmentation of the agroforest landscape, landscape degradation, impact to the land surface, increase in energy consumption and emission of greenhouse gases, loss of biodiversity, soil resource degradation, and climate change on the regional and global scales [12,13]. Therefore, the effective use of land resources is crucial for future sustainability development from ecological and socioeconomic aspects [14]. From the problems existing in urbanization and to understand comprehensively the process of LUCC in the upcoming years, this research focuses on identifying the factors responsible for these changes in modeling future LUCC (FLUCC) [15,16]. Currently, the combination of remote sensing (RS) data and geographic information system (GIS) tools offers a new valuable perspective for monitoring LUCC [17]. Technology has widely influenced broader environmental monitoring [18]. Numerous models have been developed to simulate FLUCC. These models enable the provision of suitable tools for identifying the spatial patterns in land use/land cover (LULC) [19]. These models, including analytical equation-based models, statistical models, evolutionary models, cellular models, Markov models, hybrid models, expert system models, and multi agent models, analyze the causes and significant transformation of LUCC [20,21]. This study applied the Markov chain model (MCM), which is widely used at present by scientific communities and can offer a convenient approach to the spatiotemporal dynamic change simulation of LULC in complex systems [22,23]. The MCM is considered a change detection technique that can be used to predict future changes in land use in a specific area on the basis of the rates of change in past land use. This method is based on the probability that a given piece of land will change from one mutual land use to another [24]. The model is a comprehensive modeling system that enables processing in multiple layers of data integration, such as geospatial and RS data and socioeconomic data [25]. The present research used a multilayer perceptron neural network (MLPNN) to obtain the directional potential change in machine learning for supporting the MCM. Neural networks often involve forecasting lumpy demand. It is characterized by periods of no demand and periods of high volatility in demand. Traditional time-series methods may not be able to capture nonlinear patterns in the data. NN modeling is a good alternative to overcome these limitations. Neural networks can be applied to time series modeling regardless of model priority function model [26]. Several neural network techniques such as Multilayer NN, Recurrent NN, Time delay NN and Nonlinear Autoregressive eXogenous NN have been proposed, validated, and successfully applied to time-series prediction and causal prediction. Multilayer NN is the most common NN used in causal forecasting; the flow of information is from the input layer to the output layer [27]. Recurrent NN is basically a Feedforward NN with iteration. Therefore, the output signal is fed back to the input [28]. Delay NN includes a delay line [29]. Nonlinear Autoregressive exogenous NN is a combination of all of the above NNs [30]. Iit has been successfully used in time series and causal forecasting. The following research uses NN to forecast spare parts demand with satisfactory results. Gutierrez et al. [31] adopt the most widely used method. It has been suggested that Multi-Layered Perceptron (MLP, a specific case of FFNN) obtained a better outcome than the others used because it is trained by the algorithm. Back-Propagation (BP) uses three layers of MLP: the input layer for the input variables, a hidden layer containing three neurons, and an output layer with only one neuron. Numerous global studies have effectively adopted the Markov model to analyze the future change in land use in different study sites and various purposes. Dey et al. [32] used MCM to predict the LUL+CC in Rajshahi City, Bangladesh. Guan et al. [33] utilized the MCM to analyze the land use change and landscape ecology in Kitakyushu. Kumar et al. [34] focused on modeling land use change by using MCM and RS in Tiruchirappalli City. Khawaldah [24] predicted the LULC in Amman by using GIS and MCM. Liping et al. [35] monitored and predicted the LULC by using RS and GIS techniques in the hilly area of Jiangle, China. Faichia et al. [3] predicted the LUCC in Vientiane on the basis of CA-Markov and RS-GIS technologies. Cao et al. [31] analyzed the spatial pattern change in urban land use change in the Mekong subregion. Cao et al. [32] studied the urban expansion and its impact on the LU pattern in Xishuangbanna. Although numerous studies have evaluated and predicted the LULCC worldwide, few studies have focused on environments in Baghdad, Iraq. Most studies only explored previous to present LULC, and no study focused on the future urban land use and its future environment sustainability [24,36,37]. Mohamedmeki et al. [38] focused on multiple land use approaches toward sustainable development in Baghdad City in 2017. Qassim et al. [39] explored the LULC from 1986 to 2019. Al-Ramahi et al. [40] studied the spatial pattern of radon gas concentration distributed in Baghdad City by using RS and GIS. Hamdy et al. [41] mapped the land cover change in Al- Karkh, Baghdad.
In this research, we identified and examined the causes of LUCC, processes, and consequences, and emphasized the urban construction to ensure better human livelihood and environmentally sustainable development in the region. Baghdad is the capital of Iraq, is one of the oldest cities at more than 1000 years old, and is the center of socioeconomic and political development. Currently, it is the most developed city in the country [38]. The city has faced a fast human population increase since 1950 with a relatively high rate of urban sprawl, mainly due to its rural-urban and external and internal migration as the main sources [42]. The Iraqis internationally migrated during the war from 1990 to 2003, and history has recorded that the major fleeing of Iraqis has formed a network of immigrants following the formation of immigrant communities in Europe and North America [43]. The instability in Iraq is not the only result of recent events. The current instability in Iraq is rooted in brutal regime and has intensified over the past several decades [44]. The annual numbers of Iraqi immigrants arriving in European countries increased from 8140 in 1990 to 52,500 in 2001. The UN refugee agency reported that most of these immigrants are refugees and asylum seekers. In 2001, 530,000 of the world’s 12 million refugees were from Iraq. In 1992, the number of refugees in Iraq was 1,343,800, steadily dropping to approximately 700,000 in the mid-1990s and further to 500,000 in the 2000s [43]. Internal migration in Iraq has an increasing and decreasing trend, as shown in the history conflict record of the Baghdad war from 2007 to 2011, with a total of 5 million members of the Baghdad population moving. At least 126,000 refugees left Baghdad for other countries, and 366,000 left Baghdad for the northwest part of Iraq. However, 228,000 and 66,000 refugees returned to Baghdad City, and the other 50,000 families moved within Baghdad City [45]. With the political issues, the city lacks development plans, and the accumulation of decades of wars and corruption increases the problems of the city, such as independent urbanization and population increasing trends [38]. Baghdad is an environmentally fragile area due to its small coverage of natural trees and because LUCC might have a large impact on environmental ecosystems [46]. All of these difficulties have harmfully impacted the regional environment; thus, Baghdad City needs a sustainable development plan for standard living [38,41].
Understanding the urban construction land (CL) increase and regional land use destruction is important and can be achieved by observing Baghdad’s population growth. Therefore, this study aims to monitor and analyze the historical changes in LUCC dynamics from 1985 to 2020 and model the FLUCC of 2030, 2040, and 2050. The research also aims to analyze the previous directional change in urban CL and future changes in the same time period. The FLUCC modeling is performed by adapting natural and anthropogenic factors to analyze its changes on the basis of using MLPNN in MCM [3]. The study helps to develop and implement several short and long-term development plans for Baghdad City and the surrounding areas [46]. These simulated spatial complex variations in LUCC can benefit the urban planners and land use policymakers to design a properly sustainable solution for the Baghdad City urbanization by comprehensively understanding the present scenario to possible future expansion possibilities and environmental safety [47].
2. Materials and Methods
2.1. Study Area
Baghdad City, which is the capital of Iraq, is selected as the study area. This city has the Tigris River flowing from north to south through the center of Baghdad and 12 suburban districts. Khalis, Baqubah, and Al Wajihiya are located in the northeast part, and Dejail is located in the northwest. Tarmiyah, Hosseinia, and Taji are located close to Baghdad City on the north side, and Abu Ghraib and Jisr Diyala are located close to Baghdad to the southwest and east. Mahmudiyah and Madain are located in the south and southeast parts, respectively. The other two districts, namely Ad Dulaimiya and Al Falluja, are located in the west part of Baghdad City, as shown in Figure 1.
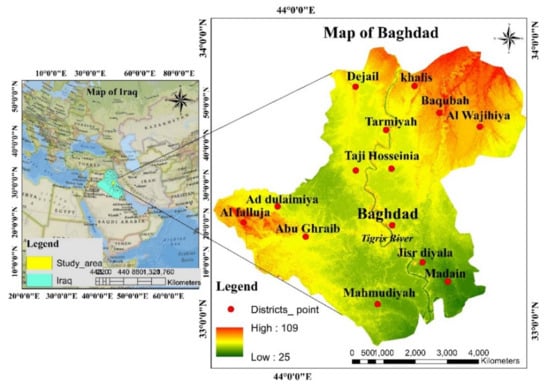
Figure 1.
Location of the study area of Baghdad; Location of Iraq and the map of the study area highlights in the left panel. The right panel shows the Digital Elevation Model (in meters) with important district location points highlights in red dots.
Six neighboring countries, such as Saudi Arabia, Jordan, Syria, Turkey, Iran, and Kuwait are located in the surroundings of Iraq. The city area of Baghdad has a large population density, is covered with various types of land use, and is the most developed city in history, presently, and in the future. The study area is located between 33°19′ and 33°32′ N latitude and 44°24′ and 44.40°E longitude, which covers a total area of 7669.69 km2;. It comes after Tehran as the second largest city in the west part of Asia and after Cairo as the largest Arabic city [38,40]. The elevation and slope in the study area vary from 25 m to 109 m, with an average altitude above the mean sea level and an average slope of 0° to 89.89°.
Baghdad is the most populous place in Iraq. Most people live in the capital. The name of the city literally means “City of Peace” and it was the center of the Islamic empire during the Abbasid dynasty, which was plundered by the Mongols from 762 AD to 1258 AD [48]. Baghdad’s population increased extremely fast during the 70 years from 1950 to 2020. The population was only 579,167 in 1950 and continuously increased to 3,606,844 in 1985. In 2020, its population grew exponentially and reached 7,144,260 [49], as shown in Figure 2.
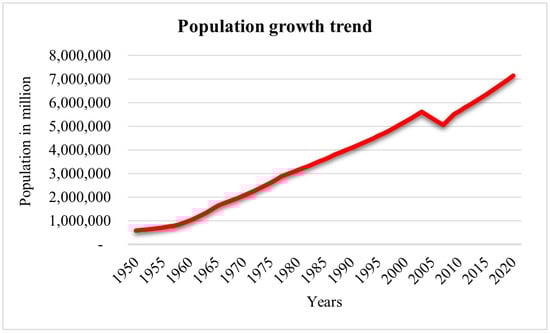
Figure 2.
Baghdad population growth trend from 1950 to 2020.
Baghdad, Iraq has four seasons in a year. The spring season starts from March to May, summer starts from June to August, Autumn begins from September to November, and winter starts from December to February [50]. Baghdad’s climate is subtropical, with extremely hot summer temperatures and slightly cold temperatures in winter [51]. The mean high and low temperatures are in the hot season from May to September with average daily high temperature above 38.89 °C. The hottest month of the year is July, with an average high of 44.44 °C and low of 28.33 °C. The cool season is from November to March, with an average daily high temperature below 21.67 °C. The coldest month of the year is January, with an average low of 5 °C and high of 16.11 °C.
The study area is free from earthquake occurrences, but its adjoining cities and the eastern part of Iraq are prone to earthquakes, as observed from the United States Geological Survey (USGS) earthquake data list during 1985–2020 (Figure 3).
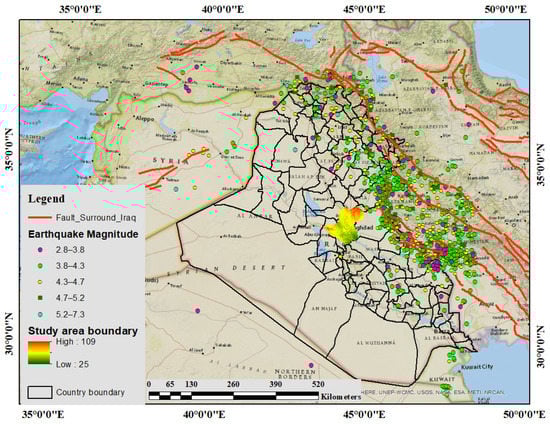
Figure 3.
Number of earthquakes that occurred surrounding the study area from 1985 to 2020. (Note: Fault lines surrounding Iraq representing in red line).
2.2. Data Sources
The vector data sources (shapefile) of Iraq, which included polygons of governorates, information, and locations in the shapefiles with scale 1: 10,000,000 were derived from the Iraqi Ministry of Education [52]. The shapefile of Baghdad city and its 12 suburban districts was obtained from Google Earth Pro (GEP) (scale 1:750,000) [53]. The earthquake data points with Mw 4.5 and above for the time period of 1985–2020 was downloaded from the USGS earthquake data list archives (https://earthquake.usgs.gov/earthquakes/search/) to check the seismicity status in the study area. The fault line shapefile data was downloaded from the EDX National Energy Technology Laboratory (NETL’s) Energy Data eXchange Archives (https://edx.netl.doe.gov/group/fault-data-resources).
This study selected two images from Landsat-5 Thematic Mapper (TM) and one image from Landsat-8 Operation Land Imager (OLI) sensors with special consideration to cloud cover less than 5%, seasonality, and phenological effects [54]. The spectral resolution of 30 m × 30 m [55] and the other details are shown in Table 1. The GEP with 15 m resolution was used to correct the position in land use classification. The GEP was processed by connecting with ERDAS Imagine. The software allowed us to attain the right position in window by comparison between Landsat images and GEP [53]. The road network data are a crucial factor obtained from Open Street Map, which is handled by QGIS and used as a driver for FLUCC simulation in the MCM.

Table 1.
RS data for LUCC classification.
2.3. Methodology
2.3.1. Image Processing, Software, and Data Analysis Method
Temporal and spatial changes and geometric changes must be compatible with the information from other sources to ensure the classification accuracy [56]. Many studies have used different preprocessing techniques based on ArcGIS, ENVI, ERDAS, QGIS, and other relative software that can handle land use change classification. This research applied a preprocessing technique by using ArcGIS 10.8, ERDAS Imagine 2015, QGIS, and TerrSet software 18.31. The ArcGIS’s main workflow was processed on the basis of RS data considering the WGS_1984_UTM_Zone_38N coordinate system, which included layer stacking, mosaicking, subsetting or clipping, creating maps, and area calculation. The combined processing included supervised and unsupervised classification methods by using ERDAS Imagine 2015 [49], with the most commonly used method in supervised classification, such as maximum likelihood algorithm, based on remotely sensed data [57]. Their details are shown in Figure 4. QGIS was used for road data extraction from Open Street Map, which is the necessary data for future modeling. The FLUCC simulation was performed by using MLPNN machine learning (MLP−NNML) in TerrSet Clark lab software [58]. The input RS interpreted data and dependent variables were used in TerrSet software for final processing.
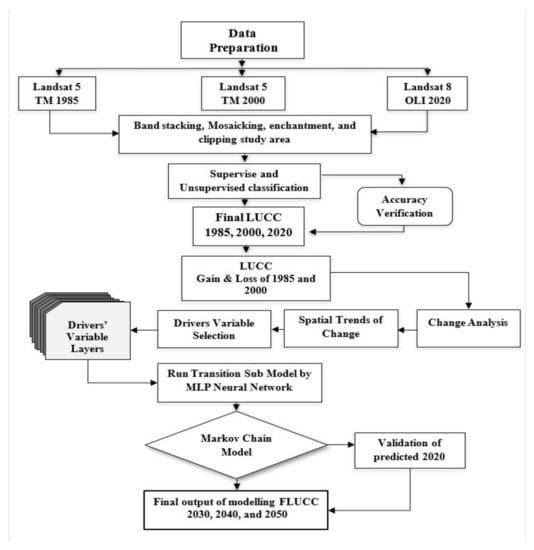
Figure 4.
Flowchart of historical LUCC classification and future modeling framework.
2.3.2. Accuracy Assessment and Validation
Accuracy assessment was implemented after the LUCC classification. The accuracy and the kappa index and overall accuracy were assessed and evaluated by using error matrices in ArcGIS 10.8 software [59]. If the accuracy of each class and image analysis is over 85%, then they are considered suitable for LUCC prediction [59]. The well-known algorithm of kappa coefficient (Kc) for the LUCC classification accuracy assessment [60] is shown in Equation (1).
where Kc is the kappa coefficient, N denotes the total number of sites in the matrix, r represents the number of rows in the matrix, is the number in rows i and columns i, is the total for row i, and is the total for the column.
A significant prerequisite in the land use type classification, detection, and simulation of the LULCC study is model validation of the classification [61]. The kappa statistic is a general measurement used for calculating the land use processed by the accuracy of the models [62]. The value of the kappa coefficient shows the accuracy of the land use/cover classification value between −1 to +1 [63]. A kappa coefficient of <0 denotes rejected of agreement, 0–0.41 denotes slight agreement, 0.41–0.60 denotes medium agreement, 0.60–0.80 denotes considerable agreement, and 0.81–1.0 denotes high agreement [64].
For the RS classification and analysis of Landsat-5 TM and Landsat-8 OLI images derived from 1985, 2000, and 2020, 108 points were selected for each LUCC class to evaluate the classification accuracy by manual checking from ground truth data, and GEP was considered for corrected visual interpretation [35]. The overall accuracy of the classification for the above-mentioned years is shown in Table 2.
Table 2.
Results of LUCC classification accuracy from 1985 to 2000.
2.3.3. Spatial Directional Change of Urban Sprawl
Urban sprawl directional mapping is a detailed microscale approach used to survey the spatiotemporal change dynamics in CL patterns. It is processed after deriving the LUCC classification result. The urban CL in six concentrated rings was drawn from the city center to cover the boundary of the study area [65]. This study created a concentric buffer zone structure of Baghdad City in ArcGIS 10.8 platform to analyze the different directions of city expansion by drawing 16 directions to evaluate the expanding rays of the study area [66]. An equal interval of 22.5° between the four main directions, such as north, south, east, and west with the distance of 20 km2, where each interval ring was considered. The area of the new urban CL expansion in each buffer unit was extracted at all monitoring stages [67].
2.3.4. FLUCC Modeling
The FLUCC was implemented on the basis of Land Change Modeler (LCM) in geospatial monitoring and modeling systems, namely, Clark Labs TerrSet software version 18.31. The earlier and later data of LU 1985 and 2000, road basic network, and digital elevation model (DEM) were first inputted in the MLP session parameters, followed by the change analysis of gain and loss and spatial trend of change [68]. The transition potential (TP) window was processed by selecting the major land use transition into urban CL, testing the influences of each dependent and independent driver variable, and running the potential transition by using the MLP-NNML window. The final steps were processed on the basis of the MCM in the change prediction window. The possible land use modeling depended on validation of the predicted and actual land use change comparison and the kappa value of the system [69]. The detail of the modeling approach is shown in the flowchart of Figure 4.
2.3.5. MLPNN-MCM
In this study, the MLPNN method was used to model the transition potential by using a backpropagation (BP) learning algorithm for modeling high nonlinear functions [70]. A normal MLPNN contains one input layer, one or more hidden layers, and one output layer for the modeling framework of FLUCC [71], as shown in Figure 4. One hidden layer is normally acceptable for most studies for processing the transition submodels. The training process used the samples taken from pixels that went through the transition being modeled or pixels from determination classes [72,73]. For the PT model, 50% of the samples were used for validation, and another 50% of the samples were used for training [73]. The MLP in LCM is started with a computerized training mode and can examine and adapt the start and end learning rates by using the sample training data [73]. Except for the number of hidden layer nodes, all parameters are assigned with default values. The default hidden layer node is used when running the submodel for the first time. More tests are conducted. If the total accuracy and skill score increase, then the value will be doubled, otherwise, the last value will be selected [74]. Running MLP provides total accuracy and skill measurement scores for the report [75]. The equation of measure model skills is shown in Equations (2) and (3).
where E(A) denotes as the expected accuracy, and A represents the measured accuracy. The expected accuracy (E[A]) is derived as follows:
where T represents the number of transitions in the submodel, and P represents the number of persistence classes in the submodel.
The MCM has been used in numerous studies of FLUCC simulation [76]. It can model the changing likelihood trends from the early images to the last images to classify the transition tendency of the FLUCC probability regarding the specific years [3]. The MCM is summarized as a set of state . In this study, the recent state is and transforms to state in the next stage, with the likelihood indicated by transition probabilities [77]. Therefore, state in the system can be identified by former stage in the Markov chain, as shown in Equations (4) and (5).
where is the kappa coefficient for no information, denotes the kappa coefficient of location, refers to the kappa standard, the no information is N(n), M(m) is the medium grid cell-level information, and P(p) is the perfect grid cell-level information across the landscape.
The kappa coefficient for LU 2020, which is processed for validation with the actual LU 2020, is shown in Table 3. The LU predicted for 2020 is well processed and obtains a relatively high kappa coefficient for quantity and location [35]. The validation target, the kappa index of agreement (KIA) is acceptable to continue FLUCC simulation. The kappa statistics are shown in Table 3.
Table 3.
Kappa coefficient (index of agreement) of LUCC predicted for 2020.
2.3.6. Determinants of Driving Factors for MCM
Multiple influencing driving factors have been used as drivers in the LUCC derived from natural and anthropogenic activities in this study. The driving factors have two types of variables: namely, dependent variables and independent variables. DEM, slope, road network, distance from the road, distance from urban, distance from the river, and population density were the dependent variables. Four independent variables, namely change from bare land (BL) to CL, change from WB to CL, change from AL to CL, and all LUCC to CL, were considered as driving factors derived from the LCM. These driving factors are available in the Appendix A, as shown in Figure A1(a–l).
2.3.7. Transition Probability Modeling of LUCC
The LUCC-based TP is derived by processing dependent and independent variables in a run transition submodel by using MLPNN on Terrset Clark lab software. The simulation results show that the TP simulated on the area conversion in AL is the largest, followed by NV, WB, and BL. The transition direction of AL is mostly located in the northeast to the northwest and in the middle east part between Al Wajihiya, Dejail, Baqubah, and Tarmiyab. The distribution of natural vegetation TP is located in the middle of the study area along the Tigris River, and another TP of WB and BL presents a small conversion size in the middle and middle east of the area, as shown in Figure A2(a–d).
3. Results
3.1. Spatial and Temporal Variation Trend Analysis of LUCC from 1995 to 2020
The rapid population growth in the city, the movement of population from rural to urban areas, the conversion of suburban areas into urban areas, the deficiency evaluation of ecological services, ignorance, biophysical limitations, and the use of ecologically mismatched technologies are the key causes behind LULCC [21]. Baghdad is the metropolitan and most developed city of Iraq. An area of 7669.69 km2 was taken in this study. The LUCCs between 1985, 2000, and 2020 were analyzed by using supervised and unsupervised classification techniques. The area of each LUCC type was compared, and strong evidence of changing landscape patterns throughout the last three decades was found in Baghdad, as shown in Figure 5. The statistics of LUCC area distribution (area in km2) and net changes (km2) from 1985 to 2020 are shown in Table 4 and Figure 6.
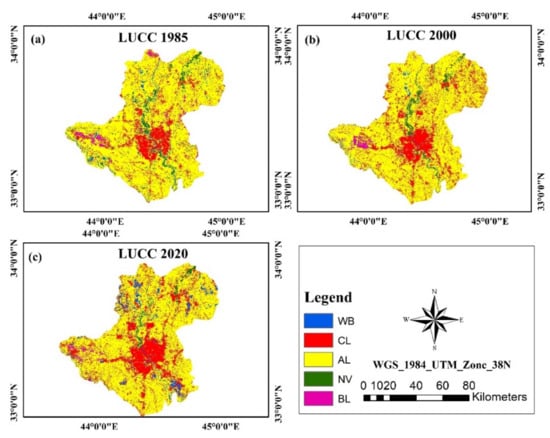
Figure 5.
LUCC classification from 1985 to 2020. (a) LUCC 1985, (b) LUCC 2000, (c) LUCC 2020.
Table 4.
Statistic of LULC area distribution (area in km2) and net changes (km2) from 1985 to 2020.
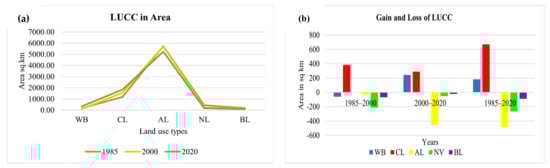
Figure 6.
LUCC change and gain and loss estimation of the study area under different time periods; (a) LUCC in area (km2) of 1985, 2000, 2020; (b) gain and loss over different periods between 1985–2000, 2000–2020, and 1985–2020. (Note: WB—Water bodies, CL—Construction land, AL—Agricultural land, NV—Natural vegetation, BL—Bare land).
In accordance with the LUCC analysis, AL covers the largest area accounting for 5737.45 km2, urban CL is the second largest, which covered 1183.66 km2, and the smallest one is WB accounting for 167 km2 in 1985. With the fastest increase in Baghdad’s population between 1950 to 2020 from 579,167 to 7,144,260 (Figure 2) [49], the highest rate of increase is found between 1958 to 1965, and the population increase rate reached from 8.14% to 9.66%. The decreasing rate of the Baghdad population is between 2004 and 2007 from −2.59% to −2.60%. The population has a high-speed increasing rate, continuously increases, and reached 3,537,416 in 2020. With this rapid population growth, Baghdad has witnessed a large change in its environment and loss of natural resources from urbanization. Many of the AL areas have slightly disappeared over the area with a decreased coverage from 5737.45, 5703.28, and 5247.99 in 1985, 2000, and 2020, respectively (Table 4). The urban CL has a rapid growth from 1183.66 km2 coverage to 1564.31 and 1852.75 km2, with another land use showing a decreased trend. NV experienced a large loss in coverage from 434.06 km2 into 2220.14 km2 and slightly changed to 167.72 km2, and BL continuously decreased from 176.82, 109.51, and 86.44 km2 in 1985, 2000, and 2020, respectively, as shown in Figure 6a. This condition is caused by extensive human demand in land use for residential referred to as BL and other uses. The WB shows an increasing trend, which is the main key because it is the basic human need, especially in food and economics. The fishpond is found over the north and south of the study area in 2020.
LUCC transition in Baghdad has a significant change since 1985. The total decrease from AL to CL and other land uses continuously accounted for −489.46 km2 from 1985 to 2020, and the loss in the two periods between 2000 and 2020 accounted for −455.29 km2 in AL type, as shown in Table 4 and Figure 6b. The significant transition from other land uses is mostly converted to CL, where the gain from 1985 to 2020 in urbanization is 669.09 km2, and the net change between 1985 to 2000 is 380.65 km2 in the whole transition in urban CL. NV has a large change, and its area has a small coverage in the study area due to uncontrolled and protection of human activity. The total change in NV from 1985 to 2020 reaches -266.35 km2, which is a large number of changes that caused the selected area with a reduction in NV coverage in the southern part of the study area. WB has increased rapidly since 1985, and the highest land conversion to WB between 2000 and 2020 accounted for 243.84 km2, as shown in Table 4 and Figure 6b.
3.2. Analyzing City Expansions at Different Spatial Directions
Urban CL directional analysis is a standard technique used in summarizing the phenomenon of spatio-temporal urbanization [78]. In accordance with the result analysis in Table 5, the directional analysis detects that each ring of the Baghdad urban CL largely develops from the center to the outside. The spatial direction of urban CL in 1985 is mostly concentrated on four rings from WNW-NW toward S-SSW parts (Figure 7), which are presented in Ad Dulaimiya, Al Falluja, Abu Ghraib, and Mahmudiyah suburban areas (see Figure 1, elevation map).
Table 5.
Urban CL expansion (area in km2) based on directional change.
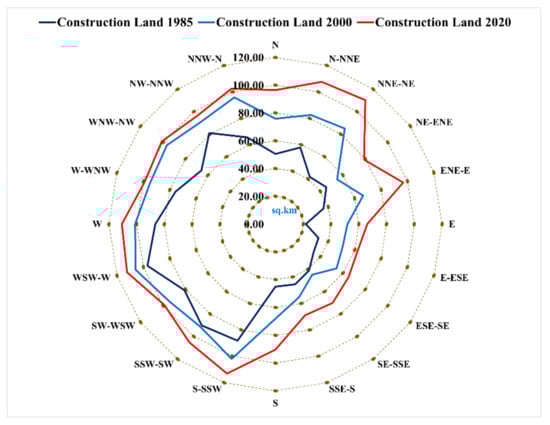
Figure 7.
Directional change of urban CL from 1985 to 2020; (Note: Three distinct colors represents three time periods directional change of urban CL such as, deep blue line represent urban CL 1985, light blue line represent urban CL 2000, and red line represent urban CL 2020.
However, the rapid urbanization of 2000 suggests an expansion from rings 1 and 2 toward concentrated rings 3 and 4 of NNW-N, N-NNE, NNE-NE, ENE-E, and ESE-SE (Figure 7) located in Dejail, Khalis, Baqubah, and Al Wajihiya (see Figure 1). This condition has continuously helped to increase the suburban area in the west side toward ring 5 in the W, WSW-W, and S-SSW directions. The urban CL significantly increased from the last 35 years from 1985 to 2020, whereas urban CL in 2020 expansion was mainly located in the south toward N and NE sides (Figure 7).
3.3. Effect of Population Growth to Urban CL
A large population increase meant that land resources become scarce due to the farmers’ demand for farming more intensively, as mentioned in the land use changes in Section 3.1. However, government and farmers may not be able to quickly develop technologies to farm their land efficiently due to land surface degradation at the regional level. The massive population growth is encouraged to demand settlement expansion, with the rapid urban CL leading to a significant natural green vegetation reduction, which is a negative consequence to regional environmental sustainability. The statistical data of urban population in Baghdad recorded that the overall increasing state reached to 3,537,416 during the 35 years from 1985–2020. The urban population increased to 1,593,104 between 1985–2000 and 1,944,312 between 2000–2020. From the area statistics change (Figure 5), a different increase in an area of 380.65 km2 between 1985–2000 was observed. During the period of 2000–2020, the urban area increase was lower than the previous changes by 288.44 km2. In accordance with Figure 8, urban population growth and urban CL expansion have an increased balance with the use of land resources with its changes.
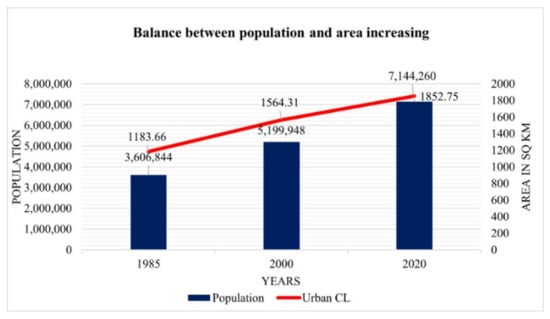
Figure 8.
Year wise growth relationship between population growth and urban CL.
3.4. Urban CL Distributed Based on Geographic Perspectives
Baghdad is a city with an elevation from 24 m to 109 m above sea level, and the slope classification ranges from 0° to 89.89°. The urban CL mainly grows in the flat area. However, this study analyzed the spatiotemporal urban CL expansion in terms of elevation and slope to understand the human need to grow residential areas by considering geographic features.
Table 6 and Table 7 demonstrate the urban CL growth rate at different elevations and slope levels from 1985 to 2020. Table 6 shows that most of the CL distribution of Baghdad is located less than 41 m in height from ASL. With the elevation difference between 25–36 m and 36–41 m levels, the total CL amount increased continuously year by year from 204.35 (17.26%), 368.35 (23.55%), 318.39 (17.18%), 724.74 (61%), 912.84 (58.39%), and 1058.76 km2 (57.15%) from 1985 to 2020. The other elevation levels, such as 41–46 m, 46–78 m, and over 78 m decreased, as shown in Figure 9 and Figure 10.
Table 6.
Urban CL growth based on elevation (in meters) from 1985 to 2020.
Table 7.
Urban CL growth based on the slope (in degrees) from 1985 to 2020.
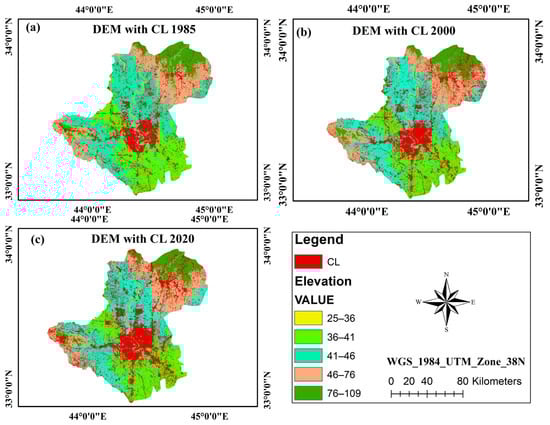
Figure 9.
Influences of DEM to urban CL distributed from 1985 to 2020. (a) DEM with CL 1985, (b) DEM with CL 2000, and (c) DEM with CL 2020.
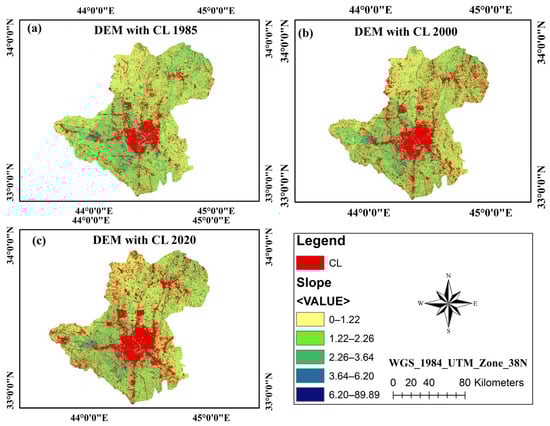
Figure 10.
Influences of slope to urban CL distributed from 1985 to 2020. (a) slope with CL 1985, (b) slope with CL 2000, and (c) slope with CL 2020.
3.5. FLUCC Prediction Scenario
3.5.1. Validation of the Actual and Predicted LUCC in 2020
The land use statistic of the transition matrix and area transition probability matrix was generated on the basis of two land uses in 1985 and 2000. The processing was conducted by using MLPNN (Figure 4 for details). Machine learning was run to create a transition potential of FLUCC. The MCM was applied to predict the probability matrix for 2020. The simulation for 2020 obtained a relatively high kappa coefficient for quantity and location, as shown in Table 8 and Figure 11. The kappa results showed an agreeable standard higher than 80% and confirmed for FLUCC prediction. The statistic results show that the actual and predicted 2020 LUCCs are different in terms of area and percentages for the increase and decrease in land use (Table 8). The significant percentage difference is discussed, with CL (5.74%), AL (1.69%), NV (11.34%), and BL (13.60%). The change difference in percentage for each class of land use is over 85%. Thus, the MLPNN and MCM are suitable for the FLUCC simulation of 2030, 2040, and 2050.
Table 8.
Difference in area between the actual and predicted LUCC in 2020.
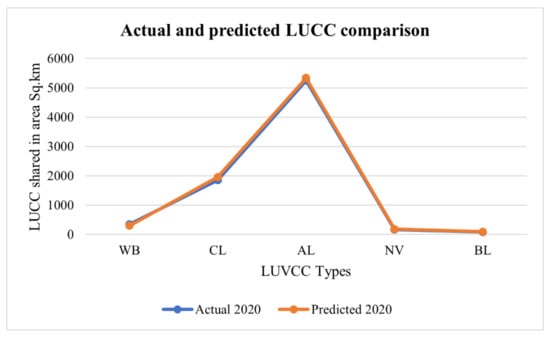
Figure 11.
Validation between LU predicted and actual LU 2020. (Note: WB—Water bodies, CL—Construction land, AL—Agricultural land, NV—Natural vegetation, BL—Bare land).
3.5.2. Simulation Scenario of FLUCC
The time survey of FLUCC accounted for 30 years, which started from 2020 to 2050. The historical LUCCs of 1985 and 2000 were used as keys for the FLUCC simulation of 2030, 2040, and 2050 (Figure 12). This study mainly focused on investigating the urban sprawl and its conversion in Baghdad City. The simulated result showed that the FLUCC expands mostly into the NE and NW of the study area. The significant increase and decrease in land use are based on human demand on infrastructure, settlement, and other human use. The historical LUCC found a slight change in AL during 1985 to 2000, due to the war period having a large impact and the poverty situation during the migration period. Mostly people were concerned for their living standard as a result of people using less AL. The other land uses such as NV quickly decreased in their area coverage as they were destroyed by human and war action. Urban CL between 1985–2000 increased faster than in years 2000–2020 due to population growth and internal migration due to the need for settlements. This historic change record was used as basic data to compare for future changes. The FLUCC simulation found a large decrease in AL, NV, and BL, accompanied with loss of area coverage, meaning that the future scenario causes the most concern. The future LUCC is increased by almost three times based on historic changes. This obviously demonstrates that population increase is the main cause for urbanization and the reduction of natural resources. With the country development plan strategy is a need for land resources consumption as a result of expanding urban CL in the area. The FLUCC has found a huge decrease in three major LU such as AL, NV, and BL in 59.35% (4552.19 km2), 2.30% (176.05 km2), and 1.20% (92.15 km2) in 2030, 47.14% (3615.76 km2), 2.19% (168.20 km2), and 0.91% (70.01 km2) in 2040, 39.74% (3048.09 km2), 1.91% (146.81 km2), and 0.71% (54.38 km2) in 2050, respectively. However, WB keeps increasing from 2030 to 2050 after decreasing from 2020 to 2030. Land use transfer into CL remarkably decreases, accounting for 36.55% (4552.19 km2), 48.49% (3719.08 km2), and 56.81% (4357.16 km2) for 2030, 2040, and 2050, respectively, as shown in Table 9 and Figure 12.
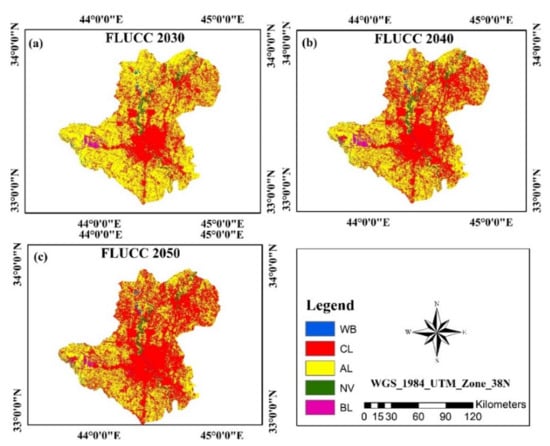
Figure 12.
Spatial distribution of FLUCC of 2030, 2040, and 2050. (a) FLUCC 2030, (b) FLUCC 2040, and (c) FLUCC 2050.
Table 9.
Statistic of FLUCC simulation under different scenarios 2030, 2040, and 2050.
The simulated rapid urban sprawl showed that if the trend of urban CL expanded continuously without regulatory measures being taken to control it, then the increase in urban areas would be found from N to S directions. The largest parts with incessant increases were located in the NE, central, and central to the east parts, which created an overall urban CL area increase reaching 3173.50 km2 based on the data from 1985 and 2050 (see Table 1 and Table 9), and the majority of land uses were replaced by AL, NV, and BL. The average increasing rate of urban CL was recorded as 41.38% over the period from 1985 to 2050 (calculated based on Table 1 and Table 9). The details of chronological visual changes of urban CL sprawl and its area changing trends are shown in Figure 13a–f and Figure 14, respectively.
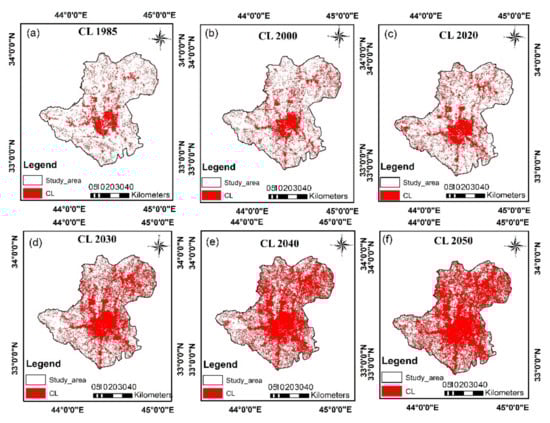
Figure 13.
Visualization of chronological Urban CL sprawl from 1985 to 2050. (a) Urban CL 1985, (b) Urban CL 2000, (c) Urban CL 2020, (d) Urban CL 2030, (e) Urban CL 2040, and (f) Urban CL 2050. (Note: urban CL sprawl represents in red color in subgraphs).
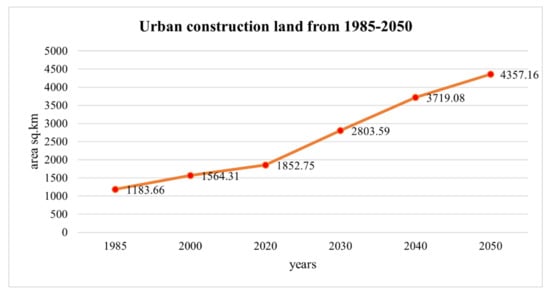
Figure 14.
Choronological area changing trend status of urban CL from 1985 to 2050.
4. Discussion
4.1. Accuracy of LUCC Classification and Future Modeling
The LUCC validation accuracy depends on the quality of RS images, techniques, and the ability of the image’s interpretation in ArcGIS and ERDAS Imagine. The interpretation of the images requires the use of ground truth surveys and GEP assistance to reach the corrected position. This step is implemented to achieve high accuracy. The image classification in this study mainly uses the combined classification methods of supervised and unsupervised classifications. In connection with this study, the kappa index and overall accuracy were evaluated. If the accuracy of each class and image analysis is over 85%, then they are considered suitable for LUCC prediction. Baghdad is one of the civilized cities of Iraq, the RS data are high quality, and the seasonal uses have less cloud cover. Thus, this research obtained a high accuracy of over 85% (see Table 2).
This study further focuses on the FLUCC modeling validation accuracy, which is derived by using the historical data of land use between 1985 and 2000 to predict the LU in 2020. Similar to the historical time period, the kappa coefficient for quality and location was obtained for future prediction also. The final result of area change comparison between the actual LU and predicted LU is the last decision for model validation and its further processing.
4.2. Urban CL Expansion
The war scenario from 2003 to 2011 in Iraq led to a large decrease in population, illustrating a high death rate and a low birth rate during this stress period (see Figure 3), with a large population migration effect on the Baghdad area due to human poverty and the need to move forward to enjoy their new lives, jobs, and education. With the progress of time, the population and residential areas in Baghdad continuously increased. The infrastructures, which were destroyed by war, were renovated, and the newly incorporated residential areas in the urban complex are associated to the loss of topographical features, such as destruction of AL and NV.
Over the three decades, the spatiotemporal and statistical changes in LUCC analysis in Baghdad during 1985–2020 highlight the rapid urbanization and correspond to AL reduction. The prediction of LUCC expansion to 2030, 2040 and 2050 designates the maintenance of such increasing trends. However, the projected decline in urban expansion rates, rapid urbanization, and AL destruction continues to be largely persistent. Our LUCC simulation indicates two main land surface change alterations characterizing Baghdad, such as rapid urban CL expansion and the loss of AL. The commonly observed weakness of regional government in expressing the lack of plans in urbanization certainly facilitates the haphazard pattern of urban expansion regionally and is anticipated to persist in the future. With the rapidly increasing regional population in Baghdad mainly caused by rural-urban migration for education, careers, and better lives, the future scenarios need to consider economic development and technologies as motives for the fast change of CL. The future land use simulation can obviously indicate that all the land uses have been diminished by the city development (Figure 12). The lack of urban sprawl control and unplanned CL expansion may cause surface temperature and negatively affect the ecosystem and biodiversity of the city.
In accordance with the previous LUCC trend analysis, the extent of urban expansion relative to other LUCC varied considerably by each period. These spatiotemporal variations are associated with primary socioeconomic factors, political events, human-environment service, and natural factors [79]. This analysis displays that urban CL growth is faster after 1985, which may replicate the population increase. Rural-urban migration was caused by the national and domestic political conflict that occurred over the period. The better-balanced situation expresses the expansion of urban CL with the increased population that occurred during 2000–2020 (Figure 3). However, this study initially checked the seismicity in the Baghdad area by locating earthquake data points from 1985~2020, suggesting that the study area is free from earthquakes in the area inside the city compared with Iraq on a broader scale. The epicenters of the earthquakes are mostly located in the eastern parts of Iraq where fault lines are crossed (Figure 2). Therefore, no significant impacts of earthquakes are observed in the LU maps of three different times (1985, 2000, and 2020).
The study only considered the urban CL changes with respect to topographic aspects, such as DEM and slope. The result analysis of geographical influence designates that expanded urbanization occurs mainly at relatively low-altitudes, which is acceptable for human residential [78]. Another physical feature is shown in Table 7, where the majority of Baghdad and other suburban areas suitable for CL are located in sloped areas ranging between 1.22°–2.26° and 2.26°–3.64°. The higher and lower degrees result in decreased number of settlements, as shown in detail in Figure 8 and Figure 10.
4.3. Limitations, Suggestions, and Future Recommendations
The present study considered extensive data and robust methods with some limitations. This study cannot consider various possible drivers of urban expansion, such as local gross domestic product and government policy due to lack of data and reliable methods of linking these drivers to spatially defined land cover changes [79]. The complex process is driven by dynamic nonlinearity or spatial interaction and shaping land change cannot capture available use data and algorithms. These missing factors may significantly affect the LUCC trajectory of the future urban expansion and agricultural losses. Thus, our prediction is the best, which is fully understood as the observed trend and expansion of the data. For future land change scenarios, urban expansion is limited to land designated for this purpose. Urban expansion is regarded as a means to measure the effectiveness of current land use plans for future environmental security. Many uncertainties are found in our estimates. Our spatial model is based on historical land change transition. Therefore, the prediction of the future trend of LUCC counters the realistic change with the past. Similarly, our results may be different from those based on historic use observations of another type of land cover. The LUCC maps used for LUCC modeling are from Landsat multispectral images with a resolution of 30 m which limits the scope and accuracy of observable land cover categories. However, in the future, high-resolution satellite data (for example, SPOT satellite or World View) can be used to derive more diverse and thematically precise observations of specific agricultural and urban coverage related to agricultural losses and environmental security, such as self-sufficiency and mechanized farming, sprawl, and high-density urban coverage. The use of high-resolution images can be proven suitable for estimating converted, abandoned, and newly established areas, thereby improving the estimation of the ever-changing LUCC. However, our simulation helps to understand and predict the possibility of future events reflecting the past.
In the previous decades, the main problem of Baghdad was illustrated by area crowding and expanding settlements. The suburban villages still exist over the area, and low efficiency use of policy in population control, environmental restoration, and construction means that an urban system with a high density of residential and less dependent land use over the surrounding areas of the city must be constructed to avoid urban condition sprawl, attain land resource and ecological conservation, and recover the running efficiency of the city. On the basis of the above analyses obtained of the spatiotemporal distribution features in Baghdad’s urban development area, this research can be considered as a useful guideline for sustainable urban construction. The guidelines and LUCC databases to the future and the integrated application techniques have helped us to explore the changing city area in a sustainable manner. Moreover, the effectiveness of its uses will be a future guideline to the regional urban designers and policymakers. An ecology restoration policy-based approach to support better social lifestyles and ecological issues in the city must be implemented in short-term and long-term development plans. Therefore, by following the aims and objectives of the present study, we successfully evaluated the historical and future LUCCs in Baghdad City and make suggestions to build future urban development with a green city approach that must support and follow the United Nations (UN) 2030 sustainability development Goal No. 11.
5. Conclusions
The present study adopted satellite imageries from Landsat-5 TM and Landsat-8 OLI to identify 1985, 2000, and 2020 LUCCs in Baghdad City, Iraq. RS and GIS technologies were applied in the classification. MLPNN and MCM were selected for the spatial simulation of FLUCC. For the MLPNN, seven dependent variables and five independent variables were used for urban sprawl considering natural and anthropogenic factors. The driver’s dependent variables included the DEM, slope, road distance, urban distance, road network, river distance, and population density. Five independent variables, namely change from all land uses to CL, change from AL to CL, change from NV to CL, and change from BL to CL, were selected to support the LCM analysis.
The output derived is covered in all the objectives and is summarized in this study. The previous LUCC classification obtains a high kappa coefficient of over 80% accuracy, which is acceptable to simulate FLUCC. The output from the interpreted multispectral images indicated that another land use of the study area decreased with a transition trend, except for CL with an increasing trend incessantly accounting for 669.09 km2 (8.73%) from 1985 to 2020. This rapid change in urban development is due to the increasing human population and demand, causing a large impact on all land use destruction in the city area. The population growth in Baghdad has faced extreme concern due to the lack of strict policies on human control as the population from 1985 reached 3,606,844, increased to 5,199,948 in 2000, and 7,144,260 in 2020 [49]. Further, the urban growth will increase incessantly by 2030, 2040, and 2050 because it is affected by the statistical results of the historical LUCC, and other land uses, such as WB, are gradually growing. However, land use types, such as AL, NV, and BL, significantly reduce. The assessment showed that AL is mostly transferred to urban CL, and AL and NV will disappear in the near future due to urban sprawl. The future LUCC found continuous urban CL expansion unless regulatory measures are taken to control it. The increase in urban areas is found from N to S directions accounting for 1,553.57 km2 (20.26%), and other land use, such as WB, AL, NV, and BL, largely decrease over the two decades from 2030 to 2050. Comprehensively, the urban sprawl direction and distance analysis of urban development confirmed this condition. The previous change in urban directional analysis of the spider diagrams (Figure 6) confirmed the directional change which slightly increased between 1985, 2000, and 2020 into the SW part from WNW-NW toward S-SSW. In addition, the scale of N to NE from NNW-N, N-NNE, NNE-NE, ENE-E to ESE-SE found the largest growth during the three periods from 1985 to 2020. The urban sprawl based on geographic distribution was mainly located between the elevation of 25–36 m and 36–41 m accounting for 873.6, 1144.71, and 1369.93 km2 by 1985, 2000, and 2020, respectively. The urbanization growth based on slope level ranged between 1.21°–2.26° and 2.26°–3.64°, accounting for the largest area of approximately 1012.6, 1293.71, and 1489.93 km2 by 1985, 2000, and 2020, respectively. The analysis of urban CL growth based on geographic features obviously showed that the population and residential areas mostly prefer to be located in the medium level of high elevation and slope areas.
The result analysis of historical and FLUCC found that land use variations in 1985, 2000, and 2020 showed a decreasing trend. Although the speed of urban CL from 2030 to 2050 suggested a rapidly increasing trend primarily due to the population growth from the existing, human need for settlement and city development meant that other land uses are reduced, and WB is slightly increased. Compared with the relative land use change in countries with lower population increases, the impact in Baghdad city is higher. The geo-integrated technologies and the present model approach considered in this research achieved a high kappa coefficient. The results indicated that the proposed method could obtain high-quality in FLUCC and can be applied as a reference for further research in different study areas.
Author Contributions
Conceptualization, W.M.M.A.-H. and J.C.; methodology, W.M.M.A.-H., J.C., C.F. and B.N.; formal analysis, W.M.M.A.-H., C.F., B.A.-S., B.N. and A.-A.K.; writing—original draft preparation, W.M.M.A.-H.; Writing—review and editing, W.M.M.A.-H., C.F., B.A.-S., B.N., A.A.-A. and G.H.; Funding acquisition, W.M.M.A.-H. and J.C. All authors have read and agreed to the final version of the manuscript.
Funding
This research was funded by the Science and Technology Planning Project of Changsha (grant number: kh2005069).
Acknowledgments
We the all authors would like to thank and highly acknowledge the USGS Earth Explorer Committee for providing freely accessible Landsat-5 TM, Landsat-8 OLI images, and ASTER DEM images from their archives. The authors are highly grateful and acknowledge the three anonymous reviewers and editors for their helpful constructive comments, suggestions and directions that have helped us to improve the earlier version of the manuscript.
Conflicts of Interest
The authors declare no conflict of interest.
Appendix A
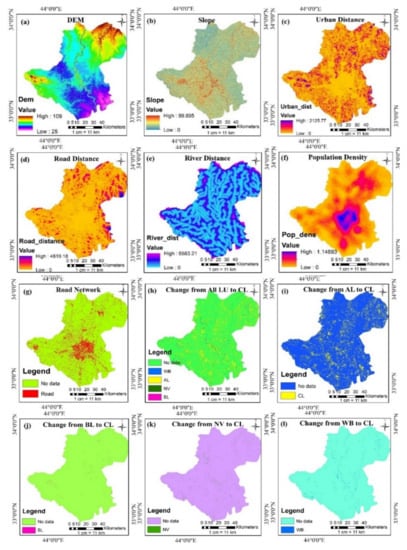
Figure A1.
Driver factors for MCM, which include dependent and independent variables. (a) DEM; (b) slope; (c) distance from urban; (d) road network; (e) distance from road; (e) distance from river; (f) population density; (g) road network; (h) all land use change to CL; (i) change from AL to CL; (j) change from BL to CL; (k) change from NV to CL; and (l) change from WB to CL.

Figure A2.
Modeling LUCC transition probability (TP). (a) TP from AL to CL; (b) TP from NV to CL; (c) TP from WB to CL; (d) TP from BL to CL.
References
- Ahmed, F. The Use of Spatial Analysis and Participatory Approaches in Strategic Environmental Assessment (SEA): Identifying and Predicting the Ecological IMPACTS of Development on the KwaZulu-Natal North Coast of South Africa. Ph.D. Thesis, University of KwaZulu-Natal, Durban, South Africa, 2010. Available online: http://hdl.handle.net/10413/123 (accessed on 15 May 2021).
- Fazal, S. Land Use Dynamics in a Developing Economy: Regional Perspectives from India; Springer Briefs in Geography; Springer Netherlands: Aligrah city, The Netherlands, 2013. [Google Scholar]
- Faichia, C.; Tong, Z.; Zhang, J.; Liu, X.; Kazuva, E.; Ullah, K.; Al-Shaibah, B. Using RS Data-Based CA–Markov Model for Dynamic Simulation of Historical and Future LUCC in Vientiane, Laos. Sustainability 2020, 12, 8410. [Google Scholar] [CrossRef]
- Hoornweg, D.; Pope, K. Population predictions for the world’s largest cities in the 21st century. Environ. Urban. 2017, 29, 195–216. [Google Scholar] [CrossRef] [Green Version]
- Cohen, J.E. Human population grows up. Sci. Am. 2005, 293, 48–55. [Google Scholar] [CrossRef]
- Li, P. Urbanization and the New Phase of Growth in China. In Urbanization and Its Impact in Contemporary China, 1st ed.; Research Series on the Chinese Dream and China’s Development, Path; Li, P., Ed.; Springer: Singapore, 2019; pp. 1–20. [Google Scholar]
- Chauhan, R.P.; Gordon, M.L. A systematic review analyzing the prevalence and circulation of influenza viruses in swine population worldwide. Pathogens 2020, 9, 355. [Google Scholar] [CrossRef]
- Somvanshi, S.S. Monitoring spatial LULC changes and its growth prediction based on statistical models and earth observation datasets of Gautam Budh Nagar, Uttar Pradesh, India. Environ. Dev. Sustain. 2020, 22, 1073–1091. [Google Scholar] [CrossRef]
- Long, H.; Heilig, G.H.; Li, X.; Zhang, M. Socio-economic development and land-use change: Analysis of rural housing land transition in the Transect of the Yangtse River, China. Land Use Policy 2007, 24, 141–153. [Google Scholar] [CrossRef]
- Lambin, E.F.; Geist, H.J.; Lepers, E. Dynamics of land-use and land-cover change in tropical regions. Annu. Rev. Environ. Resour. 2003, 28, 205–241. [Google Scholar] [CrossRef] [Green Version]
- Li, X.; Chen, G.; Liu, X.; Liang, X.; Wang, S.; Chen, Y.; Pei, F.; Xu, X. A new global land-use and land-cover change product at a 1-km resolution for 2010 to 2100 based on human–environment interactions. Ann. Assoc. Am. Geogr. 2017, 107, 1040–1059. [Google Scholar] [CrossRef]
- Dale, V.H. The relationship between land-use change and climate change. Ecol. Appl. 1997, 7, 753–769. [Google Scholar] [CrossRef]
- Zhou, M. Urban Sprawl and Changes in Land-Use Efficiency in the Beijing–Tianjin–Hebei Region, China from 2000 to 2020: A Spatiotemporal Analysis Using Earth Observation Data. Remote Sens. 2021, 13, 2850. [Google Scholar] [CrossRef]
- Jaeger, J.A.G.; Bertiller, R.; Schwick, C.; Cavens, D.; Kienast, F. Urban permeation of landscapes and sprawl per capita: New measures of urban sprawl. Ecol. Indic. 2010, 10, 427–441. [Google Scholar] [CrossRef]
- Ahmed, S.J.; Bramley, G.; Verburg, P.H. Key Driving factors influencing urban growth: Spatial-statistical modelling with Clue-s. In Dhaka Megacity: Geospatial Perspectives on Urbanisation, Environment and Health; Dewan, A., Corner, R., Eds.; Springer Geography: Dhaka, Switzerland, 2014; pp. 123–145. [Google Scholar]
- Clarke, K.C. Cellular Automata and Agent-Based Models. In Handbook of Regional Science; Fischer, M., Nijkamp, P., Eds.; Springer: Berlin/Heidelberg, Germany, 2014; pp. 1217–1233. [Google Scholar]
- Armin, M.; Majidian, M.; Kheybari, V.G. Land Use/Land Cover Change Detection and Prediction in the Yasouj City Suburbs in Kohgiluyeh Va Boyerahmad Province in Iran. Arid Ecosyst. 2020, 10, 203–210. [Google Scholar] [CrossRef]
- Kotaridis, I.; Lazaridou, M. Environmental Change Detection Study in the Wider Area of Lignite Mines. Civ. Eng. Archit. 2018, 6, 108–114. [Google Scholar] [CrossRef]
- Mallupattu, K.P.; Reddy, J.R.S. Analysis of land use/land cover changes using remote sensing data and GIS at an Urban Area, Tirupati, India. Sci. World J. 2013, 2013, 268623. [Google Scholar] [CrossRef] [PubMed] [Green Version]
- Shamsi, F.S.R. Integrating Linear Programming and Analytical Hierarchical Processing in Raster-GIS to Optimize Land Use Pattern at Watershed Level. J. Appl. Sci. Environ. Manag. 2010, 14, 81–85. [Google Scholar]
- Hyandye, C.; Mandara, C.G.; Safari, J. GIS and Logit Regression Model Applications in Land Use/Land Cover Change and Distribution in Usangu Catchment. Am. J. Remote Sens. 2015, 3, 6–16. [Google Scholar] [CrossRef] [Green Version]
- Aitkenhead, M.J.; Aalders, I.H. Predicting land cover using GIS, Bayesian and evolutionary algorithm methods. J. Environ. Manag. 2009, 90, 236–250. [Google Scholar] [CrossRef]
- Memarian, H.; Balasundram, S.K.; Talib, J.B.; Sung, C.T.B.; Sood, A.M.; Abbaspour, K. Validation of CA-Markov for Simulation of Land Use and Cover Change in the Langat Basin, Malaysia. J. Geogr. Inf. Syst. 2012, 4, 542–554. [Google Scholar] [CrossRef] [Green Version]
- Khawaldah, H.A. A prediction of future land use/land cover in Amman area using GIS-based Markov Model and Remote Sensing. J. Geogr. Info. Syst. 2016, 8, 412–427. [Google Scholar] [CrossRef] [Green Version]
- Weng, Q. Land use change analysis in the Zhujiang Delta of China using satellite remote sensing, GIS and stochastic modelling. J. Environ. Manag. 2002, 64, 273–284. [Google Scholar] [CrossRef] [Green Version]
- Mitrea, C.; Lee, C.; Wu, Z. A comparison between neural networks and traditional forecasting methods: A case study. IJEBM 2009, 1, 11. [Google Scholar] [CrossRef]
- Frank, J.R.; Davey, N.; Hunt, S.P. Time series prediction and neural networks. J. Intell. Robot Syst. 2001, 31, 91–103. [Google Scholar] [CrossRef]
- Bengio, Y.; Frasconi, P.; Simard, P. The problem of learning long-term dependencies in recurrent networks. In Proceedings of the IEEE International Conference on Neural Networks, San Francisco, CA, USA, 28 March–1 April 1993. [Google Scholar]
- Wan, E.A. Finite Impulse Response Neural Networks with Applications in Time Series Prediction; Stanford University: Stanford, CA, USA, 1994. [Google Scholar]
- Menezes, J.M., Jr.; Barreto, G.A. A new look at nonlinear time series prediction with NARX recurrent neural network. In Proceedings of the Ninth Brazilian Symposium on Neural Networks (SBRN’06), Ribeirao Preto, Brazil, 23–27 October 2006. [Google Scholar]
- Gutierrez, S.R.; Solis, A.O.; Mukhopadhyay, S. Lumpy demand forecasting using neural networks. Int. J. Prod. 2008, 111, 409–420. [Google Scholar] [CrossRef]
- Dey, N.N.; Rakib, A.A.; Kafy, A.-A.; Raikwar, V. Geospatial modelling of changes in land use/land cover dynamics using Multi-layer perception Markov chain model in Rajshahi City, Bangladesh. Environ. Chall. 2021, 4, 100148. [Google Scholar] [CrossRef]
- Guan, D.; Weijun, G.; Kazuyuki, W.; Hidetoshi, F. Land use change of Kitakyushu based on landscape ecology and Markov model. J. Geogr. Sci. 2008, 18, 455–468. [Google Scholar] [CrossRef]
- Kumar, S.; Radhakrishnan, N.; Mathew, S. Land use change modelling using a Markov model and remote sensing. Geomat. Nat. Hazards Risk 2014, 5, 145–156. [Google Scholar] [CrossRef]
- Liping, C.; Yujun, S.; Saeed, S. Monitoring and predicting land use and land cover changes using remote sensing and GIS techniques—A case study of a hilly area, Jiangle, China. PLoS ONE 2018, 13, e0200493. [Google Scholar] [CrossRef]
- Graham, S. Cities Under Siege: The New Military Urbanism; Verso Books: New York, NY, USA, 2011; p. 402. [Google Scholar]
- Siebeneck, L.K.; Medina, R.M.; Yamada, I.; Hepner, G.F. Spatial and temporal analyses of terrorist incidents in Iraq, 2004–2006. Stud. Confl. Terror. 2009, 32, 591–610. [Google Scholar] [CrossRef]
- Mohamedmeki, M.Z.; Al-Mumaiz, M. Multi Land Use Approach Towards Sustainable Baghdad City: Bab Al-Muatham Garage as a Case Study. IOP Conf. Ser. Mater. Sci. Eng. 2020, 2, 27–35. [Google Scholar] [CrossRef]
- Qassim, Z.H.; Abduljabbar, H.M. Land cover change for Baghdad City in the period 1986 to 2019. AIP Conf. Proc. 2020, 2307, 020031. [Google Scholar]
- Al-Ramahi, F.K.M. Spatial analysis of Radon Gas concentration distrbuted at Baghdad City using remote sensing and geographic information system Techniquesd. Iraqi J. Agric. Sci. 2020, 51, 21–32. [Google Scholar]
- Hamdy, H.Q.; Mutlag, O.H. Land Cover Change Detection in Al-Karkh/Baghdad. Int. J. Sci. Res. 2020, 9, 412–417. [Google Scholar]
- Jones, L. Rapid Population Growth in Baghdad and Amman. The Middle East J. 1969, 23, 209–215. [Google Scholar]
- Sirkeci, I. Conflict, the Environment of Human Insecurity and Migration in Iraq in the Aftermath of 2003. In Rethinking Global Migration: Practices, Policies and Discourses in the European Neighbourhood; KORA & METU: Ankara, Turkey, 2008; pp. 161–175. [Google Scholar]
- Sirkeci, I. War in Iraq: Environment of insecurity and international migration. Int. Migr. 2005, 43, 197–214. [Google Scholar] [CrossRef]
- Almukhtar, S. The Effect of Urban Conflict and the Role of Community-Based Initiatives in Baghdad; Columbia University: New York, NY, USA, 2014. [Google Scholar]
- Matlhodi, B.; Kenabatho, P.K.; Parida, B.P.; Maphanyane, J.G. Analysis of the Future Land Use Land Cover Changes in the Gaborone Dam Catchment Using CA-Markov Model: Implications on Water Resources. Remote Sens. 2021, 13, 2427. [Google Scholar] [CrossRef]
- Amin, A. A Geographical Analysis of Urban Land Transformation in Srinagar City. Ph.D. Thesis, Aligarh Muslim University, Aligarh, India, 2012. [Google Scholar]
- Fattah, M.H.; Caso, F. A Brief History of Iraq; Infobase Publishing: New York, NY, USA, 2009. [Google Scholar]
- Baghdad Population 2021. Available online: https://worldpopulationreview.com (accessed on 12 July 2021).
- Abdulkareem, A.K.; Matrood, L.M.; Muter, S.A. Detection of the Change of Meteorological Season in Middle and Southern Iraq. Plant Arch. 2020, 20, 1028–1033. [Google Scholar]
- Ali, J.M.; Marsh, S.H.; Smith, M.J. A comparison between London and Baghdad surface urban heat islands and possible engineering mitigation solutions. Sustain. Cities Soc. 2017, 29, 159–168. [Google Scholar] [CrossRef] [Green Version]
- Chabuk, A.; Al-Ansari, N.; Hussain, H.M.; Laue, J.; Hazim, A.; Knutsson, S.; Pusch, R. Landfill sites selection using MCDM and comparing method of change detection for Babylon Governorate, Iraq. Environ. Sci. Pollut. Res. 2019, 35, 35325–35339. [Google Scholar] [CrossRef] [Green Version]
- Google Earth Pro. 2020. Available online: https://www.google.com/earth/download/gep/agree.html?hl=en-GB (accessed on 22 June 2021).
- USGS, Earth Explorer. Available online: https://earthexplorer.usgs.gov/ (accessed on 28 June 2021).
- Yang, X. Satellite Monitoring of Urban Spatial Growth in the Atlanta Metropolitan Area. Photogramm. Eng. Remote Sens. 2002, 68, 725–734. [Google Scholar]
- Abbas, Z.; Jaber, H.S. Accuracy assessment of supervised classification methods for extraction land use maps using remote sensing and GIS techniques. IOP Conf. Ser. Mater. Sci. Eng. 2020, 745, 012166. [Google Scholar] [CrossRef]
- OpenStreetMap. Online Mapping Project Database. 2021. Available online: http://www.openstreetmap.org/ (accessed on 11 July 2021).
- Mas, J.-F.; Velázquez, A.; Díaz-Gallegos, J.R.; Mayorga-Saucedo, R.; Alcántara, C.; Bocco, G.; Castro, R.; Fernández, T.; Pérez-Vega, A. Assessing land use/cover changes: A nationwide multidate spatial database for Mexico. Int. J. Appl. Earth Obs. Geoinf. 2004, 5, 249–261. [Google Scholar] [CrossRef]
- Parsa, V.A.; Salehi, E. Spatio-temporal analysis and simulation pattern of land use/cover changes, case study: Naghadeh, Iran. J. Urban Manag. 2016, 5, 43–51. [Google Scholar] [CrossRef] [Green Version]
- Rwanga, S.S.; Ndambuki, J.M. Accuracy assessment of land use/land cover classification using remote sensing and GIS. Int. J. Geosci. 2017, 8, 611. [Google Scholar] [CrossRef] [Green Version]
- Wang, S.W.; Gebru, B.M.; Lamchin, M.; Kayastha, R.B.; Lee, W.-K. Land use and land cover change detection and prediction in the Kathmandu district of Nepal using remote sensing and GIS. Sustainability 2020, 12, 3925. [Google Scholar] [CrossRef]
- Omar, N.Q.; Ahmad, M.S.S.; Wan Hussin, W.M.A.; Samat, N.; Ahmad, S.Z.B. Markov CA, multi regression, and multiple decision making for modeling historical changes in Kirkuk City, Iraq. J. Indian Soc. Remote Sens. 2014, 42, 165–178. [Google Scholar] [CrossRef]
- Hua, A.K. Land Use Land Cover Changes in Detection of Water Quality: A Study Based on Remote Sensing and Multivariate Statistics. J. Environ. Public Health 2017, 2017, 7515130. [Google Scholar] [CrossRef] [PubMed] [Green Version]
- Congalton, R.G. Accuracy assessment and validation of remotely sensed and other spatial information. Int. J. Wildland Fire 2001, 10, 321–328. [Google Scholar] [CrossRef] [Green Version]
- Kafy, A.-A.; Rakib, A.A.; Akter, K.S.; Rahaman, Z.A.; Faisal, A.-A.; Mallik, S.; Nasher, N.M.R.; Hossain, M.I.; Ali, M.Y. Monitoring the effects of vegetation cover losses on land surface temperature dynamics using geospatial approach in Rajshahi city, Bangladesh. Environ. Chall. 2021, 4, 100187. [Google Scholar] [CrossRef]
- Kafy, A.-A.; Naim, M.N.H.; Subramanyam, G.; Faisal, A.-A.; Ahmed, N.U.; Rakib, A.A.; Kona, M.A.; Sattar, G.S. Cellular Automata approach in dynamic modelling of land cover changes using RapidEye images in Dhaka, Bangladesh. Environ. Chall. 2021, 4, 100084. [Google Scholar] [CrossRef]
- Cao, H.; Liu, J.; Fu, C.; Zhang, W.; Wang, G.; Luo, L. Urban Expansion and Its Impact on the Land Use Pattern in Xishuangbanna since the Reform and Opening up of China. Remote Sens. 2017, 9, 137. [Google Scholar] [CrossRef] [Green Version]
- Dzieszko, P. Land-cover modelling using corine land cover data and multi-layer perceptron. Quaest. Geogr. 2014, 33, 5–22. [Google Scholar] [CrossRef] [Green Version]
- Roy, S.; Farzana, K.; Papia, M.; Hasan, M. Monitoring and prediction of land use/land cover change using the integration of Markov chain model and cellular automation in the Southeastern Tertiary Hilly Area of Bangladesh. Int. J. Sci. Basic Appl. Res. 2015, 24, 125–148. [Google Scholar]
- Dadhich, P.N.; Hanaoka, S. Markov method integration with multi-layer perceptron classifier for simulation of urban growth of Jaipur City. In Proceedings of the 6th WSEAS International Conference on Remote Sensing, Iwate, Japan, 4–6 October 2010; pp. 118–123. [Google Scholar]
- Dixon, B.; Candade, N. Multispectral landuse classification using neural networks and support vector machines: One or the other, or both? Int. J. Remote Sens. 2008, 29, 1185–1206. [Google Scholar] [CrossRef]
- Lin, Y.-P.; Chu, H.-J.; Wu, C.-F.; Verburg, P.H. Predictive ability of logistic regression, auto-logistic regression and neural network models in empirical land-use change modeling–a case study. Int. J. Geogr. Inf. Sci. 2011, 25, 65–87. [Google Scholar] [CrossRef] [Green Version]
- Shen, L.; Li, J.B.; Wheate, R.; Yin, J.; Paul, S.S. Multi-layer perceptron neural network and Markov chain based geospatial analysis of land use and land cover change. J. Environ. Inform. Lett. 2020, 3, 29–39. [Google Scholar] [CrossRef]
- Friesner, R.A.; Banks, J.L.; Murphy, R.B.; Halgren, T.A.; Klicic, J.J.; Mainz, D.T.; Repasky, M.P.; Knoll, E.H.; Shelley, M.; Perry, J.K.; et al. Glide: A New Approach for Rapid, Accurate Docking and Scoring. 1. Method and Assessment of Docking Accuracy. J. Med. Chem. 2004, 47, 1739–1749. [Google Scholar] [CrossRef]
- Gümrah, F.; Öz, B.; Güler, B.; Evin, S. The application of artificial neural networks for the prediction of water quality of polluted aquifer. Water Air Soil Pollut. 2000, 119, 275–294. [Google Scholar] [CrossRef]
- Hsu, L.-C. Applying the grey prediction model to the global integrated circuit industry. Technol. Forecast. Soc. Change 2003, 70, 563–574. [Google Scholar] [CrossRef]
- Arsanjani, J.J.; Kainz, W.; Mousivand, A.J. Tracking dynamic land-use change using spatially explicit Markov Chain based on cellular automata: The case of Tehran. Int. J. Image Data Fusion 2011, 2, 329–345. [Google Scholar] [CrossRef]
- Qian, Y.; Wu, Z. Study on Urban Expansion Using the Spatial and Temporal Dynamic Changes in the Impervious Surface in Nanjing. Sustainability 2019, 11, 933. [Google Scholar] [CrossRef] [Green Version]
- Rimal, B.; Sloan, S.; Keshtkar, H.; Sharma, R.; Rijal, S.; Shrestha, U.B. Patterns of Historical and Future Urban Expansion in Nepal. Remote Sens. 2020, 12, 628. [Google Scholar] [CrossRef] [Green Version]
Publisher’s Note: MDPI stays neutral with regard to jurisdictional claims in published maps and institutional affiliations. |
© 2021 by the authors. Licensee MDPI, Basel, Switzerland. This article is an open access article distributed under the terms and conditions of the Creative Commons Attribution (CC BY) license (https://creativecommons.org/licenses/by/4.0/).