
Exploring the Ever-Changing Seashore Using Geoinformatics Technology


Abstract
:1. Introduction
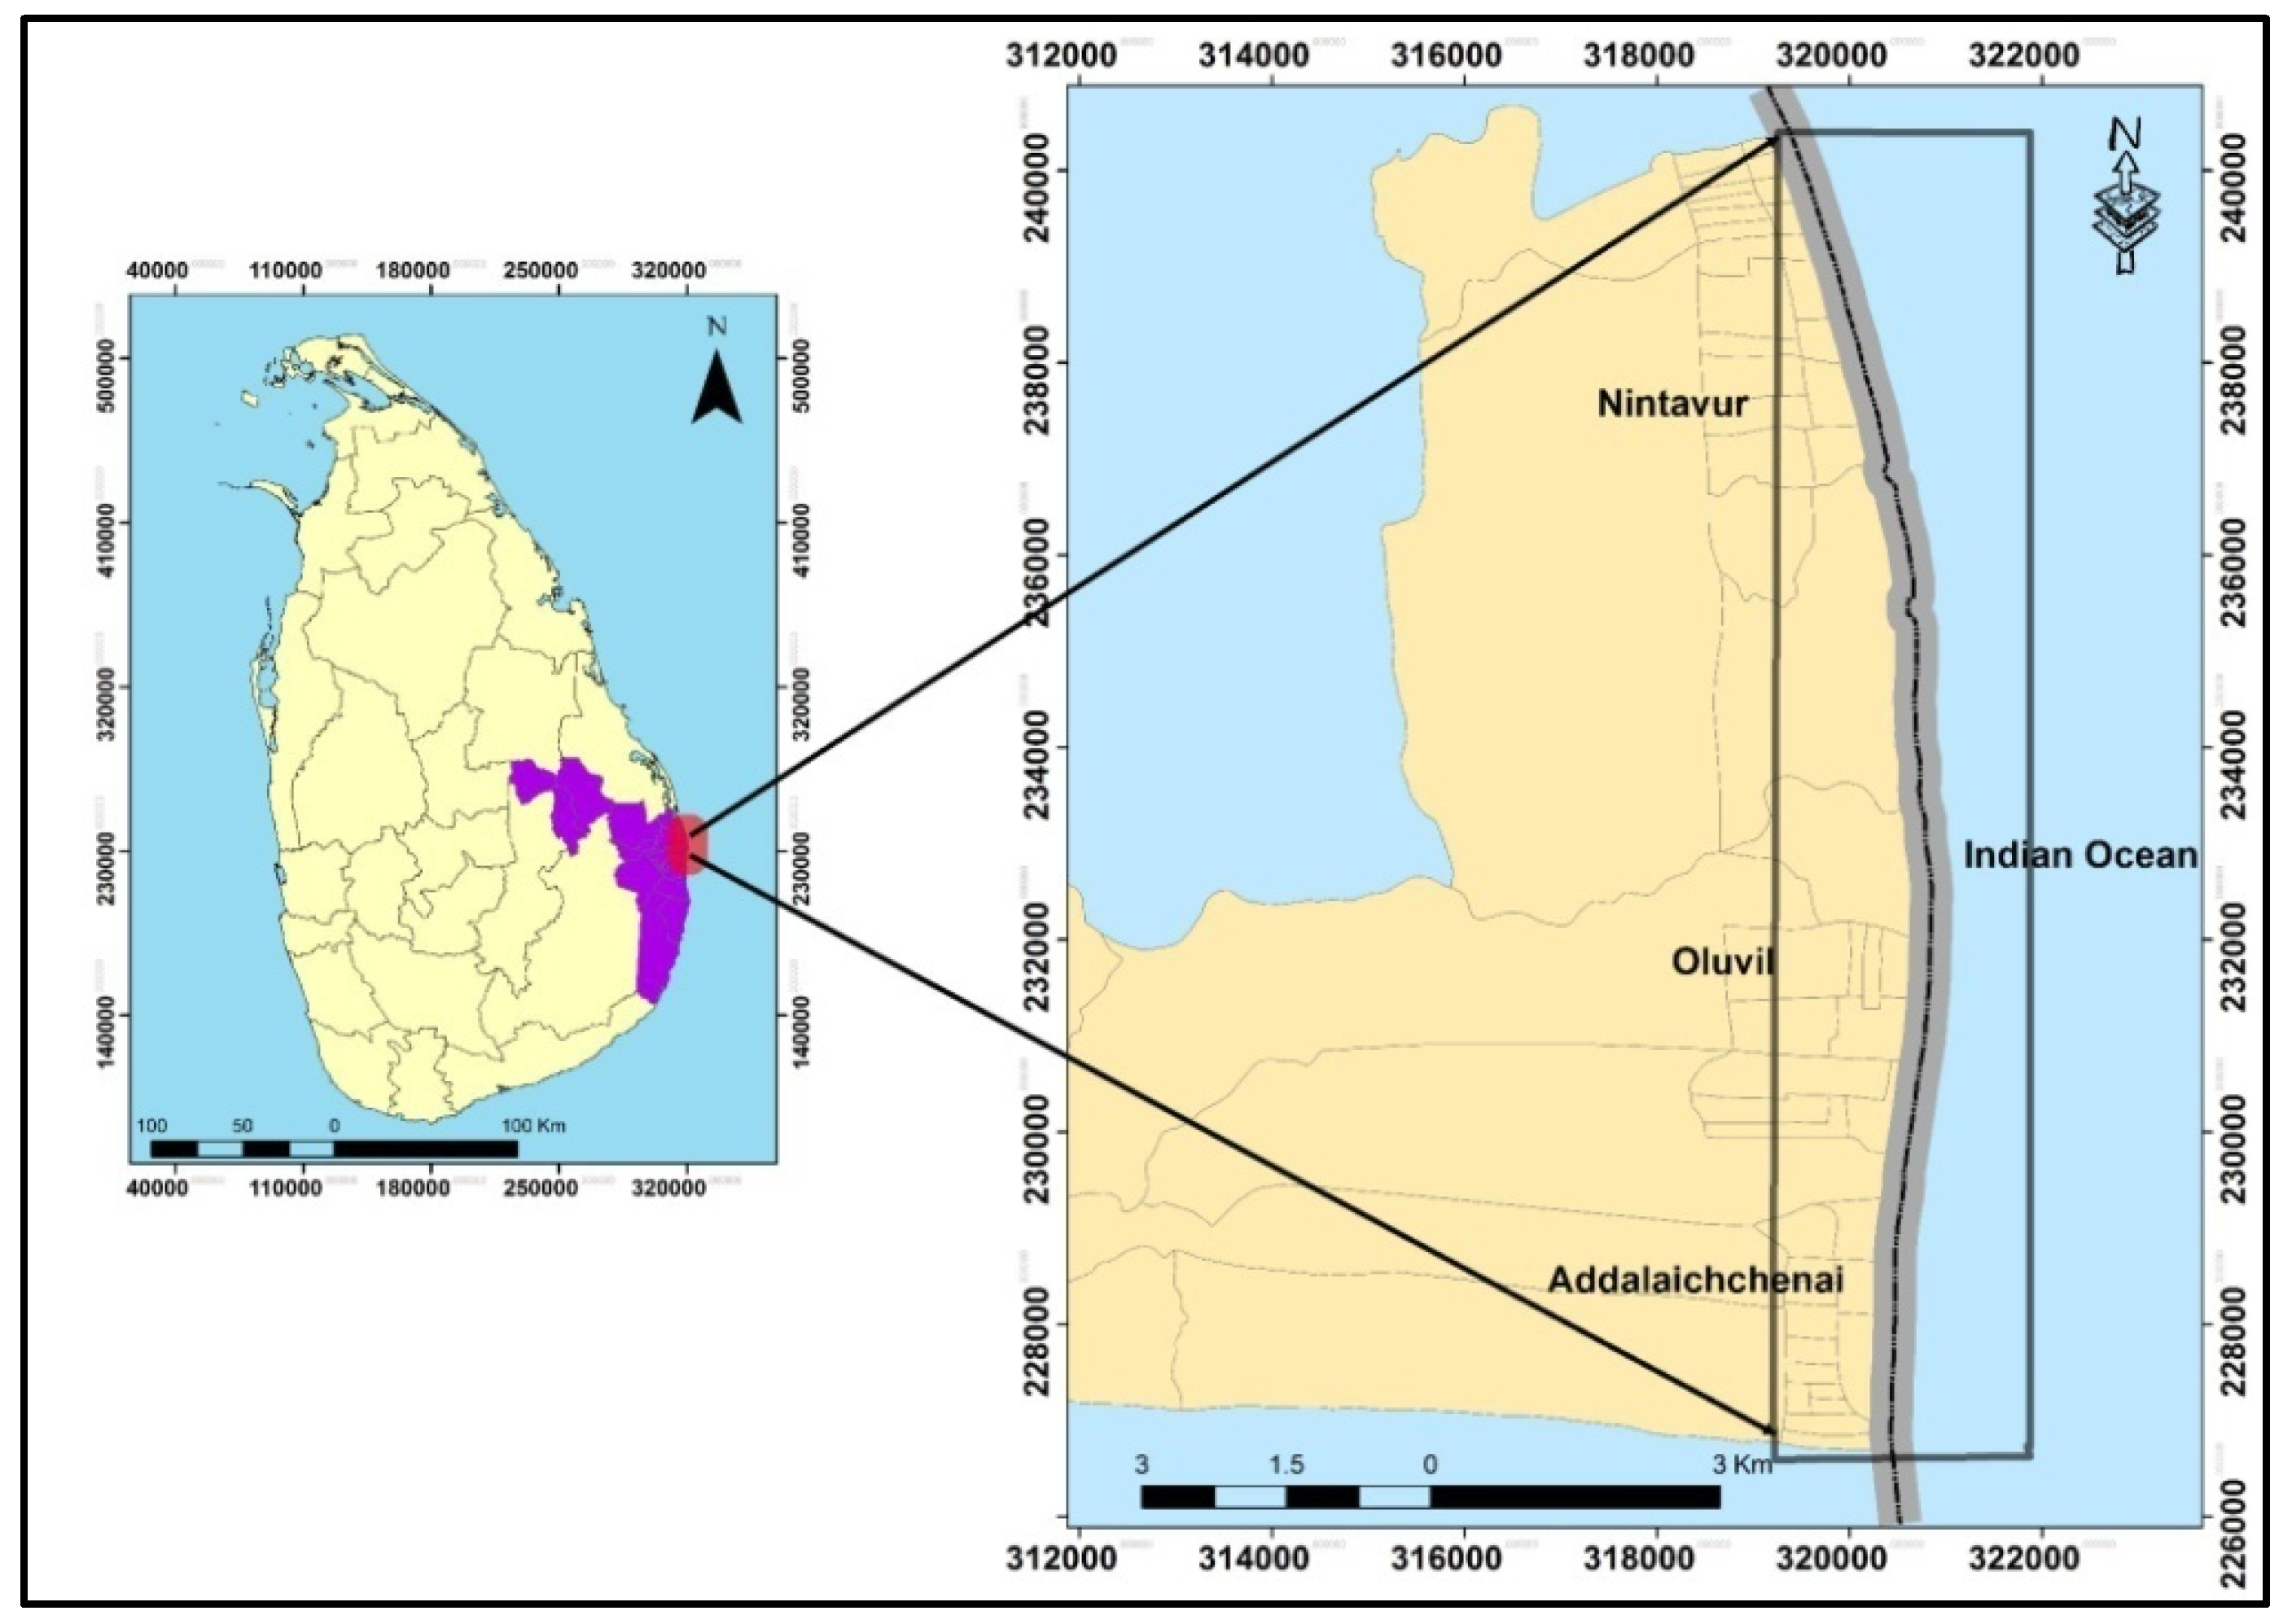
2. Study Area
2.1. Oceanographic and Climate Framework
2.2. Geographic and Geologic Framework
3. Materials and Methods
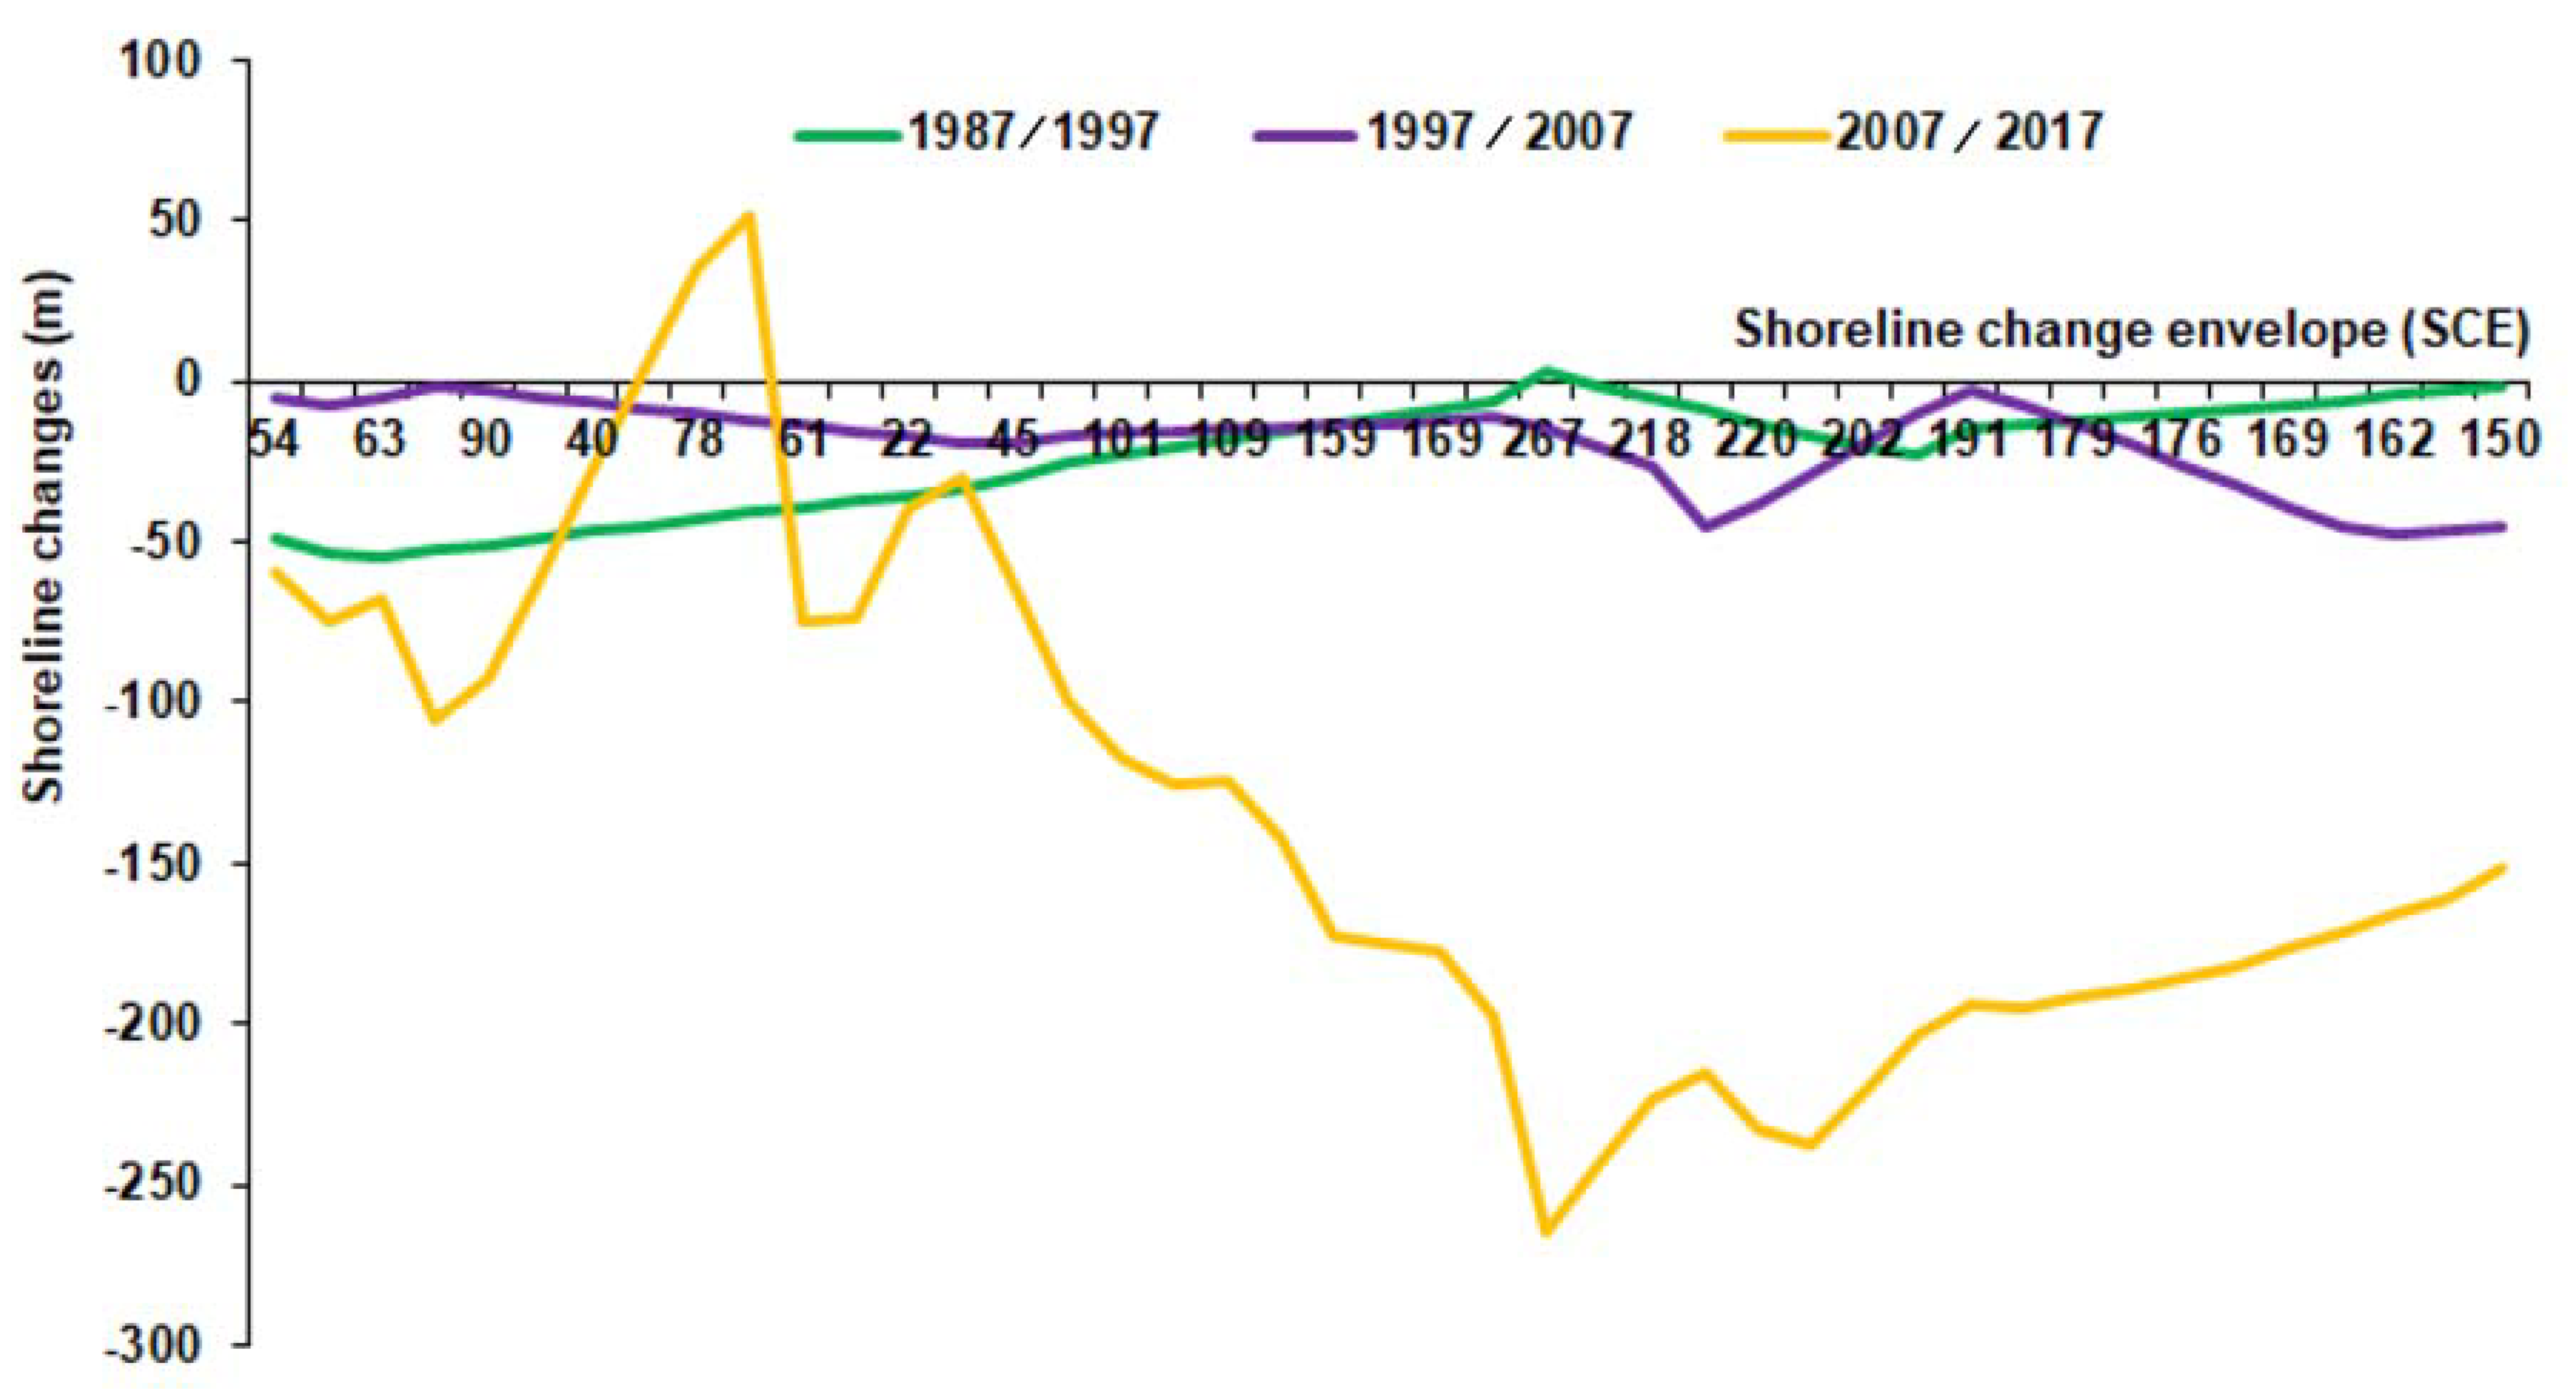
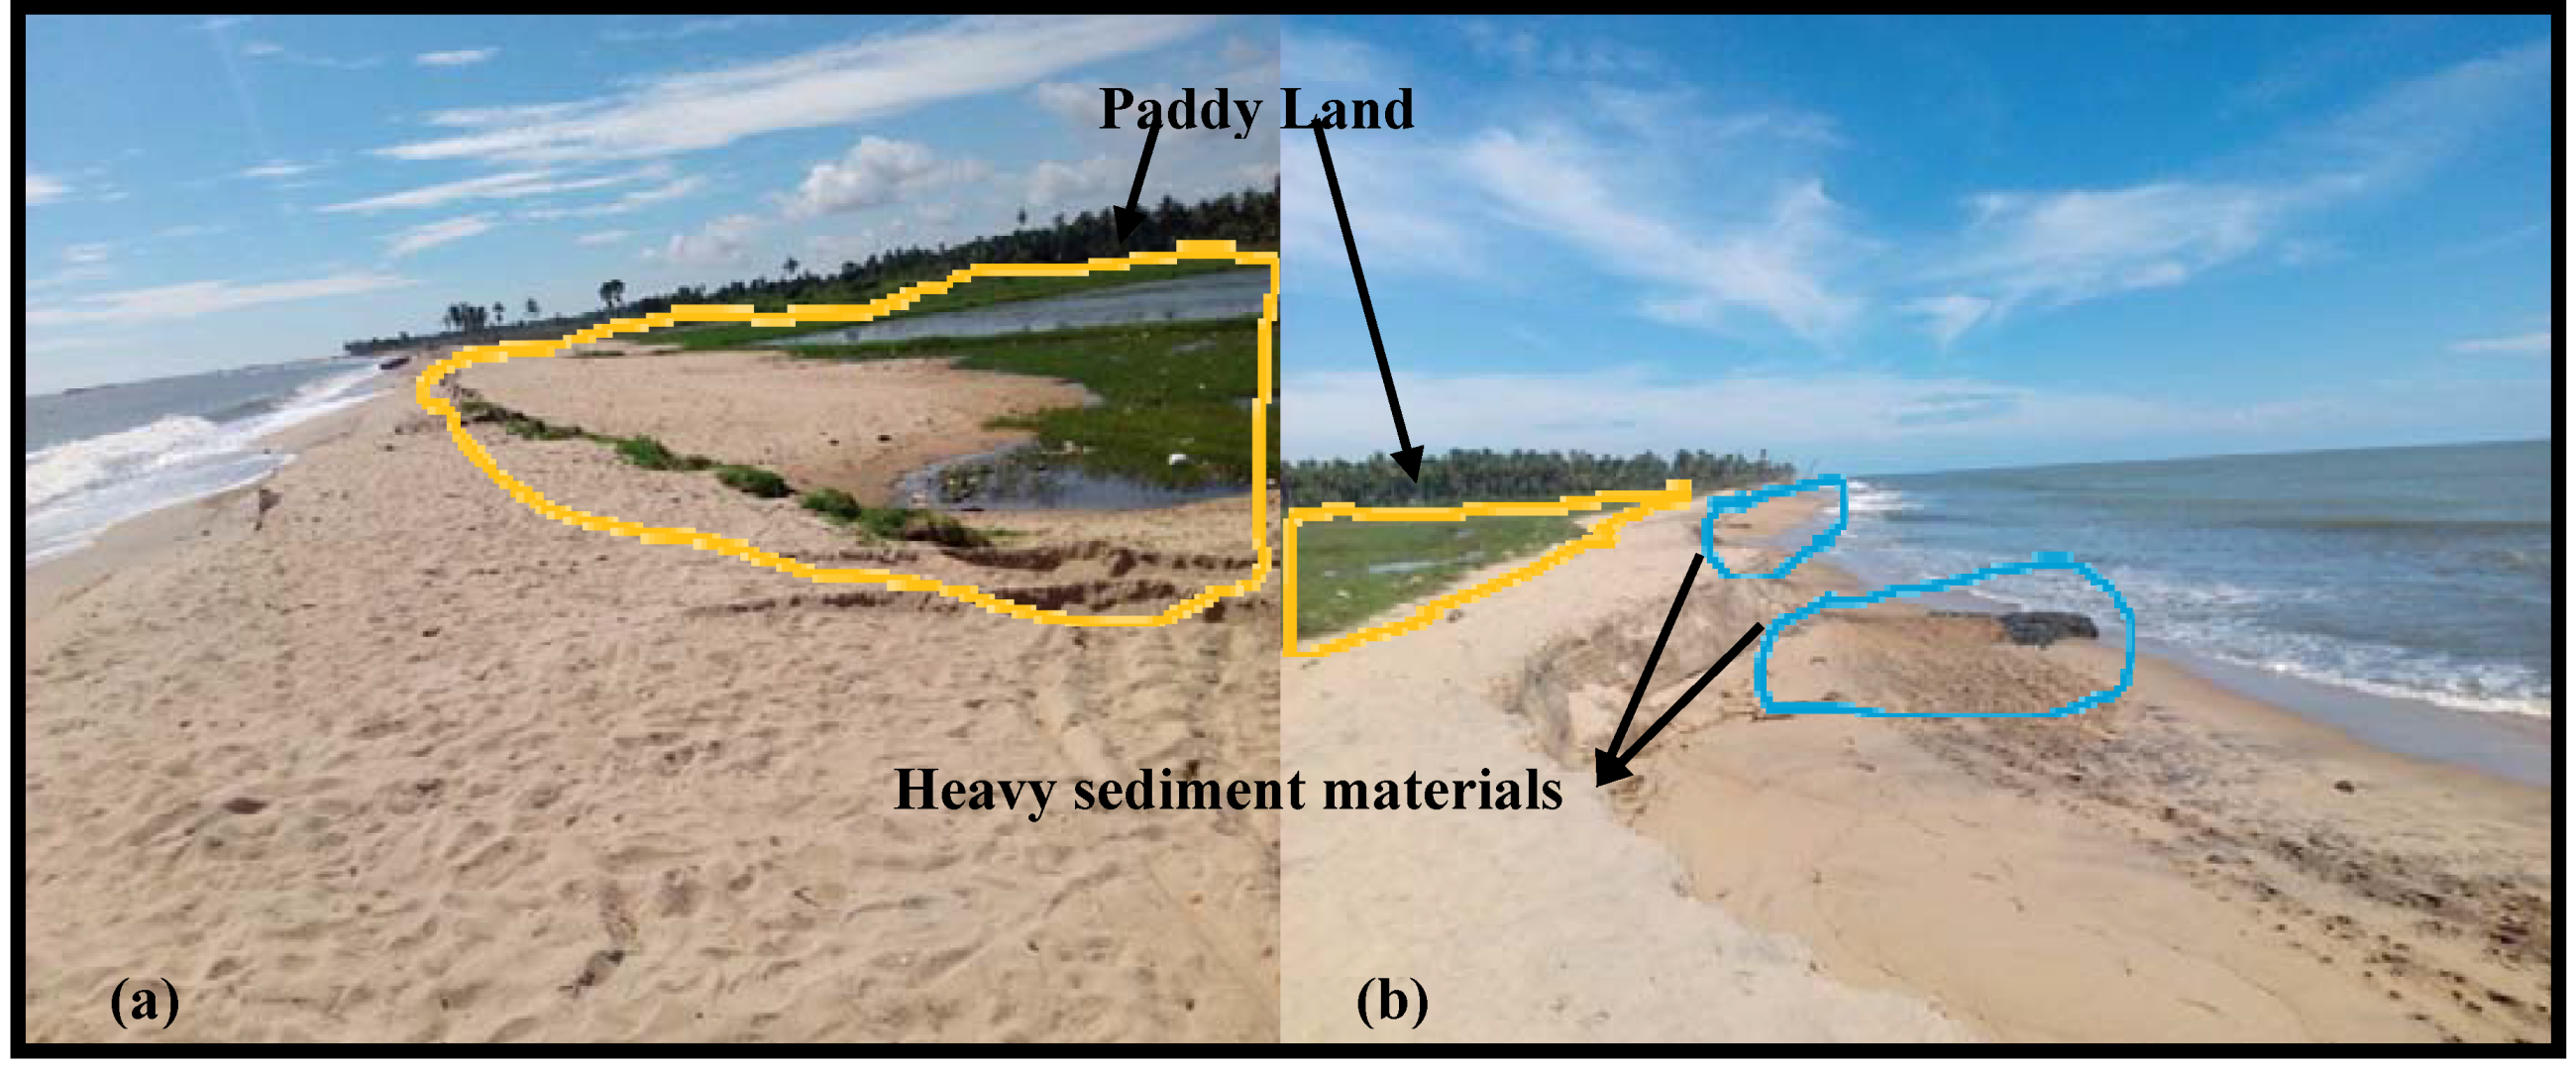
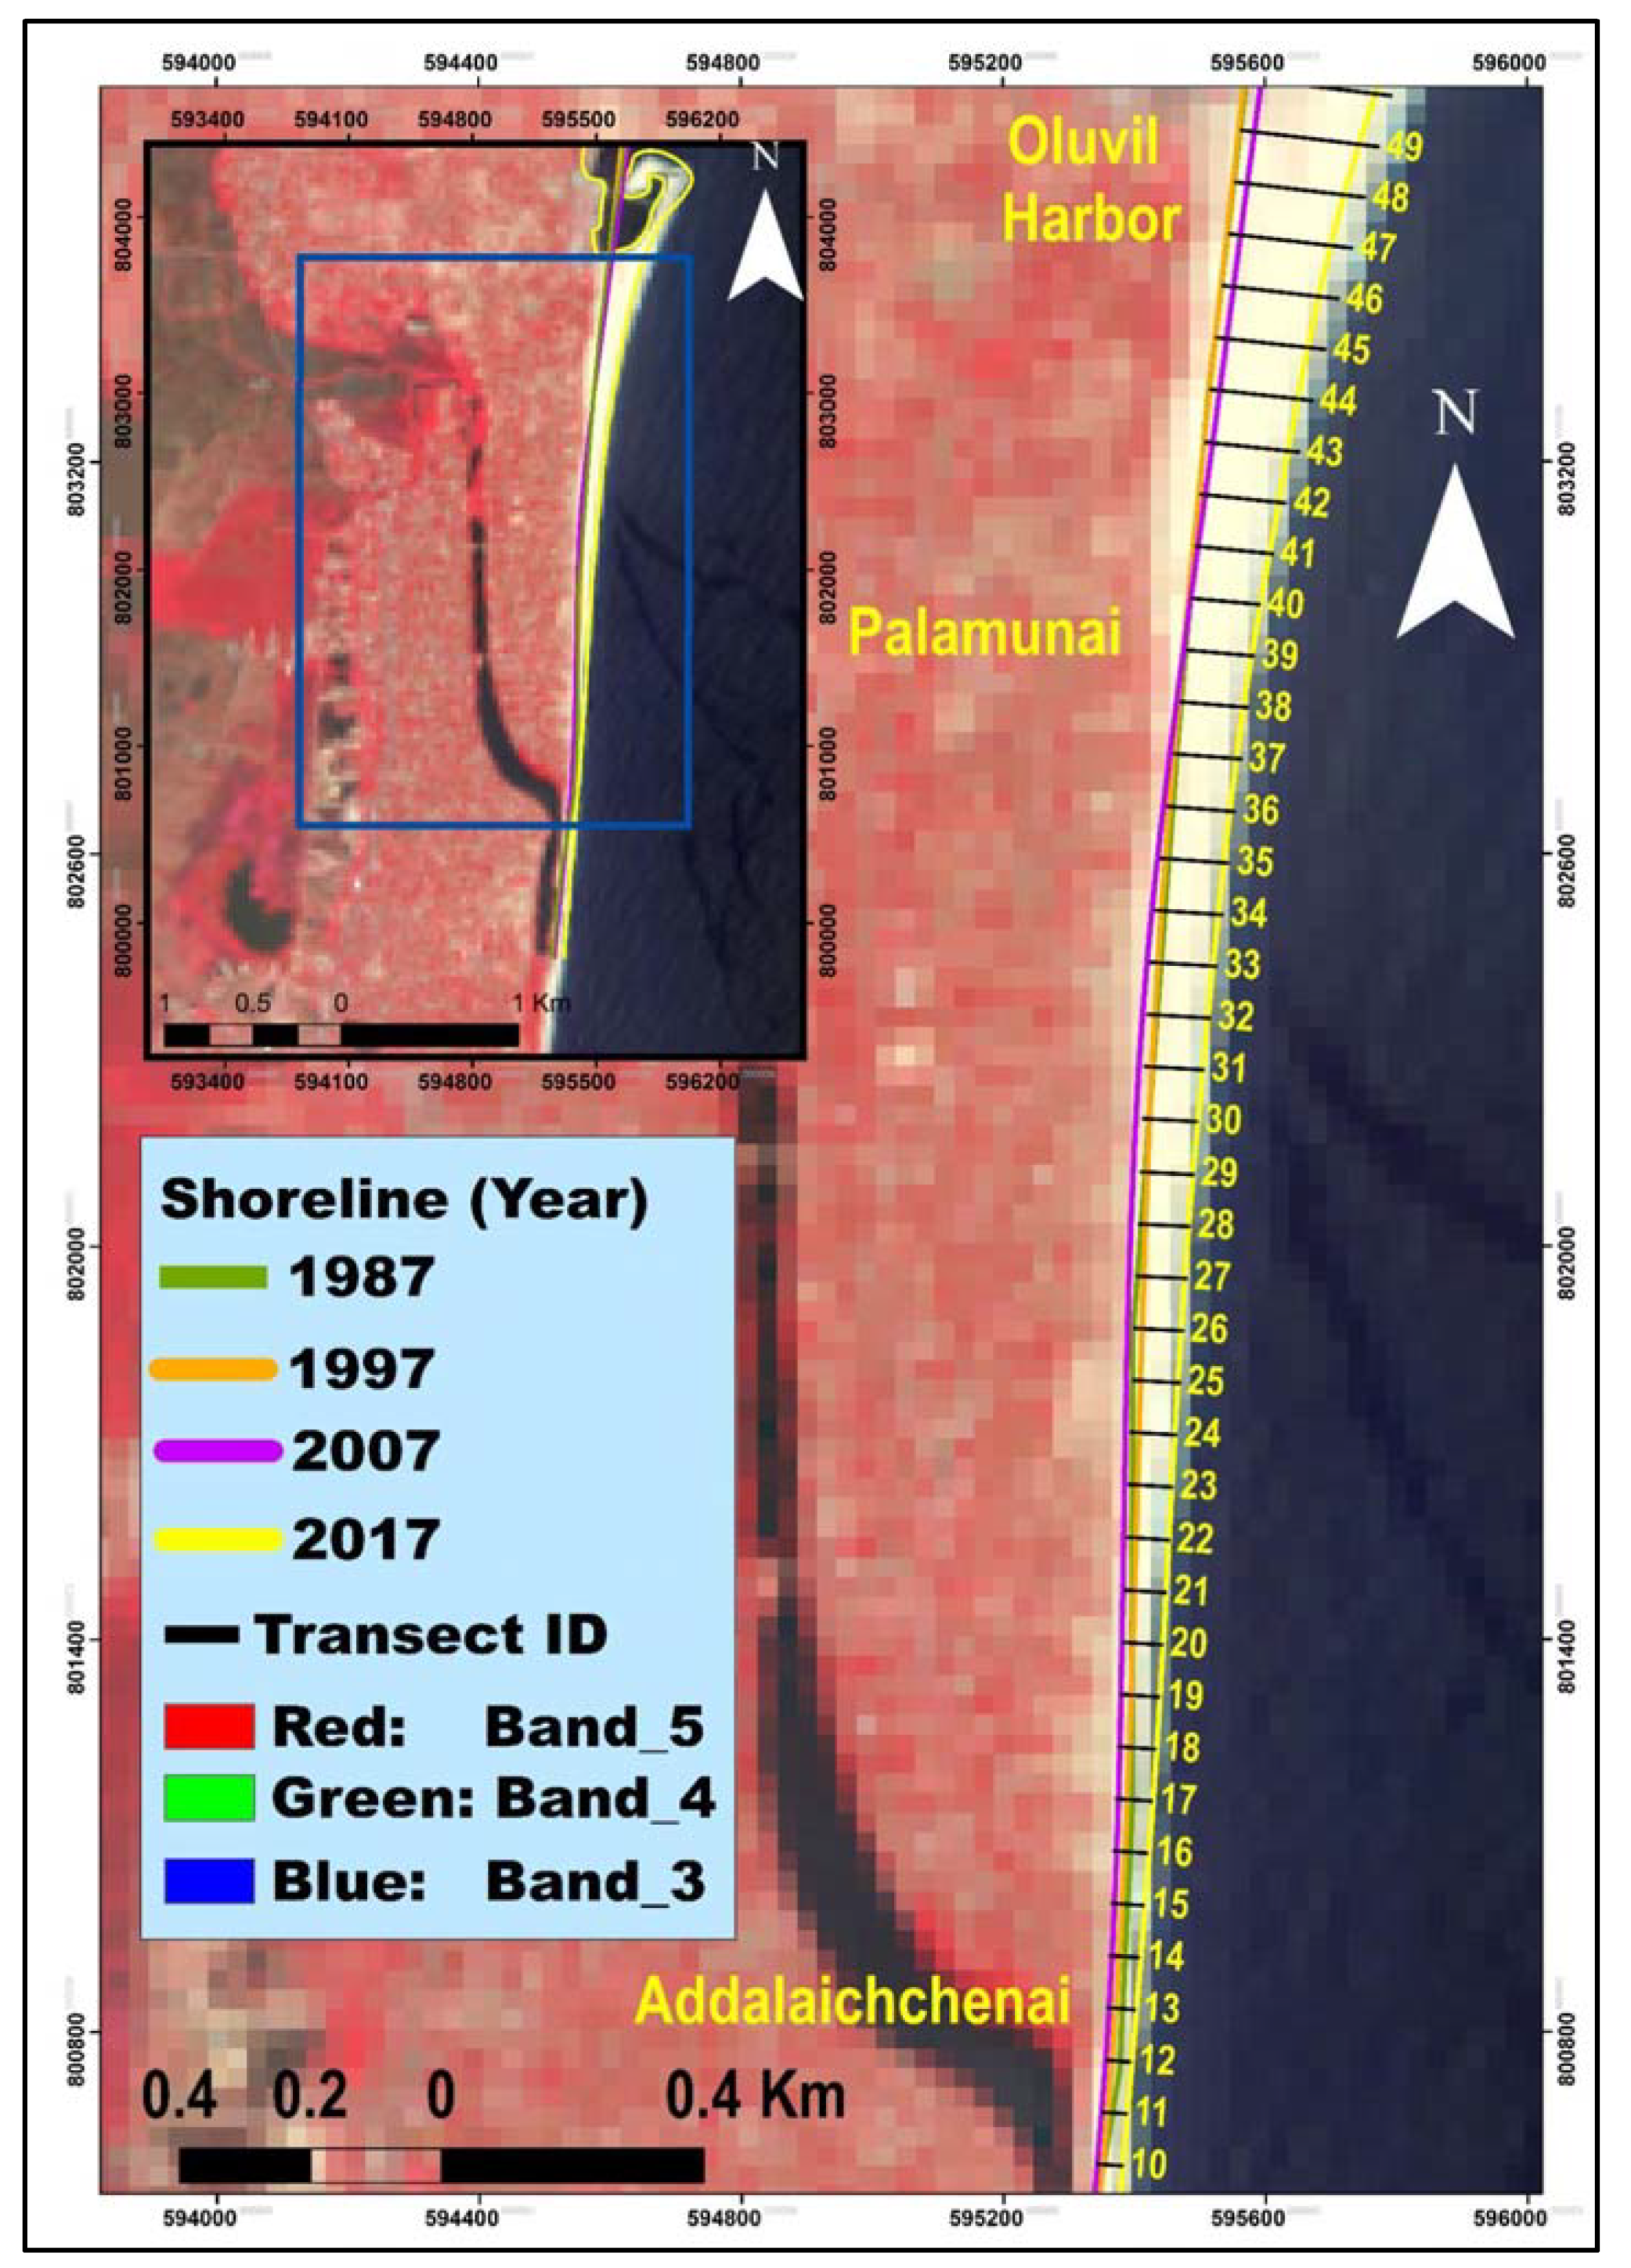
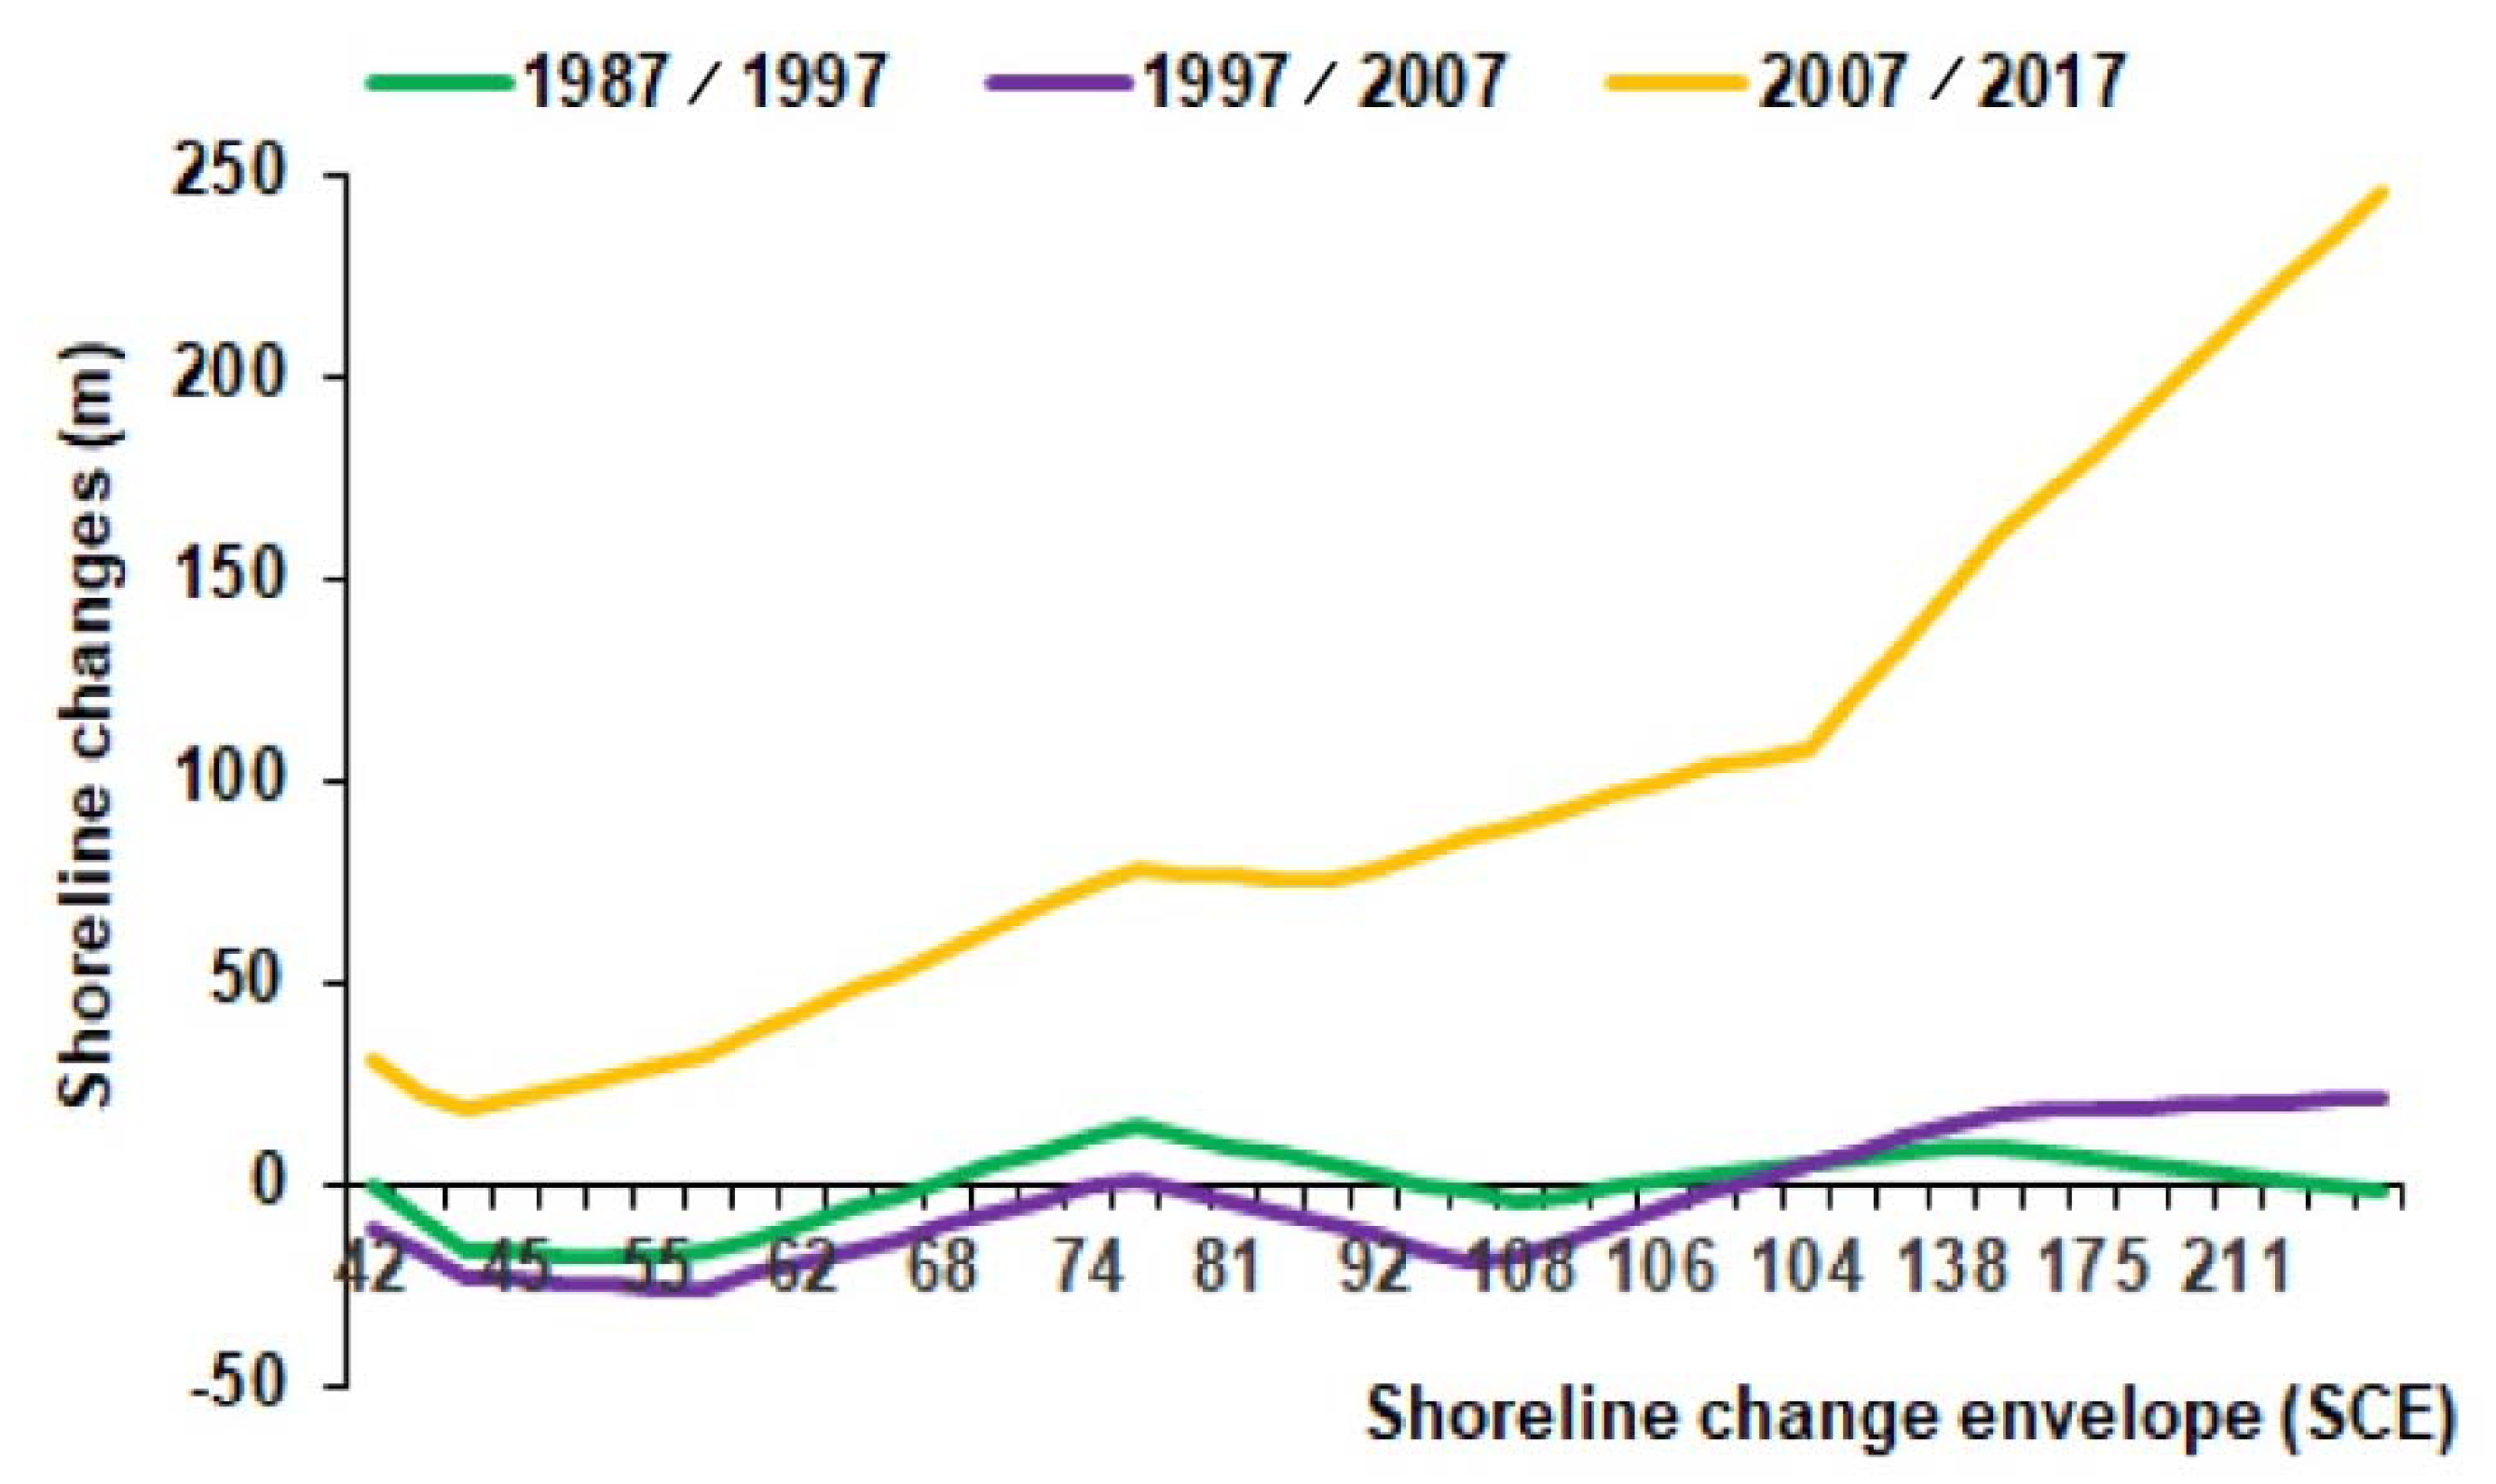
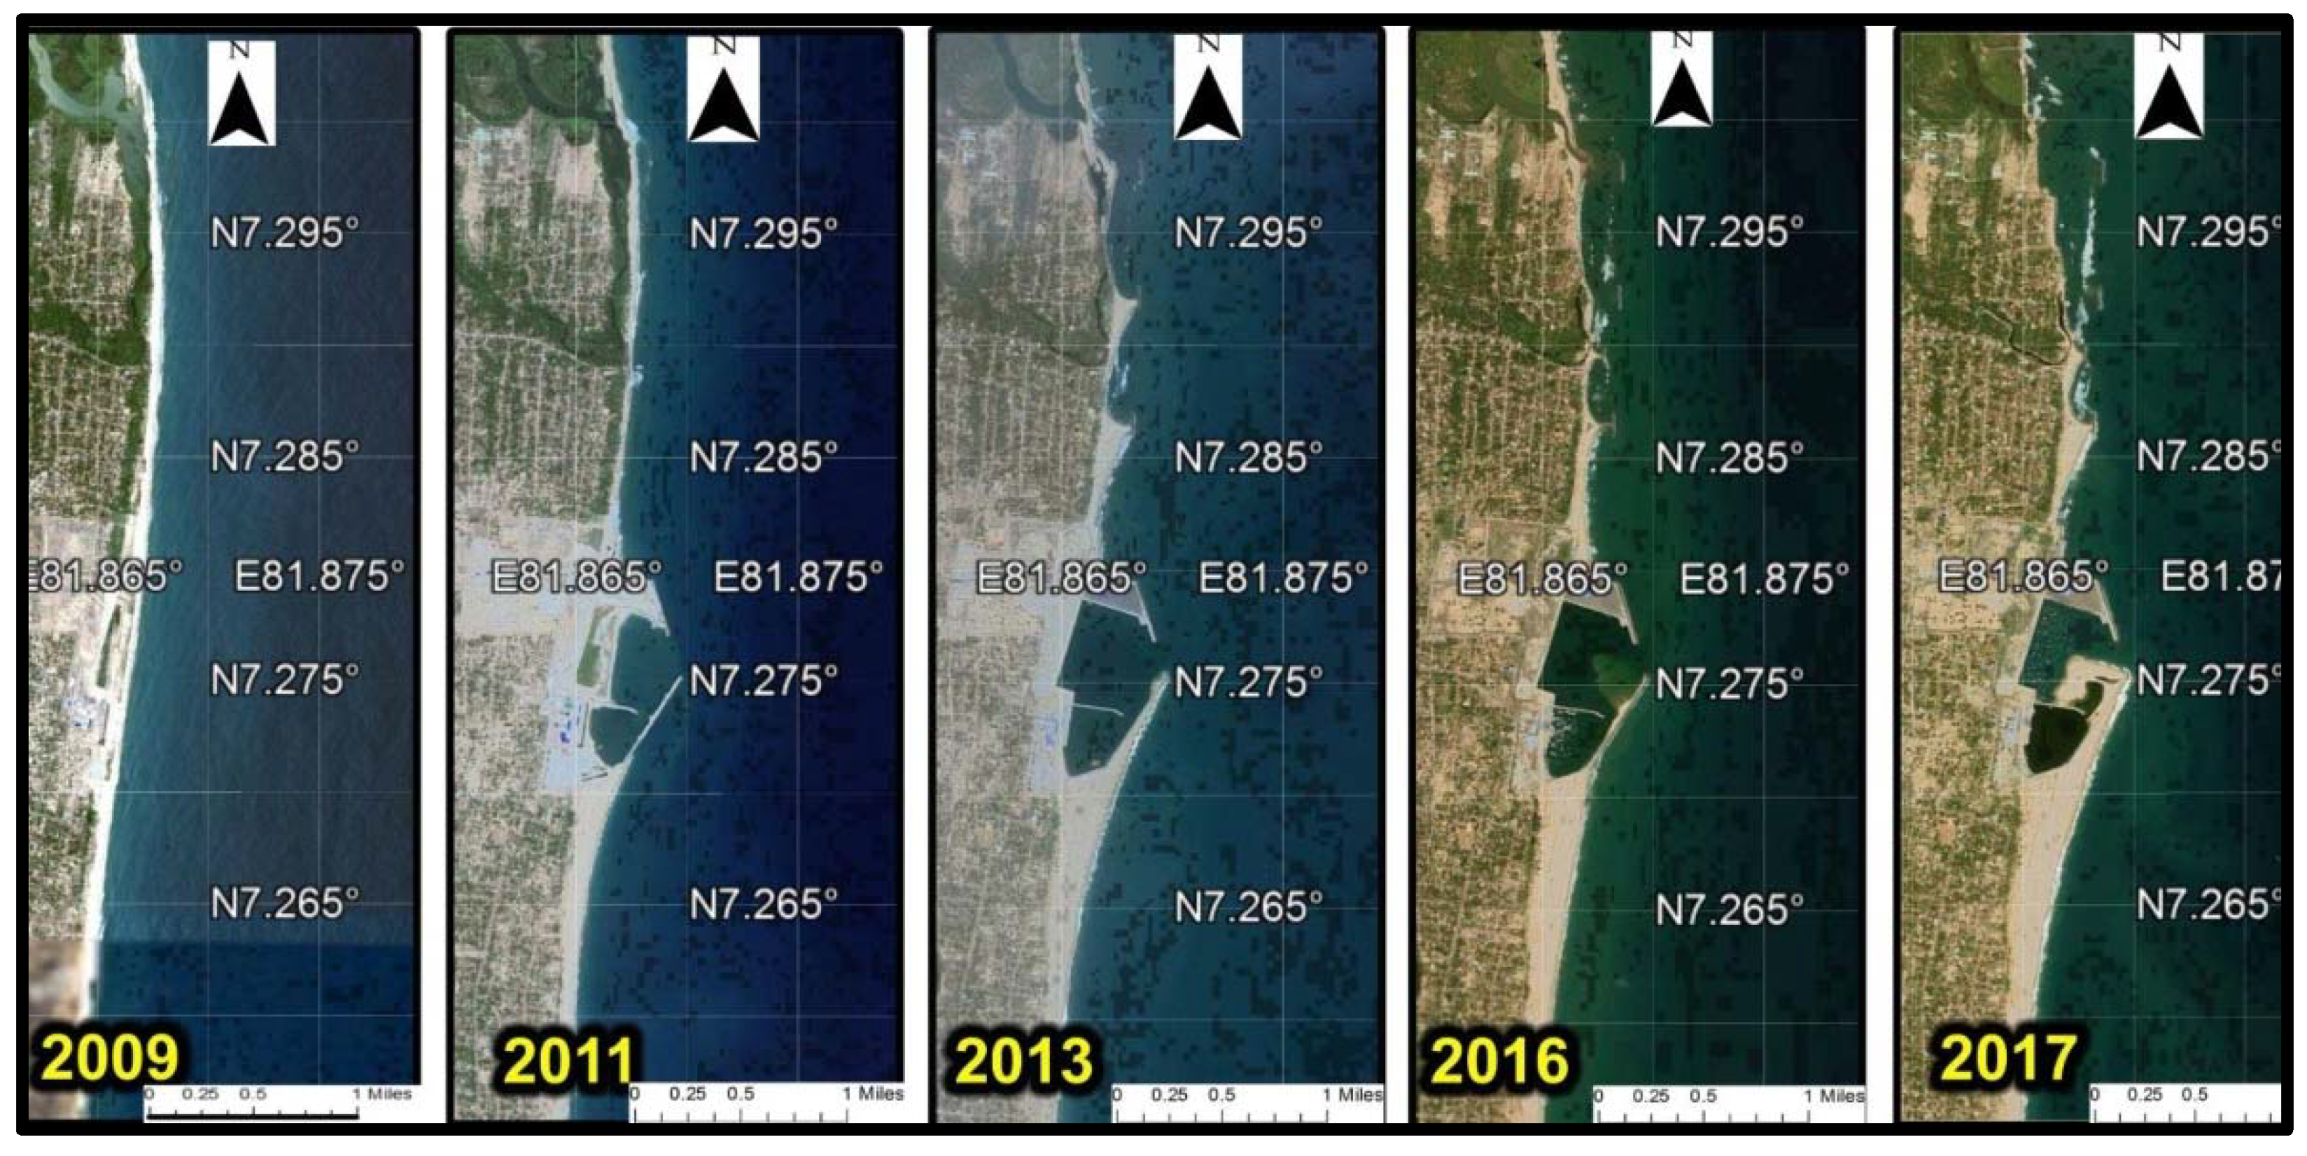
4. Results
5. Discussion
6. Conclusions
Author Contributions
Funding
Institutional Review Board Statement
Informed Consent Statement
Data Availability Statement
Conflicts of Interest
References
- Madurapperuma, B.; Dellysse, J. Coastal Fringe Habitat Monitoring Using Kite Aerial Photography: A Remote Sensing-based Case Study. J. Trop. For. Environ. 2018, 8. [Google Scholar] [CrossRef]
- Woodroffe, C. Coasts: Forms, Process and Evolution; Press Syndicate of the University of Cambridge University: Cambridge, UK, 2002. [Google Scholar]
- Boak, E.H.; Turner, I.L. Shoreline definition and detection: A review. J. Coast. Res. 2005, 21, 688–703. [Google Scholar] [CrossRef] [Green Version]
- Indiveri, A.; Marsico, A.; Pennetta, L. Erosion hazard assessment along the Capitolo coast (Monopoli, southern Italy). J. Maps 2013, 9, 274–278. [Google Scholar] [CrossRef]
- Vassilakis, E.; Papadopoulou-Vrynioti, K. Quantification of Deltaic Coastal Zone Change Based on Multi-Temporal High Resolution Earth Observation Techniques. ISPRS Int. J. Geo-Inf. 2014, 3, 18–28. [Google Scholar] [CrossRef]
- Nijamir, K.; Kaleel, M.I.M. Coastal morphodynamics associated natural Hazards: A case study of the Oluvil area in Ampara district, Sri Lanka. World Sci. News 2018, 97, 113–124. [Google Scholar]
- Vassilakis, E.; Tsokos, A.; Kotsi, E. Shoreline Change Detection and Coastal Erosion Monitoring Using Digital Processing of a Time Series of High Spatial Resolution Remote Sensing Data. Bull. Geol. Soc. Greece 2017, 50, 1747–1755. [Google Scholar] [CrossRef] [Green Version]
- Madurapperuma, B.D.; Dellysse, J.E.; Zahir, I.L.M.; Iyoob, A.L. Mapping shoreline vulnerabilities using kite aerial photographs at OluvilHarbour in Ampara. In Proceedings of the 7th International Symposium, SEUSL, Oluvil, Sri Lanka, 7–8 December 2017. [Google Scholar]
- Madurapperuma, B.; Lamping, J.; McDermott, M.; Murphy, B.; McFarland, J.; Deyoung, K.; Smith, C.; MacAdam, S.; Monroe, S.; Corro, L.; et al. Factors Influencing Movement of the Manila Dunes and Its Impact on Establishing Non-Native Species. Remote Sens. 2020, 12, 1536. [Google Scholar] [CrossRef]
- Ervita, K.; Marfai, M.A. Shoreline Change Analysis in Demak, Indonesia. J. Environ. Prot. 2017, 08, 940–955. [Google Scholar] [CrossRef] [Green Version]
- Gómez, C.; Wulder, M.; Dawson, A.G.; Ritchie, W.; Green, D.R. Shoreline Change and Coastal Vulnerability Characterization with Landsat Imagery: A Case Study in the Outer Hebrides, Scotland. Scott. Geogr. J. 2014, 130, 279–299. [Google Scholar] [CrossRef]
- Kannan, R.; Ramanamurthy, M.V.; Kanungo, A. Shoreline change monitoring in Nellore Coast at East Coast Andhra Pradesh District using Remote Sensing and GIS. IJIRST Int. J. Innov. Res. Sci. Technol. 2016, 2, 316–324. [Google Scholar]
- Madurapperuma, B.D.; Dellysse, J.E.; Zahir, I.L.M.; Iyoob, A.L. Mapping coastal fringe community variability of Pottuvil using high-resolution kite aerial photography. In Proceedings of the Peradeniya University International Research Session, Peradeniya, Sri Lanka, 24 November 2017; Volume 21. [Google Scholar]
- Madurapperuma, B.; Barger, J.; Collin, M.; Emerson, C.; Fleming, S.; Murphy, B. A geospatial recipe for identifying social values and fragmentation issues of the Friends of the Dunes Land Trust. Humboldt J. Soc. Rel. 2019, 41, 8–21. [Google Scholar]
- Masria, A.; Nadaoka, K.; Negm, A.; Iskander, M. Detection of Shoreline and Land Cover Changes around Rosetta Promontory, Egypt, Based on Remote Sensing Analysis. Land 2015, 4, 216–230. [Google Scholar] [CrossRef] [Green Version]
- Moore, L.J. Shoreline mapping techniques. J. Coast. Res. 2000, 161, 111–124. [Google Scholar]
- Lan, P.T.; Son, T.S.; Gunasekara, K.; Nhan, N.T.; Hien, L.P. Application of Remote Sensing and GIS technology for monitoring coastal changes in estuary area of the Red river system, Vietnam. J. Korean Soc. Surv. Geod. Photogramm. Cartogr. 2013, 31, 529–538. [Google Scholar] [CrossRef] [Green Version]
- Mathiventhan, T.; Jayasingam, T. Geomorphological changes along the East Coast of Sri Lanka. Intern. J. Res. Stud. Biosci. 2018, 6, 6–12. [Google Scholar]
- Dellysse, J.E.; Madurapperuma, B.D. Developing a coastal GIS model of Sri Lanka to pinpoint areas at risk of Tsunamis. IdeaFest: Interdis. J. Creat. Work. Res. Humboldt State Univ. 2018, 2, 44–52. [Google Scholar]
- Wijeratne, E.M.S.; Pattiaratchi, C.B. Sea Level Variability in Sri Lankan waters. Understanding Sea-level Rise and Variability, a World Climate Research Programme Workshop and a WCRP Contribution to the Global Earth Observation System of Systems. 2006. Available online: https://www.wcrp-climate.org (accessed on 4 August 2020).
- Koeppen, W. Das Geographische System der Klimate, Handbuch der Klimatologie [The Geographical System of the Climate, Handbook of Climatology]; Borntraeger: Berlin, Germany, 1936. [Google Scholar]
- Prasanna, H.M.I.; Gunathilaka, M.D.E.K.; Welikanna, D.R. Variability of the Sounding Datums Around Sri Lankan Coastline. Geospatial Information for a Smarter Life and Environmental Resilience; FIG: Hanoi, Vietnam, 2019. [Google Scholar]
- Frigaard, P.B.; Margheritini, L. Oluvil Port Development Project 3rd Party Opinion on Report by Lanka Hydraulic Institute Ltd.: Oluvil Port Development Project: Studies on Beach Erosion; Aalborg University: Aalborg, Denmark, 2011. [Google Scholar]
- Government of Sri Lanka (GOSL). Coast Conservation Act No.57 of 1981; Government of Sri Lanka: Sri Lanka, 1981.
- Nijamir, K.; Thennakoon, T.; Herath, H.J.R.; Kaleel, M.I.M. Exploring Physical and Human Induced Coastal Morphodynamics: A Study with Reference to Nintavur to Addalaichenai Coastal Areas of Ampara District, Sri Lanka. Acad. J. Interdiscip. Stud. 2021, 10, 347. [Google Scholar] [CrossRef]
- Ameer, F. Physical impacts of Oluvil harbour. In Proceedings of the 5th International Symposium 2015—IntSym, SEUSL, Oluvil, Sri Lanka, 7–8 December 2015; pp. 450–461. [Google Scholar]
- Wickramaratne, S.; Dissanayake, D.M.S.S.; Dharmadasa, M.D.V.S. Numerical Modelling of siltation and erosion issues at Oluvil Port—Sri Lanka. In Proceedings of the 8th International Conference on Coastal and Port Engineering in Developing Countries (PIANC-COPEDEC VIII), Chennai, India, 22–24 February 2012. [Google Scholar]
- Alesheikh, A.A.; Ghorbanali, A.; Nouri, N. Coastline change detection using remote sensing. Int. J. Environ. Sci. Technol. 2007, 4, 61–66. [Google Scholar] [CrossRef] [Green Version]
- Alahacoon, N.; Edirisinghe, M. Spatial Variability of Rainfall Trends in Sri Lanka from 1989 to 2019 as an Indication of Climate Change. ISPRS Int. J. Geo-Inf. 2021, 10, 84. [Google Scholar] [CrossRef]
- Samarasekara, R.S.M.; Sasaki, J.; Jayaratne, R.; Suzuki, T.; Ranawaka, R.; Pathmasiri, S.D. Historical changes in the shoreline and management of Marawila Beach, Sri Lanka, from 1980 to 2017. Ocean. Coast. Manag. 2018, 165, 370–384. [Google Scholar] [CrossRef] [Green Version]
- Dellysse, J.E.; Madurapperuma, B.D.; Kuruppuarachchi, K.A.J.M. Preliminary study on biomass mapping along the coastal zone of Hambantota region, Sri Lanka using Landsat imagery. In Proceedings of the Open University Research Sessions, Nawala, Nugegoda, 16–17 November 2017; pp. 497–500. [Google Scholar]


| Acquired Date | Sensor | Pixel Size (m) | Coordinate System/Datum Zone | Tidal Depth (cm) |
|---|---|---|---|---|
| 1987/1997 | Landsat 5 TM | 30 | WGS 84 UTM Zone 44 N | 30 to 90 [19] |
| 2007 | Landsat 7 ETM+ | |||
| 2017 | Landsat 8 OLI | |||
| 03/2009,12/2011, 08/2013, 04/2016,09/2017 | Google Earth Pro | 1 | WGS 84 UTM |
Publisher’s Note: MDPI stays neutral with regard to jurisdictional claims in published maps and institutional affiliations. |
© 2021 by the authors. Licensee MDPI, Basel, Switzerland. This article is an open access article distributed under the terms and conditions of the Creative Commons Attribution (CC BY) license (https://creativecommons.org/licenses/by/4.0/).
Share and Cite
Zahir, I.L.M.; Madurapperuma, B.; Iyoob, A.L.; Nijamir, K. Exploring the Ever-Changing Seashore Using Geoinformatics Technology. Earth 2021, 2, 544-555. https://doi.org/10.3390/earth2030032
Zahir ILM, Madurapperuma B, Iyoob AL, Nijamir K. Exploring the Ever-Changing Seashore Using Geoinformatics Technology. Earth. 2021; 2(3):544-555. https://doi.org/10.3390/earth2030032
Chicago/Turabian StyleZahir, Ibra Lebbe Mohamed, Buddhika Madurapperuma, Atham Lebbe Iyoob, and Kafoor Nijamir. 2021. "Exploring the Ever-Changing Seashore Using Geoinformatics Technology" Earth 2, no. 3: 544-555. https://doi.org/10.3390/earth2030032
APA StyleZahir, I. L. M., Madurapperuma, B., Iyoob, A. L., & Nijamir, K. (2021). Exploring the Ever-Changing Seashore Using Geoinformatics Technology. Earth, 2(3), 544-555. https://doi.org/10.3390/earth2030032