
Assessment of Precipitation Variability and Trends Based on Satellite Estimations for a Heterogeneous Colombian Region


1
Proyecto Cambio Climático, Universidad de la Costa, Calle 58 #55-66, Barranquilla 080002, Colombia
2
Gobernación del Magdalena, Cra. 1c #16-04, Santa Marta 470004, Colombia
3
Facultad de Ingeniería, Universidad del Magdalena, Carrera 32 No. 22-08, Santa Marta 470004, Colombia
4
Department of Civil and Environmental, Universidad de la Costa, Calle 58 #55-66, Barranquilla 080002, Colombia
*
Authors to whom correspondence should be addressed.
Hydrology 2021, 8(3), 128; https://doi.org/10.3390/hydrology8030128
Submission received: 31 May 2021
/
Revised: 12 July 2021
/
Accepted: 15 July 2021
/
Published: 27 August 2021
(This article belongs to the Special Issue Hydrology in the Caribbean Basin)
Abstract
:Adequate water resources management includes understanding patterns and spatiotemporal variability of precipitation, as this variable is determinant for ecosystems’ stability, food security, and most human activities. Based on satellite estimations validated through ground measurements from 59 meteorological stations, the objective of this study is to evaluate the long-term spatiotemporal variability and trends of the average monthly precipitation in the Magdalena Department, Colombia, for the 1981–2018 period. This heterogeneous region comprises many different ecoregions in its 23,188 km2 area. The analysis of spatial variability allowed for the determination of four different subregions based on the differences in the average values of precipitation and the degree of rainfall variability. The trend analysis indicates that the current rainfall patterns contradict previous estimates of a progressive decrease in annual averages due to climate change in the study region, as most of the department does not exhibit statistically significant trends, except for the Sierra Nevada de Santa Marta area, where this study found reductions between 10 mm yr−1 and 30 mm yr−1. The findings of this study also suggest the existence of some links between precipitation patterns with regional phenomena of climate variability and solar activity.
1. Introduction
The analysis of the spatial distribution of rainfall and its temporal trends is crucial for water resources management, farming productivity, and climate change mitigation [1]. Besides, the yearly and seasonal precipitation trends analysis offers intuitive information about the soil humidity dynamic in the non-irrigated land systems [2]. Accordingly, spatial pattern estimation of rainfall is the key for designing mitigation and response actions. To obtain appropriate conclusions and prudent speculations, evaluating the quality and homogeneity of the information registered by the weather stations is a necessary and critical process that should be performed before conducting a climate analysis [3].
Due to the direct and indirect impact on the ecosystems and agricultural production and health, precipitation is perhaps the most important climatic variable [4]. The highly variable patterns and the frequency of extreme events such as drought, flooding, and irregularities in the precipitation amount and its temporal distribution, allow us to associate this hydro meteorological variable with the major climate disasters that have drastic effects on food security and economic growth [5]. In this regard, the distribution of gauging stations of meteorological networks is sparse in many regions worldwide. Their distribution in rural areas and complex terrains is often insufficient for adequate areal rainfall estimation, justifying the use of interpolation techniques to analyze regional rainfall regimes [6].
Satellite-derived precipitation estimates constitute a promising source of supplementary information for improving the spatial estimation of rainfall [7], and they provide timely, repeatable, and cost-effective information at different time scales, particularly facilitating drought monitoring and feeding early warning systems [8,9]. Nevertheless, some uncertainty associated with the satellite estimation techniques can arise from sampling, algorithm errors, or even by the satellite instruments themselves [10]. These sources of uncertainty can affect the accuracy and reliability of the data used for different applications that depend on precipitation patterns, such as agriculture planning of hydropower generation. Therefore, an adequate assessment of the satellite precipitation products is required before their use in any application, utilizing ground measurements to evaluate their reliability and precision. However, as in most developing countries, the spatial distribution of hydrometeorological stations in Colombia is quite unequal, with half of them in the Andean region that corresponds to 19% of Colombian territory, while Amazonian and Orinoquia regions cover 57% of the area and have only about 12% of the stations [11].
Some recent studies that evaluate the performance of satellite rainfall estimations include the research by Elgamal et al. [12], who compared and merged two different satellite rainfall products from the Tropical Rainfall Measuring Mission (TRMM) in the same basin. Their results indicate that both the TRMM-3B42 and the TMPA do not produce a reliable estimation of the spatiotemporal rainfall patterns. Complex areas in mountain regions present a larger bias. These conclusions are similar to those from Cruz-Roa et al. [13], where they created rainfall maps through cokriging using ground data and elevation. Researchers have widely used satellite rainfall datasets for case studies in Colombia in recent years [14,15,16,17,18,19,20]. Baez-Villanueva et al. [21] analyzed the temporal and spatial evaluation of satellite rainfall data over Chile, Brazil, and Colombia using six different estimates: TRMM 3B42v7, TRMM 3B42RT, CHIRPSv2, CMORPHv1, PERSIANN-CDR, and MSWEPv2. Specifically in Colombia, they concluded that CHIRPSv2 exhibited the best performance in the daily and monthly timescales over the Magdalena River Basin, the largest and most important river in this country. Urrea et al. [4], using the time series recorded at 904 rain gauges from the Colombian hydrometeorological network managed by the Institute of Hydrology, Meteorology, and Environmental Studies (IDEAM), found that CHIRPS preserves important rainfall characteristics such as mean and seasonality in the daily, monthly, and annual time scales for the entire Colombian territory.
A few previously cited studies have focused on assessing rainfall cycles and trends, but none have studied the effects of climatic variability (CV) or climate change (CC) in the Magdalena Department. These studies are necessary because CC and CV represent a risk for Colombian agriculture, food security, and socio-economy [22,23]. The climate change evidence in Colombia has been described in several studies such as Vuille et al. [24], Ochoa and Poveda [25], Cantor Gómez [26], Carmona and Poveda [27], and Hurtado-Montoya and Mesa-Sánchez [19]. For instance, Ramírez-Villegas et al. [28] warn that by 2050, climate change will impact about 3.5 million people, affecting the 14% gross domestic product (GDP), corresponding to agriculture, employment, and agro-industries supply chains and food and nutritional security. Furthermore, a study by IDEAM forecasts that for 2100, annual average precipitation in the Colombian territory will decrease between 10% and 30% for the Amazonas, Vaupés, Caquetá, Bolívar, Sucre, Cesar, Magdalena, San Andrés, and Providencia Departments [29].
Located in the northern part of Colombia (and South America), the Magdalena Department is a heterogeneous area because it comprises several types of ecoregions in a relatively small territory. It includes coastal landscapes, forests, farmlands, the highest coastal mountain range in South America, and the wetlands and floodplains of the RAMSAR site Ciénaga Grande de Santa Marta (CGSM). This region is an important cattle raising and agricultural area of Colombia, producing export goods such as bananas, coffee, and oil palm.
For water resources management purposes, this complexity makes the Magdalena Department an attractive case study to assess long-term precipitation patterns. Previous studies have anticipated up to 30% decreases in the total annual average precipitation in this region [29,30], mainly in the northeast part of Sierra Nevada de Santa Marta (SNSM) and lesser in the south and northwest. The hypotheses of this work are: 1) the total annual precipitation presents cycles affected not only by El Niño/La Niña events and 2) the precipitation trends in the study area are heterogeneous.
This paper aims to evaluate the long-term (years 1981–2018) spatiotemporal variability and trends of average monthly precipitation in the Magdalena Department based on satellite estimations, using ground measurements to validate these datasets. The use of satellite estimations is to have a uniform database and evaluate its potential utilization in spatially distributed assessments in the study area. Based on findings of previous studies [11,21,31,32], the satellite precipitation data for this study are obtained from the Climate Hazards Group InfraRed Precipitation with Stations data version 2.0 (CHIRPS v2.0) from the University of California in Santa Barbara and the American Geological Service [19,20].
2. Data and Methods
2.1. Study Area
The Department of Magdalena is located in the north of Colombia, in the Caribbean Plains region between latitudes 08°56′ N and 11°30′ N and between longitudes 73°30′ W and 75° W (Figure 1), covering approximately 23,188 km2. It is formed by two geological formations: the mountain range (Sierra Nevada de Santa Marta—SNSM) to the northeast and the sedimentation mega-basin in the center and south of the territory. The former encompasses approximately 5625 km2, corresponding to almost a quarter of the Magdalena Department [33]. This mountain landscape is divided into three large basins: (1) rivers flowing to the Caribbean Sea (north), (2) rivers flowing to the CGSM (west), and (3) rivers flowing to the Cesar River. The sedimentation mega-basin located to the west and southwest of the Sierra Nevada de Santa Marta extends up to the Magdalena River, covering 76% of the department. In this area, two big geographical units exist: the central region, which comprises all the low hills systems (see Figure 1), and the remaining territory consisting of the water bodies (west and south) and urban centers [33]. The water resources are abundant (northern region), and the topography determines their distribution. Four hydrographic basins form the water resources network of the department.
The weather in the Magdalena Department is dry, with a mean temperature of 29 °C. The northeast trade winds exert a significant influence that modifies the higher temperatures in the department [34]. This region experiences an annual bi-modal cycle with two wet seasons: one in September to November (major rainy season), the other one in April to May (minor rainy season), and two dry periods, one in between December and March (major dry season), and the other from June to August (minor dry season), the latter caused by the drying effect of simultaneous northeast and southeast trade winds, also increasing the occurrence of extreme events in the area [35,36,37,38]. The lowest annual precipitations occur over the coastal belt, with less than 1000 mm per year. This bimodal behavior of the annual distribution of rainfall is driven by the latitudinal migration of the intertropical convergence zone [27,39,40] and its connection with the dynamics of the Caribbean Low-Level Jet (CLLJ), which might influence local precipitation patterns [38]. Additionally, interannual rainfall anomalies are strongly related to El Niño Southern Oscillation (ENSO) [39,40].
On the other hand, the plain region of the department has precipitation ranges between 1000 and 1500 mm. The precipitation increases to more than 2000 mm for the area between the vicinity of El Banco municipality (south) and Sierra Nevada (northeast) [34,41]. The region under the influence of the Ciénaga Grande de Santa Marta (CGSM) wetland system at the north of the department has a mean total annual precipitation (MTAP) < 500 mm; except for the SNSM [42]. The main economic activities of the Magdalena Department include agriculture, livestock, tourism, and seaports.
2.2. Ground Measurements of Rainfall
This research employs monthly precipitation records from 59 hydrometeorological stations to assess the reliability of the CHIRPS satellite rainfall database in the study area (Figure 1). This information is provided by IDEAM [43], the institution that manages and supervises the Colombian hydrometeorological network and the quality of the corresponding records. Table A1 in Appendix A describes the detailed features of these stations. Figure 2 displays the time ranges of rainfall available for these stations in the IDEAM database. As a result, this study considered 38 years of rainfall series, from January 1981 to December 2018. These time series present several gaps, but the validation process was carried out only for existing data points in both IDEAM and CHIRPS.
2.3. Satellite Data—CHIRPS v2.0
This research compares the time series of precipitations measured at IDEAM’s stations with the CHIRPS V2.0 database, developed by the Earth Resources Observation and Science Center from the Geological Service of the United States in collaboration with the Climate Hazards Group from the University of California. This version utilizes the TRMM Multi-Satellite Precipitation Analysis version 7 (TMPA 3B42 v7) to calibrate precipitation estimations worldwide from 1981 to the present. From satellite imagery and interpolated data from rainfall gauging stations, CHIRPS creates and provides long-term global precipitation data series with relatively low latency, high spatial resolution (0.05°), and reduced bias [31]. CHIRPS is based on the following five data sources: (1) the monthly precipitation climatology (CHPClim) dataset [44]; (2) the quasi-global geostationary thermal infrared (IR) satellite observations from two National Oceanic and Atmospheric Administration (NOAA) Centers, both with different spatiotemporal resolution; (3) the previously mentioned TRMM 3B42 v7 from NASA [45]; (4) atmospheric model rainfall fields from NOAA’s Climate Forecast System; (5) ground measurements obtained from several national and regional meteorological services [32]. The CHIRPS dataset was chosen for conducting this study given that IDEAM information was used for validating CHIRPS accuracy in complex terrains of tropical regions [31], and the relatively high correspondence (Pearson correlation coefficient = 0.97, mean average error = 38 mm) between these two datasets has been used in previous studies to assess the characteristics and implications of rainfall regimes in Colombia [11,15,46,47]. CHIRPS v2.0 dataset is available online at https://data.chc.ucsb.edu/products/CHIRPS-2.0/, (accessed on 15 December 2020). This research works with the pixels corresponding with the Magdalena Department, specifically monthly rainfall data for 1981–2018.
2.4. Methods
2.4.1. Statistical Validation of the Satellite Rainfall Database
For each weather station coordinate, the satellite rainfall time series for years 1981–2018 were extracted for the nearest grid point. Based on similar previous research [9,11,20,31,48,49], the statistical metrics of Spearman correlation coefficient (), mean absolute error (MAE), and bias are employed in the paired comparisons between the rain gauges measurements and CHIRPS data, according to Equations (1) to (3).
In these equations, is the difference between ranks of two samples and the ranks number. is the precipitation measured at the weather stations, represents the precipitation derived from satellite, and is the total number of data points. The authors did not fill the gaps in the IDEAM’s time series, and consequently, these missing points were excluded from the computations, an approach also followed by Lemma et al. [49].
2.4.2. Trend Detection and Spatiotemporal Variability of Precipitation
This research employs the coefficient of variation (CV) to assess precipitation’s spatial variability in annual and monthly timescales. A higher value of CV is an indicator of larger variability [50], with being the standard deviation and the mean precipitation for the selected time scales. CV is used to classify the variability degrees of rainfall events in the levels: low (CV ≤ 20), moderate (20 < CV ≤ 30), and high (CV > 30) [51].
To determine the spatial patterns in the temporal variability (zones with recurrent fluctuations), an empirical orthogonal functions (EOF) analysis is performed. This method is widely used in climate diagnosis, identifying the most dominant mode of variability associated with a set of variables [52], which can decompose climate factors into orthogonal eigenvectors. The principal components (PC) mode one-time series is correlated with rainfall to identify the significant regions over the Magdalena Department. They reflect the spatial and temporal distribution structure of meteorological factors [53]. Mathematically, the EOF analysis can be expressed as:
where is the function at space and at the time , the spatial structure concerning the temporal variance of is, therefore, represented by EOF (x, y). The key component that explains how each EOF’s amplitude varies with time is PC (t) [53]. The eigenvalues provide a percentage measurement of variance explained by each pattern. The power spectral density function is employed to identify temporal variability patterns, the main components obtained through the EOF [54].
The well-known Mann–Kendall (MK) test allows for the detection of monotonic trends in hydrological time series [55]. This nonparametric test adapts to missing values and is unaffected by atypical data, and its null hypothesis is the absence of trends. We can accept the alternative hypothesis that indicates the existence of a monotonic trend in the time series only if p < α, at the test significance level α [56]. The adopted significance in this study was assumed as 0.05, which, in a two-tailed test (α/2), corresponds to |Z| = 1.96 [57].
The MK test value is:
where sign equals to:
The values Xj and Xk in Equation (7) are measurements corresponding to a time j and k, and n is the number of events. To estimate the variance of S:
In Equation (8), n: number of observations; m: number of data pairs in the series; ti: number of ties at the timestep i [55,57]. Hamed and Ramachandra Rao [58] proposed a modified version of the MK test (MMK), which is a better alternative than the original MK test for detecting trends in time series exhibiting autocorrelation, a common characteristic in hydrological time series. The difference is in the formula to calculate the variance, which for the MMK test:
where Var(S)* is the modified variance. With corresponding to the lag-k autocorrelation coefficient of the ranks of the data, the correction factor n/n* is:
To determine the significance of the trend, both MMK and MK follow what is presented in Equation (11):
The trend analysis employs the Theil–Sen slope estimator (SS), a nonparametric metric that approximates the trends’ magnitude [56]. This metric is determined by the slopes of the lines connecting the data pairs (N), with their values obtained through the following equation:
Finally, the arrangement of the Q values in ascending order allows for the computation of the median using the equation:
3. Results
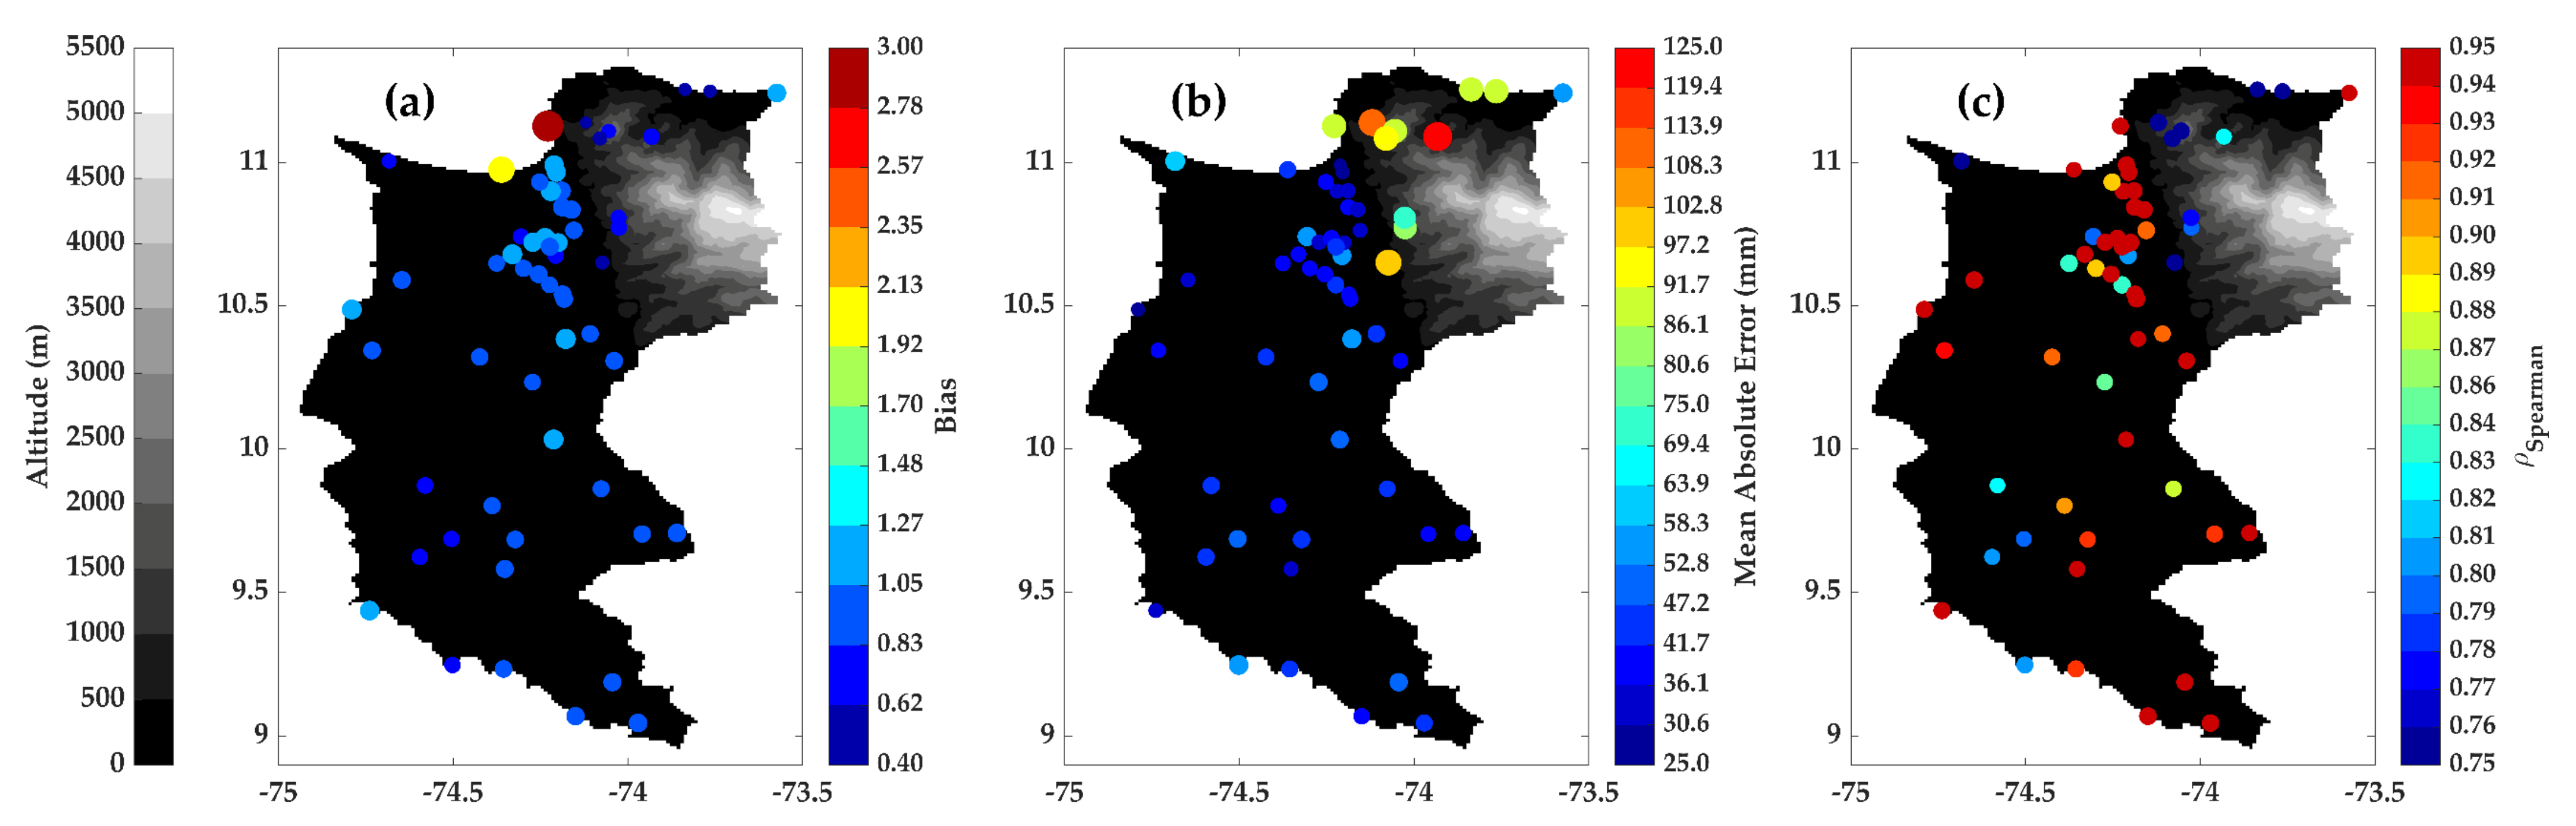
Figure 3 summarizes the performance metrics for the 59 stations under consideration, with a 95 % confidence level. In general, these metrics indicate that the CHIRPS v2.0 product tends to slightly underestimate the observed monthly precipitation, which is consistent with the small values of bias that dominate the map (average bias = 0.97). On the other hand, all exhibit high correlations [59], suggesting a good correspondence between the hydrometeorological stations and satellite rainfall estimations.
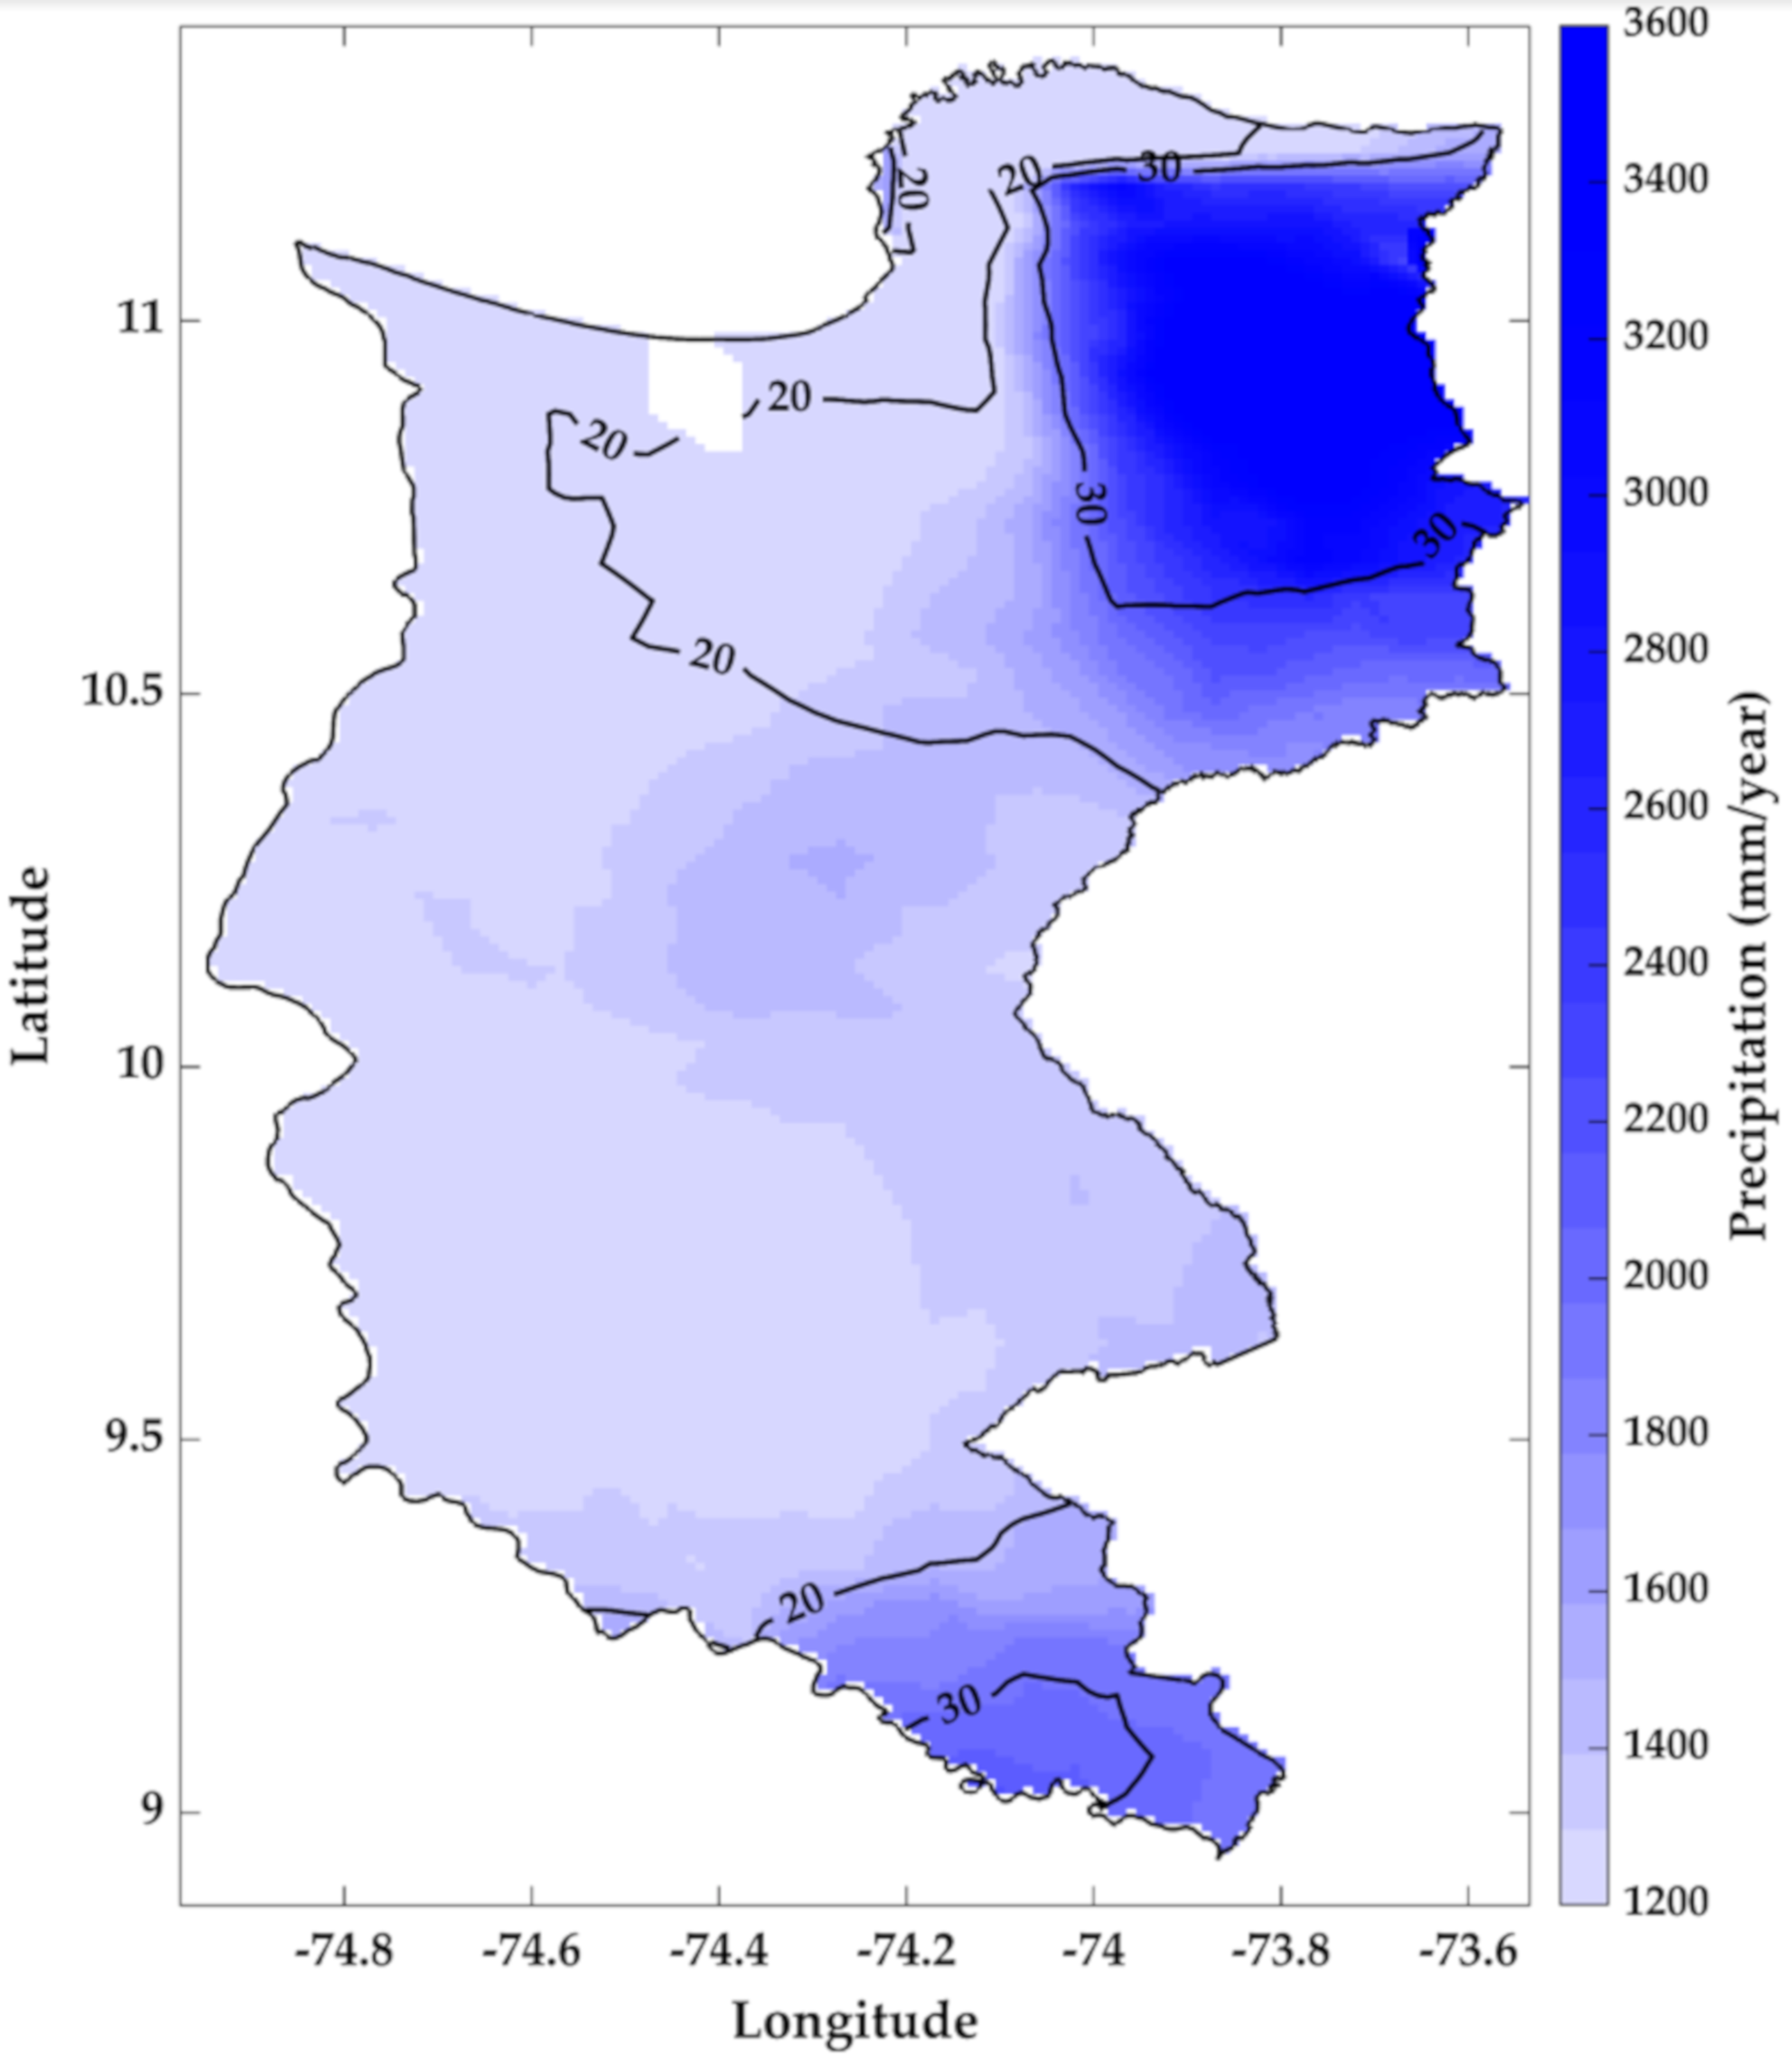
The mean total annual precipitation (Figure 4) suggests that the geomorphology of the study area influences the spatial patterns: the RAMSAR area, SNSM, hills (central), and the flatlands and water bodies (west). The spatial distribution of the total annual precipitation average and the coefficient of variation for the Magdalena Department exhibited some characteristics that facilitated the identification of four subregions. Subregion 1 exhibits a high-precipitation (>2500 mm yr−1) and high-variability (CV > 30 mm) zone, and it is located in the northeast of the Department (SNSM). In most cases, precipitation in this area has an orographic nature, determined by the SNSM mountain range that acts as a natural barrier for the humid air masses from the Caribbean Sea [60]. Subregion 2 corresponds to a low-precipitation (< 1500 mm yr−1) and low-variability (CV < 20) zone, and it covers the central region of the department in a longitudinal gradient. Subregion 3 has intermediate precipitations (1500 mm yr−1 ≤ precipitation ≤ 2500 mm yr−1) with moderate coefficients of variation; however, in the vicinity of the Ciénaga de Chilloa (south of the department, see Figure 1), high variability was evidenced. This waterbody is located in the south of the department and receives the influence of the La Mojana region, an alluvial delta and a wetlands system characterized by high precipitation, covering 5500 km2 [61]. Finally, Subregion 4 extends on the coastal zone of the department and shows a low-rainfall latitudinal gradient that decreases with the proximity to the sea (<1000 mm yr−1); this is mainly explained by the presence of dry and warm katabatic winds. Even though the sea breeze helps to soften the temperature effects, it also directs the clouds to the SNSM region, generating dry areas in the process.
The maps of average monthly precipitation (Figure 5) allow for the identification of the prevalence of two zones. The first is located in the northeast (SNSM), with precipitation > 250 mm month-1 and high variability from April to November. The second one is the coastal zone with precipitation < 50 mm month -1 and low variability all year. Thus, the precipitation regime follows the behavior previously described in the case study section [35,36,37,38]. The analysis of CV (Figure 5, see contours) showed high variability in the SNSM area (CV > 60), except in the dry season. In other regions, CV ranges between low and moderate all year. However, during March, the results indicate high variability in the central part of the department with a CV > 60.
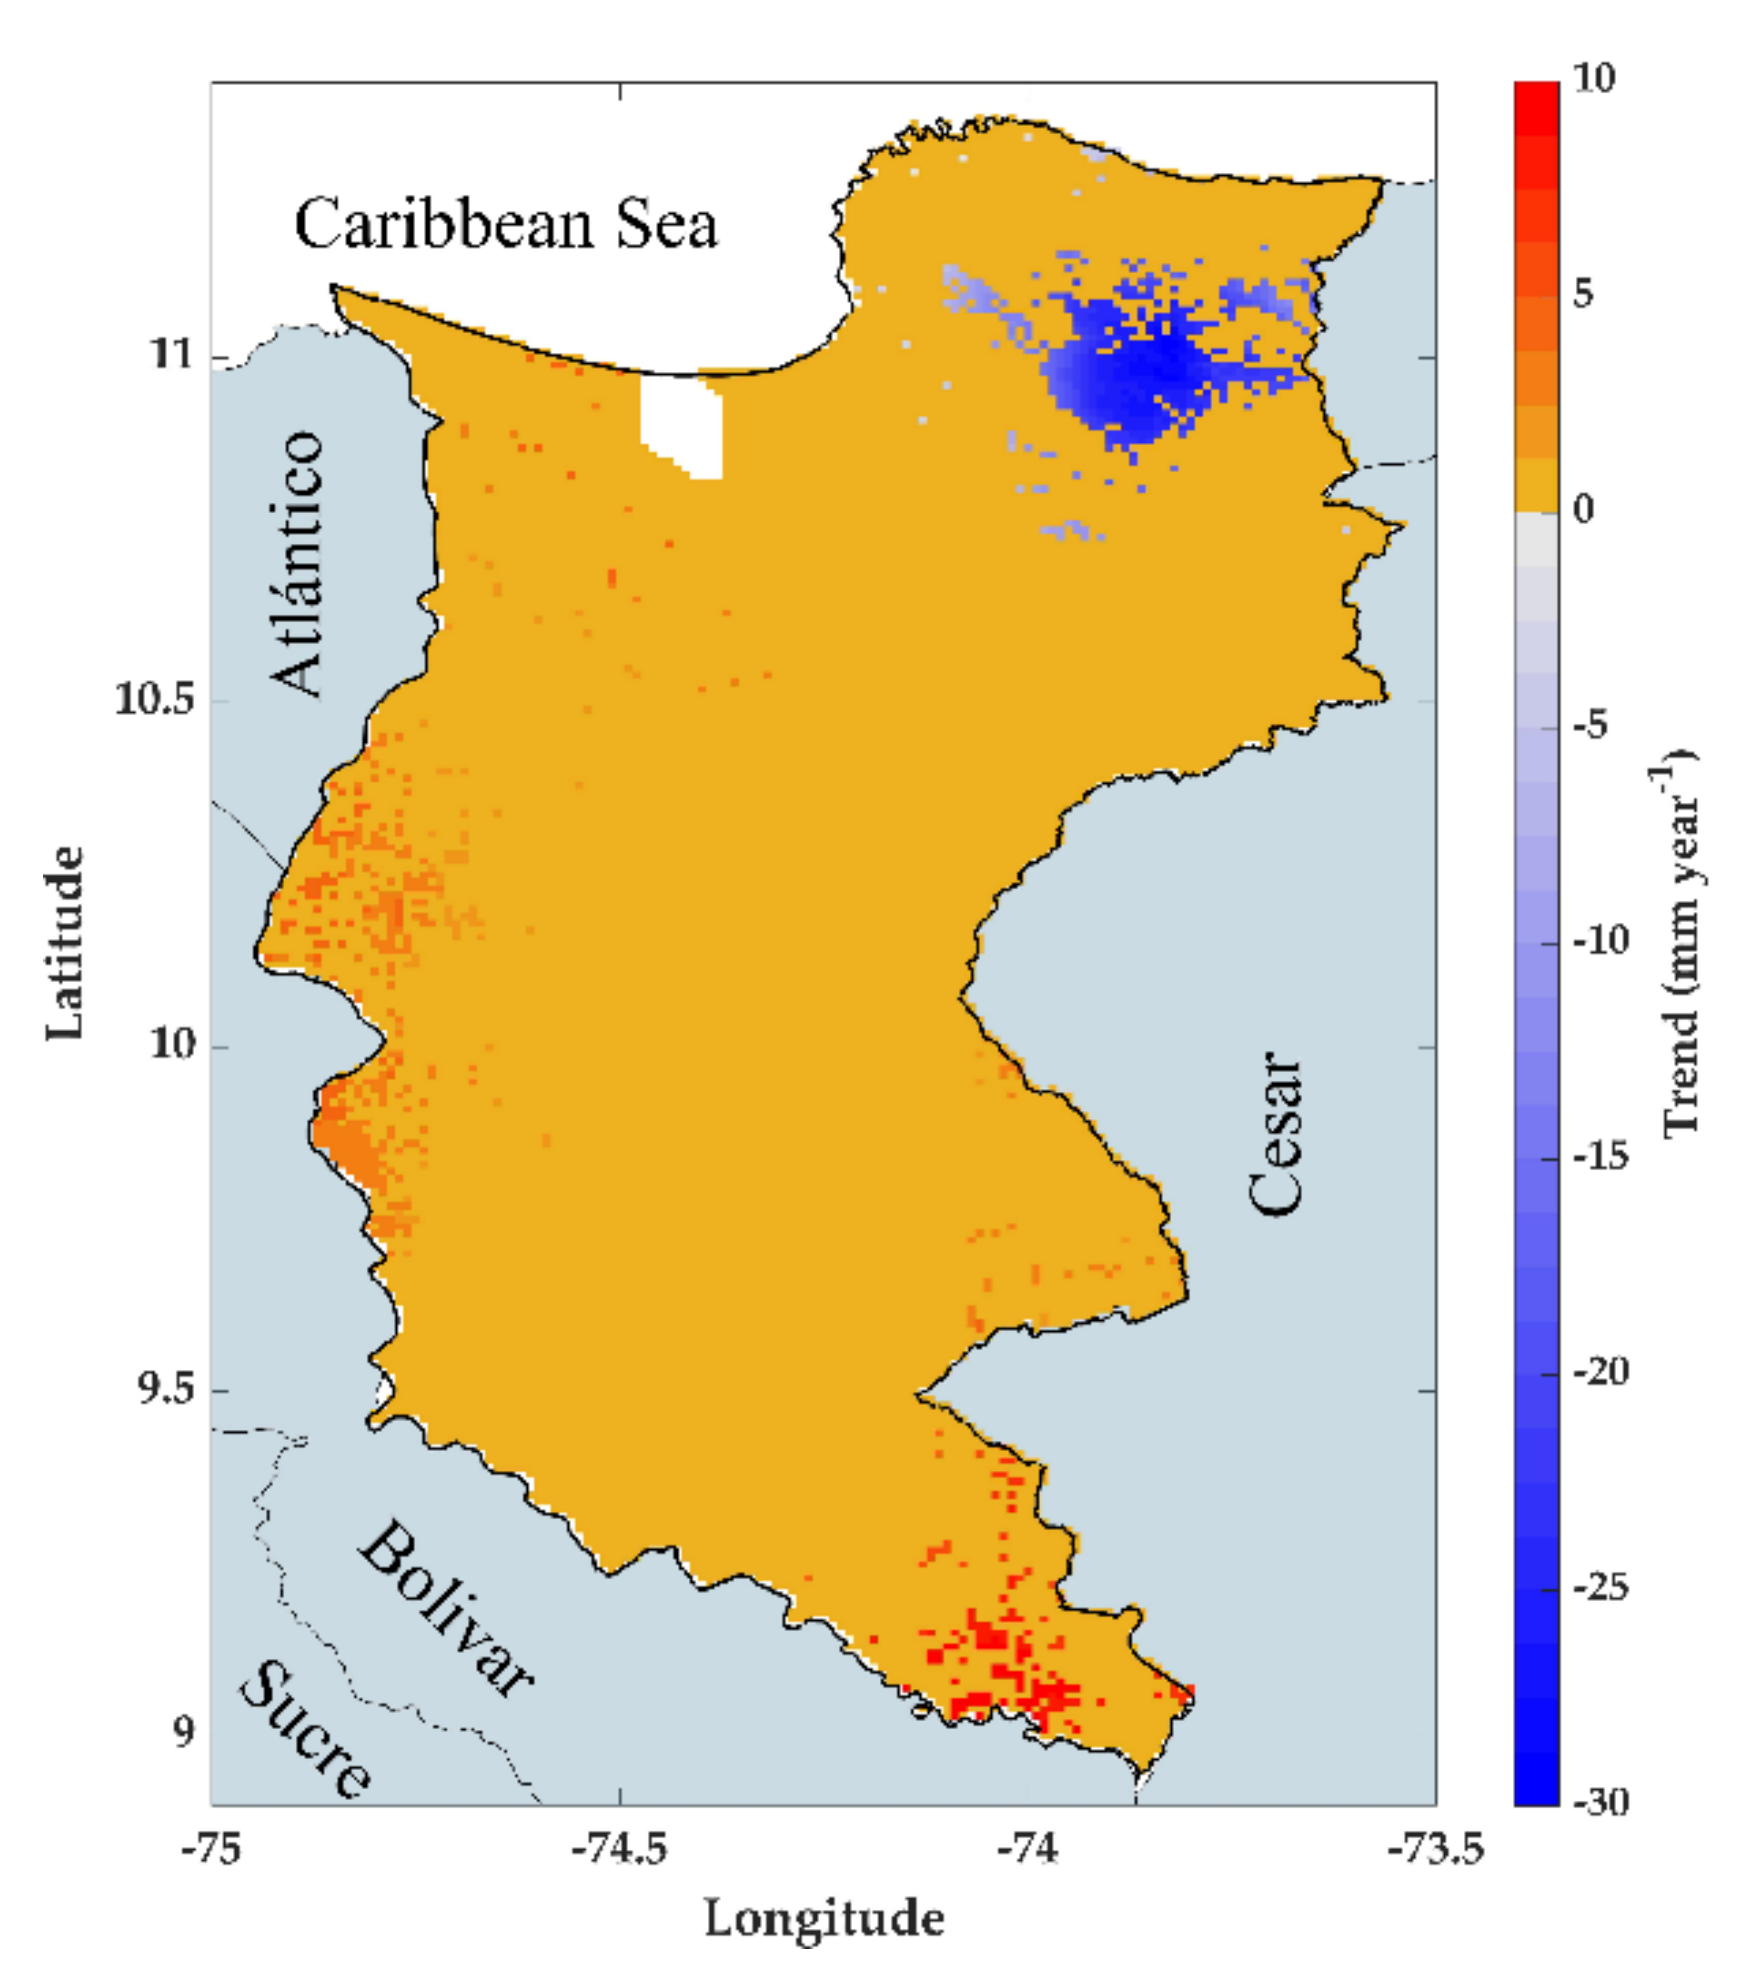
The trend analysis for the mean total annual precipitation (Figure 6) indicated reductions between 10 mm yr−1 and 30 mm yr−1 in the SNSM area, with a 5% significance level. On the other hand, for the central-west region, trends suggest rainfall increases between 2 mm yr−1 and 5 mm yr−1 (at Ciénaga de San Antonio, Zapayán, and Zárate), with positive trends also found for Ciénaga de Chilloa (between 5 mm yr−1 and 10 mm yr−1).
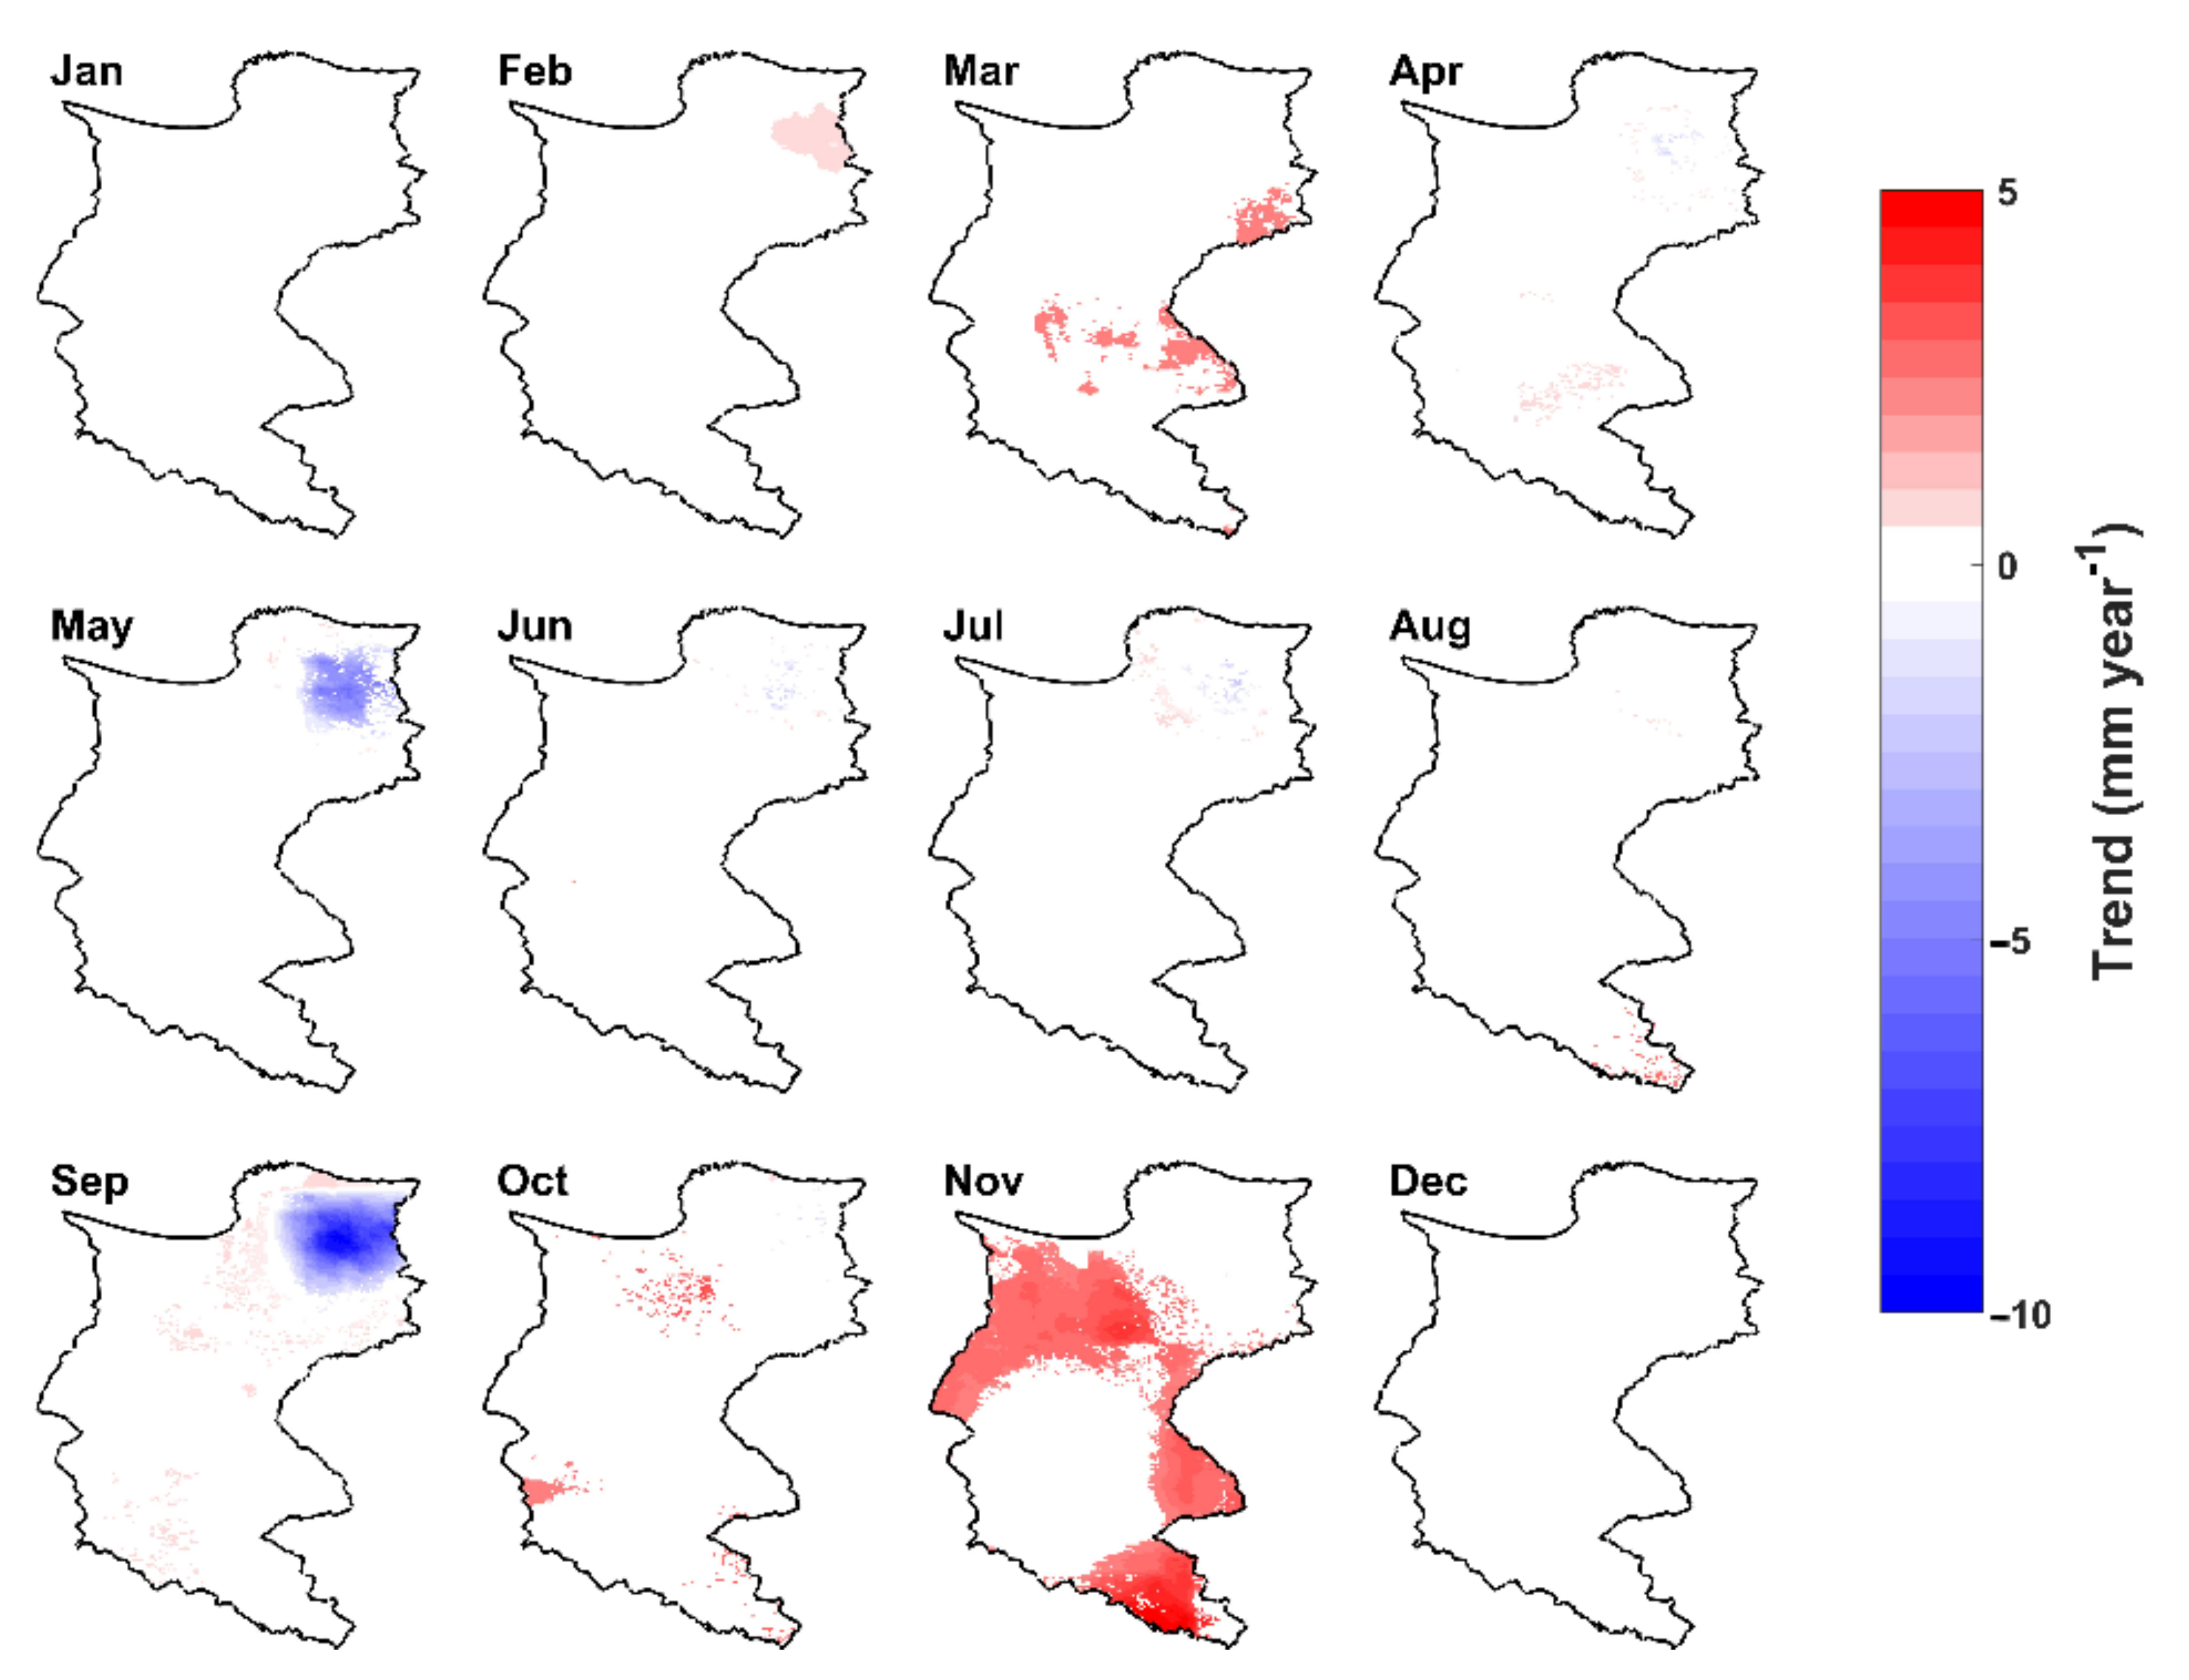
The annual cycle trend showed patterns of precipitation redistribution (Figure 7). Increases between 2 and 5 mm yr−1 during February–March and October–November were recognized, with March and November being the months with the highest trend values. In contrast, reductions were detected in May and September (–5 to –10 mm yr−1). Based on the spatial distribution of these trends, decrements are significant near the SNSM zone for May and September. For the west and south zones, positive trends appear in March, October, and November.
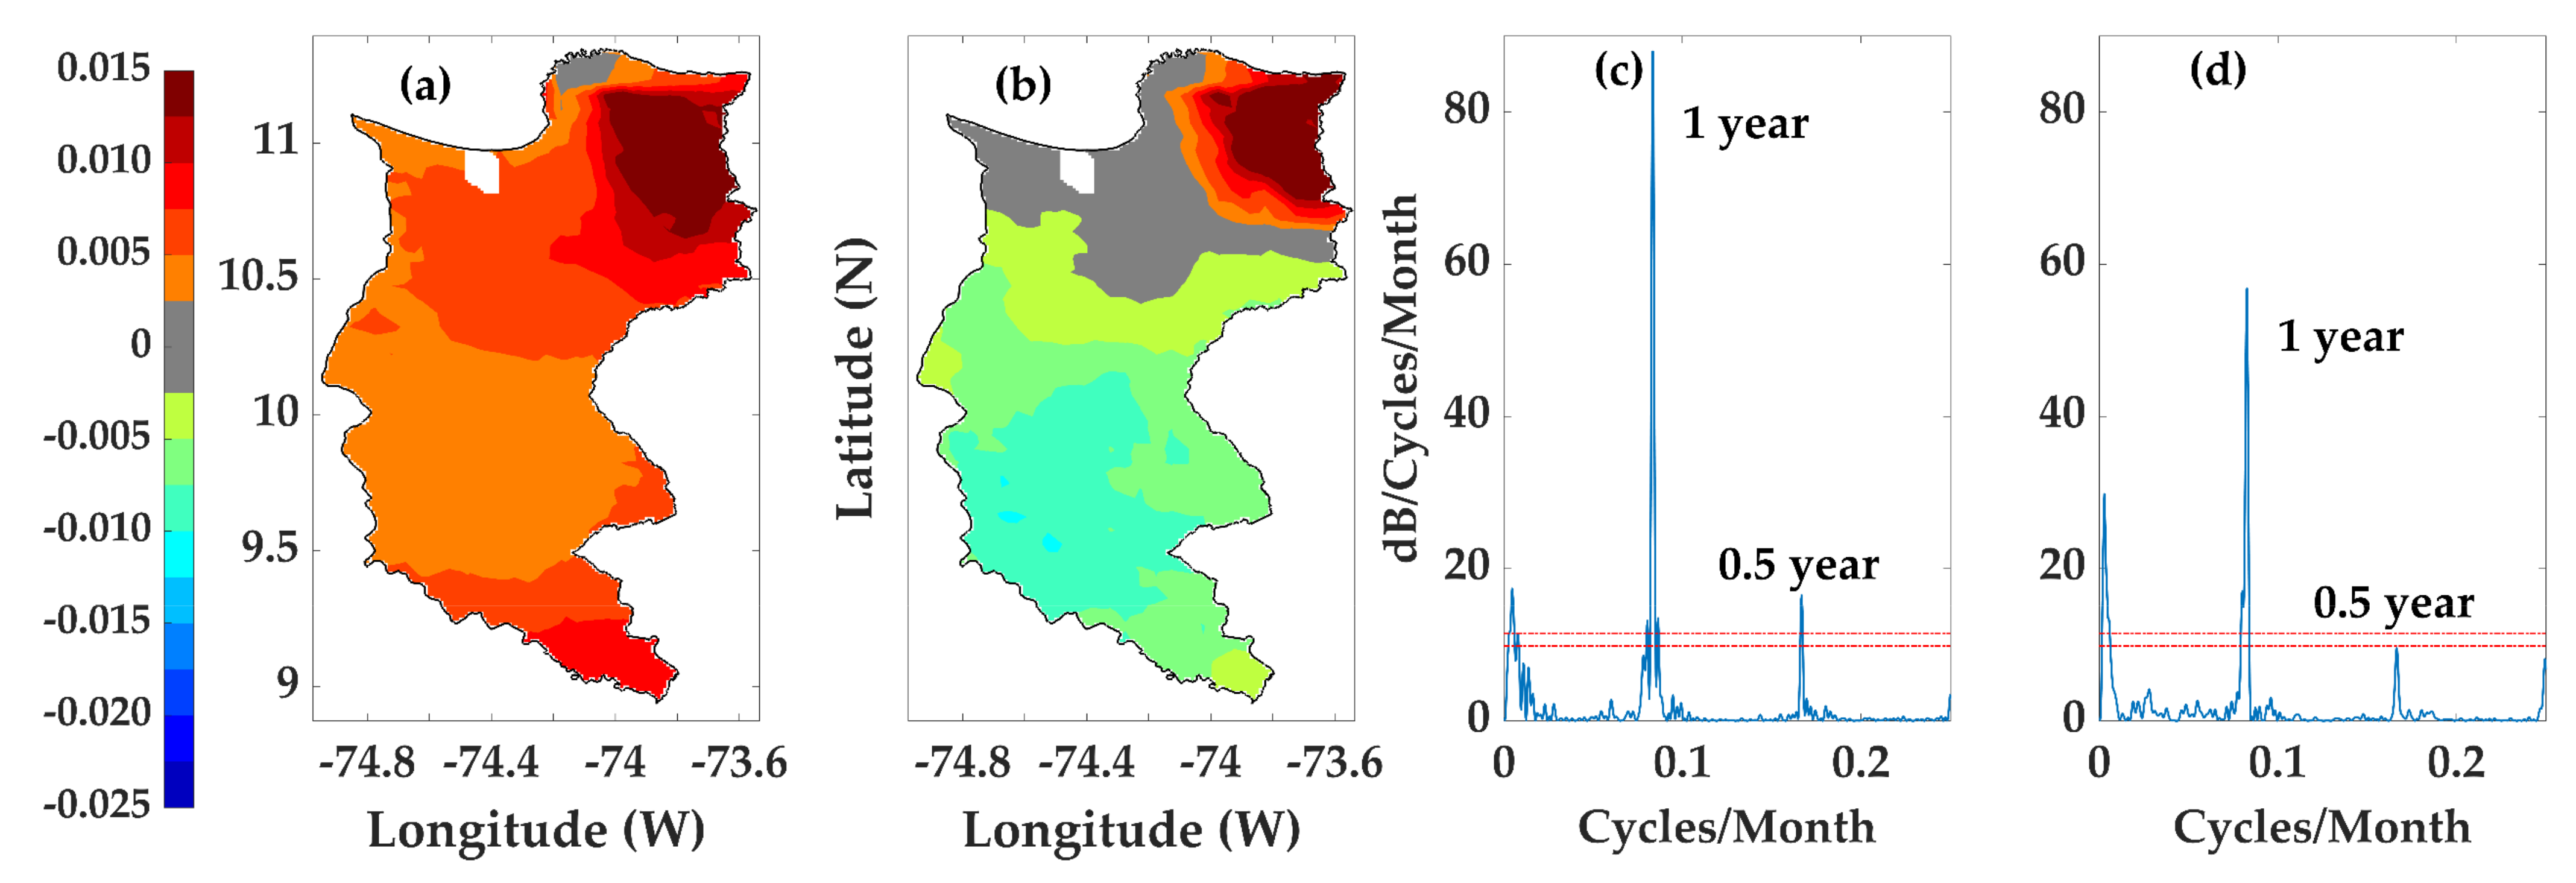
Figure 8 shows the EOF analysis based on rainfall variability during 1981–2018 for monthly precipitation. EOF analysis detected some recurrent fluctuation zones, with the spatial patterns associated with temporary variability in the Magdalena Department. Areas with positive factor loading correspond to those with the higher rainfall variability of rainfall, while negative loading implies less variability. For our study area, the first EOF is the dominant mode with 90.9% of the explained variance (Figure 8a). The PSD for the first principal component (PC1) shows that the dominant frequencies (Figure 8c) are those marked by peaks on the 0.5 years (seasonal cycle), 1 (annual cycle), 3–7 (ENSO), and ~11 years (sunspots). The second variability mode explains 5.2% of the variance (Figure 8b) and refers to the variation in the SNSM (high-variability) and central and south (low-variability) regions (Figure 8b), with similar periods to mode 1 (Figure 8d). Both the first and second modes of variability suggest that the frequencies associated with sunspots have a more significant influence on the spatiotemporal rainfall variability than those associated with ENSO.
4. Discussion
This study evaluates the efficacy of the CHIRPS v2.0 database through statistical comparisons with rain gauge information provided by IDEAM. Similar to previous research [11,14,15,16,17,18,19,20], our results indicate that CHIRPS v2.0 preserves important rainfall characteristics such as mean and seasonality at monthly and annual timescales. The bias and error metrics agree with the results of authors such as Katsanos et al. [62], Urrea et al. [11], Paredes Trejo et al. [63], Dinku et al. [20], and Alemu and Bawoke [48], among others. The best association between satellite and rain gauge measurements occurs in the north area of our case study. In the same way, our findings agree with those of Dinku et al. [20], who reported high variability in the coastal and highland zones; however, they differ from those found by Katsanos et al. [62], who described slightly higher correlations for hydrometeorological stations located on mountains, likely due to the scarcity of IDEAM stations in the SNSM, as CHIRPS v2.0 employs these records to improve the accuracy of the satellite estimations. In general, in the Magdalena Department, CHIRPS v2.0 and rain gauges data have a high correlation ( > 0.75).
Based on Figure 8, the first two leading EOF modes reveal that the variances explaining the seasonal rainfall variability for the study period are 90.9% and 5.5%, respectively. The first EOF displays positive anomalies over most parts of the study area, with the highest variation over the northeastern and southern regions and a lesser variation over the rest of the study area. The EOF method revealed four significant space–time patterns and their corresponding coefficient of variation, allowing the confirmation of the four zones of precipitation previously identified in Figure 4.
The first EOF represents the interannual variability influenced by two interdecadal modes (~10 y and ~20 y) correlated with solar activity (sunspots) and may also account for extreme precipitation events (Figure 8c). The second EOF (Figure 8b) represents decadal variability dominated but influenced by the ENSO-like mode (Figure 8d). Higher variability occurs in the SNSM area and a steadier behavior below 10.5 °N. The authors did not find studies in the literature review about precipitation’s spatial and temporal variation in Colombia using EOF.
The monthly precipitation patterns (Figure 5) display the geographical distribution of precipitation and support previous findings [30,64,65] that the regimes are attributable to the climatic seasons based on IDEAM records. The climatic seasons are known as the rainy seasons (April–May, August–November), a minor dry season (June–August), and the major dry season (December–March), and they seem to respond to the meridional migrations of the Intertropical Convergence Zone (ITCZ) and its interaction with the Pacific Ocean and Caribbean Sea [65]. Our literature review indicates that previous studies in the Caribbean region have commonly ignored the role of the topography in the regional variability, most likely due to the few hydrometeorological stations in the department. This feature has direct consequences on the temperature and precipitation in Colombia, according to Trojer [66] and Hurtado-Montoya and Mesa-Sánchez [67]. One example is the noticeable differences between the climates of windward and leeward zones caused by the influence of the mountains zones in terms of distributing the humid air masses. The total annual precipitation time series exhibited three zones with significant trends (5% significance level): (1) SNSM, (2) central-west, and (3) south. The SNSM mountain range area has exhibited decrements from –10 to –30 mm yr−1 (Figure 7). This region is the source of some important rivers, which provide drinkable and irrigation water to the north and northeast of the Magdalena Department. For this reason, it is considered the most productive area in this territory, and it constitutes the highest water demand zone (>150 Mm3) with permanent crops such as banana (70.2%) and African palm (15.8%) plantations [68].
The central-west and south of the department showed an increase in the precipitation, representing a statistical contradiction for the widely supported statements about a progressive decrease in the average rainfall and the current predictions of climate change models in Colombia [30,65]. The same incongruity can be inferred for the remaining fraction of the department, because the Mann–Kendall test did not show significant trends in this area. This conclusion coincides with other studies about trends in hydroclimatic variables for the Colombian Plains and central region [25,27,56].
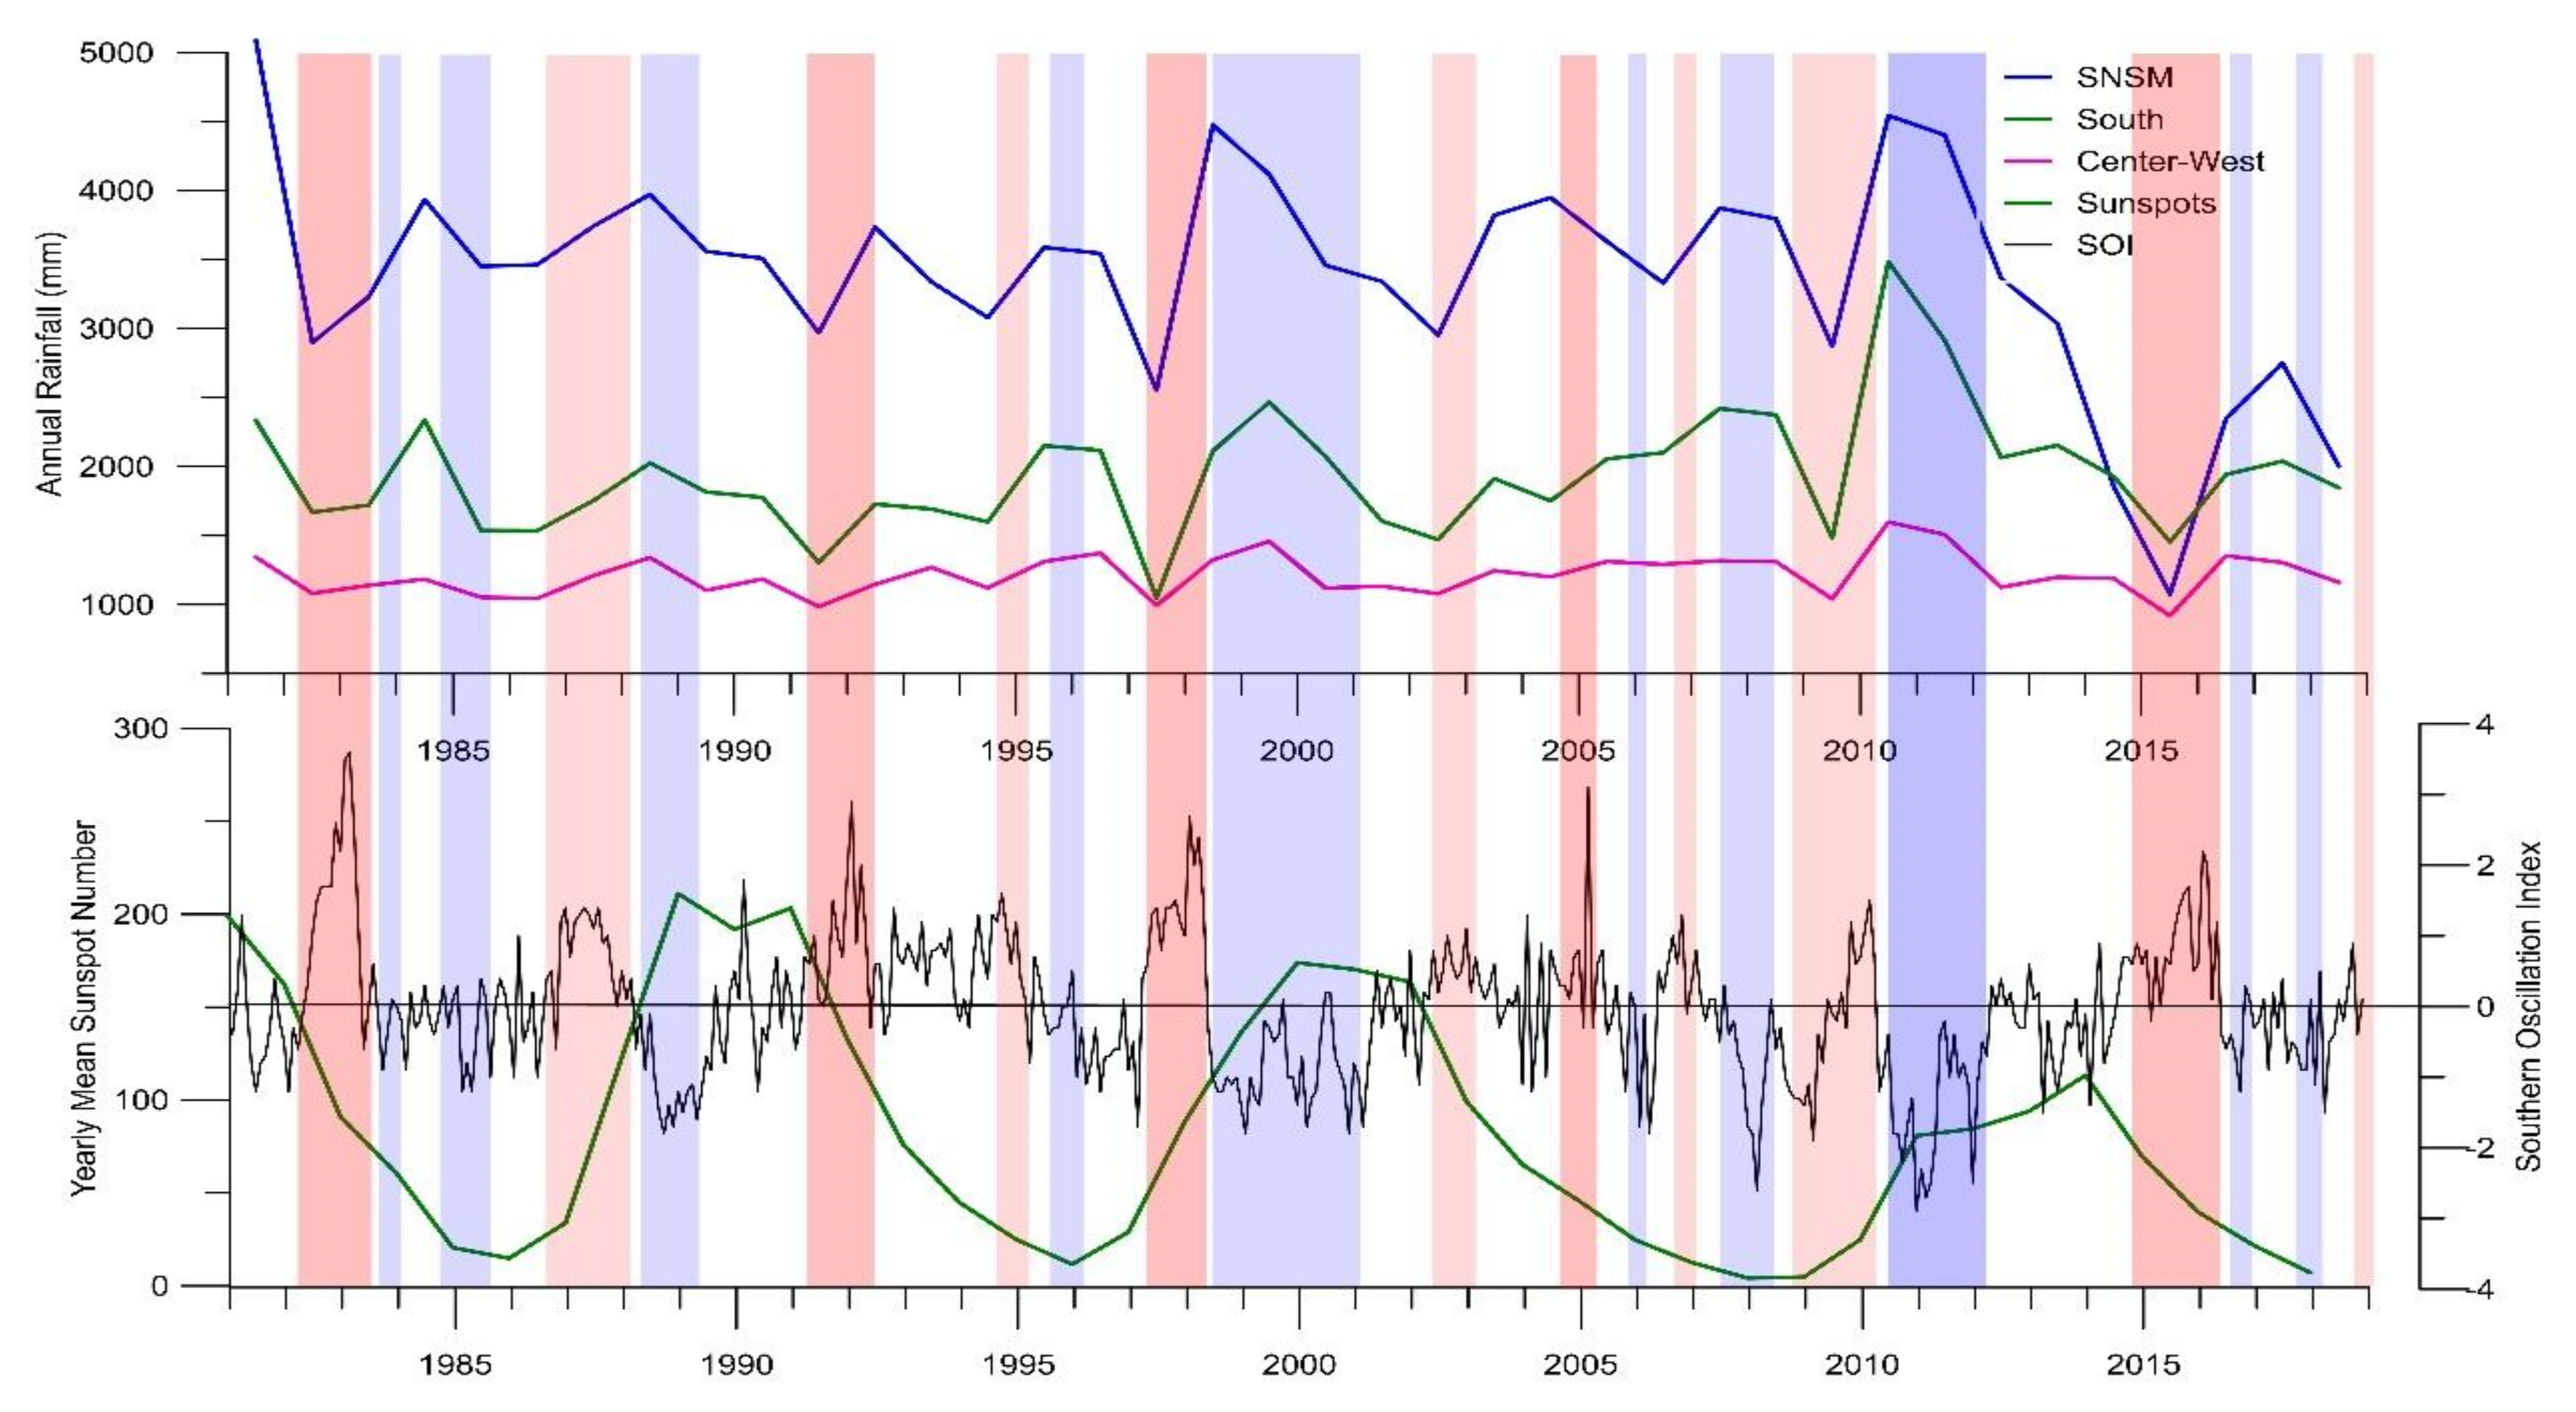
Considering that the atmospheric dynamics directly follow the latitudinal solar migrations, the climatic cycles can be evaluated concerning the solar energetic activity [39,69]; more specifically, sunspots and solar flares on the solar surface as the star completes its rotation roughly once every 27 days. In general terms, the evolution of total annual precipitation in the Magdalena Department shows some (if weak) correspondence with the solar activity and with the ENSO (Figure 9). According to Poveda [39], Poveda et al. [70], and Carmona and Poveda [27], the most important phenomena for the Colombian climate, on a yearly scale, is the Southern Oscillation (ENSO, both phases), and to a lesser extent, the North Atlantic Oscillation (NAO) and the Pacific Decadal Oscillation (PDO) [71]. Both exert nonlinear interactions with the ENSO. A wavelets (Morlet) analysis for monthly precipitation time series in the three zones (see Appendix B—Figure A1, Figure A2 and Figure A3) indicated that the variable is significantly influenced by ENSO and, in second place, by the annual and seasonal scale; these findings agree with the previously mentioned authors. However, employing the tool developed by González-Rodríguez et al. [72] for the extraction and modeling of times series periodicities, we found that in the north region of the Magdalena Department, the wave that modulates (higher amplitude) the precipitation is associated with the magnetic cycle of sunspots (20–22 years), followed by the 12 and 6 months’ periodicities, forced by the meridional oscillation of ITCZ [64,73,74]. In third place comes intra-year periodicities from 1–2 months associated with eastern tropical waves, hurricanes, and cold fronts from high latitudes [39] and periodicities related to ENSO (3–6 years) and the 11 years’ cycle of sunspots. For the south, central, and west zones, the periodicities associate with 12, 6, and 1–2 months (year to year and intra-year scale), 3–6 years (ENSO), and around 11 years (sunspots). The lags in the sunspots time series with respect to precipitation times range between two and three years for the magnetic cycle in the SNSM.
5. Conclusions
This study assessed the long-term spatiotemporal variability and trends of average monthly precipitation in the Magdalena Department based on satellite estimations, using IDEAM records to validate these datasets, which have proven helpful for the spatial and temporal analysis of precipitation in different regions of the world. This research presented a detailed analysis of the spatial and temporal variability and the precipitation trends in the Magdalena Department (Colombia), using precipitation data from the CHIRPS v2.0 database for 38 years (1981–2018).
The spatial distribution for the total annual precipitation and the coefficient of variation established four subregions where the precipitation fluctuations obey the regional geographical features and the proximity to high-humidity environments. In consequence, the maximum precipitation values (>2500 mm yr−1) occur in the SNSM subregion and the minimum (<1000 mm yr−1) in the coastal subregion. The analysis of monthly climatology ratified that ITCZ migration drives the seasonal rainfall pattern. The trend analysis established three zones (SNSM, central-west, and south); the positives trends in the central-west oppose the idea of a progressive reduction in average monthly precipitation discussed in previous studies, while the negatives trends found in SNSM warn about the possibility of scarcity in the rivers used as primary water sources for agricultural activities in the region. Despite the climate stability for the Caribbean region and Magdalena Department and the evident existence of rainy and dry seasons, our findings suggest that intra-year variability (1–2 months) comes from the influence of tropical waves from the east, hurricanes, cold fronts from high latitudes, the interaction with the Caribbean Sea, and the regional topography. Furthermore, the fluctuation in the total annual precipitation in this country zone showed some correspondence with the solar activity and ENSO behavior; the last is one of the most studied phenomena in Colombia by its determinant impact on the year-to-year climate variability. Our findings suggest that ENSO significantly influences the precipitation patterns of the south and central-west regions of the department.
The present study has offered helpful information to understand in a better way the spatial distribution and the temporal trends of precipitation in the Magdalena Department, a piece of essential knowledge for better water resources management and the assurance of sustainable agriculture production. For improving the understanding of rainfall patterns in the Magdalena Department, follow-up studies could include assessing the possible effect of additional variables, such as the cosmic ray’s influence on regional precipitation.
Author Contributions
Conceptualization, E.M.-A. and J.R.L.-C.; methodology, E.M.-A.; validation, E.M.-A. and J.R.L.-C.; formal analysis, E.M.-A., F.A.C. and J.R.L.-C.; investigation, E.M.-A. and J.R.L.-C.; writing—original draft preparation, F.A.C. and J.R.L.-C.; writing—review and editing, F.A.C.; supervision, J.R.L.-C. All authors have read and agreed to the published version of the manuscript.
Funding
This research was funded by Sistema General de Regalías de Colombia—SGR (BPIN 201700010005).
Data Availability Statement
The data processed to obtain the results presented in this study are available at the following link https://tinyurl.com/twzhexex (accessed on 12 June 2021).
Acknowledgments
The authors acknowledge the project “Investigation of the climate variability and climate change effects on the water resources, biodiversity and agricultural activities in the Magdalena Department” BPIN code 2017000100055—SGR.
Conflicts of Interest
The authors declare no conflict of interest.
Appendix A
In this appendix, we provide the basic information regarding the hydrometeorological stations operated by IDEAM and employed in this study

Table A1.
Description of the IDEAM’s weather stations in the Department of Magdalena used for the CHIRPS database validation.
Table A1.
Description of the IDEAM’s weather stations in the Department of Magdalena used for the CHIRPS database validation.
| IDEAM Station Code | Station Name | Latitude (Degrees) | Longitude (Degrees) | Altitude (m) | Municipality |
|---|---|---|---|---|---|
| 25025090 | Apto Las Flores | 9.0463 | −73.9708 | 34 | El Banco |
| 15015050 | Apto S. Bolivar | 11.1283 | −74.2289 | 4 | Santa Marta |
| 25021610 | Agrado | 9.6857 | −74.5049 | 100 | Plato |
| 15015110 | Alto De Mira | 11.0915 | −73.9324 | 180 | Santa Marta |
| 25021600 | Apure | 9.8725 | −74.5804 | 85 | Plato |
| 29060350 | Bayano | 10.6312 | −74.2986 | 30 | El Retén |
| 28040150 | Bellavista | 10.3081 | −74.0392 | 140 | Algarrobo |
| 29060030 | Bongo | 10.6488 | −74.3755 | 20 | El Retén |
| 28040320 | Brillante | 9.7028 | −73.9591 | 135 | Santa Ana |
| 15010020 | Buritaca | 11.2501 | −73.7648 | 30 | Santa Marta |
| 28040360 | Cabana La Hda | 9.8610 | −74.0767 | 100 | Ariguaní (El Difícil) |
| 29060140 | Carmen | 10.6755 | −74.2064 | 25 | Zona Bananera |
| 29060060 | Cenizo | 10.6516 | −74.0732 | 450 | Aracataca |
| 29060080 | Cocos | 11.0060 | −74.6836 | 4 | Sitio Nuevo |
| 29060150 | Destino | 10.5737 | −74.2241 | 20 | El Retén |
| 29060560 | Dona Maria | 10.3844 | −74.1779 | 50 | Fundación |
| 29060160 | Enano | 10.9022 | −74.1895 | 25 | Zona Bananera |
| 29060180 | Esperanza | 10.7425 | −74.3063 | 25 | Pueblo Viejo |
| 29060190 | Florida | 10.6106 | −74.2554 | 26 | El Retén |
| 29060040 | Fundacion | 10.5244 | −74.1822 | 40 | Fundación |
| 29020020 | Garrapata | 10.3216 | −74.4240 | 60 | Pivijai |
| 29060170 | Gavilan | 10.6804 | −74.3307 | 20 | El Retén |
| 15010300 | Guachaca | 11.2564 | −73.8367 | 45 | Santa Marta |
| 25021620 | Iran | 9.6838 | −74.3222 | 80 | Nueva Granada |
| 29060200 | La Maria | 10.5407 | −74.1870 | 30 | Aracataca |
| 25021190 | Mecha | 9.6229 | −74.5956 | 100 | Santa Bárbara De Pinto |
| 25021040 | Menchiquejo | 9.1881 | −74.0442 | 25 | El Banco |
| 15010010 | Minca | 11.1408 | −74.1200 | 640 | Santa Marta |
| 28040100 | Monterrubio | 10.2337 | −74.2733 | 100 | Pivijai |
| 25021630 | Nueva Granada | 9.8018 | −74.3886 | 110 | Nueva Granada |
| 29065020 | Padelma | 10.7211 | −74.1997 | 20 | Zona Bananera |
| 29060210 | La Palma | 10.9668 | −74.2047 | 23 | Ciénaga |
| 29060340 | Palmor | 10.7734 | −74.0256 | 1200 | Ciénaga |
| 29060270 | Palo Alto | 10.7225 | −74.2719 | 25 | Pueblo Viejo |
| 15030020 | Palomino | 11.2442 | −73.5739 | 30 | Santa Marta |
| 29065030 | Prado Sevilla | 10.7642 | −74.1547 | 18 | Zona Bananera |
| 29060250 | Proyectos | 10.7367 | −74.2371 | 20 | Zona Bananera |
| 25021500 | Pueblito | 9.5812 | −74.3523 | 35 | Santa Ana |
| 29060550 | Ruby | 10.8451 | −74.1882 | 20 | Zona Bananera |
| 29050020 | Salamina | 10.4875 | −74.7900 | 15 | Salamina |
| 28040140 | San Angel | 10.0331 | −74.2126 | 140 | Sabanas De San Ángel |
| 29060280 | San Isidro | 10.9008 | −74.2206 | 25 | Zona Bananera |
| 15015060 | San Lorenzo | 11.1111 | −74.0547 | 2200 | Santa Marta |
| 29060070 | San Pablo | 10.8082 | −74.0268 | 800 | Ciénaga |
| 29060540 | San Rafael | 10.5906 | −74.6470 | 10 | Remolino |
| 25021380 | San Roque | 9.0700 | −74.1500 | 24 | El Banco |
| 25020900 | San Sebastian | 9.2339 | −74.3558 | 65 | San Sebastián De Buenavista |
| 25021030 | San Zenon | 9.2475 | −74.5019 | 25 | San Zenón |
| 29060100 | Santa Rosa Dl | 10.4028 | −74.1080 | 75 | Fundación |
| 29060230 | La Sara | 10.8362 | −74.1610 | 25 | Zona Bananera |
| 25025300 | El Seis | 9.6837 | −74.3223 | 50 | San Sebastián De Buenavista |
| 29060310 | Sevillano | 10.9331 | −74.2524 | 5 | Ciénaga |
| 29060120 | Tasajera | 10.9762 | −74.3618 | 2 | Pueblo Viejo |
| 25021020 | Tierra Grata | 9.4367 | −74.7392 | 25 | Santa Bárbara De Pinto |
| 29050010 | Tiogollo | 10.3444 | −74.7321 | 41 | El Piñón |
| 29060240 | La Union | 10.7066 | −74.2236 | 20 | Zona Bananera |
| 28040300 | Vll Concepcion | 9.7063 | −73.8594 | 120 | Ariguaní (El Difícil) |
| 15010040 | Vista Nieves | 11.0854 | −74.0799 | 20 | Santa Marta |
| 15015020 | La Ye | 10.9924 | −74.2111 | 20 | Ciénaga |
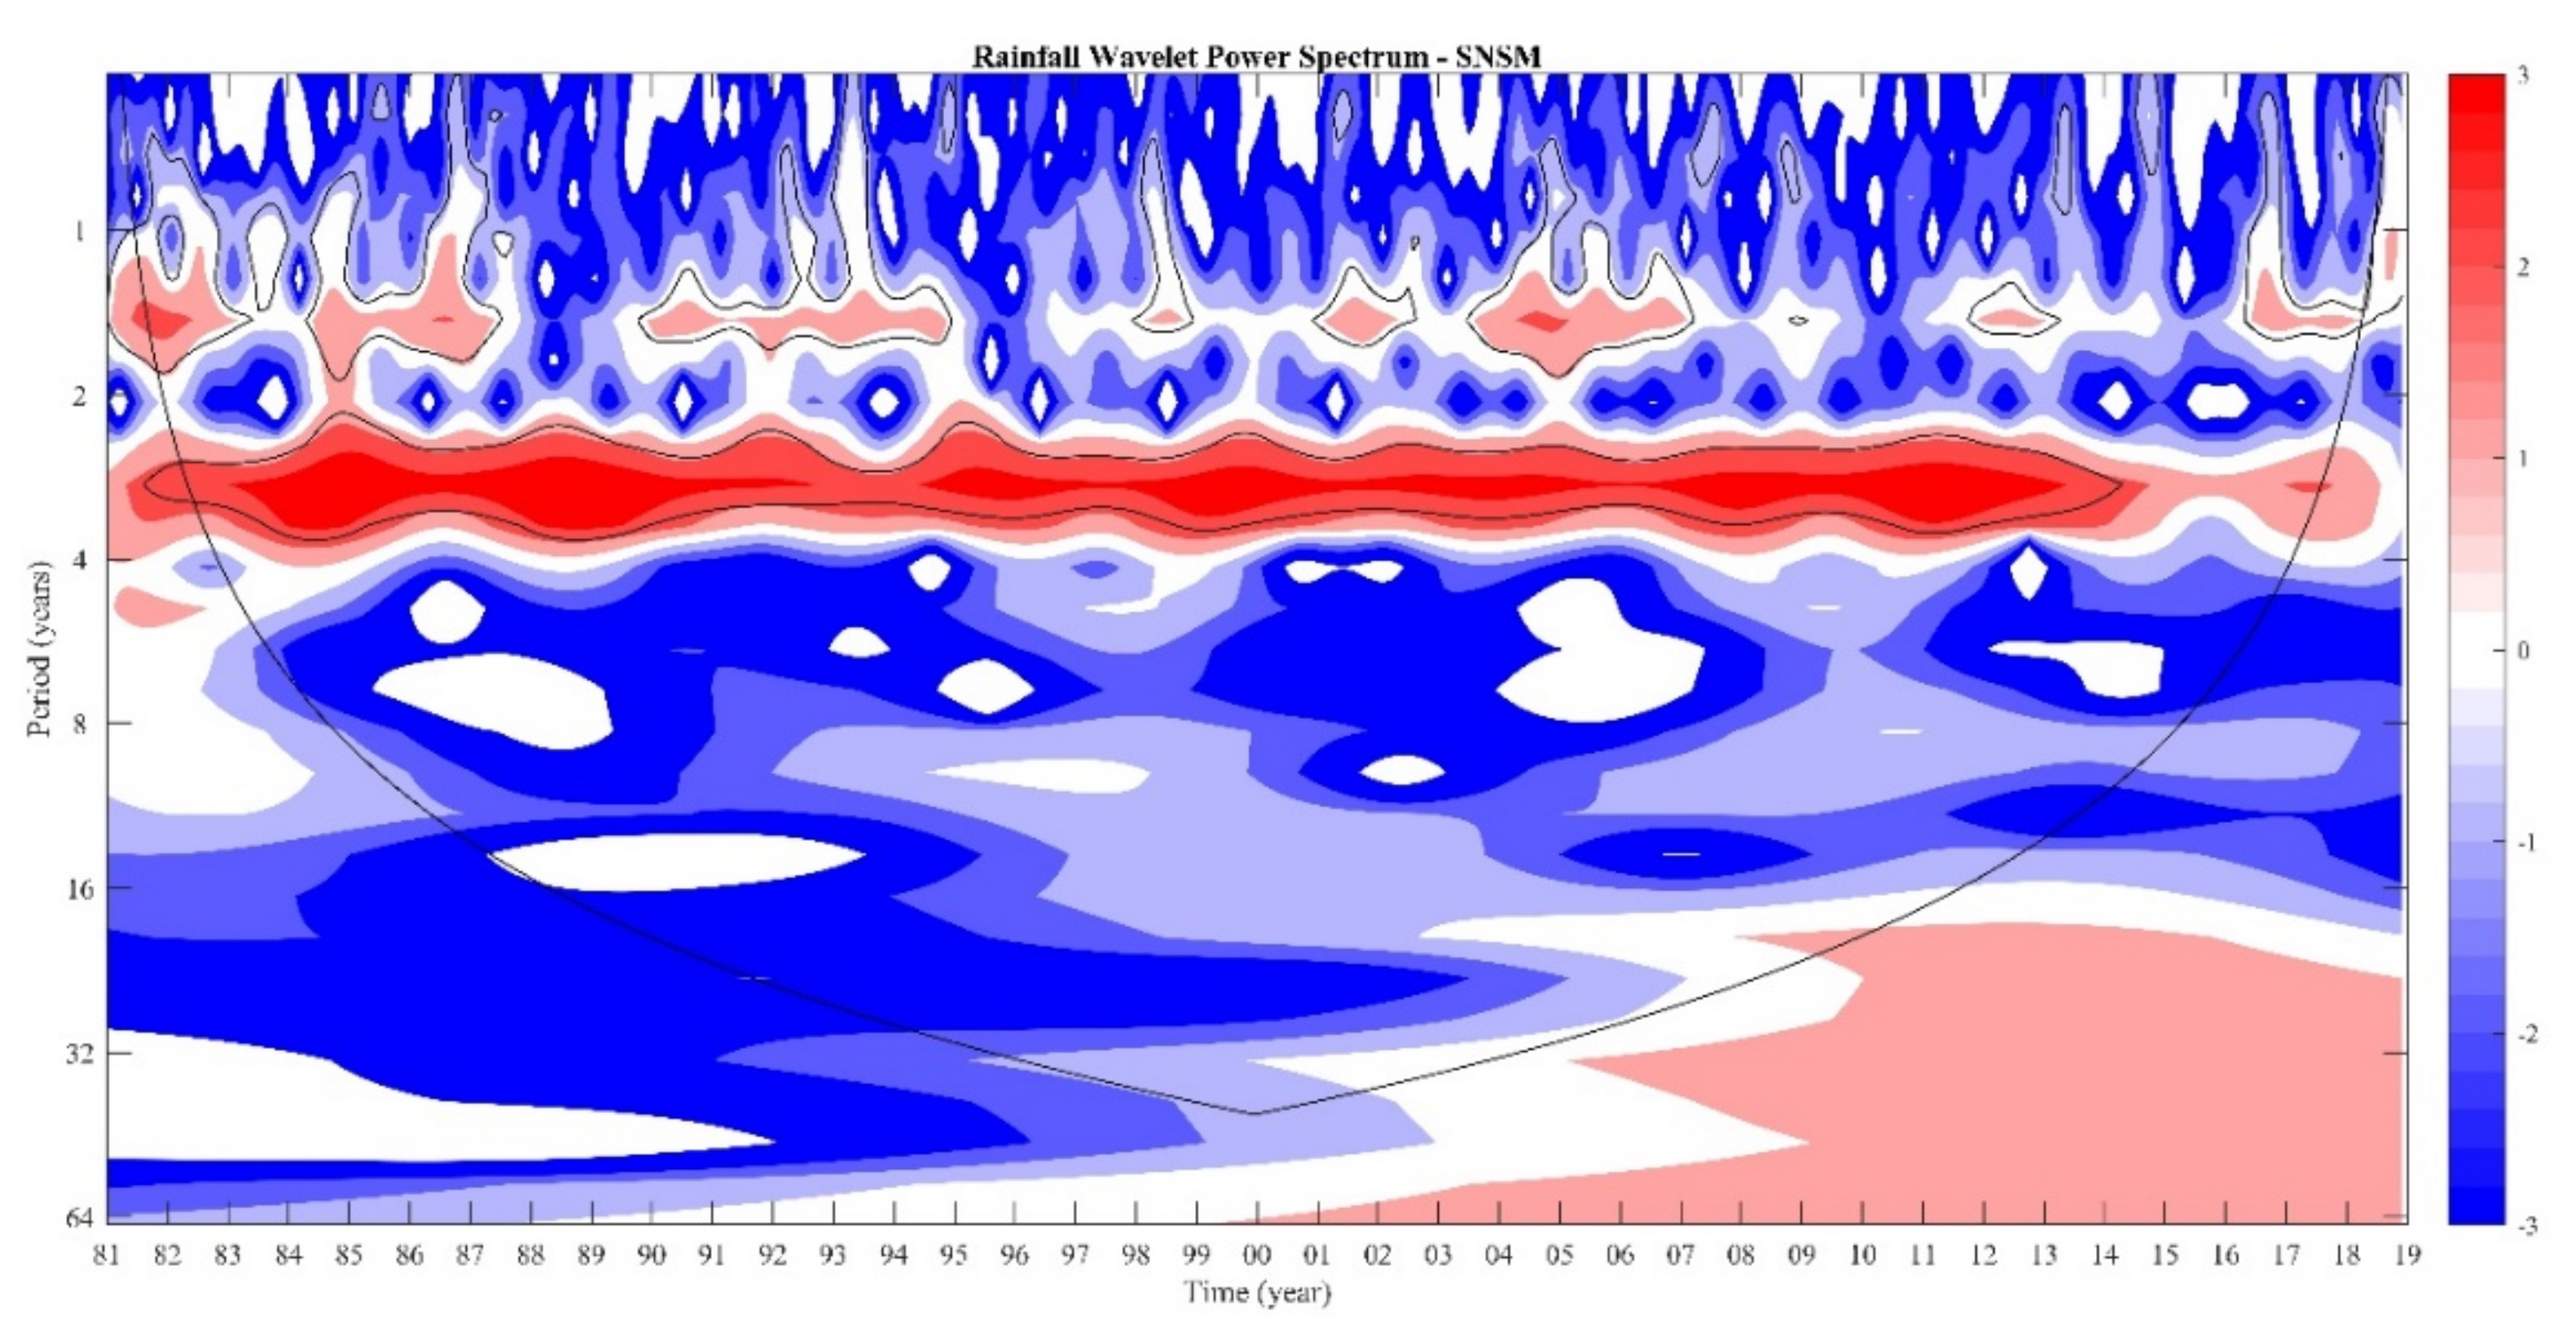
Appendix B
Figure A1: wavelets (Morlet) analysis central-west, Figure A2: wavelets (Morlet) analysis south, and Figure A3: wavelets (Morlet) analysis SNSM.
Figure A1.
Wavelets (Morlet) analysis central-west.
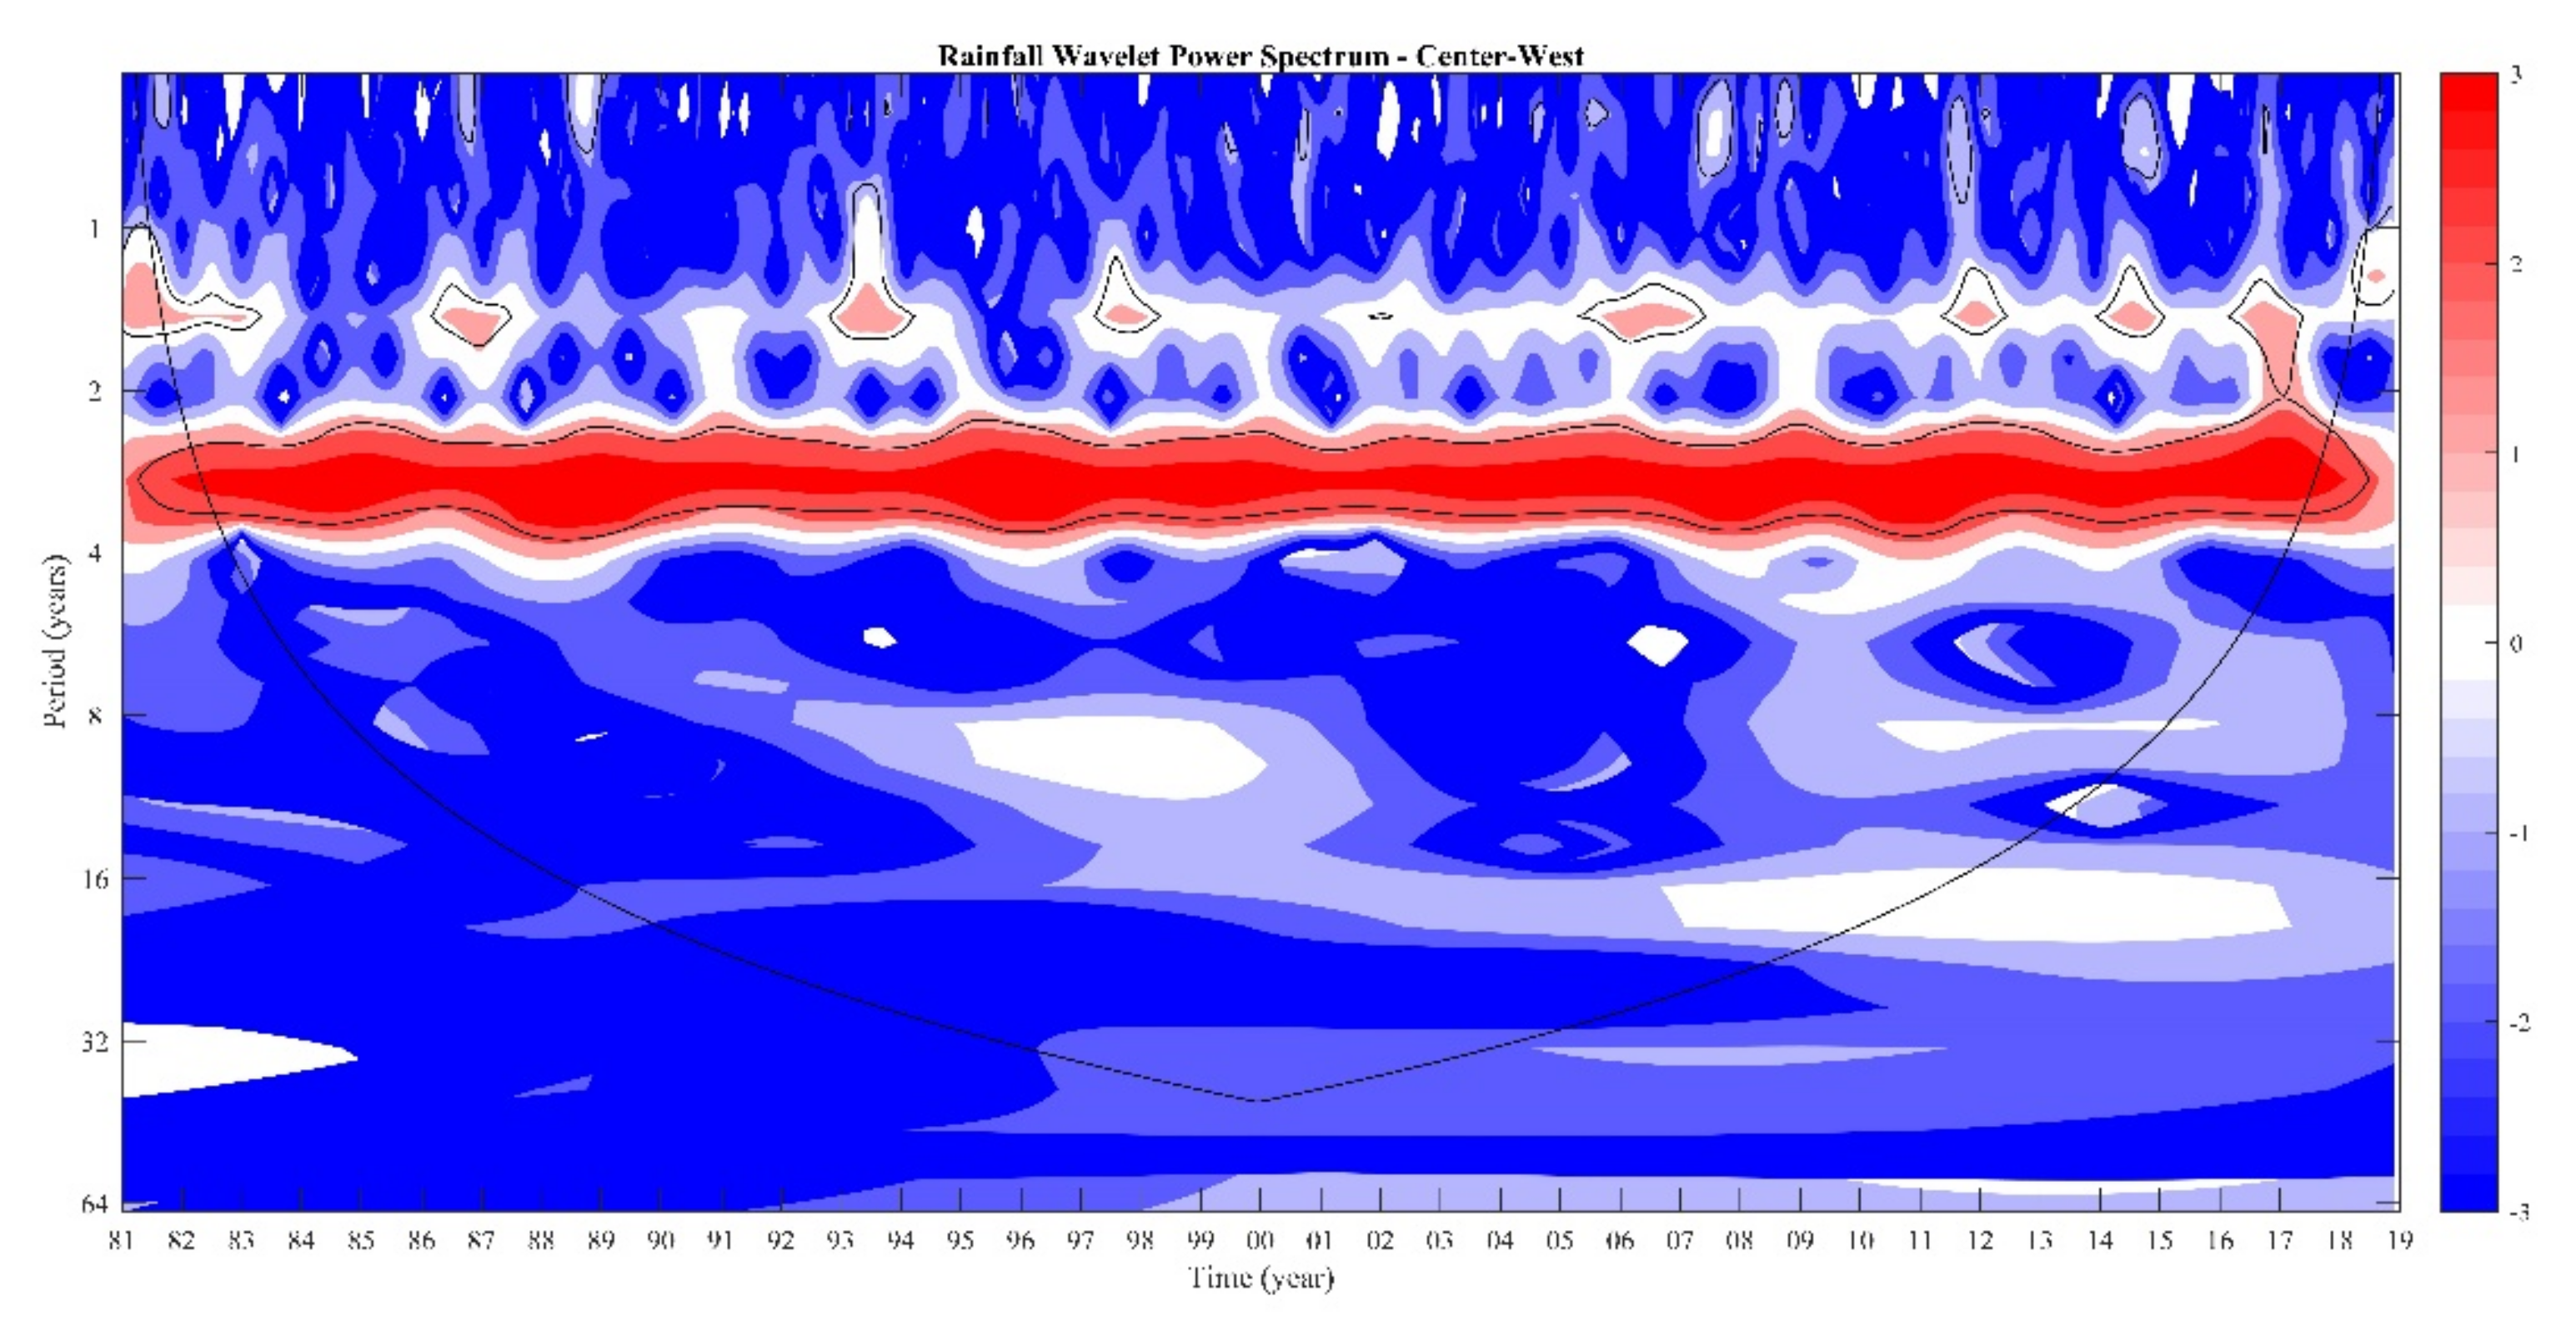
Figure A2.
Wavelets (Morlet) analysis south.
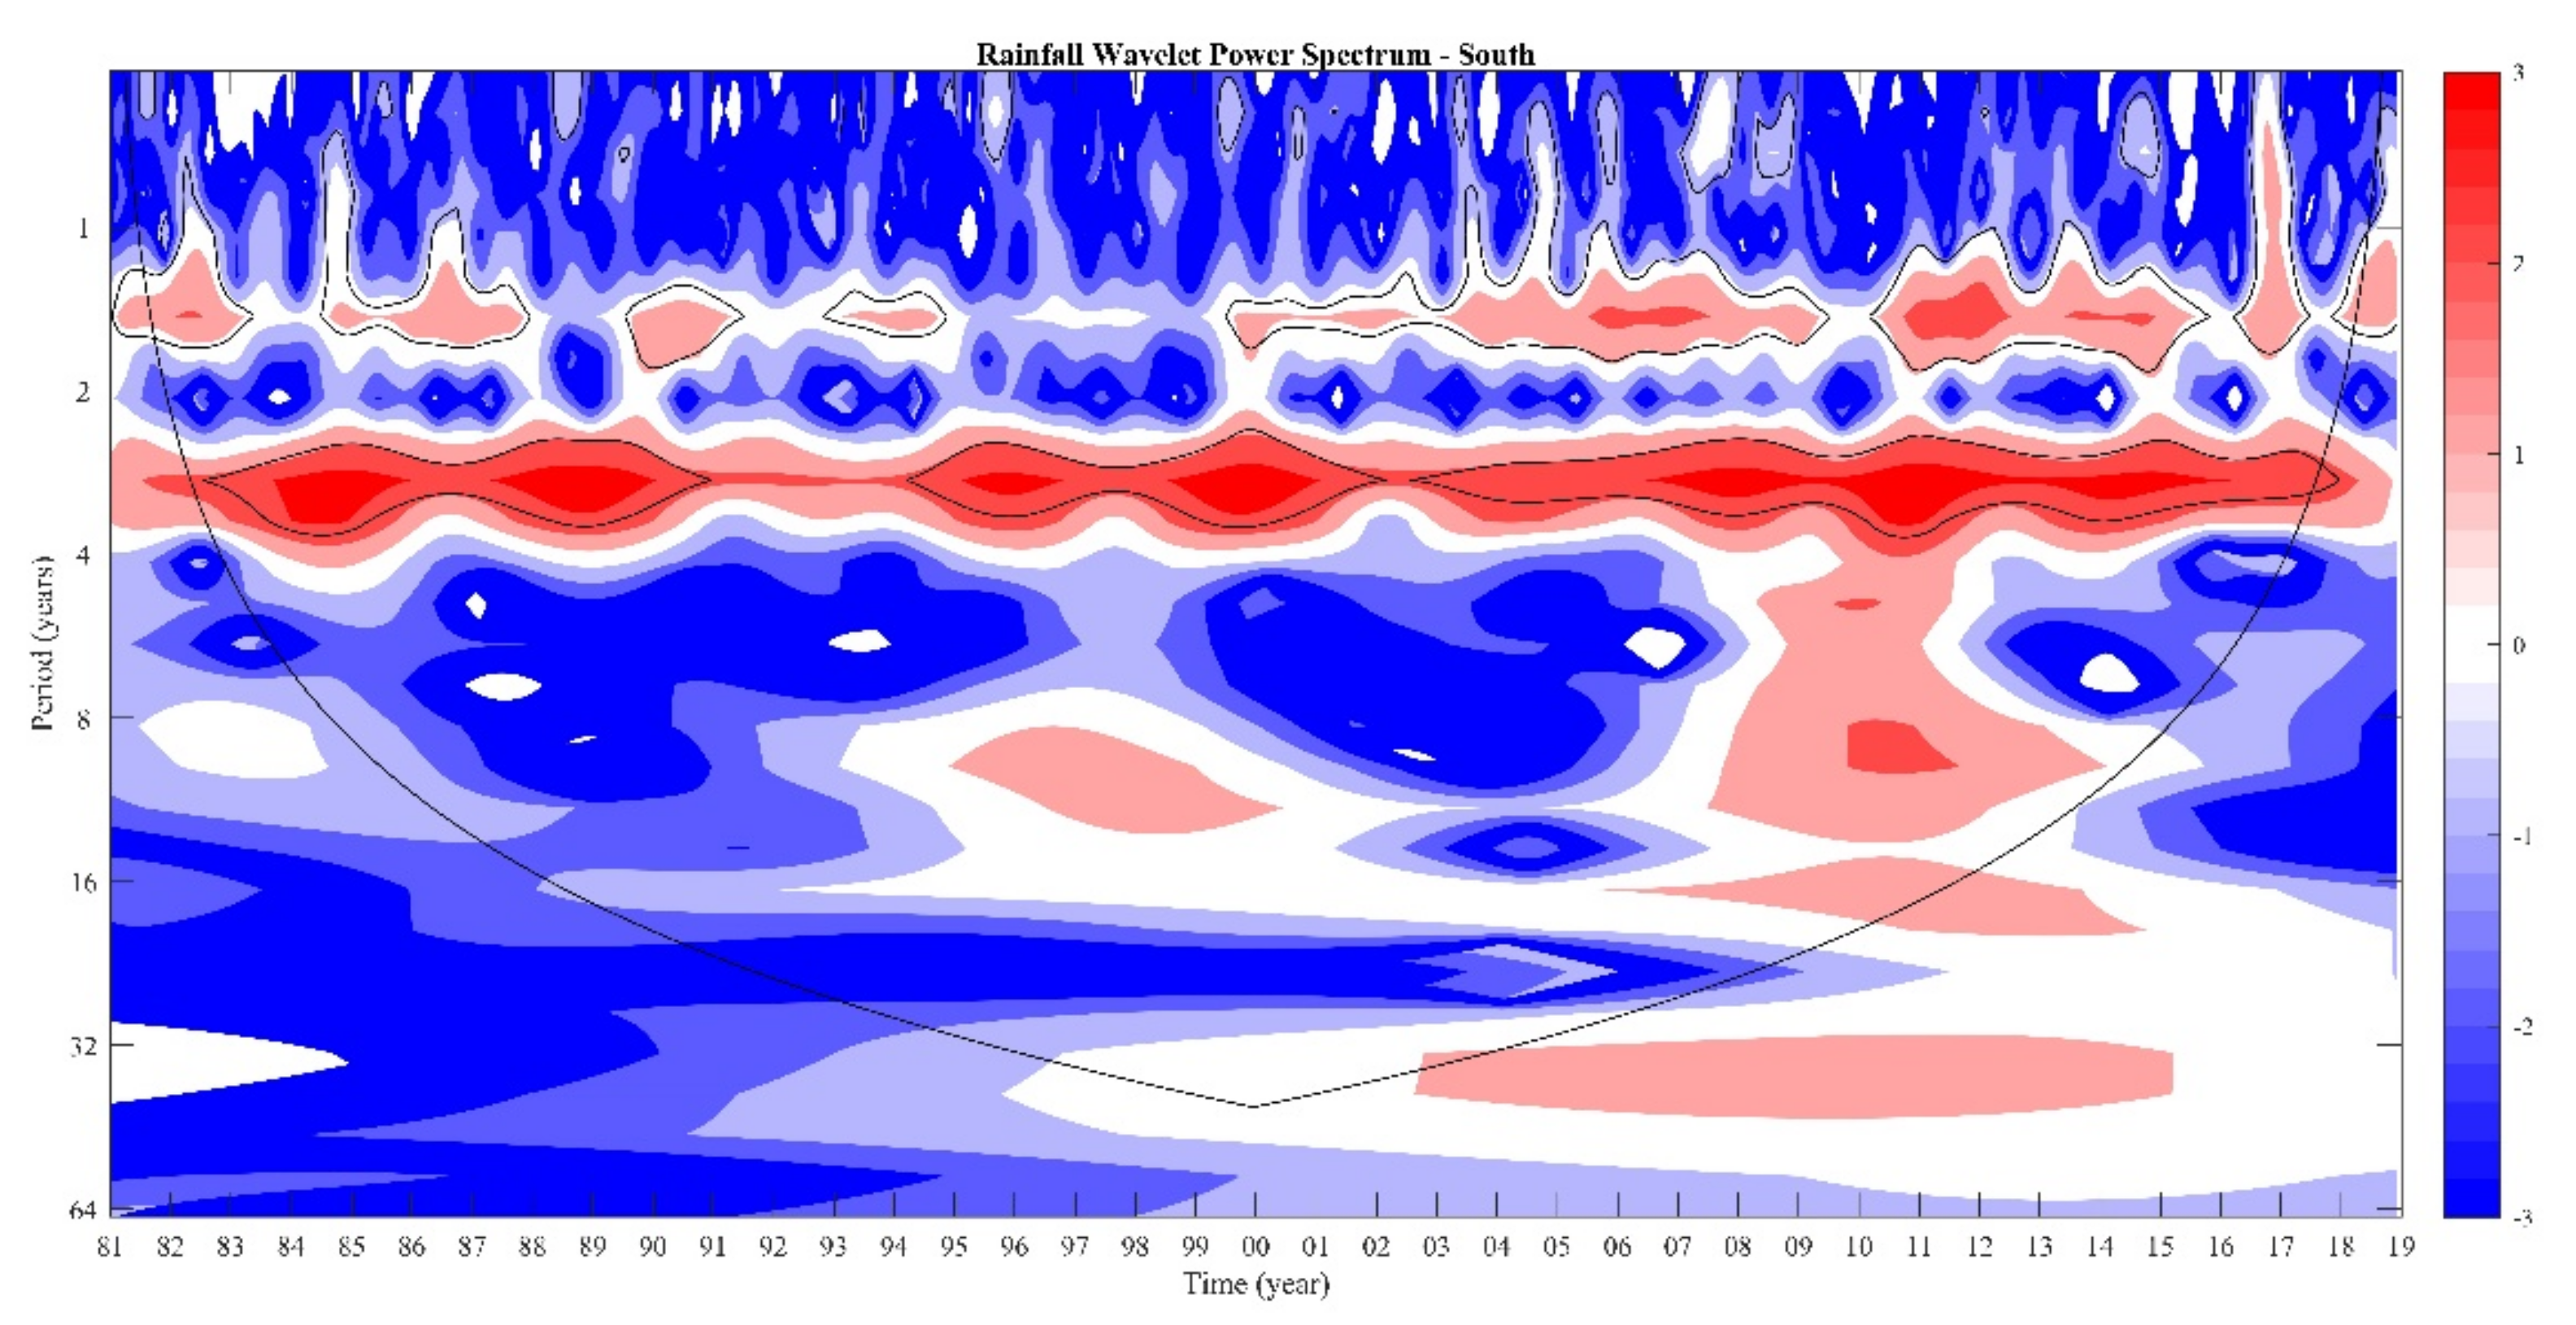
Figure A3.
Wavelets (Morlet) analysis SNSM.
References
- Ayalew, D.; Tesfaye, K.; Mamo, G.; Yitaferu, B.; Bayu, W. Variability of Rainfall and Its Current Trend in Amhara Region, Ethiopia. Afr. J. Agric. Res. 2012, 7. [Google Scholar] [CrossRef]
- Zhao, W.; Yu, X.; Ma, H.; Zhu, Q.; Zhang, Y.; Qin, W.; Ai, N.; Wang, Y. Analysis of Precipitation Characteristics during 1957-2012 in the Semi-Arid Loess Plateau, China. PLoS ONE 2015, 10, e0141662. [Google Scholar] [CrossRef]
- Ebert, E.E.; Janowiak, J.E.; Kidd, C. Comparison of Near-Real-Time Precipitation Estimates from Satellite Observations and Numerical Models. Bull. Am. Meteorol. Soc. 2007, 88, 47–64. [Google Scholar] [CrossRef] [Green Version]
- Weldegerima, T.M.; Zeleke, T.T.; Birhanu, B.S.; Zaitchik, B.F.; Fetene, Z.A. Analysis of Rainfall Trends and Its Relationship with SST Signals in the Lake Tana Basin, Ethiopia. Adv. Meteorol. 2018, 2018, 1–10. [Google Scholar] [CrossRef] [Green Version]
- Cattani, E.; Merino, A.; Guijarro, J.A.; Levizzani, V. East Africa Rainfall Trends and Variability 1983–2015 Using Three Long-Term Satellite Products. Remote Sens. 2018, 10, 931. [Google Scholar] [CrossRef] [Green Version]
- Cruz-Roa, A.F.; Barrios, M.I. Estimación de datos faltantes de lluvia mensual a través de la asimilación de información satelital y pluviométrica en una cuenca andina tropical. Idesia 2018, 36, 107–117. [Google Scholar] [CrossRef] [Green Version]
- Serrat-Capdevila, A.; Valdes, J.B.; Stakhiv, E.Z. Water Management Applications for Satellite Precipitation Products: Synthesis and Recommendations. J. Am. Water Resour. Assoc. 2014, 50, 509–525. [Google Scholar] [CrossRef]
- Muthoni, F.K.; Odongo, V.O.; Ochieng, J.; Mugalavai, E.M.; Mourice, S.K.; Hoesche-Zeledon, I.; Mwila, M.; Bekunda, M. Long-Term Spatial-Temporal Trends and Variability of Rainfall over Eastern and Southern Africa. Theor. Appl. Climatol. 2019, 137, 1869–1882. [Google Scholar] [CrossRef] [Green Version]
- Toté, C.; Patricio, D.; Boogaard, H.; Van der Wijngaart, R.; Tarnavsky, E.; Funk, C. Evaluation of Satellite Rainfall Estimates for Drought and Flood Monitoring in Mozambique. Remote Sens. 2015, 7, 1758–1776. [Google Scholar] [CrossRef] [Green Version]
- Gebremichael, M.; Krajewski, W.F.; Morrissey, M.L.; Huffman, G.J.; Adler, R.F. A Detailed Evaluation of GPCP 1° Daily Rainfall Estimates over the Mississippi River Basin. J. Appl. Meteorol. 2005, 44, 665–681. [Google Scholar] [CrossRef]
- Urrea, V.; Ochoa, A.; Mesa, O. Validación de La Base de Datos de Precipitación CHIRPS Para Colombia a Escala Diaria, Mensual y Anual En El Periodo 1981–2014. In Proceedings of the XXVII Congreso Latinoamericano de Hidráulica; IAHS: Lima, Perú, 2016; Available online: http://ladhi2016.org (accessed on 16 July 2021).
- Elgamal, A.; Reggiani, P.; Jonoski, A. Impact Analysis of Satellite Rainfall Products on Flow Simulations in the Magdalena River Basin, Colombia. J. Hydrol. Reg. Stud. 2017, 9, 85–103. [Google Scholar] [CrossRef]
- Cruz-Roa, A.F.; Olaya-Marín, E.J.; Barrios, M.I. Ground and Satellite Based Assessment of Meteorological Droughts: The Coello River Basin Case Study. Int. J. Appl. Earth Obs. Geoinf. 2017, 62, 114–121. [Google Scholar] [CrossRef]
- Vallejo-Bernal, S.M.; Urrea, V.; Bedoya-Soto, J.M.; Posada, D.; Olarte, A.; Cárdenas-Posso, Y.; Ruiz-Murcia, F.; Martínez, M.T.; Petersen, W.A.; Huffman, G.J.; et al. Ground Validation of TRMM 3B43 V7 Precipitation Estimates over Colombia. Part I: Monthly and Seasonal Timescales. Int. J. Climatol. 2021, 41, 601–624. [Google Scholar] [CrossRef]
- Fernandes, K.; Muñoz, A.G.; Ramirez-Villegas, J.; Agudelo, D.; Llanos-Herrera, L.; Esquivel, A.; Rodriguez-Espinoza, J.; Prager, S.D. Improving Seasonal Precipitation Forecasts for Agriculture in the Orinoquía Region of Colombia. Weather Forecast. 2020, 35, 437–449. [Google Scholar] [CrossRef]
- Palomino-Ángel, S.; Anaya-Acevedo, J.A.; Botero, B.A. Evaluation of 3B42V7 and IMERG Daily-Precipitation Products for a Very High-Precipitation Region in Northwestern South America. Atmos. Res. 2019, 217, 37–48. [Google Scholar] [CrossRef]
- Navarro-Monterroza, E.; Arias, P.A.; Vieira, S.C. El Niño/Southern Oscillation Modoki and Its Effects on the Spatiotemporal Variability of Precipitation in Colombia. Rev. Acad. Colomb. Cienc. Exactas Fis. Nat. 2019, 43, 120–132. [Google Scholar] [CrossRef]
- López López, P.; Immerzeel, W.W.; Rodríguez Sandoval, E.A.; Sterk, G.; Schellekens, J. Spatial Downscaling of Satellite-Based Precipitation and Its Impact on Discharge Simulations in the Magdalena River Basin in Colombia. Front. Earth Sci. 2018, 6. [Google Scholar] [CrossRef] [Green Version]
- Hurtado-Montoya, A.F.; Mesa-Sánchez, Ó.J. Reanalysis of Monthly Precipitation Fields in Colombian Territory. Dyna 2014, 81, 251–258. [Google Scholar] [CrossRef]
- Dinku, T.; Funk, C.; Peterson, P.; Maidment, R.; Tadesse, T.; Gadain, H.; Ceccato, P. Validation of the CHIRPS Satellite Rainfall Estimates over Eastern Africa. Q. J. R. Meteorol. Soc. 2018, 144, 292–312. [Google Scholar] [CrossRef] [Green Version]
- Baez-Villanueva, O.M.; Zambrano-Bigiarini, M.; Ribbe, L.; Nauditt, A.; Giraldo-Osorio, J.D.; Thinh, N.X. Temporal and Spatial Evaluation of Satellite Rainfall Estimates over Different Regions in Latin-America. Atmos. Res. 2018, 213, 34–50. [Google Scholar] [CrossRef]
- Hodson de Jaramillo, E.; Castaño, J.; Poveda, G.; Roldán, G.; Chavarriaga Aguirre, P. Seguridad Alimentaria y Nutricional en Colombia; La Red Interamericana de Academias de Ciencias (IANAS): Mexico City, Mexico, 2017; ISBN 978-607-8379-29-3. [Google Scholar]
- Gomez Vargas, M. Estudio del impacto del cambio climático en los caudales de entrada al embalse del Río Frío. Inge Cuc 2016, 12, 42–50. [Google Scholar] [CrossRef] [Green Version]
- Vuille, M.; Bradley, R.S.; Werner, M.; Keimig, F. 20th Century Climate Change in the Tropical Andes: Observations and Model Results. In Climate Variability and Change in High Elevation Regions: Past, Present & Future; Diaz, H.F., Ed.; Advances in Global Change Research; Springer Netherlands: Dordrecht, The Netherlands, 2003; pp. 75–99. ISBN 978-94-015-1252-7. [Google Scholar]
- Ochoa, A.; Poveda, G. Distribución Espacial de Señales de Cambio Climático En Colombia. In Proceedings of the XXIII Congreso Latinoamericano de Hidráulica; Asociación Internacional de Investigaciones Hidráulicas: Cartagena de Indias, Colombia, 2008; pp. 1–10. [Google Scholar]
- Cantor Gómez, D.C. Evaluación y Análisis Espaciotemporal de Tendencias de Largo Plazo en la Hidroclimatología Colombiana. Master’s Thesis, Universidad Nacional de Colombia, Medellín, Colombia, 2011. [Google Scholar]
- Carmona, A.M.; Poveda, G. Detection of Long-Term Trends in Monthly Hydro-Climatic Series of Colombia through Empirical Mode Decomposition. Clim. Chang. 2014, 123, 301–313. [Google Scholar] [CrossRef]
- Ramirez-Villegas, J.; Salazar, M.; Jarvis, A.; Navarro-Racines, C.E. A Way Forward on Adaptation to Climate Change in Colombian Agriculture: Perspectives towards 2050. Clim. Chang. 2012, 115, 611–628. [Google Scholar] [CrossRef]
- Armenta, G.; Dorado, J.; Rodriguez, A.; Ruiz, J. Escenarios de Cambio Climático Para Precipitación y Temperaturas En Colombia 2011–2100 Herramientas Científicas Para La Toma de Decisiones—Estudio Técnico Completo: Tercera Comunicación Nacional de Cambio Climático; IDEAM: Bogotá, Colombia, 2014; ISBN 978-958-8902-56-2. [Google Scholar]
- Pabón Caicedo, J.D. Cambio Climático en Colombia: Tendencias en la segunda mitad del siglo XX y escenarios posibles para el siglo XXI. Rev. Acad. Colomb. Cienc. Exactas Fis. Nat. 2012, 36, 261–278. [Google Scholar]
- Funk, C.; Peterson, P.; Landsfeld, M.; Pedreros, D.; Verdin, J.; Shukla, S.; Husak, G.; Rowland, J.; Harrison, L.; Hoell, A.; et al. The Climate Hazards Infrared Precipitation with Stations—a New Environmental Record for Monitoring Extremes. Sci. Data 2015, 2, 150066. [Google Scholar] [CrossRef] [PubMed] [Green Version]
- Funk, C.; Peterson, P.; Landsfeld, M.F.; Pedreros, D.H.; Verdin, J.P.; Rowland, B.E.; Husak, G.J.; Michaelsen, J.C.; Verdin, A.P. DA Quasi-Global Precipitation Time Series for Drought Monitoringata Series. US Geol. Surv. Data Ser. 2014, 832, 1–12. [Google Scholar] [CrossRef]
- Instituto Geográfico Agustín Codazzi (IGAC); Instituto de Hidrologia, Meteorologia y Estudios Ambientales (IDEAM); Instituto Alexander von Humboldt. Ecosistemas Continentales, Costeros y Marinos de Colombia; Imprenta Nacional de Colombia: Bogotá, Colombia, 2008. [Google Scholar]
- Durango, L.C. Climatología de Los Principales Puertos Del Caribe Colombiano; DT Boletín Científico CIOH; Centro de Investigaciones Oceanográficas e Hidrográficas: Cartagena de Indias, Colombia, 2009; pp. 4–10. [Google Scholar]
- Bula-Meyer, G. En: Reichel; Dolmatoff, G., Ed.; FONDO FEN-COLOMBIA: Caribe, Colombia, 1990; pp. 101–113. [Google Scholar]
- Corredor, J.E. Phytoplankton Response to Low Level Nutrient Enrichment through Upwelling in the Columbian Caribbean Basin. Deep Sea Res. Part A Oceanogr. Res. Pap. 1979, 26, 731–741. [Google Scholar] [CrossRef]
- Franco-Herrera, A. Oceanografía de la Ensenada de Gaira: El Rodadero, más que un Centro Turístico en el Caribe Colombiano, 1st ed.; Univ. de Bogotá Jorge Tadeo Lozano: Bogotá, Colombia, 2005; ISBN 978-958-9029-72-5. [Google Scholar]
- Loaiza Cerón, W.; Andreoli, R.V.; Kayano, M.T.; Ferreira de Souza, R.A.; Jones, C.; Carvalho, L.M.V. The Influence of the Atlantic Multidecadal Oscillation on the Choco Low-Level Jet and Precipitation in Colombia. Atmosphere 2020, 11, 174. [Google Scholar] [CrossRef] [Green Version]
- Poveda, G. La hidroclimatología de Colombia: Una síntesis desde la escala inter-decadal hastala escala. Rev. Acad. Colomb.Cienc. Tierra 2004, 28, 201–222. [Google Scholar]
- Poveda, G.; Waylen, P.R.; Pulwarty, R.S. Annual and Inter-Annual Variability of the Present Climate in Northern South America and Southern Mesoamerica. Palaeogeogr. Palaeoclimatol. Palaeoecol. 2006, 234, 3–27. [Google Scholar] [CrossRef]
- Arango, C.; Dorado, J.; Guzmán, D.; Ruiz, J. Climatología Trimestral de Colombia. 2015; p. 19. Available online: http://www.ideam.gov.co/documents/21021/21789/Climatolog%C3%ADa+Trimestral+para+Colombia+(Ruiz,+Guzman,+Arango+y+Dorado).pdf/c2825963-c373-449a-a7cb-8480874478d9 (accessed on 16 July 2021).
- Instituto de Hidrología, Meteorología y Estudios Ambientales; Instituto Alexander von Humboldt; Instituto de Investigaciones Marinas y Costeras “José Benito Vives De Andréis”; Instituto Amazónico de Investigaciones Científicas; Instituto de Investigaciones Ambientales del Pacífico; Instituto Geográfico Agustín Codazzi. Ecosistemas Continentales, Costeros y Marinos de Colombia; IDEAM; IGAC; IAvH; Invemar; I. Sinchi; IIAP; Imprenta Nacional de Colombia: Bogotá, Colombia, 2007; ISBN 978-958-8323-16-9. [Google Scholar]
- Instituto de Hidrología, Meteorología y Estudios Ambientales. Consulta y Descarga de Datos Hidrometeorológicos. Available online: http://dhime.ideam.gov.co/atencionciudadano/ (accessed on 12 December 2020).
- Climate Hazards Center CHPclim—High-Quality Monthly Rainfall Climatology. Available online: https://www.chc.ucsb.edu/data/chpclim (accessed on 12 December 2020).
- NASA (National Aeronautics and Space Administration). TRMM (TMPA) Precipitation L3 1 Day 0.25 Degree x 0.25 Degree V7 (TRMM_3B42_Daily). Available online: https://disc.gsfc.nasa.gov/datasets/TRMM_3B42_Daily_7/summary (accessed on 12 December 2020).
- Urrea, V.; Ochoa, A.; Mesa, O. Seasonality of Rainfall in Colombia. Water Resour. Res. 2019, 55, 4149–4162. [Google Scholar] [CrossRef]
- Pedreros, D.H.; Rojas, A.; Funk, C.; Peterson, P.; Landsfeld, M.F.; Husak, G.J. The Use of CHIRPS to Analyze Historical Rainfall in Colombia. In Proceedings of the AGU Fall Meeting Abstracts; American Geophysical Union: San Francisco, CA, USA, 2014. [Google Scholar]
- Alemu, M.M.; Bawoke, G.T. Analysis of Spatial Variability and Temporal Trends of Rainfall in Amhara Region, Ethiopia. J. Water Clim. Chang. 2020, 11, 1505–1520. [Google Scholar] [CrossRef]
- Lemma, E.; Upadhyaya, S.; Ramsankaran, R.J. Investigating the Performance of Satellite and Reanalysis Rainfall Products at Monthly Timescales Ac. Int. J. Remote Sens. 2019, 40, 4019–4042. [Google Scholar] [CrossRef]
- Asfaw, A.; Simane, B.; Hassen, A.; Bantider, A. Variability and Time Series Trend Analysis of Rainfall and Temperature in Northcentral Ethiopia: A Case Study in Woleka Sub-Basin. Weather Clim. Extrem. 2018, 19, 29–41. [Google Scholar] [CrossRef]
- Zakwan, M.; Ara, Z. Statistical Analysis of Rainfall in Bihar. Sustain. Water Resour. Manag. 2019, 5, 1781–1789. [Google Scholar] [CrossRef]
- Miró, J.J.; Caselles, V.; Estrela, M.J. Multiple Imputation of Rainfall Missing Data in the Iberian Mediterranean Context. Atmos. Res. 2017, 197, 313–330. [Google Scholar] [CrossRef]
- Zhu, H.; He, H.; Fan, H.; Xu, L.; Jiang, J.; Jiang, M.; Xu, Y. Regional Characteristics of Long-Term Variability of Summer Precipitation in the Poyang Lake Basin and Possible Links with Large-Scale Circulations. Atmosphere 2020, 11, 1033. [Google Scholar] [CrossRef]
- Engeland, K.; Borga, M.; Creutin, J.-D.; François, B.; Ramos, M.-H.; Vidal, J.-P. Space-Time Variability of Climate Variables and Intermittent Renewable Electricity Production—A Review. Renew. Sustain. Energy Rev. 2017, 79, 600–617. [Google Scholar] [CrossRef]
- Silva, A.T. Introduction to Nonstationary Analysis and Modeling of Hydrologic Variables. In Fundamentals of Statistical Hydrology; Naghettini, M., Ed.; Springer International Publishing: Cham, Switzerland, 2017; pp. 537–577. [Google Scholar]
- Arrieta-Castro, M.; Donado-Rodríguez, A.; Acuña, G.J.; Canales, F.A.; Teegavarapu, R.S.V.; Kaźmierczak, B. Analysis of Streamflow Variability and Trends in the Meta River, Colombia. Water 2020, 12, 1451. [Google Scholar] [CrossRef]
- Tadese, M.T.; Kumar, L.; Koech, R.; Zemadim, B. Hydro-Climatic Variability: A Characterisation and Trend Study of the Awash River Basin, Ethiopia. Hydrology 2019, 6, 35. [Google Scholar] [CrossRef] [Green Version]
- Hamed, K.H.; Ramachandra Rao, A. A Modified Mann-Kendall Trend Test for Autocorrelated Data. J. Hydrol. 1998, 204, 182–196. [Google Scholar] [CrossRef]
- Estupiñan-Castellanos, A.R. Estudio de la Variabilidad Espacio Temporal de la Precipitación en Colombia. Master’s Thesis, Universidad Nacional de Colombia—Sede Medellín, Medellín, Colombia, 2016. [Google Scholar]
- Guzmán, D.; Ruiz, J.F.; Cadena, M. Regionalización de Colombia Según La Estacionalidad de La Precipitación Media Mensual, a Través Análisis de Componentes Principales (ACP); IDEAM—Grupo de Modelamiento de Tiempo, Clima y Escenarios de Cambio Climático: Bogotá, Colombia, 2014; p. 54. [Google Scholar]
- Marrugo-Negrete, J.; Pinedo-Hernández, J.; Combatt, E.M.; Bravo, A.G.; Díez, S. Flood-induced Metal Contamination in the Topsoil of Floodplain Agricultural Soils: A Case-study in Colombia. Land Degrad. Dev. 2019, 30, 2139–2149. [Google Scholar] [CrossRef]
- Katsanos, D.; Retalis, A.; Michaelides, S. Validation of a High-Resolution Precipitation Database (CHIRPS) over Cyprus for a 30-Year Period. Atmos. Res. 2016, 169, 459–464. [Google Scholar] [CrossRef]
- Paredes Trejo, F.J.; Barbosa, H.A.; Peñaloza-Murillo, M.A.; Alejandra Moreno, M.; Farías, A. Intercomparison of Improved Satellite Rainfall Estimation with CHIRPS Gridded Product and Rain Gauge Data over Venezuela. Atmósfera 2016, 29, 323–342. [Google Scholar] [CrossRef] [Green Version]
- Mejía, F.; Mesa, O.; Poveda, G.; Vélez, J.; Hoyos, C.; Mantilla, R.; Barco, J.; Cuartas, A.; Montoya, M.; Botero, B. Distribución espacial y ciclos anual y semianual de la precipitación en Colombia. Dyna 1999, 66, 7–15. [Google Scholar]
- Pabón Caicedo, J.D.; Eslava Ramírez, J.A.; Gómez Torrez, R.E. Generalidades de la distribución espacial y temporal de la temperatura del aire y de la precipitación en Colombia. Meteorol. Colomb. 2001, 4, 47–59. [Google Scholar]
- Trojer, H. Fundamentos para una zonificación meteorológica y climatológica del trópico y especialmente de Colombia. Fundamentals for Tropical and Meteorological Zoning in the Tropics Especially Colombia, 1959. [Google Scholar]
- Hurtado-Montoya, A.F.H.; Mesa-Sánchez, Ó.J. Cambio climático y variabilidad espacio—Temporal de la precipitación en Colombia. Reveia 2015, 12, 131–150. [Google Scholar] [CrossRef]
- De Ideam, I.H. Meteorología y Estudios Ambientales; Estudio Nacional del Agua: Bogotá, Colombia, 2015; ISBN 978-958-8067-70-4. [Google Scholar]
- Quereda Sala, J.; Montón Chiva, E.; Escrig Barberá, J. La evolución de las precipitaciones en la cuenca occidental del Mediterráneo: ¿tendencia o ciclos? Ingeo 2000, 17–35. [Google Scholar] [CrossRef]
- Poveda, G.; Álvarez, D.M.; Rueda, Ó.A. Hydro-Climatic Variability over the Andes of Colombia Associated with ENSO: A Review of Climatic Processes and Their Impact on One of the Earth’s Most Important Biodiversity Hotspots. Clim. Dyn. 2011, 36, 2233–2249. [Google Scholar] [CrossRef]
- Puertas Orozco, O.L.; Carvajal Escobar, Y. Incidencia de El Niño-Oscilación del Sur en la precipitación y la temperatura del aire en Colombia, utilizando el Climate Explorer. Rev. Cient. Ing. Desarro. 2008, 23, 104–118. [Google Scholar]
- González-Rodríguez, E.; Villalobos, H.; Gómez-Muñoz, V.M.; Ramos-Rodríguez, A. Computational Method for Extracting and Modeling Periodicities in Time Series. Open J. Stat. 2015, 5, 604. [Google Scholar] [CrossRef] [Green Version]
- Eslava, J.A. Climatology and Climatic Diversity of Colombia. Rev. Acad. Colomb. Cienc. Exactas Fis. Nat. 1993, 18, 507–538. [Google Scholar]
- León, G.E.; Zea, J.A.; Eslava, J.A. General Circulation and the Intertropical Convergence Zone in Colombia. Meteorol. Colomb. 2000, 1, 31–38. [Google Scholar]
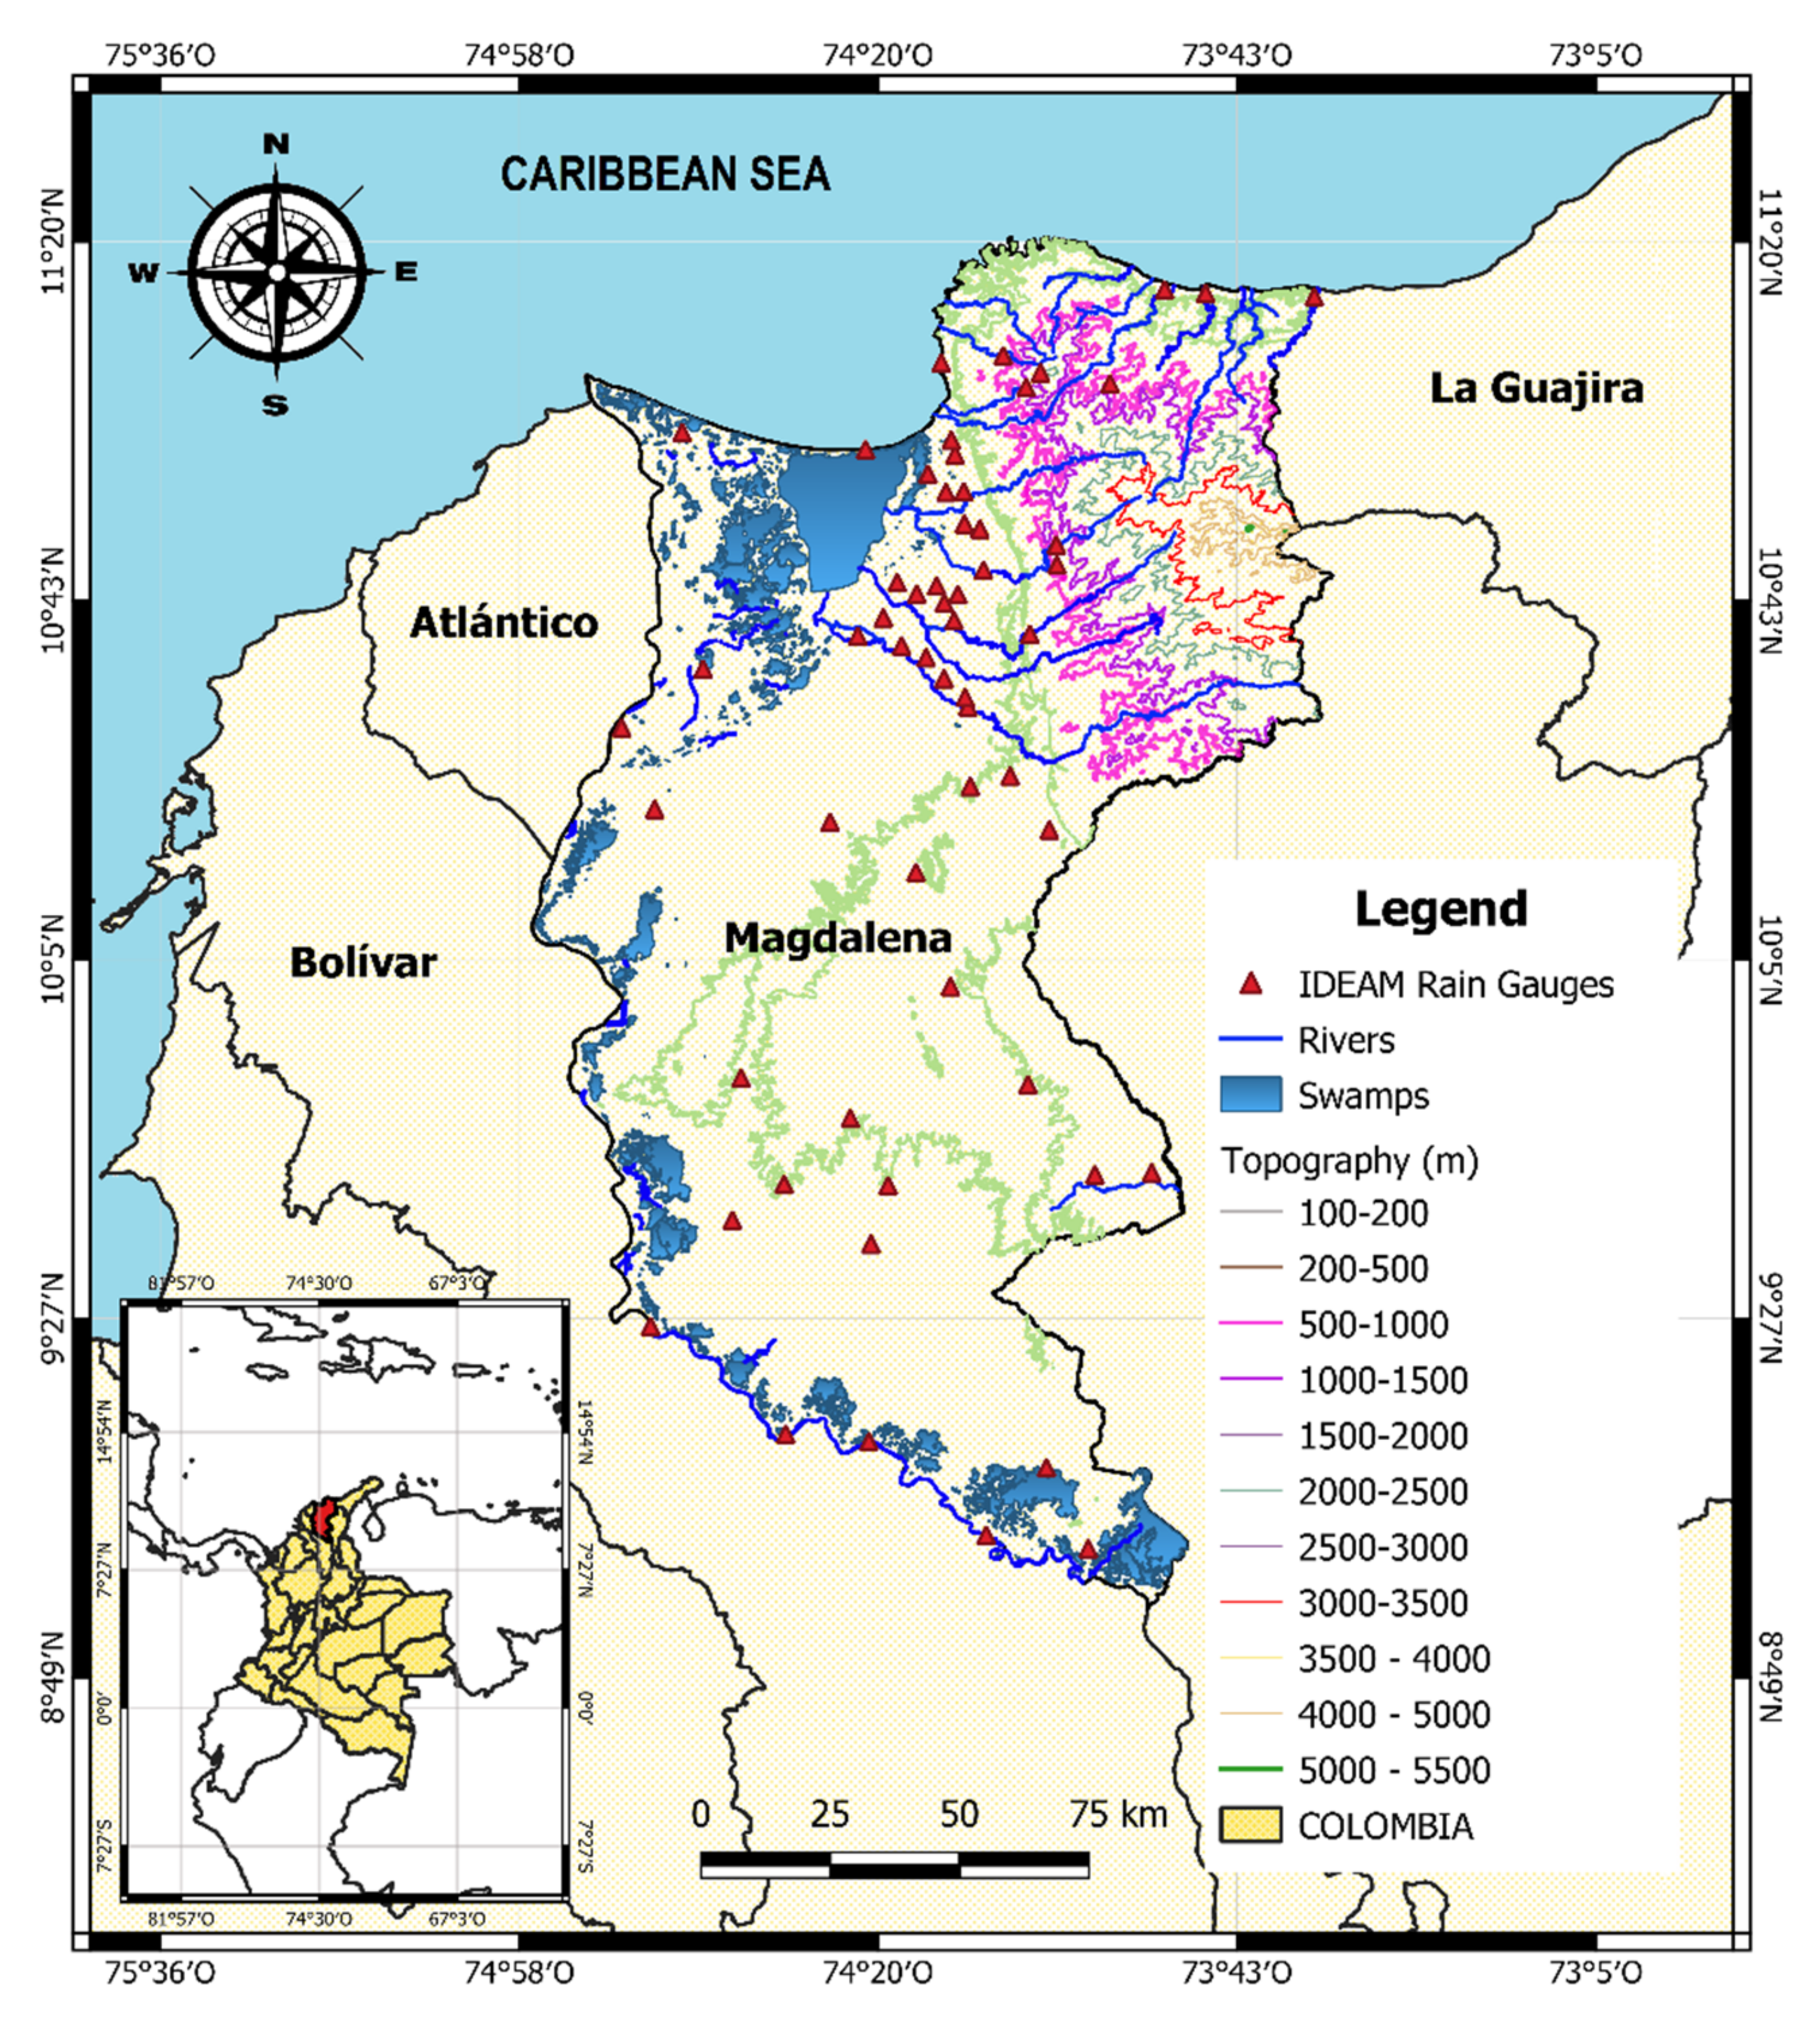
Figure 1.
Magdalena Department and geographical distribution of the 59 analyzed meteorological stations (red triangles) directed and supervised by the Institute of Hydrology, Meteorology, and Environmental Studies (IDEAM). Main rivers in Sierra Nevada de Santa Marta (west side, from north to south: Manzanares, Gaura, Frío, Sevilla, Tucurinca, Aracataca, and Fundación. North side, from west to east: Piedras, Mendihuaca, Guachaca, Buritaca, and Don Diego). Additionally, wetland systems that are part or flood plain of Magdalena River are showing. From north to south they are: Ciénaga Grande de Santa Marta, Cerro de San Antonio, Zapayán, Zárate-Malibú, Pijiño del Carmen, Rinconada, Chilloa, and Zapatosa.

Figure 2.
(a,b) Rain gauges used to validated CHIRPS data (downloaded from IDEAM website—http://dhime.ideam.gov.co/atencionciudadano/, accessed on 12 December 2020). The horizontal lines show the period covered by each IDEAM station, and the vertical dotted line indicates the starting period where the CHIRPS data and IDEAM rain gauges are compared (January 1981).
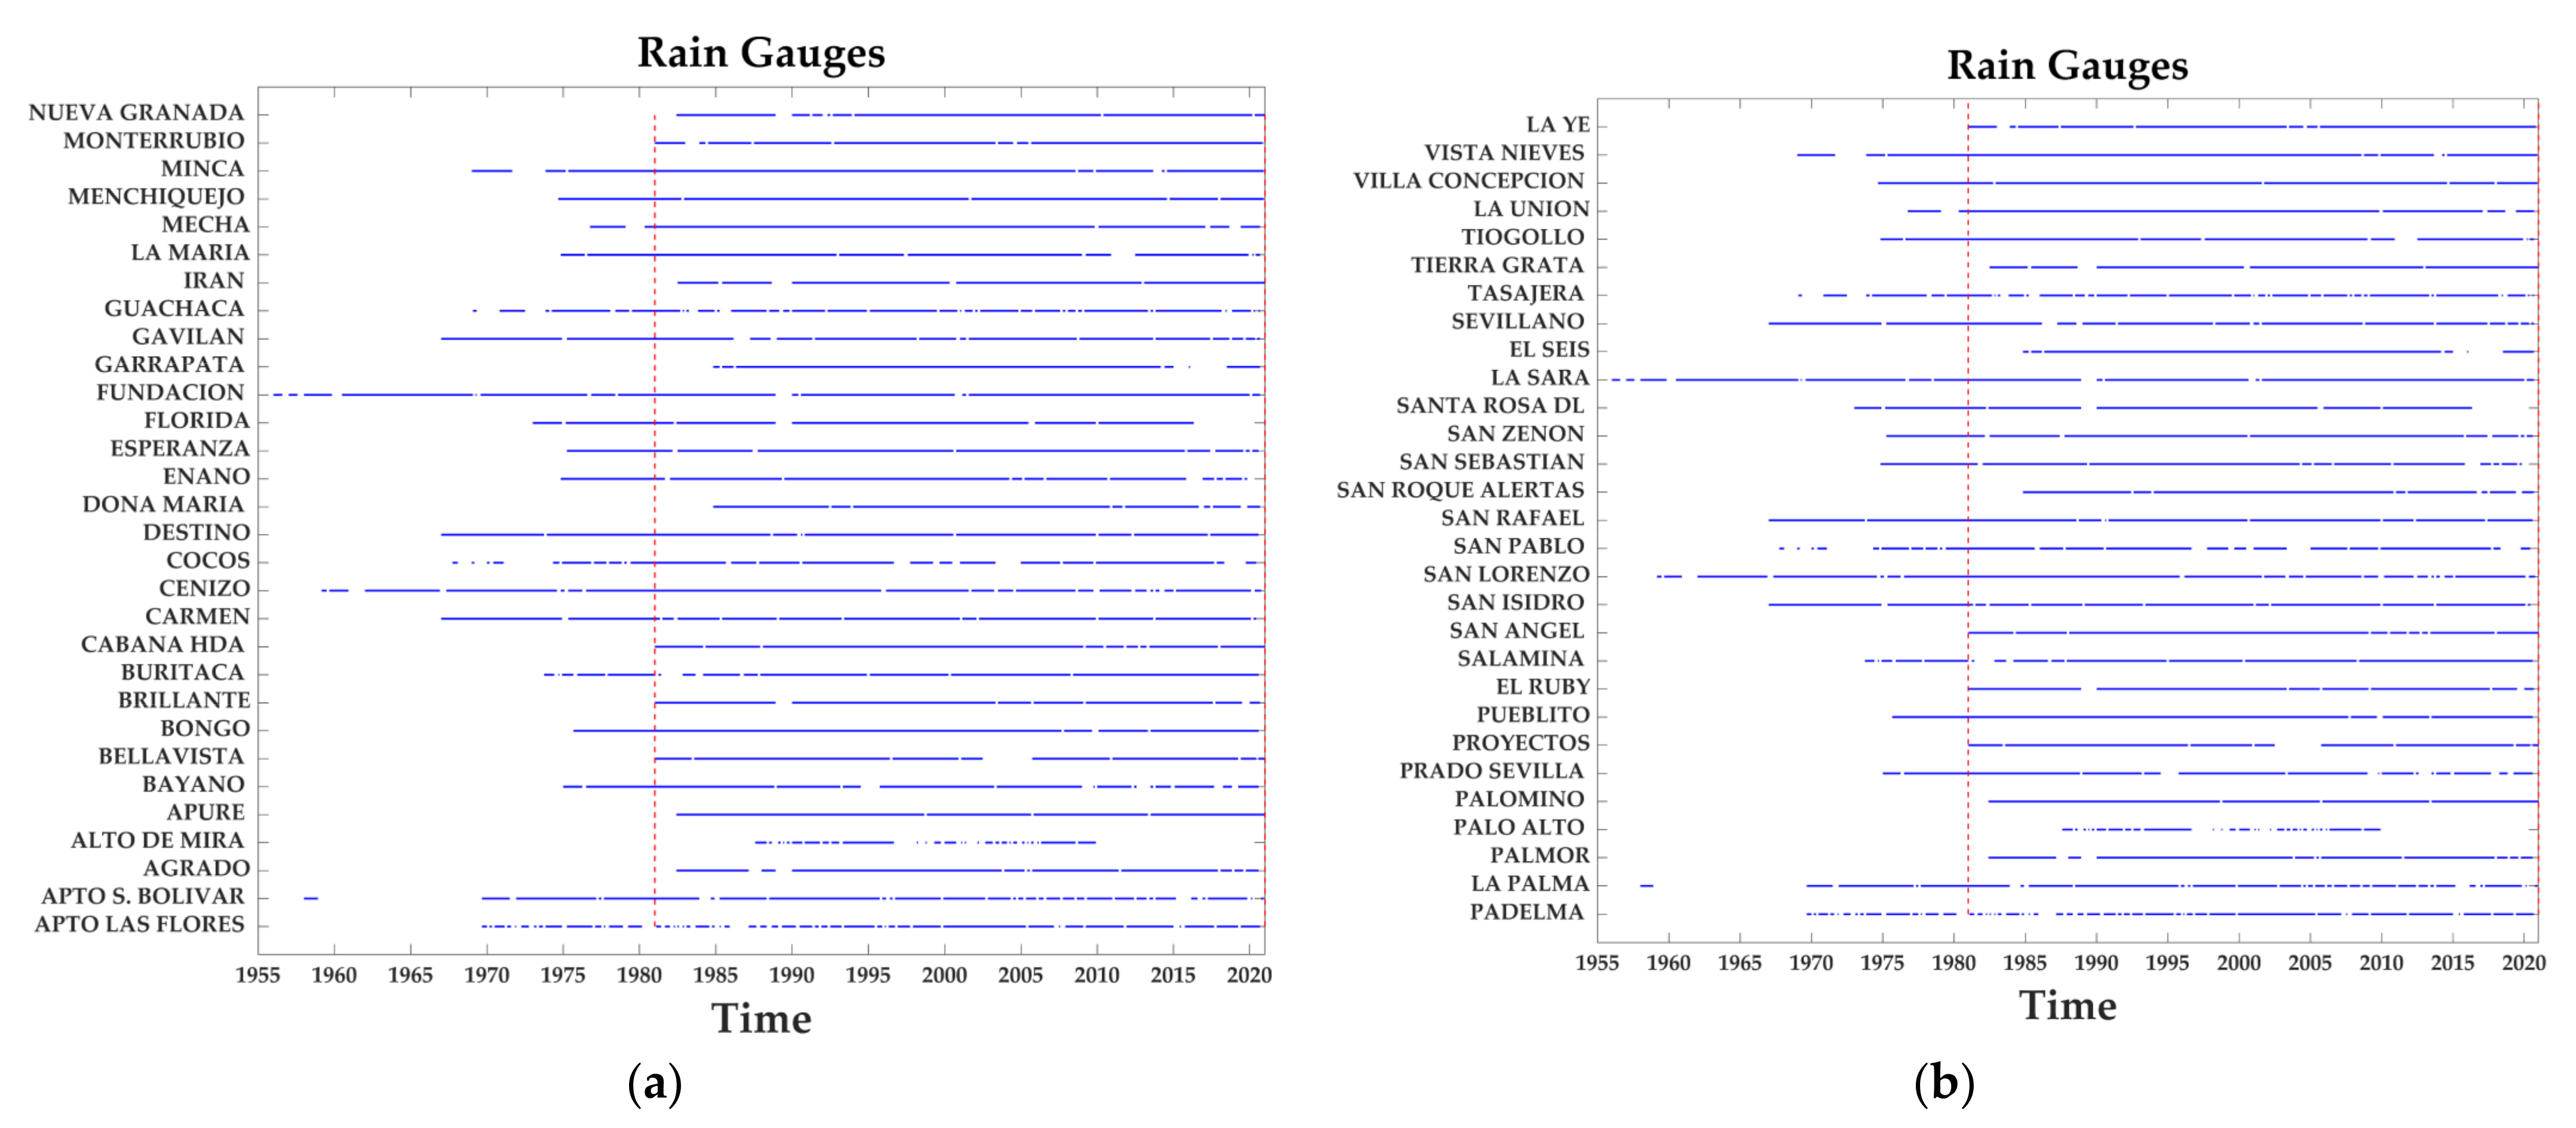
Figure 3.
Maps of the statistical metrics employed for evaluating the correspondence between the IDEAM and the CHIRPS v2.0 datasets for the 1981–2018 period at different points in the Magdalena Department: (a) bias; (b) mean absolute error (mm); (c) Spearman’s rho correlation.
Figure 3.
Maps of the statistical metrics employed for evaluating the correspondence between the IDEAM and the CHIRPS v2.0 datasets for the 1981–2018 period at different points in the Magdalena Department: (a) bias; (b) mean absolute error (mm); (c) Spearman’s rho correlation.

Figure 4.
Spatial distribution of mean total annual precipitation in the Magdalena Department for the 1981–2018 period based on the CHIRPS v2.0 database. The contour lines represent the coefficient variation for this variable. It includes four subregions identified based on spatial distribution of the total annual precipitation average and the coefficient of variation.

Figure 5.
Spatial distribution of the monthly precipitation in the Magdalena Department for the 1981–2018 period based on the CHIRPS v2.0 database. The contours represent the coefficient of variation for each month.
Figure 5.
Spatial distribution of the monthly precipitation in the Magdalena Department for the 1981–2018 period based on the CHIRPS v2.0 database. The contours represent the coefficient of variation for each month.
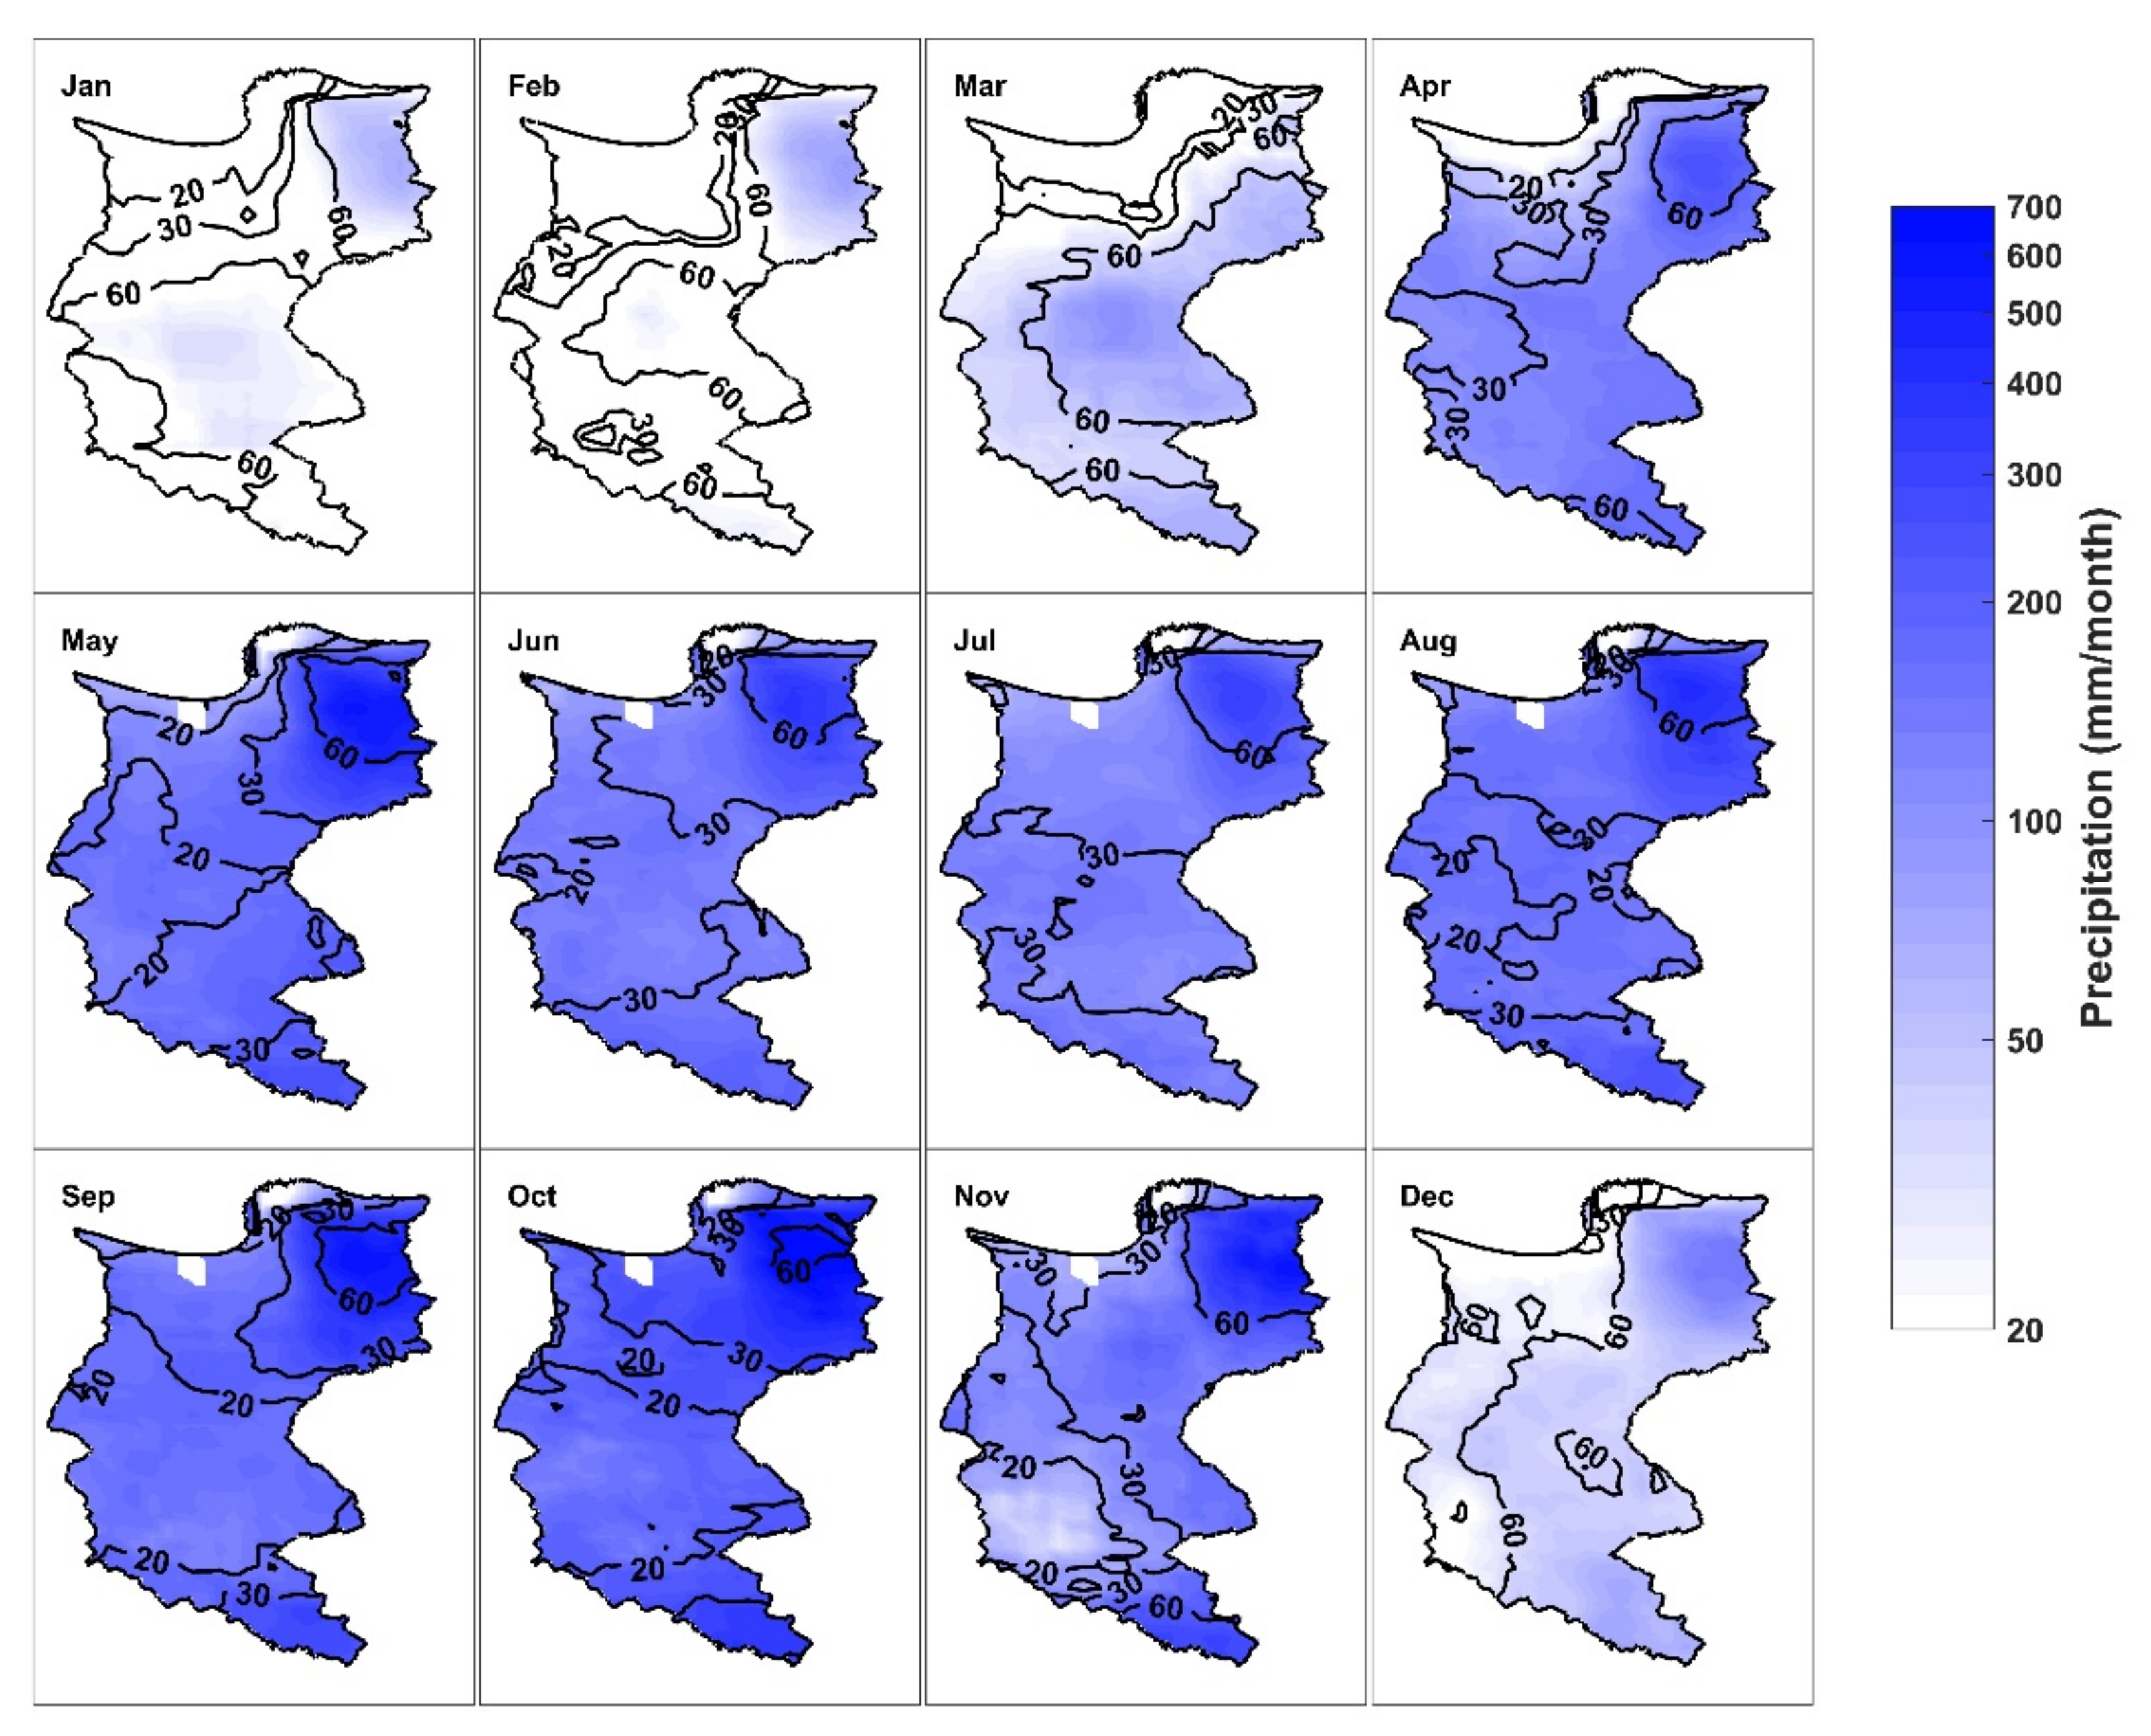
Figure 6.
Trends for total annual precipitation in the Magdalena Department during the 1981–2018 period based on the CHIRPS v2.0 database.
Figure 6.
Trends for total annual precipitation in the Magdalena Department during the 1981–2018 period based on the CHIRPS v2.0 database.

Figure 7.
Statistically significant trends detected for the annual cycle of total precipitation in the Magdalena Department during the 1981–2018 period based on the CHIRPS v2.0 database.
Figure 7.
Statistically significant trends detected for the annual cycle of total precipitation in the Magdalena Department during the 1981–2018 period based on the CHIRPS v2.0 database.

Figure 8.
Empirical orthogonal function (EOF) analysis based on the CHIRPS v2.0 database. (a) First variability mode—EOF1 and (b) second variability mode—EOF2. (c) Spectrum of PC1 during 1981–2018. (d) Spectrum of PC2 during 1981–2018.
Figure 8.
Empirical orthogonal function (EOF) analysis based on the CHIRPS v2.0 database. (a) First variability mode—EOF1 and (b) second variability mode—EOF2. (c) Spectrum of PC1 during 1981–2018. (d) Spectrum of PC2 during 1981–2018.

Figure 9.
Top: total annual precipitation in the north (SNSM), south, and central-west zones in the Magdalena Department. Bottom: annual average of the sunspots total number (SILSO data/image, Royal Observatory of Belgium, Brussels) and South Oscillation Index (opposite sign, www.ncdc.noaa.gov/teleconnections/enso/indicators/soi/, accessed on 12 March 2021).

Publisher’s Note: MDPI stays neutral with regard to jurisdictional claims in published maps and institutional affiliations. |
© 2021 by the authors. Licensee MDPI, Basel, Switzerland. This article is an open access article distributed under the terms and conditions of the Creative Commons Attribution (CC BY) license (https://creativecommons.org/licenses/by/4.0/).
Share and Cite
MDPI and ACS Style
Morales-Acuña, E.; Linero-Cueto, J.R.; Canales, F.A. Assessment of Precipitation Variability and Trends Based on Satellite Estimations for a Heterogeneous Colombian Region. Hydrology 2021, 8, 128. https://doi.org/10.3390/hydrology8030128
AMA Style
Morales-Acuña E, Linero-Cueto JR, Canales FA. Assessment of Precipitation Variability and Trends Based on Satellite Estimations for a Heterogeneous Colombian Region. Hydrology. 2021; 8(3):128. https://doi.org/10.3390/hydrology8030128
Chicago/Turabian StyleMorales-Acuña, Enrique, Jean R. Linero-Cueto, and Fausto A. Canales. 2021. "Assessment of Precipitation Variability and Trends Based on Satellite Estimations for a Heterogeneous Colombian Region" Hydrology 8, no. 3: 128. https://doi.org/10.3390/hydrology8030128
Note that from the first issue of 2016, this journal uses article numbers instead of page numbers. See further details here.