Article

Automated Defect Detection Using Threshold Value Classification Based on Thermographic Inspection

1
Department of Future Convergence Engineering, Kongju National University, 1223-24 Cheonan-Daero, Seobuk-gu, Cheonan-si 31080, Korea
2
Department of Mechanical Engineering, Kongju National University, 1223-24 Cheonan-Daero, Seobuk-gu, Cheonan-si 31080, Korea
3
Department of Mechanical Engineering, School of Engineering, Kathmandu University, Dhulikhel 45200, Nepal
*
Author to whom correspondence should be addressed.
Appl. Sci. 2021, 11(17), 7870; https://doi.org/10.3390/app11177870
Submission received: 21 July 2021 / Revised: 20 August 2021 / Accepted: 23 August 2021 / Published: 26 August 2021

Abstract

:
Active infrared thermography is an attractive and reliable technique used for the non-destructive evaluation of various materials and structures, because it enables non-contact, large area, high-speed, quantitative, and qualitative inspection. However, the defect detectability is significantly deteriorated due to the excitation of a non-uniform heat source and surrounding environmental noise, requiring additional signal processing and image characterization. The lock-in infrared thermography technique has been proven to be an effective method for quantitative evaluation by extracting amplitude and phase images from a 2D thermal sequence, but it still involves a lot of noise, providing difficulties in detection. Therefore, this study explored the possibility of improving the signal-to-noise ratio by applying filtering to a stainless-steel plate with circular defects. Thereafter, automated defect detection was performed based on the threshold value through the binary images. In addition, a comparative analysis was performed to evaluate the detectability according to the presence or absence of a filtering application.

1. Introduction

The importance of non-destructive testing (NDT) in industry occupies a large part of the inspection of machines or structures in various fields such as shipbuilding, automobiles, construction, civil engineering, and nuclear power [1,2,3]. Structural steel used for these elements must maintain the strength range required, but the presence of defects causes changes in local mechanical properties and has a fatal impact on stability and lifespan [4,5]. Therefore, it is necessary to inspect for defects in order to reduce effects such as fractures.
Stainless steel (STS) has excellent formability, corrosion resistance and heat resistance. In particular, austenitic stainless steel has high mechanical properties and corrosion resistance; therefore, it can be applied in a wide temperature range and various operating conditions, from cryogenic to high temperature [6,7,8]. In general, it is used in various fields such as interior and exterior materials for construction, automobile parts, aircraft fuselages, and medical devices. However, defects can occur during manufacturing and maintenance steps [9]. Therefore, NDT techniques for detecting defects present on the surface or inside are very important.
A variety of NDT studies have been performed, such as eddy current testing [10,11,12,13], ultrasonic [14,15], acoustic emission [16,17], radiographic [18], liquid penetrant testing [9], magnetic-particle inspection [19,20], and infrared thermography. Magnetic particle inspection, liquid penetrate test, and ultrasonic have typically used as NDT inspection techniques applied to STS material inspection. Recently, infrared thermography (IRT) techniques capable of quantitative evaluation have been applied in many fields.
IRT for non-destructive testing and evaluation (NDT&E) is mainly applied to detect subsurface features (backside defect, anomalies, etc.) [5,21,22]. IRT is a technology that analyzes and acquires thermal response signals using a non-contact thermal imaging device [23]. IRT detects radiation energy emitted from objects in the infrared range of the electromagnetic spectrum. The infrared range corresponds to wavelengths longer than the visible portion of the spectrum. Therefore, IRT can be utilized to detect defects inside the surface of metal plates. Based on these characteristics of IRT, it is possible to effectively detect a backside defect.
In this study, lock-in infrared thermography, one of the active IRT techniques, was applied to automatically detect defects on the backside of STS304 metal plates. For clear defect detection, binarization processing using grayscale-based histograms and first, second de-noising were performed. Automatic defect detection was performed based on the threshold value using the metric roundness equation. Finally, a detectability analysis according to filtering was performed.
The reminder of the paper is composed as follows. In Section 2, The theory of lock-in signal processing and the Otsu algorithm is provided. Section 3 describes the information of STS304 and experimental process. Section 4 presents experimental data, and Section 5 concludes the paper.

2. Theory

2.1. Image Processing

Lock-in infrared thermography (LIT) is a technique in which a heat source in the form of a harmonic function is incident on an object and the response signal generated at this time is processed to obtain changes in phase and amplitude [8,24]. Many previous studies on LIT techniques have been conducted [25,26,27,28,29]. Therefore, image processing for automatic defect detection was performed based on this technique.
Figure 1 shows the overall process of this study. The study process is as follows:
  • Step 1: 2D thermal images were acquired using two halogen lamps for heat source excitation. Then, phase and amplitude images were acquired by applying the lock-in signal processing technique;
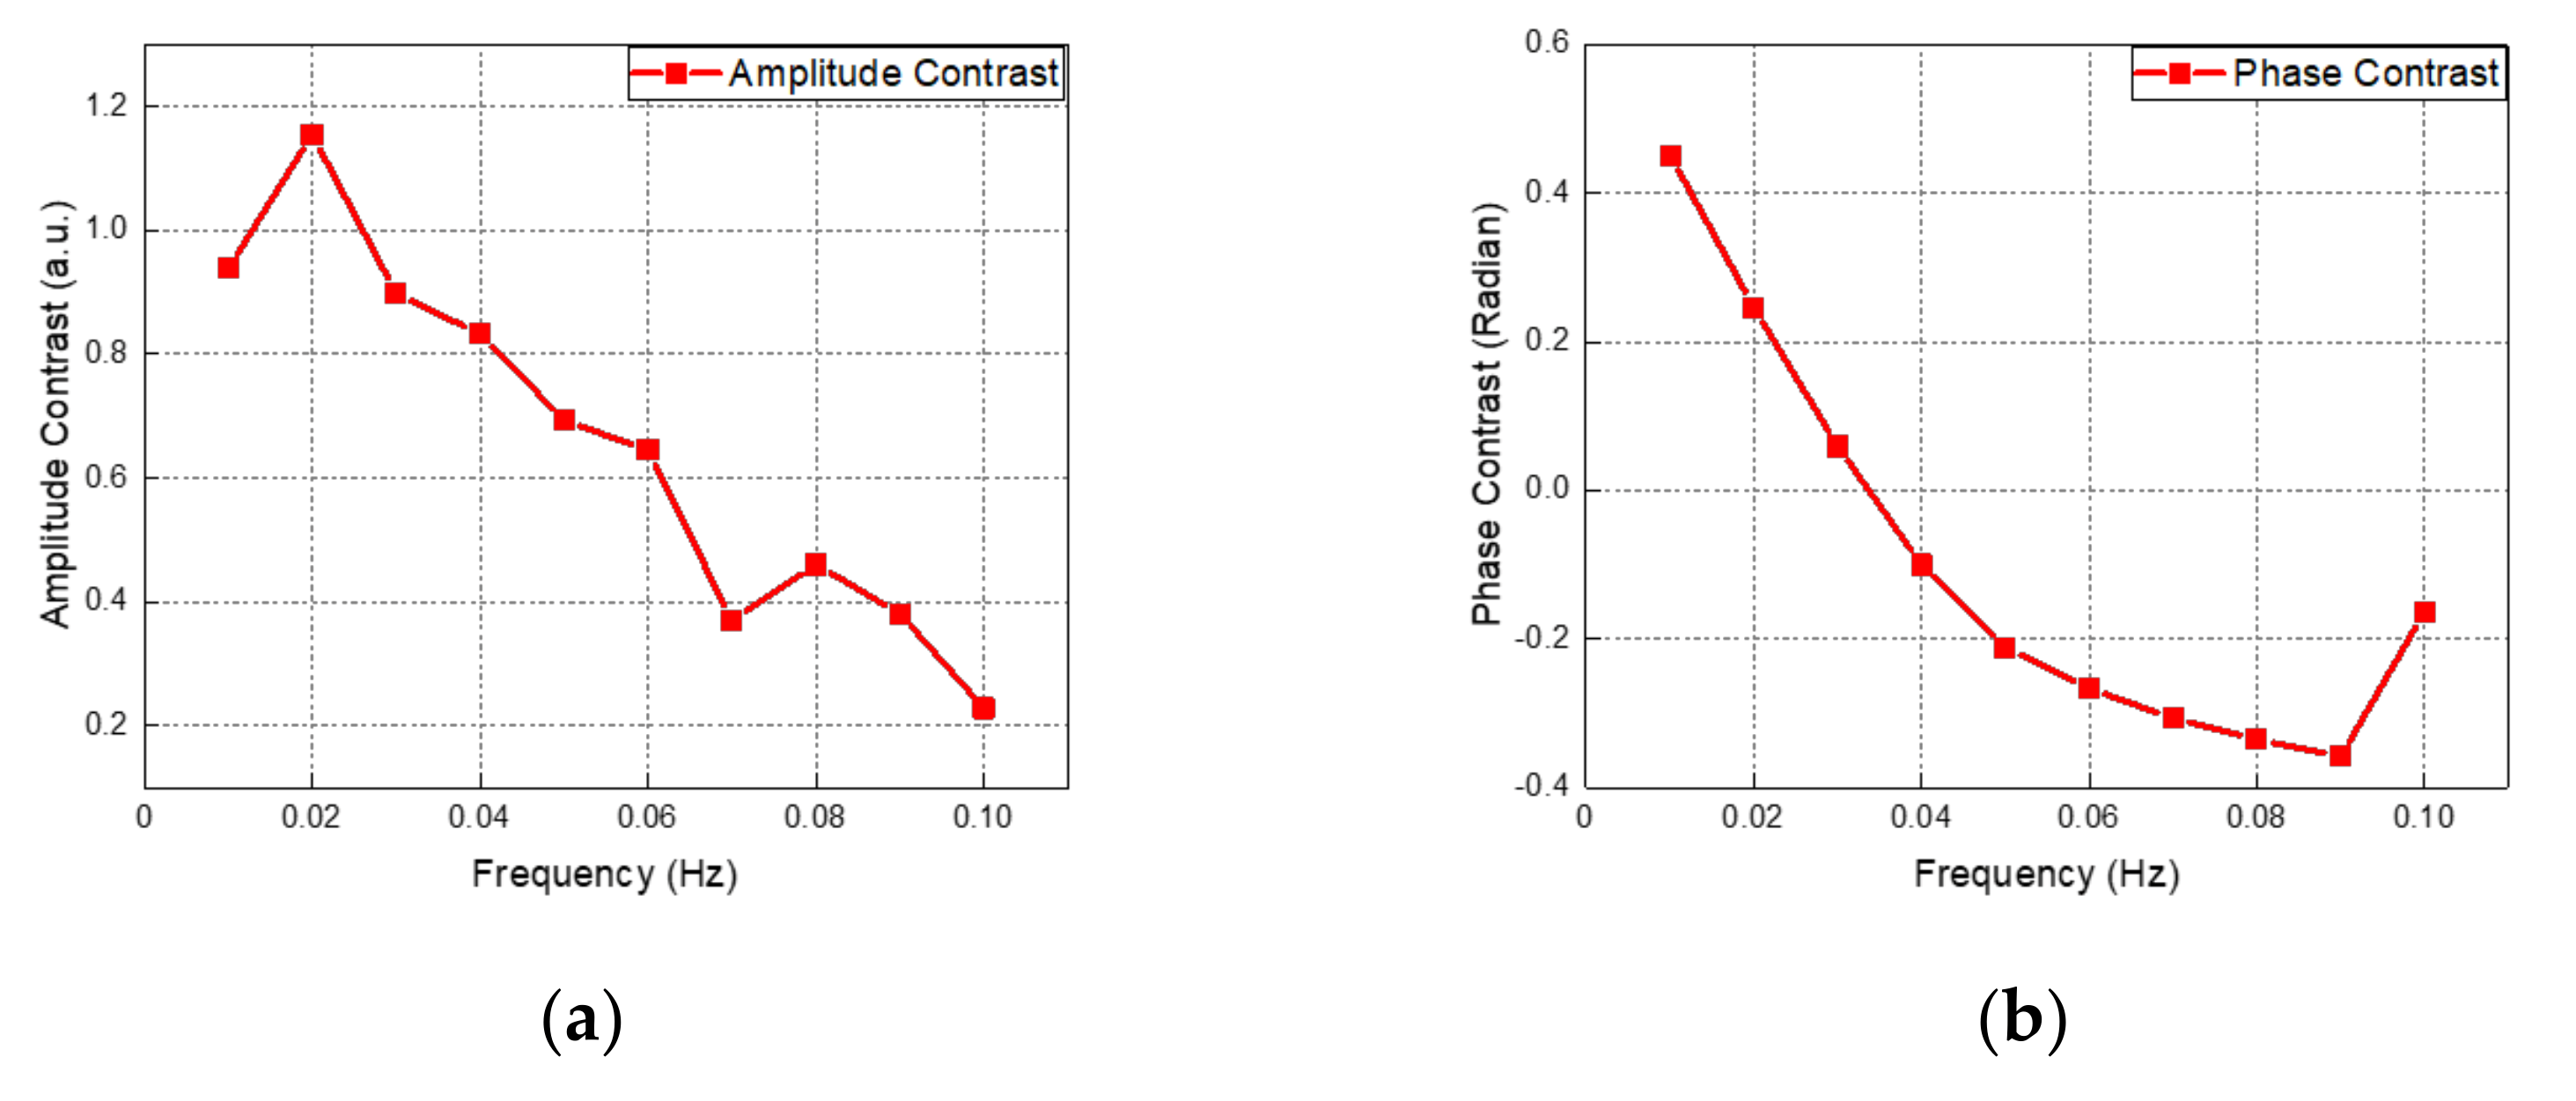
  • Step 2: Contrast evaluation was performed to analyze the optimum frequency of phase and amplitude images at the excitation frequency set in this study;
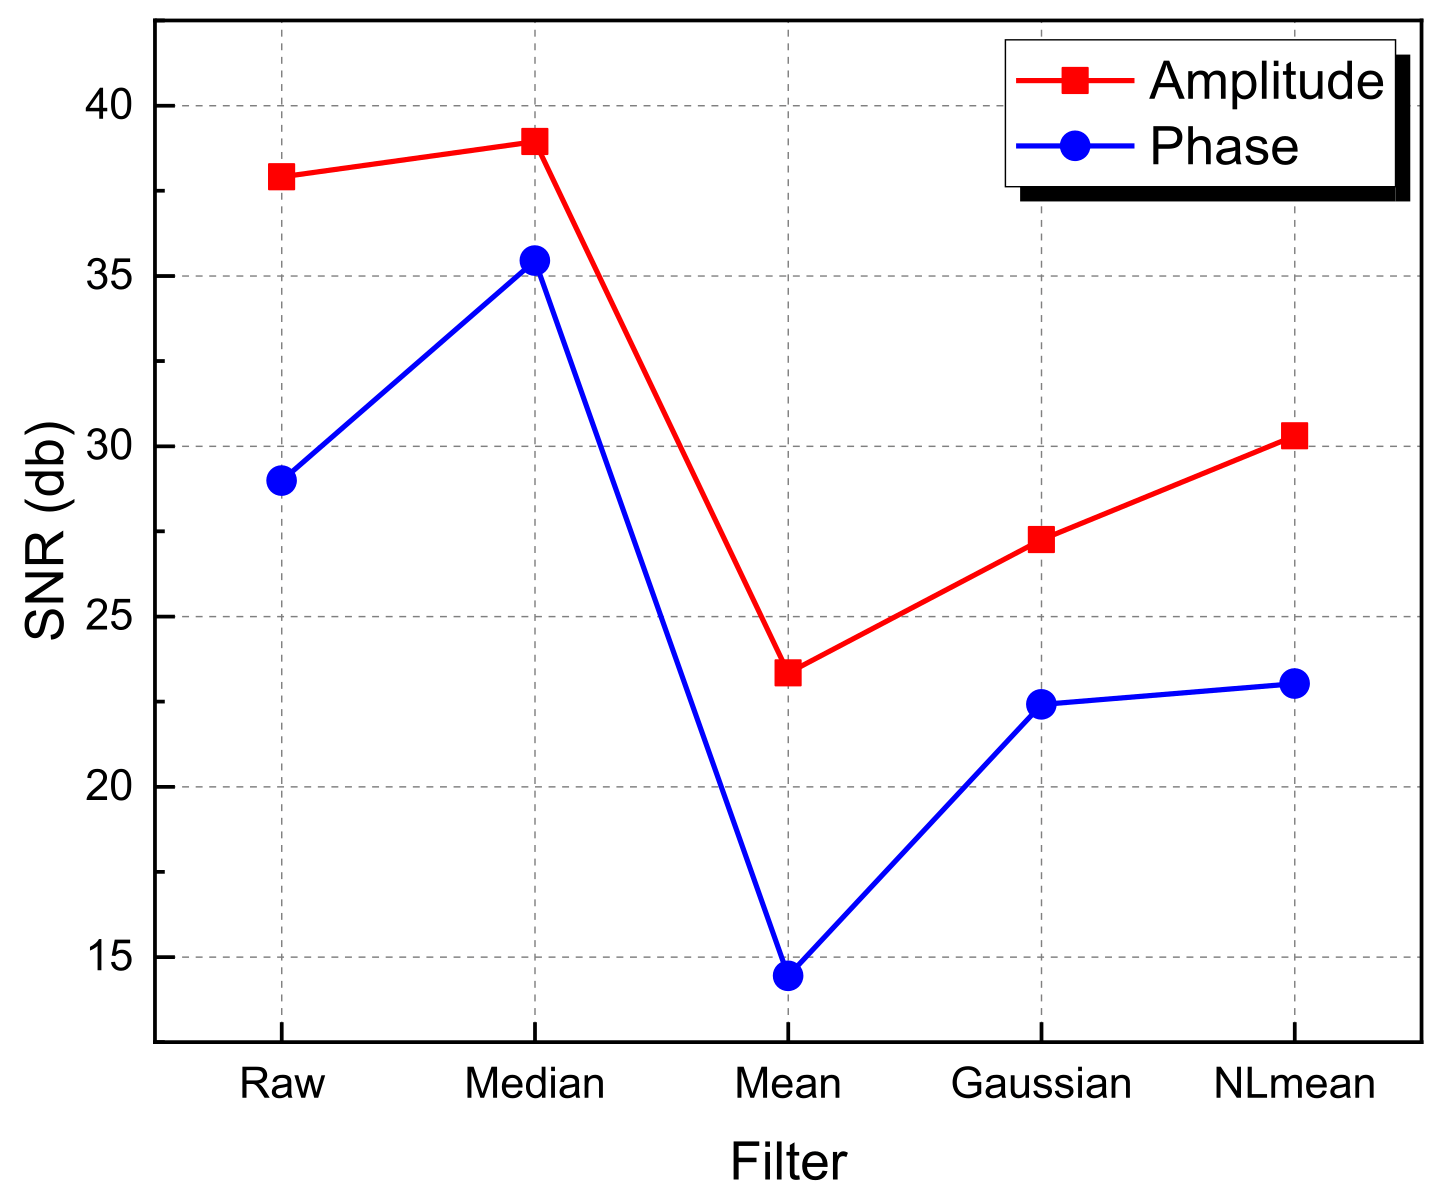
  • Step 3: Filtering (mean, median, NLmean, Gaussian) for the first de-noising was applied, and the signal-to-noise ratio (SNR) was calculated to perform comparative analysis with non-filtering images;
  • Step 4: Utilizing a grayscale-based histogram to find the optimal threshold value that can be classified as ‘class 1’ and ‘class 2’ for the binary image;
  • Step 5: There was still noise in the binary image; therefore, the second de-noising was performed. After tracing the boundary line of the defect in the image, the metric equation was introduced to analyze the automatic defect detection based on the threshold value.
The main core of the image processing performed in this study is the binarization image processing, which is discussed in the next section.

2.2. Optimum Threshold Value

There are many techniques to analyze an image. Among them, the simplest and easiest method is binarization of an image using a threshold value. This is used in many pre-processing steps of image processing, such as separating the background from an object in an image, extracting only pixels with a brightness value above a certain level, or simplifying the overall information of the image. The Otsu algorithm is the most representative method for calculating the threshold value of an image.
The Otsu algorithm is a technology which calculates the optimal threshold value that can classify images into two classes by using a histogram based on a grayscale level. In the binary image, [0, k] is classified as ‘class 0’, and [k, 1] is classified as ‘class 1’ based on the threshold value k. Through this process, binary images can be acquired based on a threshold value. In general, converting a 2D thermal image to a binary image can clearly characterize the characteristics of the defects [30,31,32].
In order to classify into two binary images, it is necessary to calculate an optimal threshold value. If it is an M × N image with L intensity levels such as 0, 1, 2, …, L − 1, pixels with intensity values within [0, k] are classified as class 1, and intensity values within [k + 1, L + 1] are classified as class 2. The probability that a pixel is classified into class 1 or 2 is as follows [33,34]:
P 1 k = i = 0 k p i
P 2 k = 1 P 1 k
The average intensity values of pixels classified into classes 1 and 2 are as follows:
m 1 k = 1 P 1 k i = 0 k iP i
m 2 k = 1 P 2 k i = k + 1 L 1 iP i
There are mean intensity values up to the k level, which of all images is
m G = P 1 m 1 + P 2 m 2
In order to calculate the optimal threshold value, the Otsu algorithm should allow the concept of between-class variance. The equation of between-class variance is as follows:
σ b 2 = m G P 1 m 2 P 1 1 P 1
Calculating the optimal k value is a simple principle, although the optimal k value can be calculated only by substituting all k values in the intensity range [0, L − 1]. The k value was calculated using MATLAB software, and the principle of the Otsu algorithm is to classify the image based on the k value obtained in this way.

3. Experimental Configuration

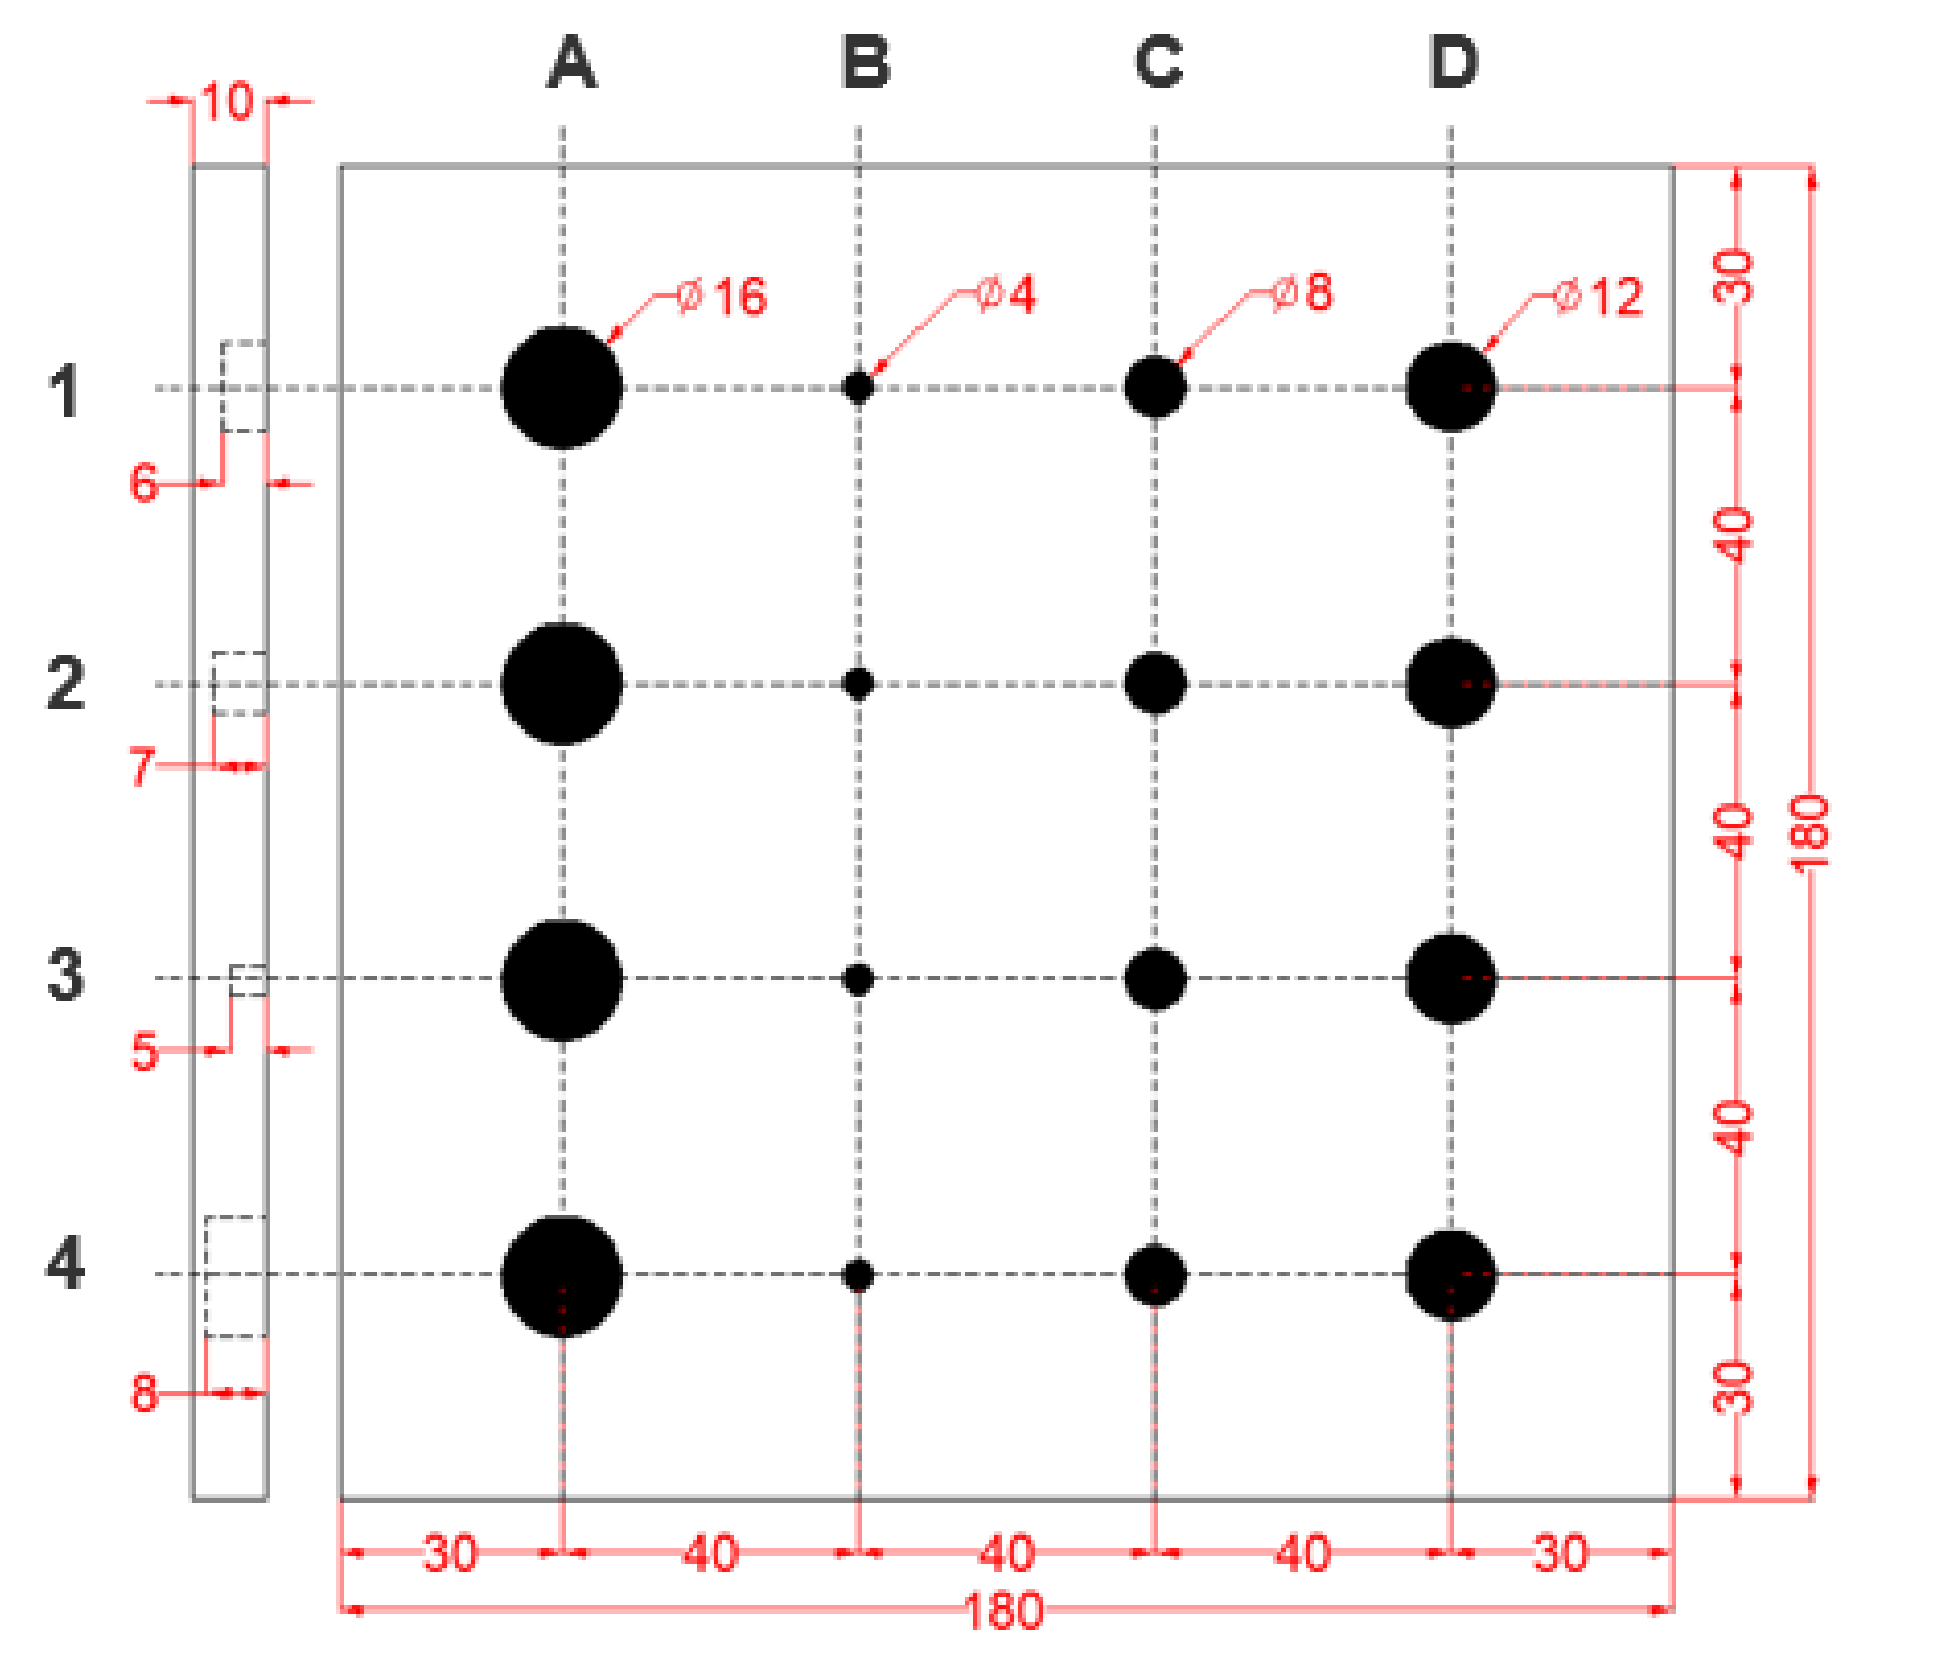
3.1. STS304 Reference Specimen

In this study, a specimen made of STS304 with a flat surface was used. This STS304 reference specimen was provided the Korea Research Institute of Standards and Science (KRISS) in Korea [3]. Artificial defects with various aspect ratios exist, with the same depth on the row axis and the same diameter on the column axis. Figure 2 shows the dimensions of the edges and each defect in the specimen. It is a square plate with a thickness of 10 mm and dimensions 180 × 180 mm. Artificial defects with various aspect ratios were processed on the subsurface of the plate to analyze the defect detectability of the technique. Referring to Figure 2, defects on each row axis were indexed as A, B, C, and D, and defects on the column axis were indexed as 1, 2, 3, and 4. Accordingly, the 16 defects present in the plate were indexed with unique marks. For example, the indexing of the deepest and widest defects among existing defects was ‘A4’. The front of the plate was coated with KRYLON black paint to maintain an emissivity of 0.95 or more. Figure 3 shows the front and back of the specimen, and Table 1 shows the material properties of STS304.

3.2. Experimental Setup of LIT

The LIT experimental device used in this study consisted of an STS304 specimen, infrared camera, function generator, power amplifier, and halogen lamps, and is shown in Figure 4. The experiments in this study were conducted in an isolated dark room containing the inspector and all equipment. Two 1 kW halogen lamps was used as excitation heat sources, and were controlled by a function generator (Agilent 33210A, Petaling Jaya, Malaysia) and power amplifier. For uniform heat source excitation, the thermal contrast between both ends of the specimen was set not to exceed 0.2 °C. An SC645 IR camera (un-cooled, 640 × 480 pixels, 7.5~13 μ m ) model was used to measure the thermal response of the specimen surface [3,26]. The FOV (field of view) of the lens attached to the IR camera was 25° ( H ) × 19° ( V ) and focal length was 24.6 mm. The distance between the specimen and IR camera was set to 800 mm to match the size of the specimen to the 2D thermal image output to the PC in real time. The thermal image was acquired using FLIR R&D commercial software, and the frame rate of the IR camera for image acquisition was set to 50 Hz.

4. Results and Discussion

4.1. Lock-In Signal Images

After excitation on the specimen of a halogen lamp, which is an external heat source, the thermal response of the surface was obtained by converting it into a 2D image. Then, amplitude and phase images were acquired; Figure 5 shows the amplitude and Figure 6 shows the phase image. Each image was scaled for qualitatively clear defect detection. The use of two halogen lamps caused non-uniform thermal responses of the specimen surface. Therefore, it can be visually confirmed that there was a lot of noise.
The optimum frequencies of amplitude and phase images were calculated at the excitation frequency set in this study. To calculate the optimum frequency, two ROIs of 5 × 5 pixels (one at the center of defective area and another in the adjacent sound area) were considered. Then, contrast evaluation was performed using Equation (7) [28]:
Δ c = DROI mean SROI mean
where DROI mean and SROI mean are the average values of the defective area and sound area, respectively.
Figure 7 shows the ROI contrasts of amplitude and phase for each excitation frequency. An amplitude of 0.02 Hz and a phase of 0.01 Hz were evaluated. In both images, it can be seen that the higher the frequency, the lower the contrast. This can be regarded as a result of insufficient heat being supplied because the excitation frequency is higher. It can be seen that the higher the excitation frequency, the lower the defect detectability.

4.2. Filtering

After calculating the optimum frequency for the first de-noising, filtering was applied to each image. The applied filtering was mean, median, NLmean and Gaussian. A total of five images, which were the filtered and non-filtering images, were compared and analyzed. The SNR was calculated to evaluate the improvement of the defect detectability of the de-noising image. The SNR is defined as the ratio of the signal strength to the noise strength that disturbs the signal. The defect area was considered as ‘signal’ and the sound area as ‘noise’. The ROI area was the same as the area where the contrast evaluation was performed, and the SNR equation is as follows [28,35,36]:
SNR = 20 log 10 DROI mean SROI mean σ
where DROI mean and SROI mean are the arithmetic mean of all the pixels in the defective area and the sound area, respectively, and σ is the standard deviation of all the pixels in the sound area.
Figure 8 shows the non-filtering raw image and the filtering image. Based on the raw image, it can be seen that the Gaussian image and the NLmean image have significantly lower detectability. However, it is difficult to qualitatively evaluate improvements in the median image and mean image. Therefore, quantitative detectability was evaluated using the SNR equation of Equation (8); Figure 9 shows the SNR value of each image. Both amplitude and phase signal processing had the highest detectability in median images. In addition, it can be seen that the detectability was improved compared to the raw image to which non-filtering was applied.

4.3. Automatic Defect Detection

For automatic defect detection of amplitude and phase signal processing images, binarization processing using the Otsu algorithm was performed on images to which median filtering was applied. The optimum threshold values for amplitude and phase for binarization are 25 and 27, respectively, as shown in Figure 10.
The process for second de-noising after binarization is as follows. Firstly, by using the ‘bwareaopen’ morphology function, all objects with fewer than 50 pixels that did not belong to the desired object were removed. Secondly, by using the ‘strel’ function, the gaps of defects in the image were filled in. Thirdly, boundary lines were traced to recognize defects in the image. In order to improve the processing speed, the ‘noholes’ function was used, which prevented finding inner contours. These functions were applied individually in MATLAB software.
After performing the second de-noising, a metric equation for automatic defect detection was used. The area and perimeter of each defective object were measured, and based on the results, a simple metric representing the roundness of the object was established, as follows [37]:
metric = 4 π × area perimeter 2
This metric is 1 for circles only and less than 1 for all other shapes. This classification process can be adjusted by setting an appropriate threshold value. The roundness threshold value for defect detection was set to 0.75. Figure 11 shows an image with the automatic defect detection of amplitude and phase. The roundness of the ‘B3’ defect in the amplitude image was calculated as 0.37; therefore, it was not recognized as a defect. In the raw amplitude image of Figure 5, the defect in the ‘B’ column was visually undetectable. Therefore, no defects were detected in the ‘B’ column, even in the binary image. The phase image can confirm that more defects than amplitude images were detected.

4.4. Detectability Comparative

After the binary process, an analysis was performed to compare the detectability improvement depending on whether or not filtering was applied. In the previous study process, comparative analysis was performed through SNR calculation, but only some specific areas using ROI were calculated. Root mean square error (RMSE) was calculated to evaluate the overall detectability of amplitude and phase images. The lower the RMSE value, the smaller the difference in the real value and the estimated value, which means that the precision is high. Therefore, it can be interpreted as meaning that the detectability is high, and the equation is as follows [3]:
RMSE θ 1 , θ 2 = i = 1 n ( θ 1 , i θ 2 , i ) 2 n
where θ 1 is the real value (percentage value of roundness of raw image defects), θ 2 is the estimated value (percentage value of roundness of binary image defect), and n is the number of areas. The real value means the roundness percentage of the actual defects, and all defects were set to 100.
Table 2 shows the roundness values for all defects in the amplitude and phase images of filtering and non-filtering, and the calculated RMSE value for all defects. Unrecognized defects in the binary image were excluded. It can be seen that both amplitude and phase had high detectability in the filtered image. According to Table 2, the same number of defects were detected regardless of the filtering. However, in order to improve the detectability of defects, it is necessary to increase the threshold of the roundness; therefore, the application of filtering can be considered important.

5. Conclusions and Future Works

In this study, the automatic defect detection of backside of STS304 plate based on lock-in infrared thermography was performed. The concept of lock-in signal processing and the Otsu algorithm for binarization was reviewed. In addition, a research process for automatic defect detection was presented, and first and second de-noising were performed. SNR evaluation was performed after applying median filtering to remove noise from the signal processing image: the amplitude image improved by 2.67%, and the phase image improved by 18.22%. After applying the Otsu algorithm for binarization processing, second de-noising and boundary line tracking were performed for automatic defect detection. As a result of applying the roundness metric equation, more defects were detected in the phase image than the amplitude image. As a final process, RMSE was calculated to evaluate the detectability according to filtering.
However, there were two major limitations in this study. First, a lot of noise was generated after the lock-in signal processing because uniform heat was not provided by using two halogen lamps. Secondly, the metric was a roundness equation, and there is a limit to the detection of circular defects. Although there were such limitations, this paper proposes that it is possible to detect circular defects in a short time by constructing a simple algorithm mechanism.
In future research, an advanced noise removal technique that can improve the detectability for circular backside defects will be considered. In addition, a study to establish a mechanism capable of real-time automatic defect detection is required.

Author Contributions

Conceptualization, S.L., Y.C., and W.K.; methodology, S.L., Y.C. and R.S.; software, S.L. and Y.C.; validation, S.L., Y.C. and R.S.; formal analysis, Y.C. and R.S.; investigation, S.L., Y.C., R.S. and W.K.; resources, W.K.; data curation, R.S.; writing—original draft preparation, S.L.; writing—review and editing, W.K.; visualization, Y.C.; supervision, W.K.; project administration, W.K.; funding acquisition, W.K. All authors have read and agreed to the published version of the manuscript.

Funding

This work was supported by the National Research Foundation of Korea (NRF-2019R1F1A1061328) funded by the Korean government, Ministry of Education, Science and Technology (MEST).

Institutional Review Board Statement

Not applicable.

Informed Consent Statement

Not applicable.

Data Availability Statement

Due to the nature of this research, participants of this study did not agree for their data to be shared publicly and only available upon reasonable request.

Conflicts of Interest

The authors declare no conflict of interest.

References

  1. Maldague, X.P. Nondestructive Testing Handbook. 3. Infrared and Thermal Testing; American Society for Nondestructive Testing: Arlingate Lane, OA, USA, 2001. [Google Scholar]
  2. Aggelis, D.G.; Kordatos, E.Z.; Strantza, M.; Soulioti, D.V.; Matikas, T.E. NDT approach for characterization of subsurface cracks in concrete. Constr. Build. Mater. 2011, 25, 3089–3097. [Google Scholar] [CrossRef]
  3. Chung, Y.J.; Ranjit, S.; Lee, S.J.; Kim, W.T. Thermographic Inspection of Internal Defects in Steel Structures: Analysis of Signal Processing Techniques in Pulsed Thermography. Sensors 2020, 20, 6015. [Google Scholar] [CrossRef]
  4. Choi, M.Y.; Kang, K.S.; Park, J.H.; Kim, W.T.; Kim, K.S. Quantitative determination of a subsurface defect of reference specimen by lock-in infrared thermography. NDTE Int. 2008, 41, 119–124. [Google Scholar] [CrossRef]
  5. Maldague, X.P. Introduction to NDT by Active Infrared Thermography. Mater. Eval. 2002, 60, 1060–1073. [Google Scholar]
  6. Lee, S.J.; Kim, W.T. Quantitative Characteristics of Defect Dimension based on Lin Scanning Method of Induction Infrared Thermography. J. Korean Soc. Nondestruct. Test. 2020, 40, 397–403. [Google Scholar] [CrossRef]
  7. Park, H.S.; Choi, M.Y.; Park, J.H.; Lee, J.J.; Kim, W.T.; Lee, B.Y. Infrared Thermography Characterization of Defects in Seamless Pipes Using an Infrared Reflector. J. Korean Soc. Nondestruct. Test. 2012, 32, 284–290. [Google Scholar] [CrossRef] [Green Version]
  8. Ranjit, S.; Kang, K.S.; Kim, W.T. Investigation of Lock-in Infrared Thermography for Evaluation of Subsurface Defects Size and Depth. Int. J. Precis. Eng. Manuf. 2015, 16, 2255–2264. [Google Scholar] [CrossRef]
  9. Reddy, K.A. Non-Destructive Testing, Evaluation of Stainless Steel Materials. Mater. Today 2017, 4, 7302–7312. [Google Scholar]
  10. He, Y.; Pan, M.; Luo, F. Defect characterization based on heat diffusion using induction thermography testing. Rev. Sci. Instrum. 2012, 83, 104702. [Google Scholar] [CrossRef]
  11. Soni, A.K.; Rao, B.P. Lock-in amplifier based eddy current instrument for detection of sub-surface defect in stainless steel plates. Sens. Imaging 2018, 19, 32. [Google Scholar] [CrossRef]
  12. Yu, Y.; Gao, K.; Liu, B.; Li, L. Semi-analytical method for characterization slit defects in conducting metal by Eddy current nondestructive technique. Sens. Actuators A Phys. 2020, 301, 111739. [Google Scholar] [CrossRef]
  13. Cheng, Y.; Bai, L.; Yang, F.; Chen, Y.; Jiang, S.; Yin, C. Stainless steel weld defect detection using pulsed inductive thermography. IEEE Trans. Appl. Supercond. 2016, 26, 0606504. [Google Scholar] [CrossRef]
  14. Ploix, M.A.; Guy, P.; Chassignole, B.; Moysan, J.; Corneloup, G.; El Guerjouma, R. Measurement of ultrasonic scattering attenuation in austenitic stainless steel welds: Realistic input data for NDT numerical modeling. Ultrasonics 2014, 54, 1729–1736. [Google Scholar] [CrossRef] [PubMed]
  15. Yan, X.; Pang, J.; Jing, Y. Ultrasonic Measurement of Stress in SLM 316L Stainless Steel Forming Parts Manufactured Using Different Scanning Strategies. Materials 2019, 12, 2719. [Google Scholar] [CrossRef] [PubMed] [Green Version]
  16. Lee, J.K.; Bae, D.S.; Lee, S.P.; Lee, J.H. Evaluation on defect in the weld of stainless steel materials using nondestructive technique. Fusion Eng. Des. 2014, 89, 1739–1745. [Google Scholar] [CrossRef]
  17. Nakamura, N.; Ashida, K.; Takishita, T.; Ogi, H.; Hirao, M. Inspection of stress corrosion cracking in welded stainless steel pipe using point-focusing electromagnetic acoustic transducer. NDT E Int. 2016, 83, 88–93. [Google Scholar] [CrossRef]
  18. Malarvel, M.; Singh, H. An autonomous technique for weld defects detection and classification using multi-class support vector machine in X-radiography image. Optik 2021, 231, 166342. [Google Scholar] [CrossRef]
  19. Ricci, M.; Ficola, A.; Fravolini, M.L.; Battaglini, L.; Brunori, V.; Palazzi, A.; Rocchi, C. Machine vision and magnetic imaging NDT for the on-line inspection of stainless steel strips. In Proceedings of the IEEE International Conference on Imaging Systems and Techniques Proceedings, Manchester, UK, 16–17 July 2012; pp. 415–420. [Google Scholar]
  20. Fu, P.; Hu, B.; Lan, X.; Yu, J.; Ye, J. Simulation and quantitative study of cracks in 304 stainless steel under natural magnetization field. NDT E Int. 2021, 119, 102419. [Google Scholar] [CrossRef]
  21. International Organization for Standardization (ISO). ISO 10880: 2017. In Non-Destructive Testing-Infrared Thermography Testing-General Principles; ISO: Geneva, Switzerland, 2017. [Google Scholar]
  22. International Organization for Standardization (ISO). ISO 6781:1983. In Thermal Insulation-Qualitative Detection of Thermal Irregularities in Building Envelopes-Infrared Method; ISO: Geneva, Switzerland, 1983. [Google Scholar]
  23. Rogalski, A. Infrared detectors: An overview. Infrared Phys. Technol. 2002, 43, 187–210. [Google Scholar] [CrossRef] [Green Version]
  24. Ranjit, S.; Kim, W. Evaluation of coating thickness by thermal wave imaging: A comparative study of pulsed and lock-in infrared thermography-Part 1: Simulation. Infrared Phys. Technol. 2017, 83, 124–131. [Google Scholar]
  25. Ranjit, S.; Kim, W. Evaluation of coating thickness by thermal wave imaging: A comparative study of pulsed and lock-in infrared thermography-Part 2: Experimental investigation. Infrared Phys. Technol. 2018, 92, 24–29. [Google Scholar]
  26. Ranjit, S.; Choi, M.; Kim, W. Quantification of defects depth in glass fiber reinforced plastic plate by infrared lock-in thermography. J. Mech. Sci. Technol. 2016, 30, 1111–1118. [Google Scholar] [CrossRef]
  27. Liu, B.; Zhang, H.; Fernandes, H.; Maldague, X. Experimental evaluation of pulsed thermography, lock-in thermography and vibrothermography on foreign object defect(FOD) in CFRP. Sensors 2016, 16, 743. [Google Scholar] [CrossRef] [Green Version]
  28. Ranjit, S.; Kim, W. Non-destructive testing and evaluation of materials using active thermography and enhancement of signal to noise ratio through data fusion. Infrared Phys. Technol. 2018, 94, 78–84. [Google Scholar]
  29. Ranjit, S.; Choi, M.; Kim, W. Thermographic inspection of water ingress in composite honeycomb sandwich structure: A quantitative comparison among lock-in thermography algorithms. Quant. Infrared Thermogr. J. 2021, 18, 92–107. [Google Scholar]
  30. Lee, S.; Kim, W. Binarization Mechanism for Detectability Enhancement using Lock-in Infrared Thermography. J. Korean Soc. Nondestruct. Test. 2021, 41, 79–86. [Google Scholar] [CrossRef]
  31. Manda, M.P.; Kim, H.S. A Fast Image Thresholding Algorithm for Infrared Images Based on Histogram Approximation and Circuit Theory. Algorithms 2020, 19, 207. [Google Scholar] [CrossRef]
  32. Dong, Y.X. An Improved Otsu Image Segmentation Algorithm. Adv. Mater. Res. 2014, 989, 3751–3754. [Google Scholar] [CrossRef]
  33. Dong, Y.X. Review of otsu segmentation algorithm. Adv. Mater. Res. 2014, 989, 1959–1961. [Google Scholar] [CrossRef]
  34. Yang, X.; Shen, X.; Long, J.; Chen, H. An improved median-based Otsu image thresholding algorithm. Aasri Procedia 2012, 3, 468–473. [Google Scholar] [CrossRef]
  35. Ranjit, S.; Park, J.; Kim, W. Application of thermal wave imaging and phase shifting method for defect detection in Stainless steel. Infrared Phys. Technol. 2016, 76, 676–683. [Google Scholar]
  36. Hidalgo-Gato García, R.; Andrés Álvarez, J.R.; López Higuera, J.M.; Madruga Saavedra, F.J. Quantification by signal to noise ratio of active infrared thermography data processing techniques. Opt. Photonics J. 2013, 3, 20–26. [Google Scholar] [CrossRef]
  37. Takashimizu, Y.; Iiyoshi, M. New parameter of roundness R: Circularity corrected by aspect ratio. Prog. Earth Planet. Sci. 2016, 3, 2. [Google Scholar] [CrossRef] [Green Version]
Figure 1. Flowchart of the overall research process of this study.
Applsci 11 07870 g001
Figure 2. Schematic illustration of the STS304 plate providing depth and diameter information of each defect.
Applsci 11 07870 g002
Figure 3. The picture of the specimen used in the study: (a) front side coated with black paint, and (b) back side with flat-bottomed holes.
Applsci 11 07870 g003
Figure 4. Experimental configuration of lock-in infrared thermography system.
Applsci 11 07870 g004
Figure 5. Amplitude images from the lock-in signal processing: (a) 0.01 Hz, (b) 0.02 Hz, (c) 0.03 Hz, (d) 0.04 Hz, (e) 0.05 Hz, (f) 0.06 Hz, (g) 0.07 Hz, (h) 0.08 Hz, (i) 0.09 Hz and (j) 0.1 Hz.
Applsci 11 07870 g005
Figure 6. Phase images from the lock-in signal processing: (a) 0.01 Hz, (b) 0.02 Hz, (c) 0.03 Hz, (d) 0.04 Hz, (e) 0.05 Hz, (f) 0.06 Hz, (g) 0.07 Hz, (h) 0.08 Hz, (i) 0.09 Hz and (j) 0.1 Hz.
Applsci 11 07870 g006
Figure 7. Plot of ROI contrast for optimum excitation frequency: (a) amplitude and (b) phase.
Applsci 11 07870 g007
Figure 8. Images with filtering (median, mean, Gaussian, NLmean) applied to raw images for first de-noising: (a) amplitude and (b) phase.
Applsci 11 07870 g008
Figure 9. SNR comparison of each filtered image.
Applsci 11 07870 g009
Figure 10. Images with second de-noising applied after the binarization process: (a) amplitude and (b) phase.
Applsci 11 07870 g010
Figure 11. Automatic defect recognition based on a threshold of 0.75 for each image: (a) amplitude and (b) phase.
Applsci 11 07870 g011
Table 1. The material properties of the STS304 plate.
Thermal Conductivity (k)16.2 W / m · K
Density8000 kg / m 3
Heat Capacity500 J / kg · K
Initial Temperature23 °C
Table 2. RMSE values for the filtering and non-filtering of amplitude and phase images.
HoleAmplitudePhase
FilteringNon-FilteringFilteringNon-Filtering
A18879
A2
A38085
A48184
B187848685
B2
B381798277
B488888482
C181848885
C2
C379
C492898680
D186858884
D2
D383868484
D492918984
RMSE23.65731.146923.637824.8919
Publisher’s Note: MDPI stays neutral with regard to jurisdictional claims in published maps and institutional affiliations.

