Article

Influence of Phosphite Supply in the MS Medium on Root Morphological Characteristics, Fresh Biomass and Enzymatic Behavior in Five Genotypes of Potato (Solanum tuberosum L.)

1
Department of Crop Genetics and Breeding, College of Agronomy, Gansu Agricultural University, Lanzhou 730070, China
2
Gansu Provincial Key Laboratory of Aridland Crop Science, Lanzhou 730070, China
3
National Institute for Genomics and Advanced Biotechnology, National Agricultural Research Centre, Park Road, Islamabad 45500, Pakistan
*
Author to whom correspondence should be addressed.
Richard Dormatey and Chao Sun contributed equally to this work.
Horticulturae 2021, 7(9), 265; https://doi.org/10.3390/horticulturae7090265
Submission received: 11 July 2021 / Revised: 21 August 2021 / Accepted: 23 August 2021 / Published: 26 August 2021

Abstract

:
Crop production is threatened by low phosphorus (P) availability and weed interference. Obtaining plant genotypes that can utilize Phosphite (Phi) as fertilizer can supplement phosphates (Pi) while providing an environmentally friendly means of weed control. The study was conducted to determine the tolerance and enzymatic behavior of five potato genotypes to PO3. Explants were regenerated in vitro from two nodal cuttings and cultured on Murashige and Skoog (MS) medium under controlled conditions for 30 days. Matured plantlets were subcultured for 20 days in MS medium containing (0.25, 0.5 mM) Phi and Pi and No-P (-Phi + -Pi). The results showed significant genotypic variation in tolerance indices among the five genotypes. Atlantic showed greater tolerance to Phi, with highest total root length (50.84%), root projected area (75.09%), root surface area (68.94%), root volume (33.49%) and number of root forks (75.66%). Phi induced an increasing trend in the levels of hydrogen peroxide in the genotypes with the least effect in Atlantic. The comprehensive evaluation analysis confirmed the tolerance of Atlantic genotype with this ranking; Atlantic, Longshu3, Qingshu9, Longshu6 and Gannong2. Antioxidant enzyme activities and proline content also increased significantly under Phi and No-P treatments. The results suggested that potato genotypes with larger root systems may be more tolerant to Phi than genotypes with smaller root systems.

1. Introduction

Phosphorus (P) is an important macronutrient required by all living organisms and a very important cellular component that plays a crucial role in biological activities [1,2]. Phosphorus is involved in the signaling of target proteins through phosphorylation and dephosphorylation that determine various cellular performances for optimal plant growth [3]. The major P forms include phosphate and phosphite, which are used in agriculture [4]. Phosphate anions (H2PO4, HPO42− and PO43−) are certainly the main forms of P used by plants for metabolic processes and development, while phosphite is a reduced form of Pi that can be readily taken up by plants through Pi transporters [3]. More than 90% of the Pi required by plants is supplied by the soil, which provides adequate storage [5]. However, an estimated 80% of Pi fertilizer applied to soil worldwide is lost through immobilization and conversion to inorganic forms that plants cannot utilize directly [6]. Since Pi is highly reactive and rapidly transformed by soil microbes, only 20–30% is effectively utilized by plants [7]. According to Gianessi [8], in most soils, weeds and crops compete for the available Pi, resulting in Pi deficiency to meet plant growth requirements. As global demand for food increases, the overuse of PO4 fertilizers and herbicides has become inevitable [9]. This can accelerate the depletion of non-renewable phosphorus reserves, and increase production costs and prices of agricultural products; it also has significant environmental impacts, such as runoff into water bodies, leading to algal blooms, eutrophication, etc. [10,11]. Overuse of herbicides in cultivation has led to the emergence of herbicide-resistant superweeds in recent years [12]. Thus, low soil phosphorus availability and herbicide-resistant weeds have been identified as major threats to the long-term sustainability of agriculture [7,12,13], for which an effective long-term solution is urgently needed.
Phosphite anions (H2PO3 and HPO32−) have high solubility and low soil reactivity. Although plants and various microorganisms cannot utilize Phi, it can be used as a potential target to enhance germplasm for phosphorus utilization by plants [14,15]. Phosphite has an inhibitory effect on plant growth with similar properties to herbicides [16]. The phosphite salt does not pose any risk to human and animal health and is therefore massively used as an effective fungicide in crop production [2]. Thus, phosphite has a direct effect on phytopathogenic fungi by inhibiting mycelial proliferation and reducing conidiogenesis of Fusarium sp. isolated from the rhizosphere of plants [17]. In addition, Phi can act indirectly by stimulating the inherent defense mechanisms of plants to limit pathogen growth [18], and also activate host defense genes that help plants defend against disease [19] and directly suppress the growth of pathogens such as Phytophthora [20,21,22]. According to Mehta et al. [23] and Thao and Yamakawa [24], Phi anions cannot be utilized by plants as a phosphorus nutrient, although Phi is well taken up by plant leaves and roots. The supply of Phi to plants as a sole source of P fertilizer can hinder plant growth and a higher dose can completely destroy plants [25,26]. Moreover, McDonald, Grant and Plaxton [16] claimed that Phi-treated plants accumulate Phi rapidly in their cells. Phosphite is phloem-mobile and accumulates in sink tissues [27]. Since Phi is not metabolized by plants, it remains in tissues for a long time and consequently disrupts the signal transduction chain that allows plants to detect and respond to Pi deficiency at the molecular level, thereby amplifying the negative effects of Phi [23,28].
On the contrary, the stimulatory effect of Phi mediates structural and biochemical changes in potato periderm and rind [29]. Phi application improved fruit set and yield of Persea americana (avocado) and also restored optimal growth of Pi deficient Citrus species [20]. Again, several reports indicated impressive results of Phi on plant P nutrition, which ultimately increased crop yields [25,30]. When Phi is added to the soil, it comes into contact with microorganisms that help Phi to oxidize to Pi [2]. Thus, following microbial oxidation reactions, Phi may become available to the plant as a P nutrient through this indirect pathway. Interestingly, efforts to generate transgenic plants with microbial genes (ptxD) that allow plants to use Phi as a sole P source have opened new possibilities for the use of this P-containing compound for plant nutrition [30]. In contemporary agriculture, Phi is emerging as a unique biostimulant that improves crop productivity and quality, through direct antibiotic effects on microorganisms and inhibition via enhanced plant defense responses. In addition, Phi induces a variety of abiotic stress tolerance mechanisms, including heat tolerance [31,32]. Obtaining a potato genotype that is tolerant to Phi will enable us to conduct more advanced genetic studies to understand gene functions for subsequent molecular work. In this experiment, we investigated the effects of Phi concentrations, MS medium without P nutrient (No-P) and sufficient Pi under in vitro cultures to determine the tolerance of potato genotypes. Nevertheless, there is insufficient information to test the assumption that Phi can stimulate antioxidant enzyme activities and hydrogen peroxide levels. Therefore, the experiment aims to: (1) determine the tolerance of five potato genotypes to Phi stress using tolerance indices and (2) evaluate the responses of antioxidant enzymes in Solanum tuberosum L. plantlets grown in different concentrations of Phi.

2. Materials and Methods

2.1. Place of the Experiment and Materials

The experiment was conducted in Gansu Providential key laboratory of Aridland Crop Science, College of Agronomy, Gansu Agricultural University Lanzhou, China (36°03′ N; 103°40′ E). Potato genotypes; Qingshu9, Longshu6, Longshu3, Atlantic and Gannong2, were used in this experiment. The Atlantic genotype is reported to be drought-susceptible [33,34], the Longshu6 genotype is classified as moderately drought-tolerant [35], while Qingshu9 and Longshu3 were designated as drought-tolerant genotypes.

2.2. Source of Genotypes and Preparation of In Vitro Explants

The five potato genotypes were obtained from the laboratory of Crop Improvement and Germplasm Enhancement, Gansu Agricultural University, Lanzhou. Two years of field trials have yielded a wealth of germplasm traits with a large number of sterile tissue culture seedlings for genetic screening. Uniform explants from two nodal cuttings were cultured on the potato growth medium of Murashige and Skoog [36], which contained sucrose 30 gL−1 and agar 5 gL−1. The pH was adjusted to 5.8 and the medium was autoclaved at 121 °C at 15 1b psi for 25 min. Cultures were maintained in a growth room at 25 ± 1 °C, 16 h photoperiod, active photosynthetic radiation of 45 µmol photons m−2s−1, and relative humidity of 55–66% for a 30-day growth period. Plantlets were harvested after 30 days and used for subsequent experiments. Uniform cuttings of each with two axillary buds were subcultured in an ethanol-sterilized chamber with laminar air flow and propagated in MS medium supplemented with final concentrations of (0.25, 0.5 mM) Phi and Pi and No-P supply, in sterilized glass vials (120 × 50 mm). Five cuttings of explants were cultured in each vial, which was tightly sealed with the lids and kept at 25 ± 1 °C in the growth room.

2.3. Experimental Design and Treatments

A 5 × 5 factorial trial in a completely randomized design with 3 replicates was conducted in a controlled growth room. Treatments included five potato genotypes, two concentrations (0.25 and 0.5 mM) each of phosphite and phosphate, and a medium without P fertilizer, representing (No-P). We used 0.5 mM Pi as a control. Fifty vials per genotype were cultured, with each vial containing five explants. After 20 days, the plantlets were examined for physio-morphological indices. The rest of the plantlets were plunged into liquid nitrogen and immediately preserved at −80 °C for biochemical analysis.

2.4. Measurements of Data

2.4.1. Physio-Morphological Parameters

Physiological parameters, such as shoot and root length (cm), were determined with a ruler by randomly selecting three plants from each replication and averaging these data. The number of roots and leaves were counted on each selected plant. Fresh stem weight, fresh root weight and total plant weight (g) were also measured using an electronic balance, with subsequent calculation of root to shoot ratio and tolerance biomass index for each genotype.
The roots of the sampled plantlets were carefully detached from the stems, washed in distilled water and scanned using a root scanner (STD) 4800, EPSON, Quebec City, QC, Canada and the root morphological indices such as total root length (TRL), root projected area (RPA), root surface area (RSA), root volume (RV), number of root tips (NRT), number of root forks (NRF) were calculated using root image analysis software Win RHIZO version 5.0 (Regent Instruments, Inc., Quebec City, QC, Canada).

2.4.2. Tolerance Indexes Determination

Based on the formula of Wilkins [37], the Phi tolerance indices (TIs) of the root system, which clearly indicate the tolerance of the root systems to Phi stress, were calculated according to the modifications of Dawuda et al. [38]. Since Phi uptake has direct effects on the different measured root morphological indices and plant tolerance to Phi stress, Phi TI was determined at the end of the experiment for each root index. Considering the score of TI, we classified the genotype with the largest TI for most of the calculated indices as the most tolerant genotype among the five potato genotypes studied. The formula of TI is as follows: TI = index under Phi stress/index without Phi stress × 100.

2.4.3. Determination of Hydrogen Peroxide and Malonaldehyde Contents in Samples

The content of hydrogen peroxide (H2O2) in the shoot samples was determined as described by Junglee et al. [39], with minor modifications. A 0.1 g fresh shoot sample was crushed using a mortar and pestle in liquid nitrogen. The homogenate was transferred to a 2 mL centrifuge tube and kept in an ice bath. An amount of 1.5 mL of 0.1% Trichloroacetic acid (TCA) was added and the uniform mixture was centrifuged at 12,000× g for 15 min at 4 °C. The supernatant 0.5 mL was carefully mixed with 0.5 mL Phosphate Buffer Saline (PBS) and 1 mL KI (1M) at 7.0 pH. The mixture was kept at 28 °C for one hour. The absorbance was measured using a spectrophotometer (model U-5100, Seya-Namioka, Hitachi High-technologies, Minato-ku, Tokyo, Japan) at 390 nm. The contents of H2O2 were determined with reference to the standard curve (0, 1, 2, 3, 4 and 5 mmol−1). Malonaldehyde (MDA) Content Assessment Lipid peroxidation was measured by calculating the amount of MDA emitted using the technique for thiobarbituric acid (TBA) as presented in Hodges et al. [40]. Preserved fresh shoot samples of 0.15 g were crushed using a mortar and pestle and 4.5 mL of 10% TCA was added. Then, the homogenized substance was centrifuged at 500× g for 15 min at 4 °C. The supernatant was transferred to a centrifuge bottle and the volume (V) was recorded. Two mL of the supernatant was then mixed with 2 mL of 0.6% TBA. The homogenized mixture was warmed in boiling water for 20 min, the reaction stopped in an ice bath, and centrifuged at 5000× g for 10 min. The supernatant (2 mL) of V1 was transferred to a cuvette. The absorbance of the supernatant was measured at 450, 532, and 600 nm, respectively. The MDA content was estimated according to the following formula: MDA concentration (µmol/L) = 6.45 × (A532 – A600) − 0.56 × A450. MDA content (µmol/g FW) = C (µmol/L) × V (L) × V1 (mL)/2 mL × M (g FW).

2.4.4. Determination of Antioxidant Enzymes Activities and Proline Contents in Shoots

Enzyme samples were prepared from frozen tissue preserved at −80 °C. Each shoot sample (approximately 0.5 g) was crushed in liquid nitrogen using a mortar and pestle and homogenized in 5 mL of 0.1 M phosphate buffer (pH 7.8) containing 0.5 mM ethylenediamine tetraacetic acid (EDTA). Each homogenate was centrifuged at 12,000× g for 15 min at 4 °C. The supernatant was collected for determination of enzymatic activity. The activities of catalase (CAT), peroxidase (POD) and superoxide dismutase (SOD) in the shoot homogenate were determined using a reagent kit (Nanjing Jiancheng Bioengineering Institute, Nanjing, China) following the manufacturer’s instructions. The principles of these kits are summarized as follows:
Catalase activity was determined by the spectrophotometric ammonium molybdate method, in which ammonium molybdate rapidly stops the H2O2 degradation reaction, catalyzed CAT, as the remaining H2O2 reaction produces a yellow compound that can be examined by absorbance at 405 nm. A catalase unit activity was classified as the amount of enzyme in 1 g of fresh tissue that reduces 1µmol of H2O2 per minute at 37 °C.
SOD activity was calculated according to the method of Dhindsa et al. [41]. The method is based on photochemical reduction of SOD-motivated Nitrotetrazolium Blue Chloride (NBT) at 560 nm. A unit of SOD activity was well defined as the amount of enzyme that inhibits 50% of the oxidation.
Peroxidase activity was determined by catalysis of hydrogen peroxide by POD, observing absorbance changes at 420 nm and estimating the activity of POD. One unit of POD activity was defined as the amount of enzyme in 1 g of fresh plant tissue reducing 1 µg of H2O2 at 37 °C per min. Proline content was determined according to the method of Bates et al. [42]. Fresh shoot samples weighing 0.15 g were crushed with 4.5 mL of 3% (w/v) sulfosalicylic acid homogenization and the homogenate was heated in boiling water for 30 min. This was then filtered through 0.2 μm filter paper. The extract and the volume of extract were designated as Vt. The supernatant was used to determine the amount of proline. The reaction mixture consisted of 2 mL of plant extract and an appropriate amount of ninhydrin glacial acetic acid. The test tubes containing the substance were heated in boiling water for 30 min. The reaction was quenched with the addition of toluene in an ice bath. The substance was shaken vigorously on vortex mixer for 15–30 s and divided into two phases (upper and lower chromophase). The upper chromophase (toluene) was carefully aspirated with a pipette, and absorbance was taken at 520 nm. The amounts of proline were measured from the standard curve and expressed as μg·g−1FW. The amount of proline was calculated as: Proline content (µg/gFW) = C × Vt/(V × W).

2.5. Analyses of Data

All data collected were analyzed using SPSS software 22.0 version (IBM Corp., Chicago, IL, USA). Means of treatments were separated by Duncan’s multiple range tests with a probability of 5%. The distribution of means was presented in the figures using standard deviations. All graphs were created using GraphPad Prism version 8.0 (GraphPad Software, Inc., San Diego, CA, USA). Principal component analysis (PCA) was performed using the software PAST-PAlaeontological Statistics, version 1.34. To confirm the tolerance status of potato genotypes to Phi, comprehensive evaluation analysis based on PCA was carried out using R software package Statistics, version 3.5.3, considering the following formula:
µ(Xi) = (Xi − Xmin)/(Xmax − Xmin) i = 1, 2, 3…n
In Formula (1), μ(Xi) refers to the membership function value of the i-th comprehensive index, and Xi refers to the i-th. Comprehensive index value, Xmax refers to the maximum value of the i-th, comprehensive index, Xmin refers to the i-th, the minimum value of a comprehensive index. Calculation of the weighting of each comprehensive index:
Wi = Pi i = 1 m Pi       i = 1 ,   2 ,   3 n
In Formula (2), Wi represents the importance of the i-th comprehensive index in all comprehensive indices. In terms of degree and weight, Pi is the contribution rate of the i-th comprehensive index of each genotype. Calculation of comprehensive evaluation value (D).
D = i = 1 m [ μ ( Xi ) xWi ]      i = 1 ,   2 ,   3 n
In Formula (3), D represents the phosphite tolerance of different potato genotypes. The D value is obtained by calculating the weighted membership function value. The larger the value of D, the more the Phi tolerance.

3. Results

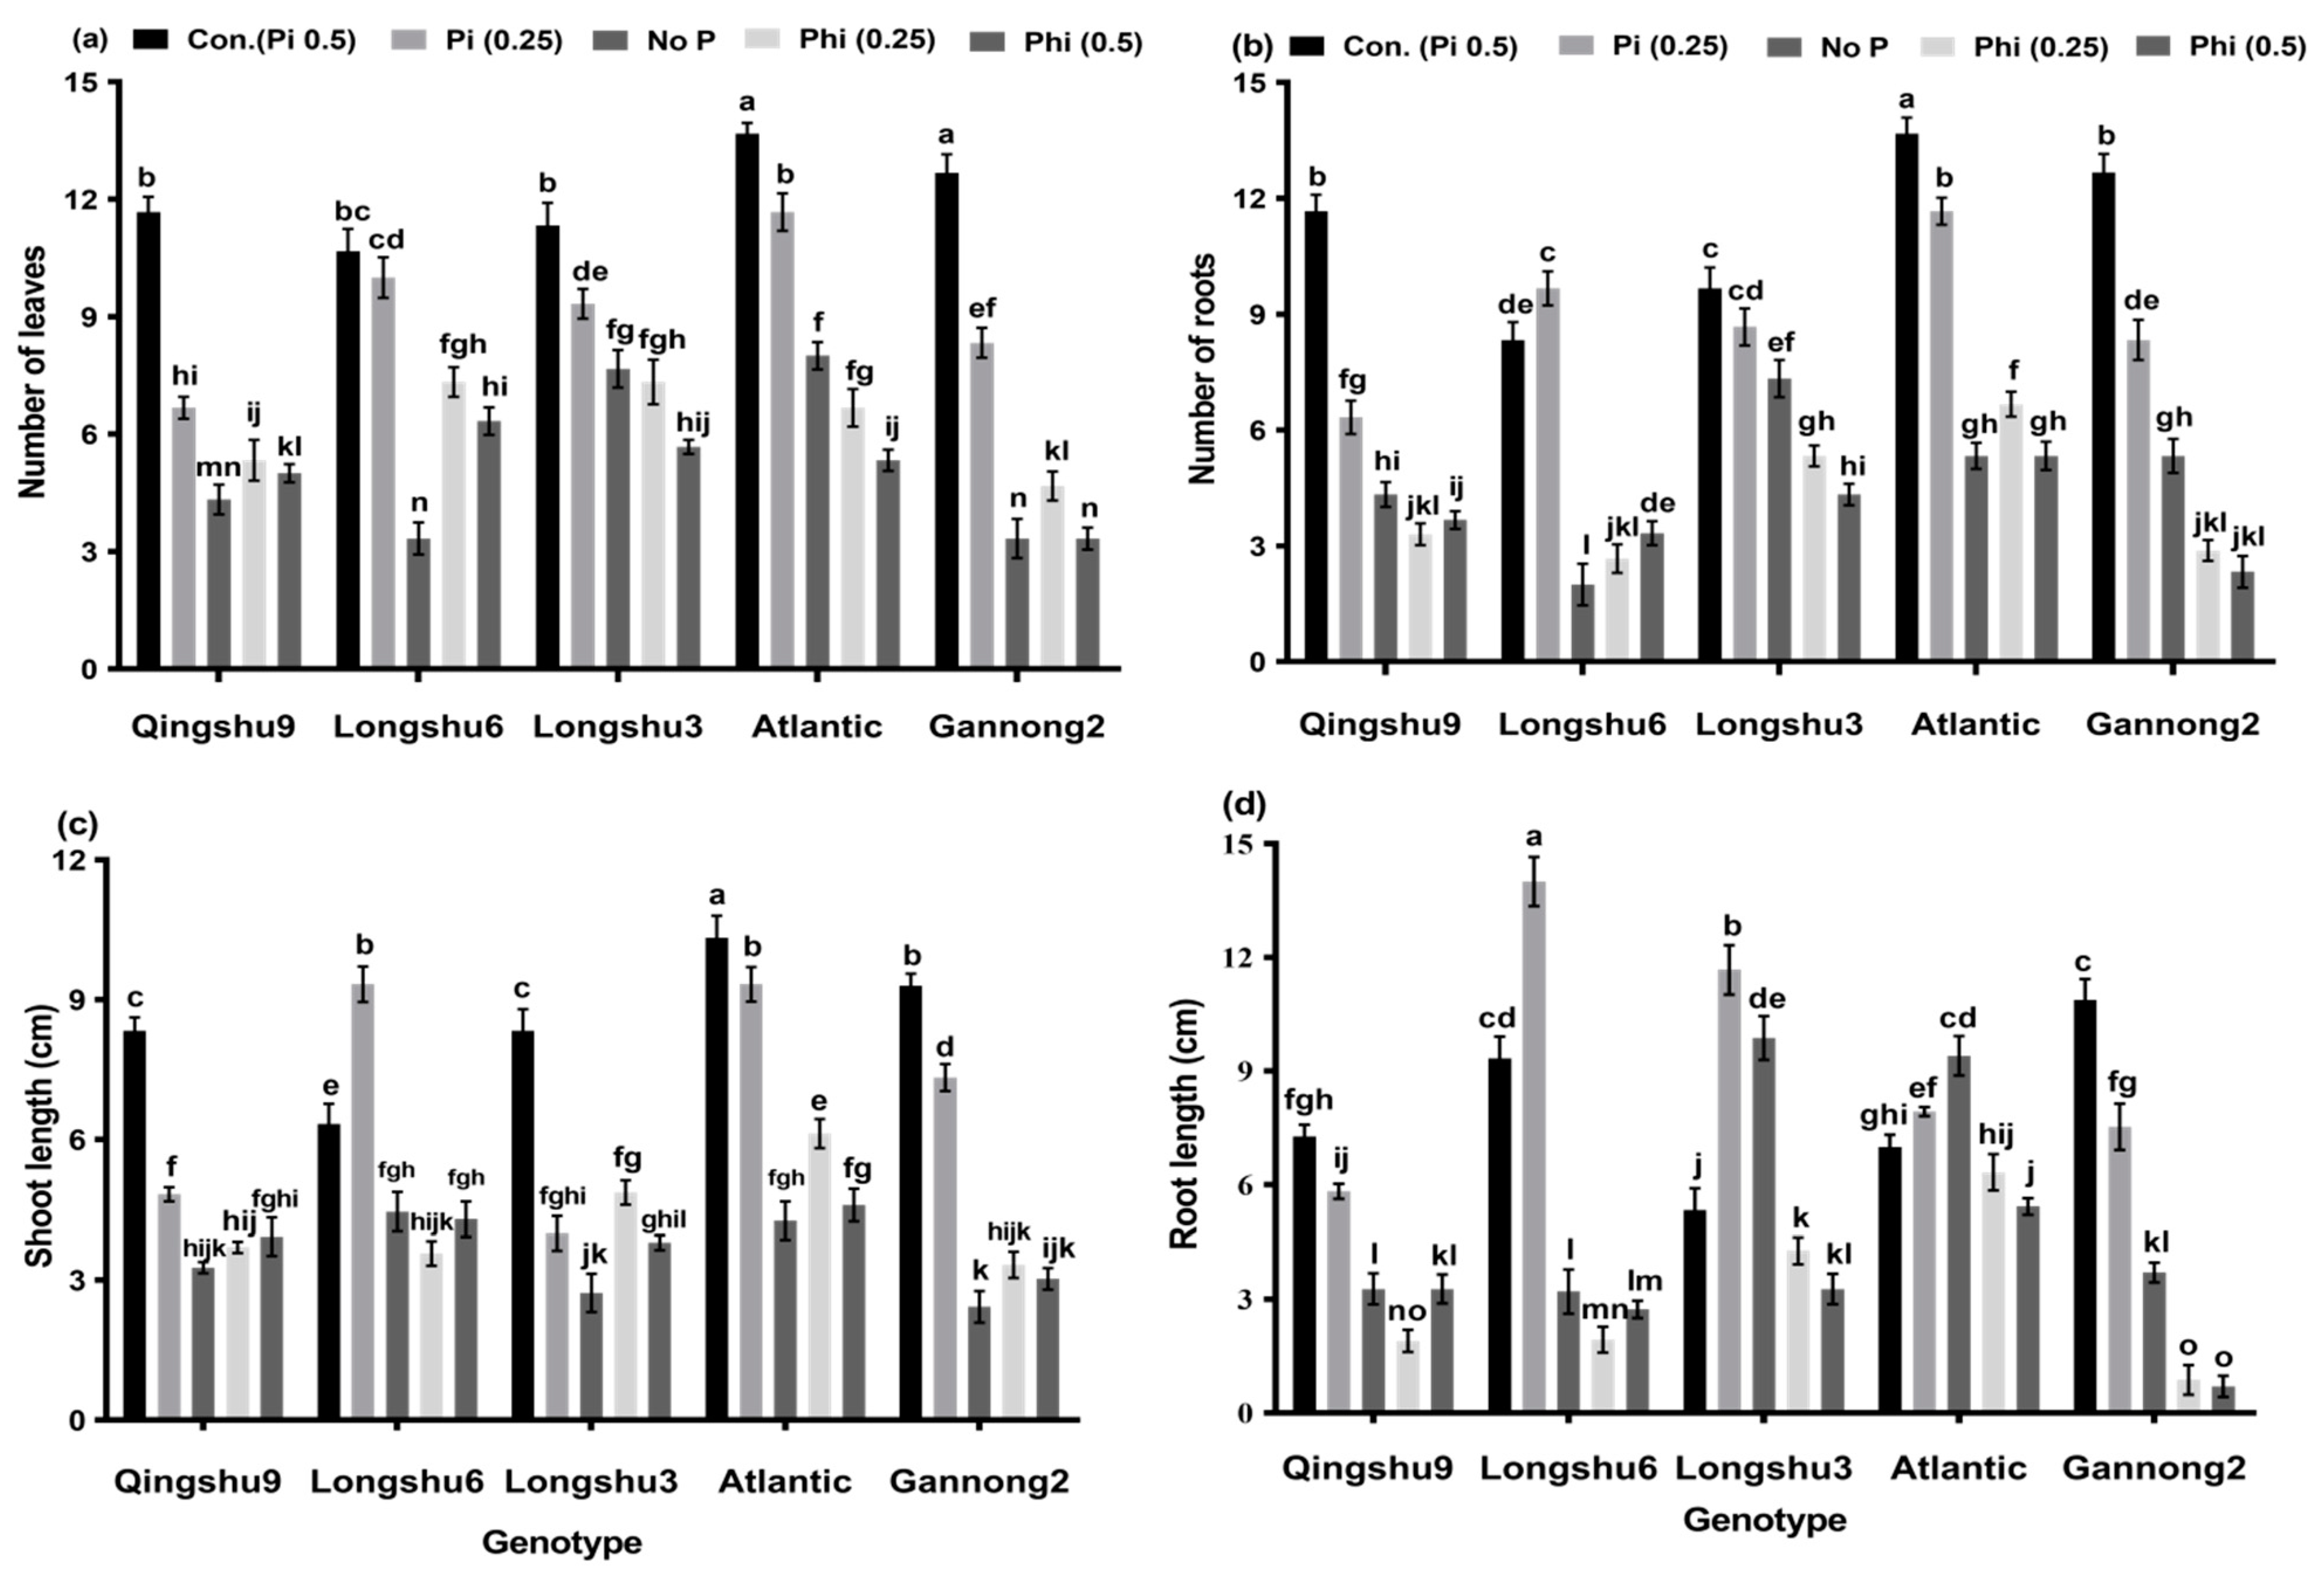
3.1. Influence of Phosphite and Phosphate on Physiological Parameters of Five Potato Genotypes after 20 Days’ Growth Period

The results showed significant (p < 0.01) genotype x phosphorus source and rates interaction effect on all physiological parameters (Figure 1a–d). Phosphite stress significantly reduced the growth of potato genotypes in this study. Reduction in growth was observed in both roots and shoots resulting in reduction in fresh biomass and fresh root to shoot ratio. Mostly all physiological indices across all genotypes were decreased by PO3 (0.25 and 0.5 mM) and No-P, but Atlantic genotype was least affected. At Phi 0.5 mM, the decrease in leaf number was least (40.67%) in Longshu6 and greatest (57.16%) in Qingshu9. The least (61.93%) and greatest (81.73%) decrease in the number of roots occurred in Atlantic and Gannong2, respectively. The least (58.18, 6.22%) and greatest (69.95, 91.33%) decrease in shoot and root length was observed in Atlantic and Gannong2 genotypes, respectively. Moreover, similar results were observed among the five genotypes with respect to PO3 (0.25 mM), but the decrease in physiological parameters due to Phi stress was more pronounced at 0.5 compared to 0.25 mM. In the treatment without P supply, physiological growth was also decreased in all the five potato genotypes except Atlantic and Longshu3, which recorded increase in root length as compared to their respective control. Compared to the control, the application of PO3 at (0.25 and 0.5 mM) and No-P had a negative effect on the fresh biomass indices of the genotypes (Table 1). Application of PO3 (0.25 mM) to genotype Gannong2 caused greater reductions in FRW (80.95%), FSW (82.48%) and TPW (82.00%). In addition, smaller reductions were observed in FSW (43.24%) and TPW (30.20%), and there was a slight increase in FRW (7.41%) of Atlantic genotype. The application of Phi (0.5 mM) gave similar results with a slight difference in severity compared to the results obtained with 0.25 mM. Thus, application of higher rates of Phi could be lethal to potato plantlets. Maximum decrease in FRW (87.21%), FSW (83.94%) and TPW (80.50%) and minimum decrease in FRW (14.81%), FSW (60.81%) and TPW (48.51%) were observed in potato genotypes Gannong2 and Atlantic, respectively.
Fresh biomass indices of No-P treated potato genotypes were decreased due to the absence of Pi in the growth media. The effect of Pi deficiency was more pronounced in the shoots than in the roots of the five potato genotypes. The greatest decrease in fresh biomass indices (FRW, FSW and TPW) was recorded in genotype Gannong2, while the least occurred in genotype Longshu3. Moreover, the negative effects of Phi and No-P on growth of all genotypes were measured in biomass tolerance index (BTI). The result showed that Atlantic genotype had the highest (70.39 and 51.49%) BTIs, followed by LS3 (51.79 and 36.92%), while the lowest (34.16 and 15.00%) BTIs were recorded in Qinshu9 and Gannong2 genotypes at Phi (0.25 and 0.5 mM). In No-P treatment, genotype Longshu3 recorded the highest value (62.56%) followed by Atlantic (56.93%) and the lowest value (34.00%) was observed in Gannong2. Among Phi-treated genotypes in terms of root to shoot ratio (RSR), Atlantic recorded the highest value (0.79 and 0.69), and the lowest value (0.26 and 0.28) was recorded in Longshu6 and Qingshu9 at (0.25 and 0.5 mM). In No-P treatment, Longshu3 had the highest value (1.22), while Longshu6 had the lowest (0.40). However, in Pi-sufficient genotypes, the number of leaves, number of roots, shoot length and root length were increased compared to their respective controls. The maximum increase was recorded in the Atlantic genotype. Fresh biomass indices showed similar results in all the five genotypes as compared to the respective controls. The lowest root, shoot, and total plant weights were recorded in Qingshu9 and Longshu3, while maximum increase was recorded in Gannong2 and Longshu6 genotypes, respectively.

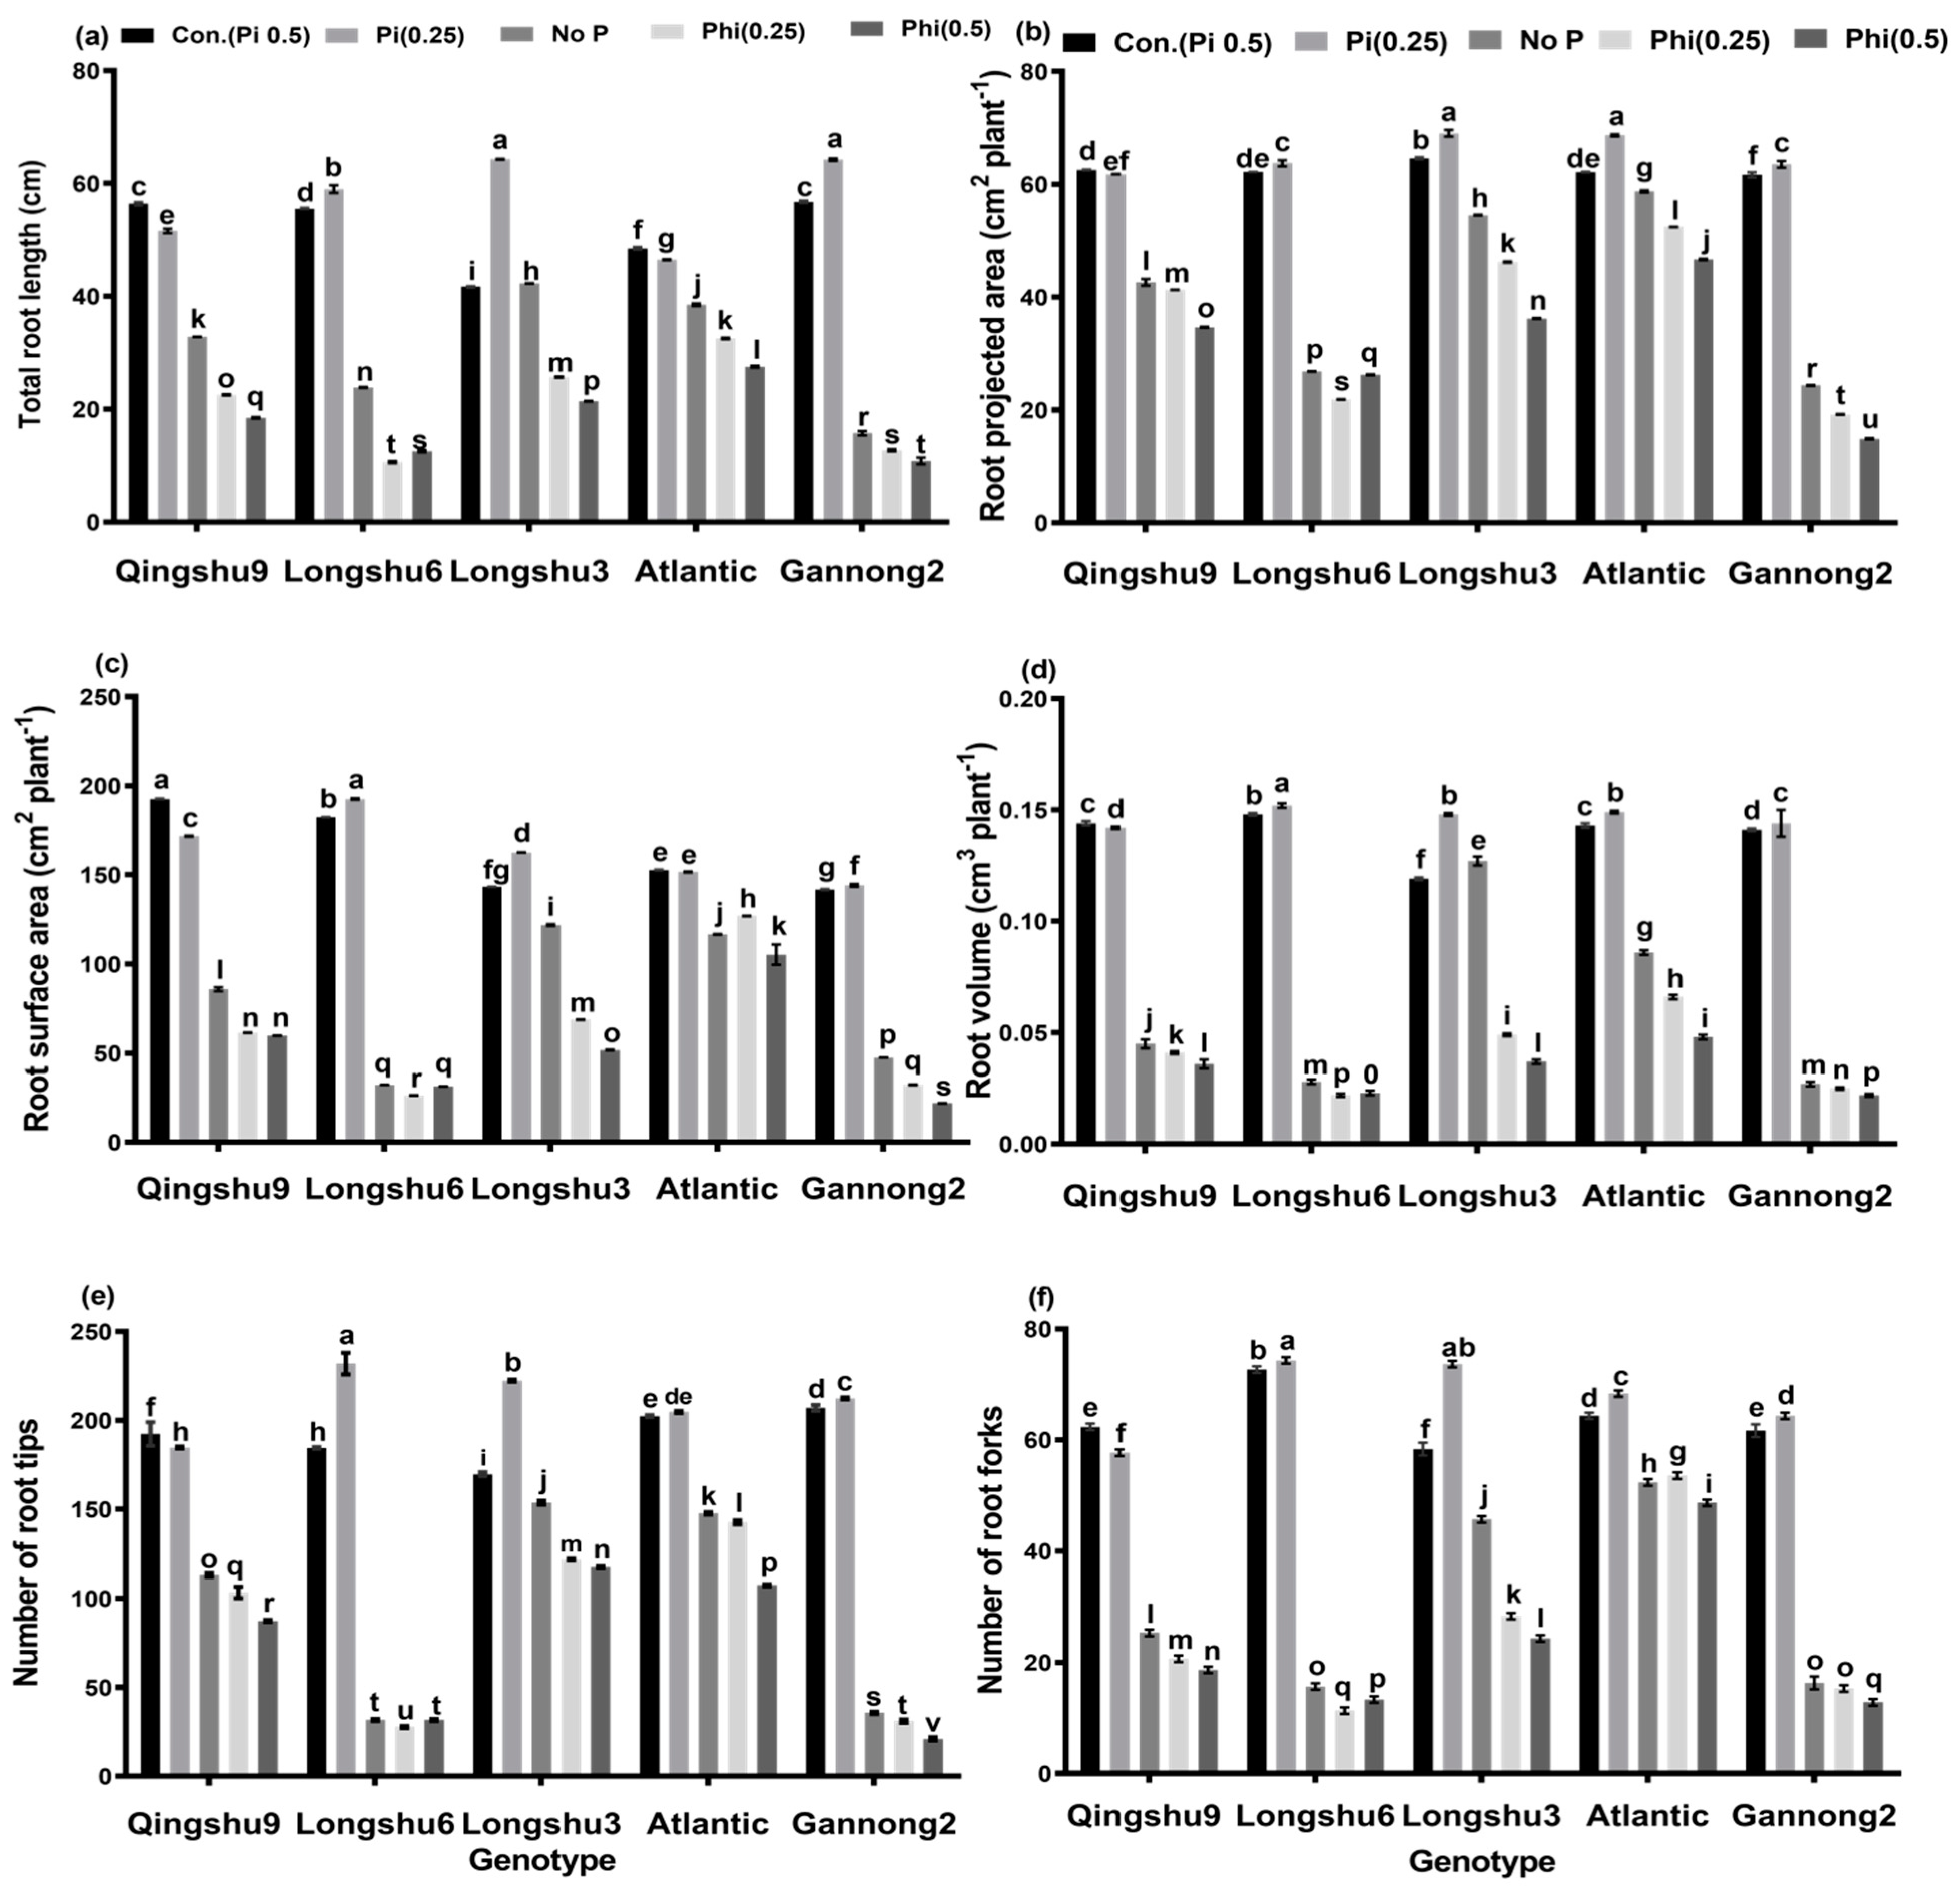
3.2. Effects of Phosphite, Phosphate and No-P Supply on Root Morphological Characteristics of Five Potato Genotypes for 20 Days Growth Period

There were significant (p < 0.01) genotype x phosphite interaction effects on total root length (TRL), root projected area (RPA), root surface area (RSA), root volume (RV), number of root tips (NRT), and number of root forks (NRF) (Figure 2). In general, root morphological indices were decreased in all five genotypes, with the Atlantic genotype being the least affected. The decrease in TRL due to Phi effects was least (32.86 and 43.17%) in Atlantic and greatest (80.85 and 80.93%) in Longshu6 and Gannong2 at Phi (0.25 and 0.5 mM), respectively. The least decrease in RPA (15.62 and 24.81%) was recorded in Atlantic while the greatest (68.57 and 75.85%) was observed in Gannong2 at (0.25 and 0.5 mM). Moreover, the least (16.86 and 30.85%) and greatest (85.57 and 84.50%) decrease in RSA was observed in Atlantic, Longshu3 and Longshu6 and Gannong2 genotypes, respectively. The least (53.85 and 66.51%) decrease in RV occurred in Atlantic, while the greatest (82.08 and 84.70%) was observed in Longshu6 and Gannong2. Moreover, the least decrease (29.49 and 24.34%) of NRT occurred in Atlantic and Longshu3 genotypes, while the greatest (85.02 and 89.86%) was observed in Longshu6 and Gannong2, at 0.25 and 0.5 mM, respectively. The least (16.57 and 31.06%) decrease in NRF was observed in Atlantic, while the greatest (83.94 and 80.01%) was measured in Longshu6 and Gannong2, at Phi 0.25 and 0.5 mM, respectively. The decrease in root morphological parameters observed in the five genotypes was due to Phi effects, which caused a decrease in the size of the root and shoot systems of the genotypes. The root morphological indices of the treatment without P supply were also decreased in all five genotypes. Mainly due to the absence of Pi in the No-P treatment, this reduced the root growth of the susceptible genotypes, while the tolerant genotypes developed longer root systems. The least decrease in morphological indices was observed in Longshu3 and Atlantic, while the greatest decrease was observed in Gannong2 and Longshu6 genotypes. However, Pi-sufficient potato genotypes exhibited much higher root morphological indices than genotypes grown under Phi and No-P. Root morphological indices were slightly increased in Pi-sufficient plants of the five potato genotypes. Among the genotypes: Longshu3 and Longshu6 recorded the highest increase, while Atlantic and Qingshu9 had the least increase in all root morphological indices.

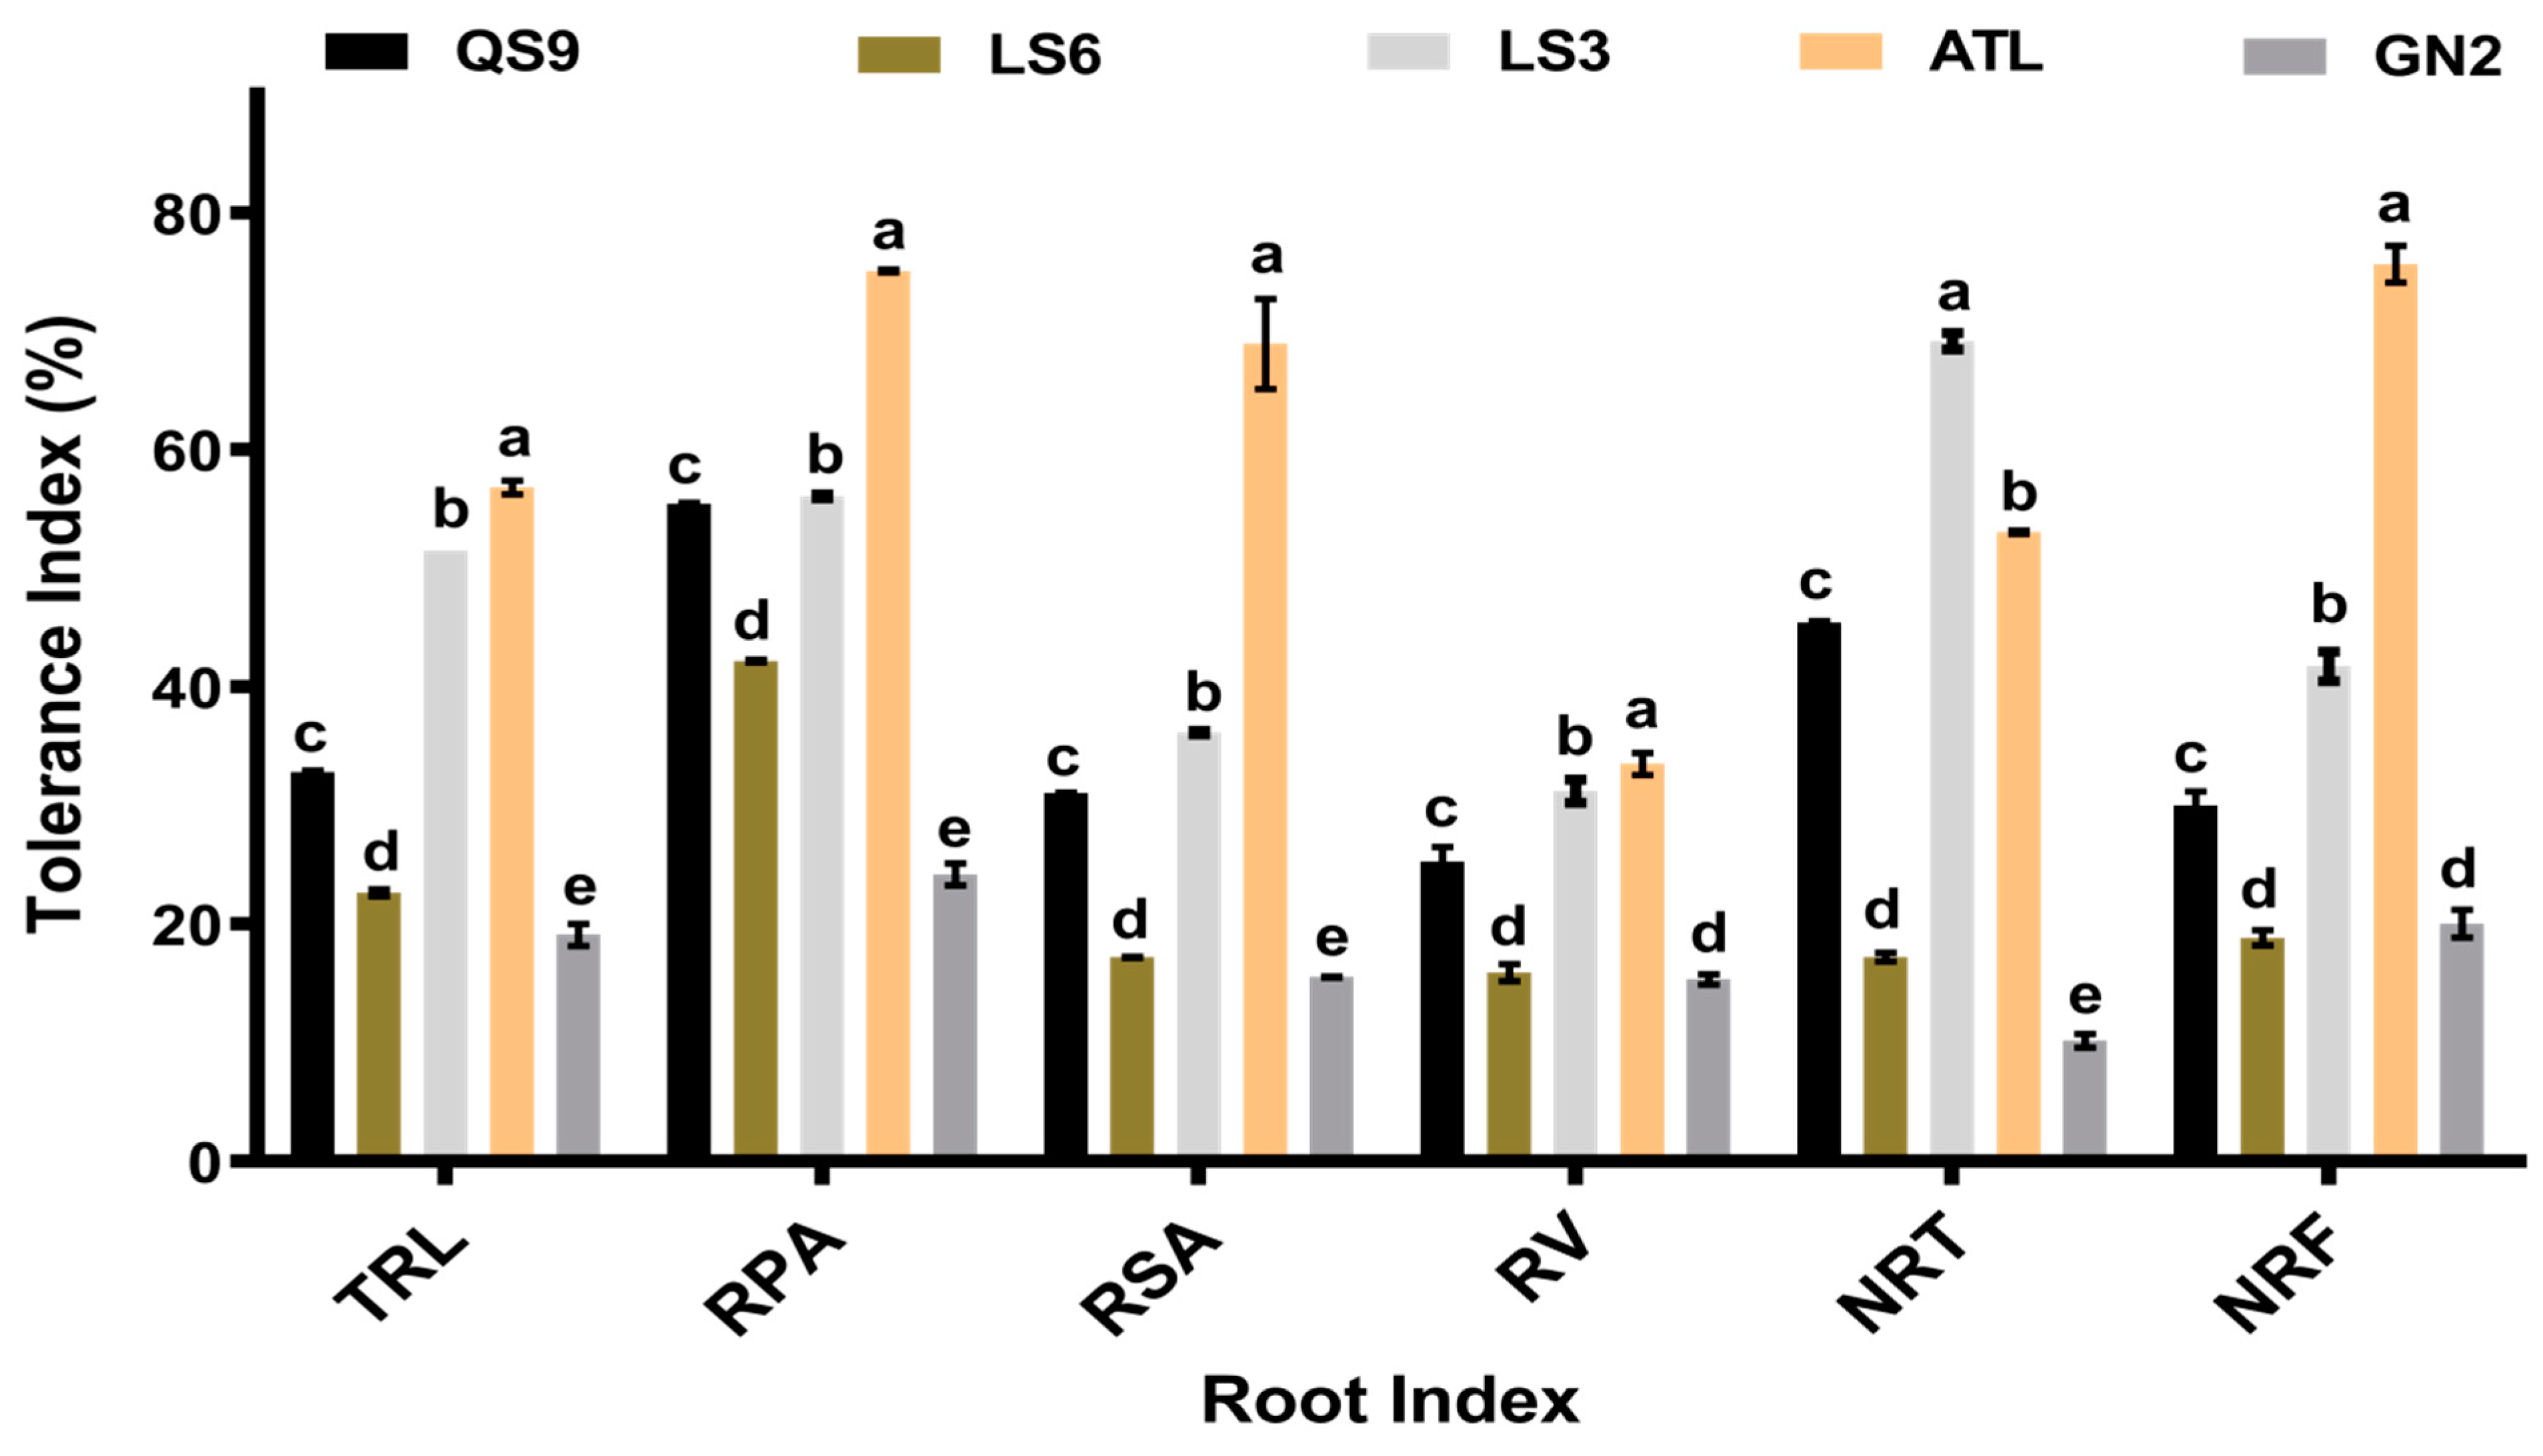
3.3. Tolerance of the Five Potato Genotypes to Phosphite Stress

There were significant differences (p < 0.01) in the tolerance indices (TIs) among the five potato genotypes at 0.25, 0.5 mM and No-P (Figure 3). The result showed that after the plantlets were grown for 20 days in the Phi media, Atlantic had the highest TI for majority of the measured indices such as TRL (56.84%), RPA (75.09%), RSA (68.94%), RV (33.49%) and NRF (75.66%) at Phi (0.5 mM). Considering this result, among the five potato genotypes tested, the Atlantic genotype proved to be the most tolerant, except TI for NRT, which was highest in Longshu3 (69.16%). However, compared to Atlantic, the other genotypes obtained lower TI values and were found to be susceptible to PO3 stress.

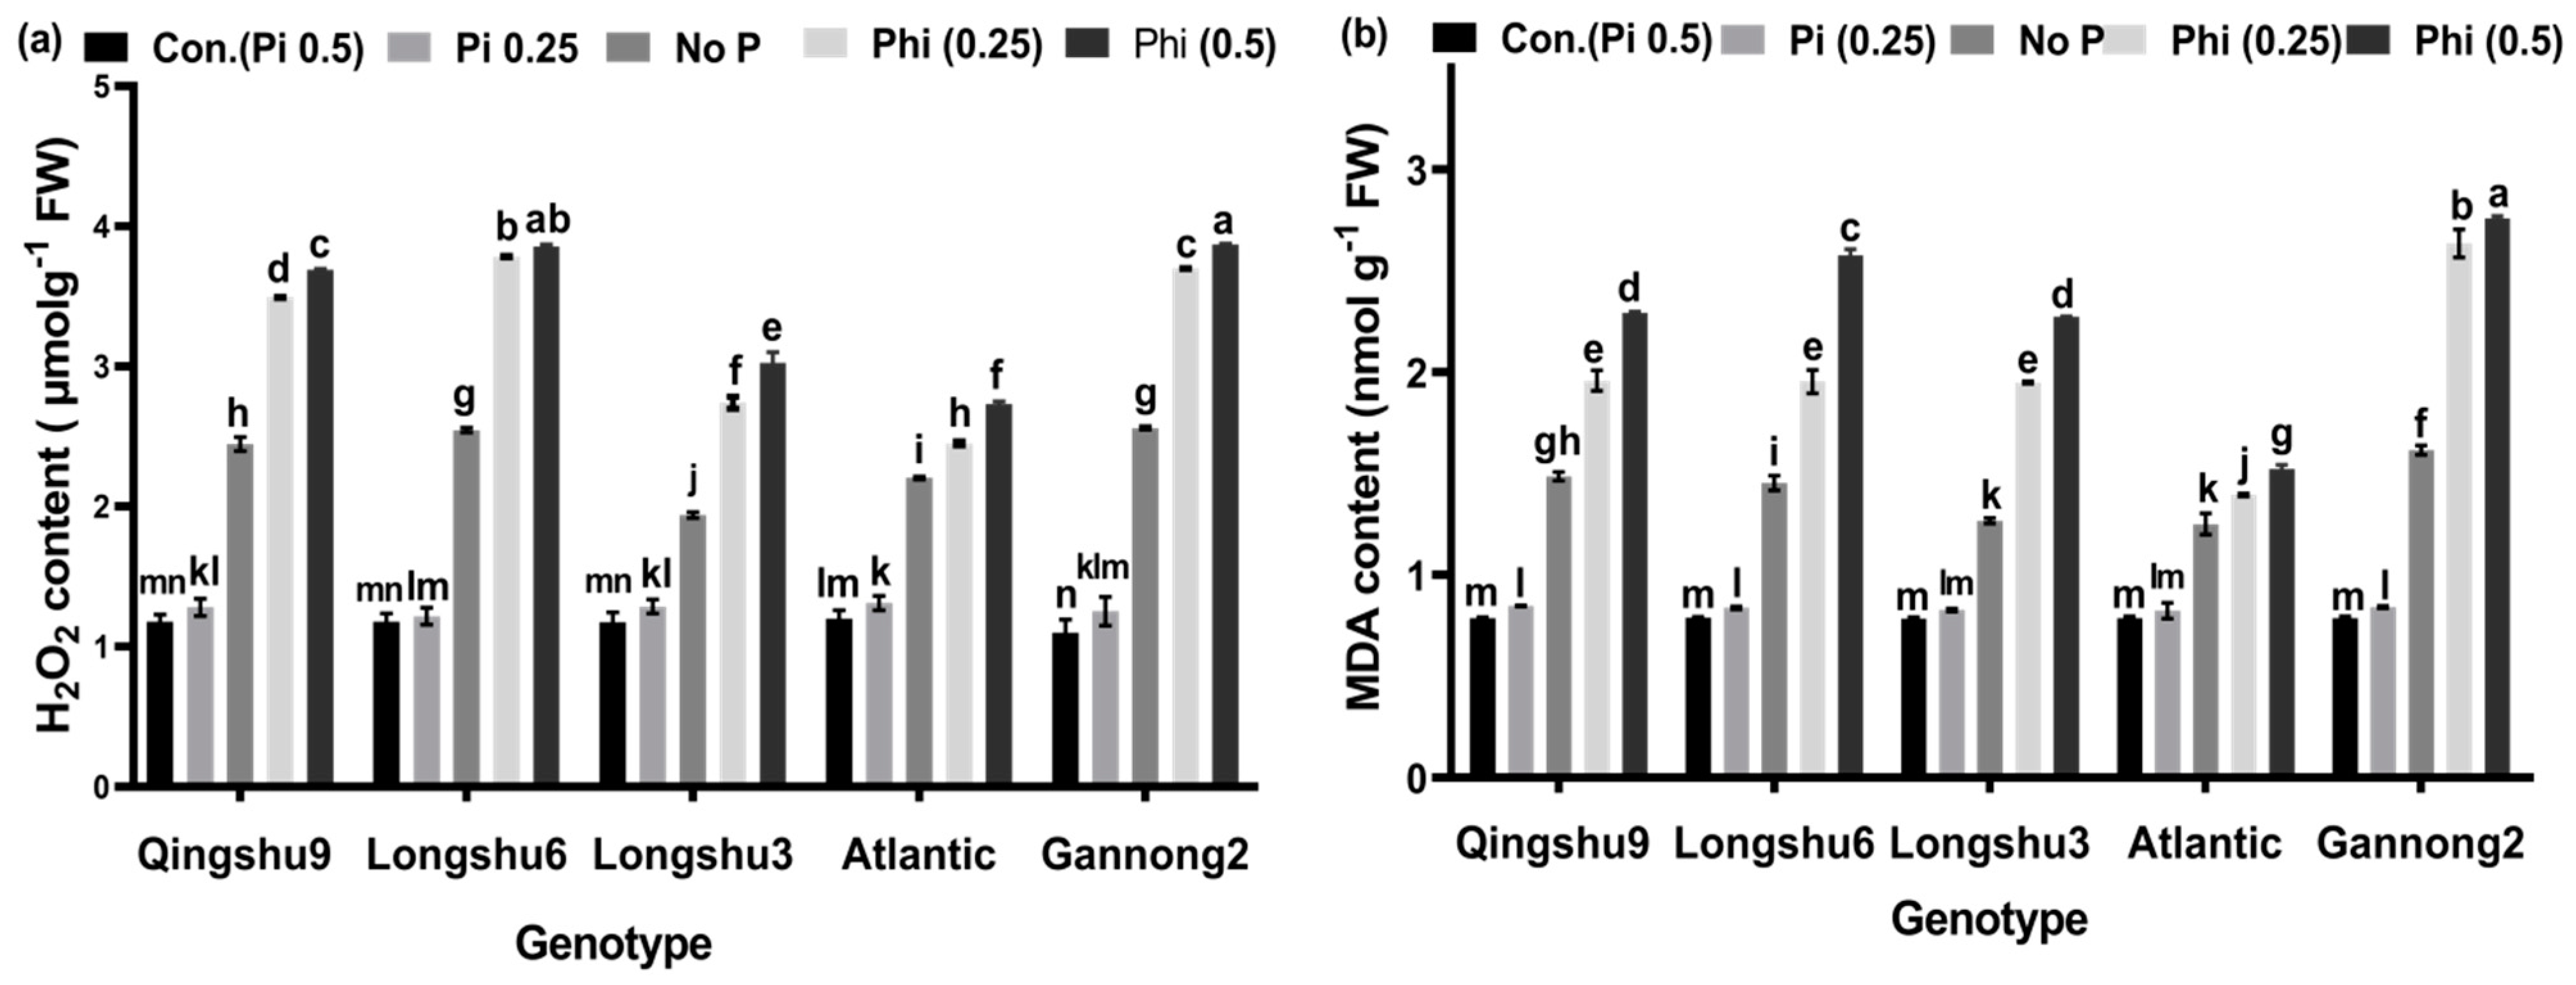
3.4. Content of H2O2 and MDA in the Shoots

There was a significant (p < 0.001) genotype x phosphite x rate effect on H2O2 and MDA content in shoots of potato genotypes (Figure 4). Compared to the control plants, Phi increased H2O2 and MDA content in the shoots of the five genotypes by 50.96 to 68.84% and 43.63 to 70.17% at 0.25 mM, 56.01 to 71.64% and 48.32 to 71.48% at 0.5 mM, respectively. The highest H2O2 and MDA values were observed in GN2, followed by genotypes Longshu6, Qingshu9 and Longshu3. The lowest H2O2 and MDA levels were observed in Atlantic genotypes at Phi 0.25 and 0.5 mM, respectively. Moreover, similar results were obtained with respect to treatment without P supply in the five potato genotypes. However, Pi-sufficient plants in all five potato genotypes exhibited low H2O2 and MDA contents, compared to genotypes under Phi stress.

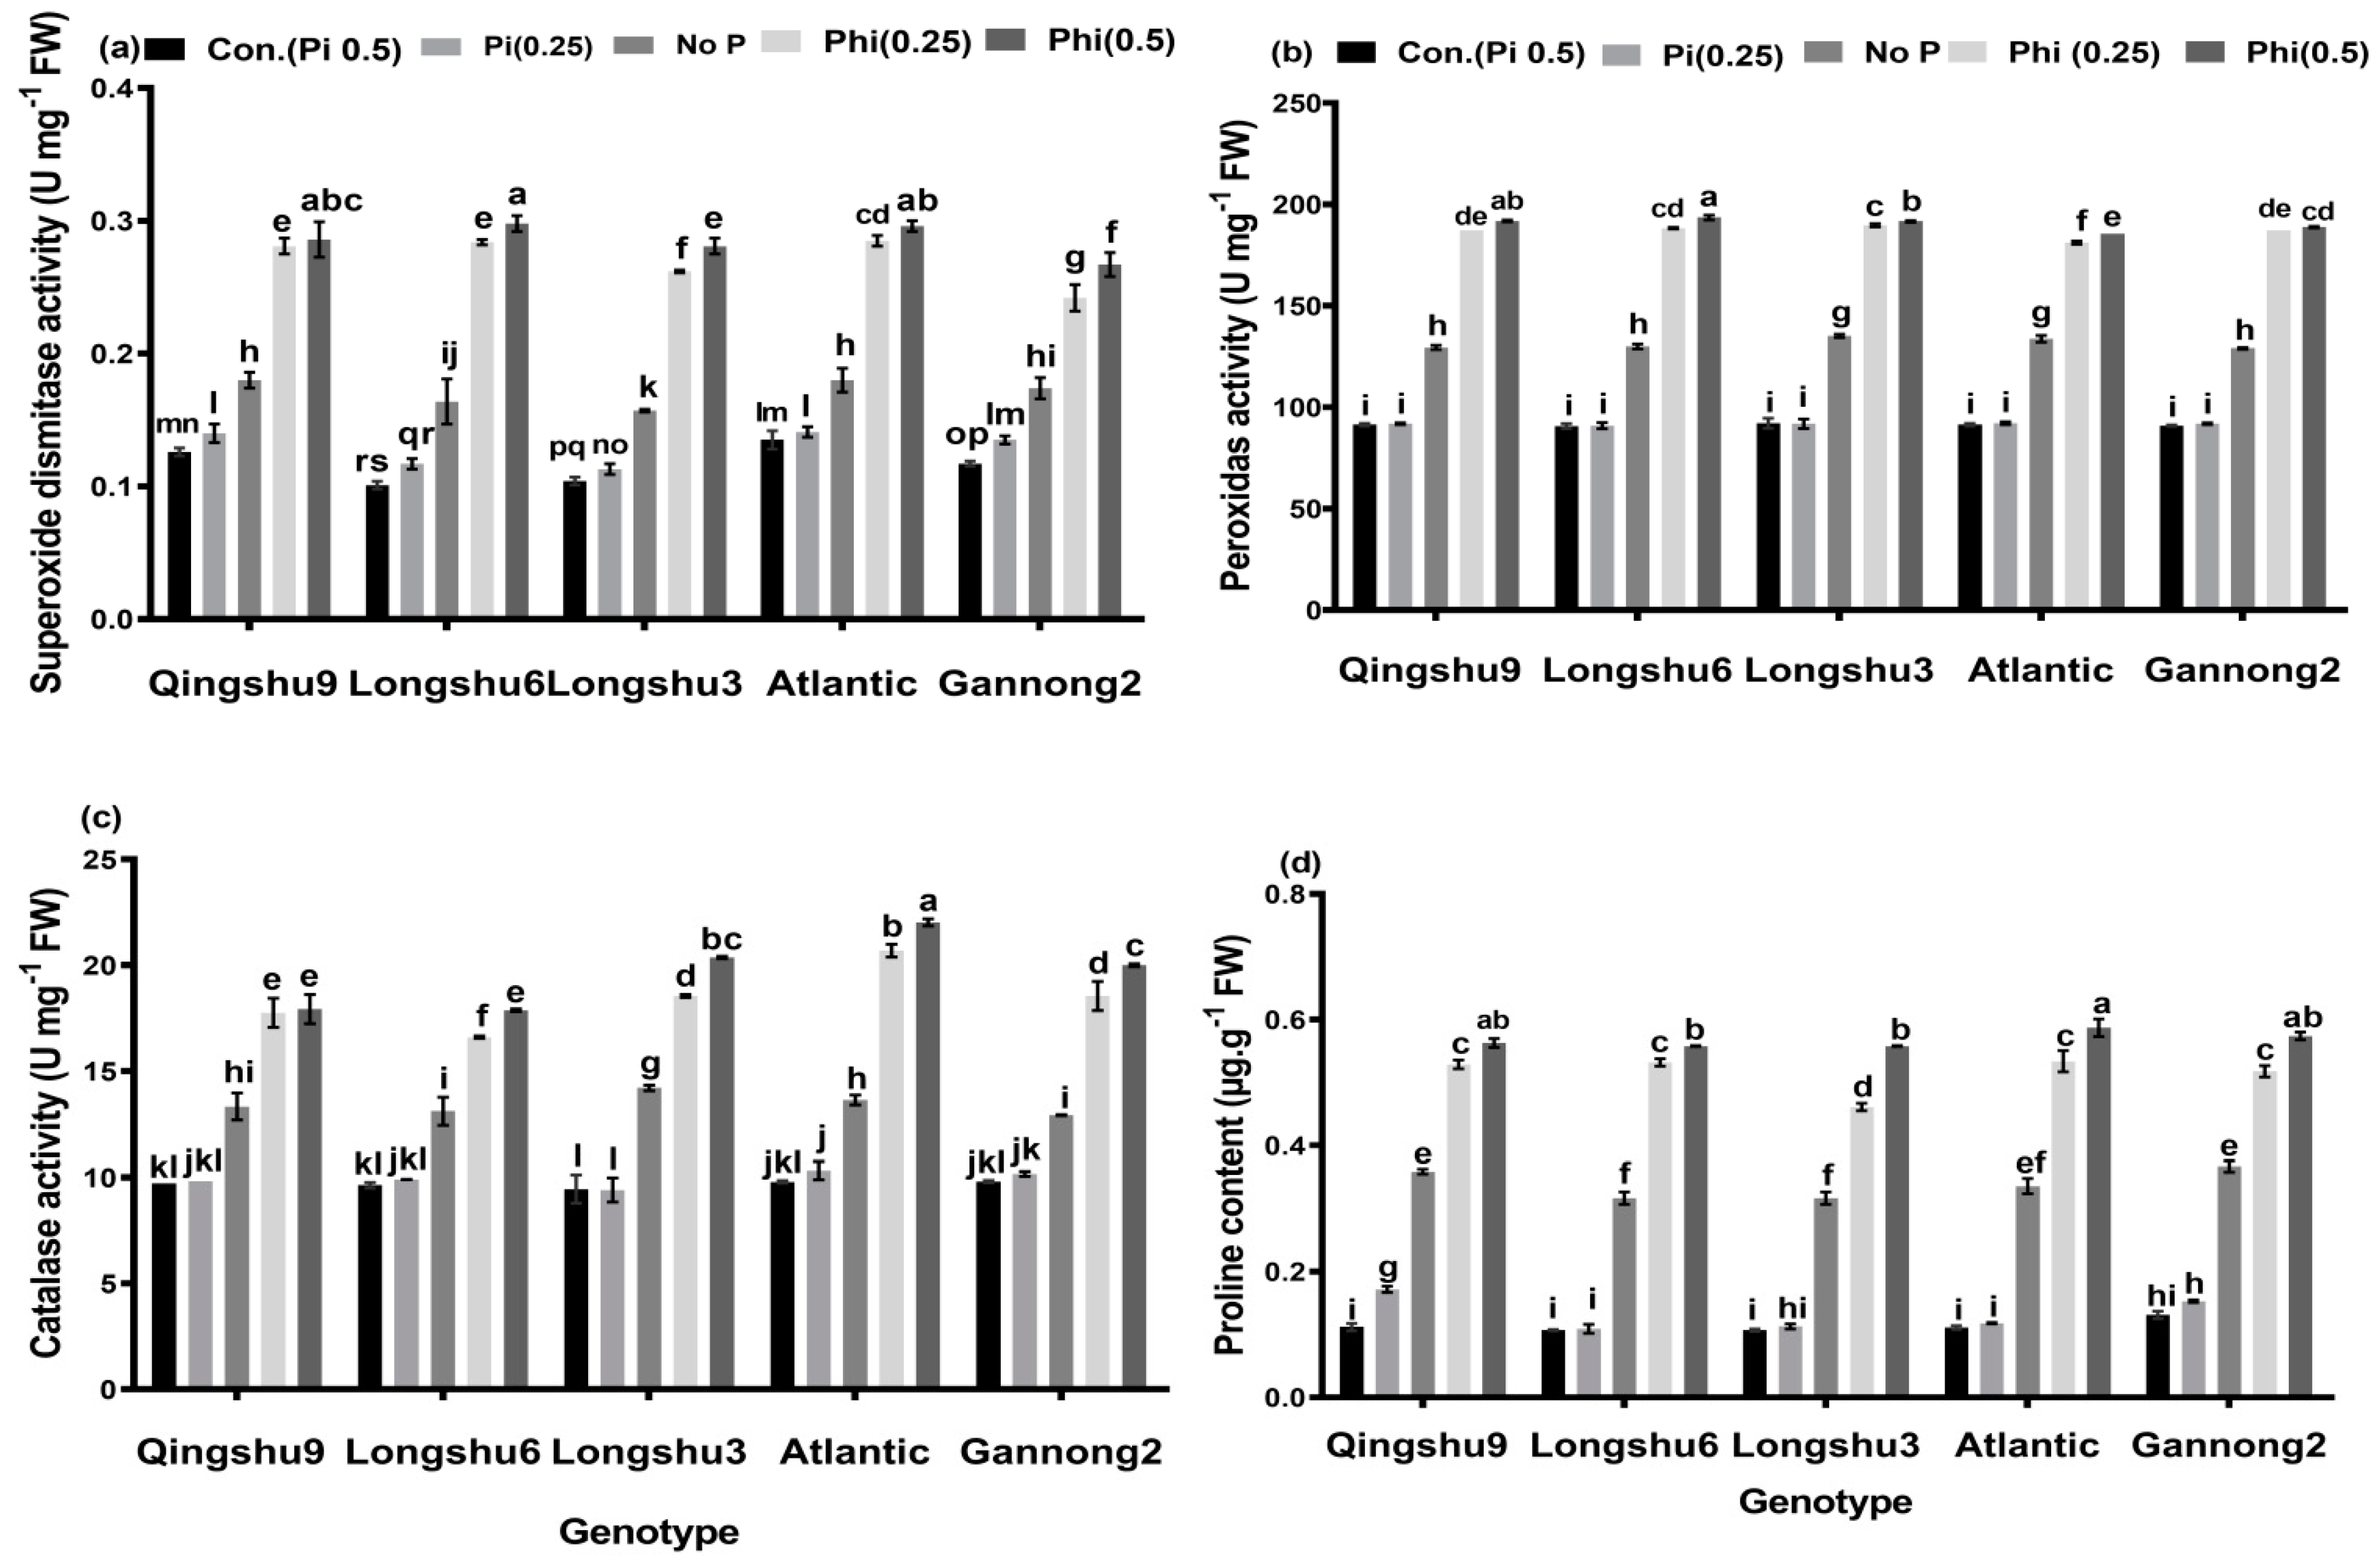
3.5. Antioxidant Enzymes Activities and Content of Proline

The effect of genotype x Phi interaction on antioxidant enzyme activities as well as the levels of proline was also significant (p < 0.01) in the shoots of the five potato genotypes (Figure 5). Compared with the individual control plants, Phi stress increased the proline contents in the shoots of all genotypes by 80.11 to 81.09% and 76.79 to 79.21% at Phi 0.5 and 0.25 mM, respectively. Moreover, the activities of CAT, POD and SOD increased by 46.07 to 55.54%, 50.77 to 53.14% and 54.39 to 63.09%, respectively, in all genotypes at 0.5 mM. The greatest increase in CAT activity was observed in the ATL genotype, while the LS6 genotype had the greatest POD and SOD activities. Similar increases in CAT, POD and SOD activities were observed in all genotypes at Phi (0.25 mM) and in No-P supplied potato genotypes.

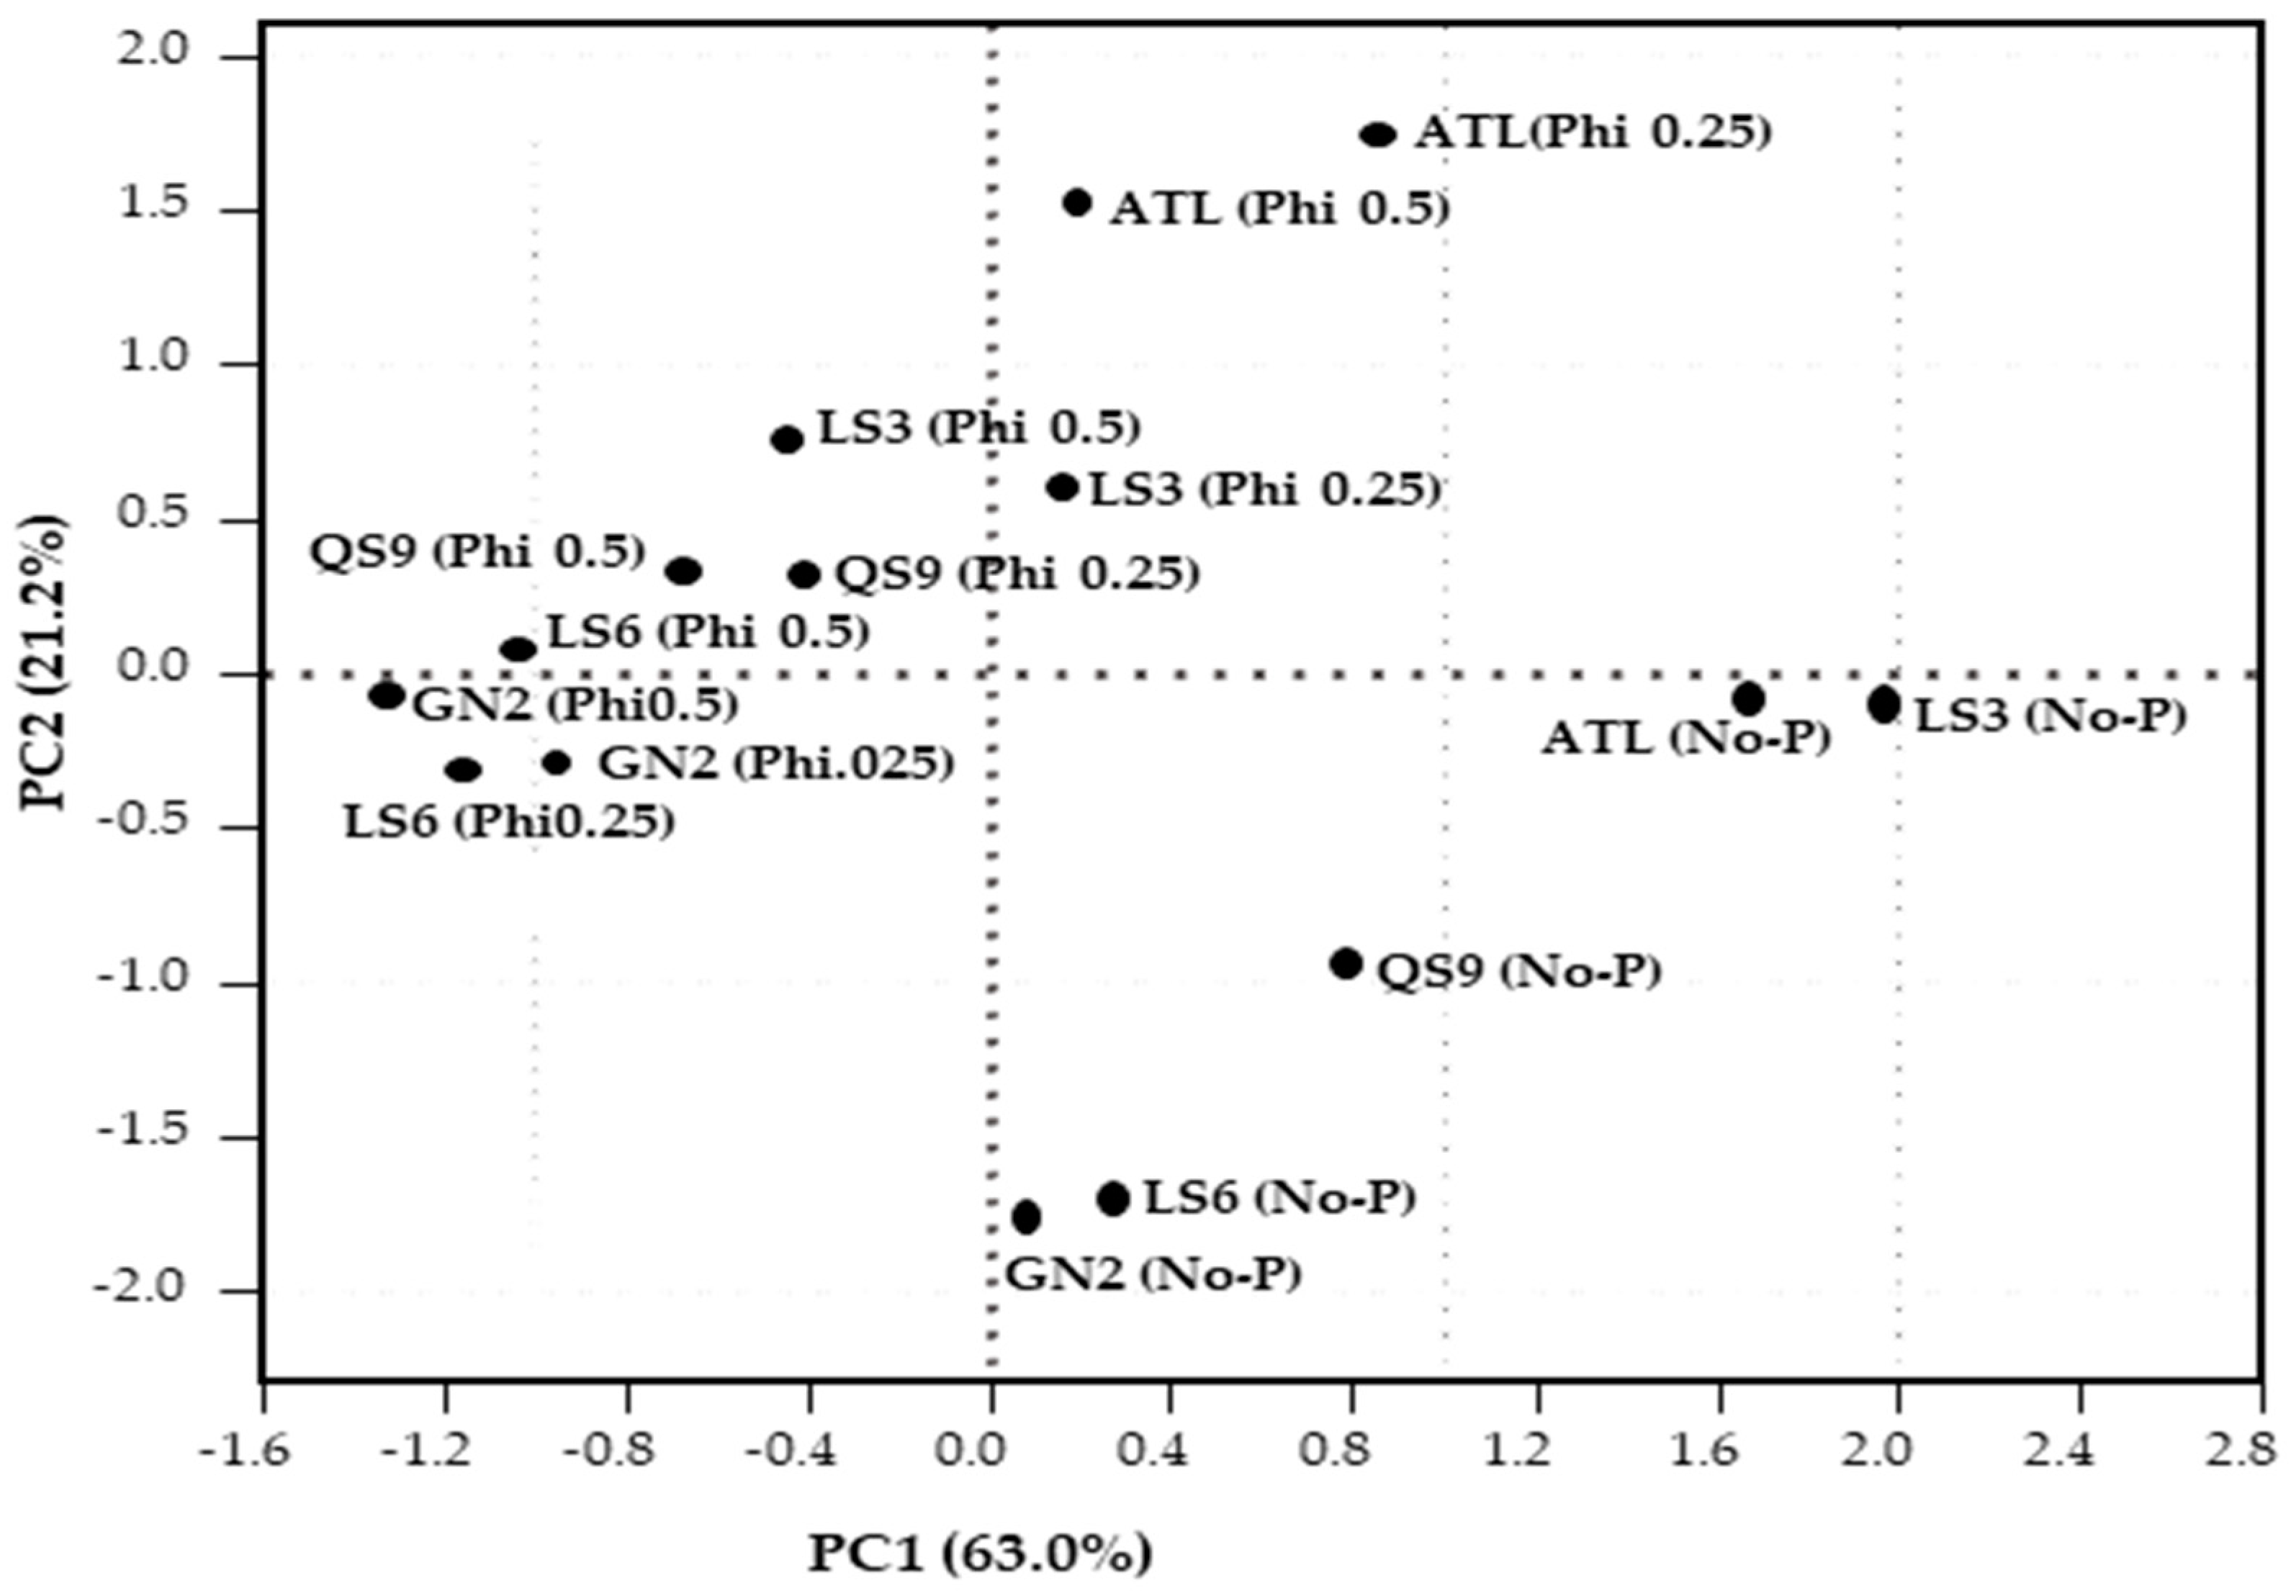
3.6. Relationships between Root Morphological Characteristics, Fresh Biomass and Biochemical Responses of the Five Potato Genotypes under Phi Stress

The correlation matrix between root morphological indices, fresh biomass, antioxidant enzyme activities, MDA, H2O2 and proline of the five potato genotypes under Phi stress were significantly negative (Table 2). All six root morphological indices were negatively correlated with MDA, H2O2, CAT, SOD, POD and Pro., e.g., TRL showed a significant negative correlation with MDA, H2O2, CAT, SOD, POD and Pro (r = −0.87 **, r = −0.94 **, r = −0.80 **, r = −0.83 **, r = −0.87 ** and r = −0.89 **). The fresh biomass, i.e., FRW, FSW and TPW were also negatively correlated with MDA, H2O2, CAT, SOD, POD and Pro, e.g., FRW was negatively correlated with MDA, H2O2, CAT, SOD, POD and Pro (r = −0.67 *, r = −0.75 **, r = −0.62 *, r = −0.69 *, r = −0.69 * and r = −0.72 **). Principal component analysis (PCA) was used to determine the effects of Phi and No-P on root morphological indices, fresh biomass, antioxidant enzymes, MDA, H2O2 and proline (Table 3). The cumulative contribution percentage of the two principal components associated with the response is 90.16%, the eigenvalue of PC1 is 8.818 and the contribution percentage is 62.98%. The eigenvectors include TRL, FRW, RPA, RSA, FRSR, NRF, RV and NRT. The eigenvalue of PC2 is 3.971, which corresponds to 27.18%, where the higher charges are CAT, SOD, MDA, POD and Pro show significant separations between the treatments. Genotype LS3 had the highest score followed by ATL, QS9, LS6 and GN2 at No-P, along PC1. On the other hand, ATL recorded the highest score followed by LS3, while GN2 had the lowest score at Phi (0.25 and 0.5 mM), along PC2. The treatments No-P and Phi (0.25 and 0.5) were far from the origin, implying that Phi and No-P strongly affected the root morphological characteristics and fresh biomass of potato genotypes (Figure 6). The comprehensive evaluation according to the principal component analysis of Phi tolerance was calculated using Formula (1) to calculate different products based on the two independent comprehensive indicators to obtain the membership function value μ(Xi) of each comprehensive index. Table 4 shows that, using the higher concentration of Phi (0.5 mM) treatment, in the same comprehensive index CI(1), Atlantic μ(X1) is the largest, with 0.937, indicating that Atlantic has the highest Phi tolerance on the CI(1) comprehensive index. According to the contribution rate of each comprehensive index, the weights of the two comprehensive indicators in terms of Phi tolerance were calculated using Formula (2) as follows: 0.699, 0.301. In addition, Formula (3) was used to calculate the Phi tolerance value according to the D value, and the Phi tolerance among the five genotypes was ranked as: Atlantic > Longshu3 > Qingshu9 > Longshu6 > Ganannong 2, respectively.

4. Discussion

In vitro regeneration studies are considered an efficient technique for defining the regulatory mechanisms of stress tolerance in potato explants. Several studies have shown the importance of in vitro shoot regeneration in plant breeding programs for economic drives [43]. To select more resistant cultivars for production, plant breeders need knowledge on how to improve regeneration of explants grown under stress conditions [44,45]. Five genotypes with different drought stress tolerance were selected based on sound data on their drought tolerance availability. These genotypes are widely grown and consumed in China. Therefore, it is important for farmers, consumers and breeders to understand their tolerance to PO3. In addition, we need to investigate whether the mechanism of drought tolerance in potato differs from the mechanism that may support PO3 tolerance. In this study, we investigated the effects of Phi, Pi deficiency and Pi sufficiency on potato plant growth. Our data showed that Phi at concentrations of 0.25 and 0.5 mM severely inhibited plant growth, whereas Pi adequate plants grew normally across the five genotypes. We found that the number of leaves, roots, shoot length and root length of five potato genotypes cultured in Phi media were significantly reduced compared to those propagated in Pi-adequate media. Similar negative growth effects of Phi on B. nigra seedlings and B. napus cell suspension cultures have been documented previously [46]. Plants cultured in Phi media are very sensitive to Phi and show signs of toxicity such as leaf chlorosis and stunted growth [16,24,30]. These findings coincided with our observation in the present study. The observed decrease in plant growth in the presence of Phi could be related to two important morphological changes in the plants. Reduced internode length was an identifying feature of Phi-treated plants. Plant height was significantly reduced in Phi-treated plants in all five genotypes, whereas P-sufficient plants appeared normal in the presence of Pi concentrations (0.25 and 0.5 mM). The second important cause was a significant decrease in root development in Pi deficiency-treated plants and Phi treated plants. However, potato genotypes Atlantic and Longshu3 showed a modest increase in root development rate compared with the other genotypes studied at 0.25 and 0.5 mM Phi.
We further found that Phi at 0.25 and 0.5 mM altered the fresh biomass parameters such as fresh root weight, fresh shoot weight, total plant weight and root to shoot ratio in all genotypes as compared to Pi-sufficient plants. The reduction in fresh biomass of the five genotypes caused by Phi toxicity was more pronounced in fresh root weight than fresh shoot weight at both concentrations. This reduction had a large effect on total plant weight, resulting in reduced plant growth and development in Phi-treated plants, as previously documented for B. nigra plants [47]. The reduced root to shoot ratio observed in the majority of genotypes is consistent with the deleterious effect of Phi on root hair production, anthocyanin accumulation in the shoot, and stimulation of enzymes induced by Pi deficiency [48]. In summary, our experiment in potato is consistent with previous reports on the biological effects of Phi in Brassica sp. [49] and in tomato [50]. Under Phi supply conditions, even a low dose (0.25 mM) was sufficient to induce a decrease in fresh biomass. The majority of the potato genotypes showed a decrease in root/shoot ratio compared to Pi-sufficient plants, except Atlantic and Longshu3, which showed a marginal increase. Furthermore, the effect of Pi deficiency on potato genotypes was studied using a medium containing -Phi + -Pi, which corresponds to No-P. All genotypes under this treatment showed a significant decrease in fresh biomass except Atlantic and Longshu3 which showed an increase in root weight compared to the other genotypes. The considerable increase in root length and root weight of these genotypes resulted in a slight increase in root to shoot ratio compared to the respective controls. This observation corroborates the findings of Lambers and Plaxton [51], who observed that the absence of Pi in the growth media altered root phenotypes such as increased root hair density and root length as well as metabolism (e.g., release of carboxylates and Pi scavenging enzymes into the rhizosphere). The mechanism for overcoming the P deficit in growth media containing No-P plants is explained by an increase in root length [4,46,52]. Moreover, several studies have shown that plants under water stress increase root length in deeper profiles and that the main difference between shallow and deeper rooting genotypes is manifested in the stress conditions imposed in each case [53,54]. Biomass tolerance index (BTI) was calculated for each genotype in relation to the stress variables (0.25, 0.5 mM and No-P) to clearly define the tolerance of potato genotypes to Phi. The result showed that in No-P treatment, Longshu3 genotype had the highest BTI, followed by Atlantic, and Gannong2 had the lowest BTI. At Phi 0.25 and 0.5 mM, the Atlantic genotype had the highest BTI followed by Longshu3 genotype, while Gannong2 genotype had the lowest BTI.
Root growth and shoot growth are correlated with each other. According to Polania et al. [55], shoot growth supplies carbon and some hormones to the roots, while root growth supplies water, nutrients and hormones to the shoot. Despite the fact that no previous study has explicitly investigated the utility of root morphological traits for plant performance under Phi stress, the results of the current study suggest that Phi interference reduces root morphological traits in all genotypes except the Atlantic genotype. It has been suggested that the ability of Phi to limit Arabidopsis development is due to the competitive inhibition of Pi uptake and the inability of plants to readily utilize Phi through oxidation to Pi [46]. Phi cannot enter P metabolic pathways unless it is converted to Pi [16,56]. Moreover, the growth of plants cultivated in the Phi treatments was comparable to that of plants grown under the No-P supply treatment in terms of root morphological indices. These results confirm the findings of Lee et al. [57] for Ulva lactuca, Schroetter et al. [58] for Zea mays, Thao et al. [59] for Brassica rapa, Avila et al. [60] for Zea mays, Zambrosi et al. [61] for Citrus spp., and Hirosse et al. [62] for Ipomoea batatas. These researchers observed that Phi anion does not replace Pi anion in P nutrition of plants. They added that the use of Phi as the sole source of P resulted in a significant reduction in plant development compared to treatments with insufficient Pi fertilization. Root morphological traits such as architecture, branching, root volume, root hair length and density were found to have reflective effects on nutrient uptake from nutrient sources, which could be used to determine plant tolerance under stress conditions. According to Dawuda et al. [38], the size of root system of lettuce plants influenced their tolerance to cadmium stress in nutrient solution. The results of this study showed that the addition of Phi (0.25 and 0.5 mM) to MS media decreased the TRL, RPA, RSA, RV, NRT and NRF of all potato genotypes studied. This consequently reduced the size of root systems of most genotypes except Atlantic. Other researchers have found that plant uptake of P and other nutrients depends on root surface area, root system length and lateral roots to capture a large volume of nutrients in the soil/growth medium [63,64,65]. In addition, our results show that the Atlantic genotype, which had the larger root system, had root tolerance indices to Phi stress at both concentrations compared with the rest of the genotypes, which had the smallest root systems. The tolerance of the Atlantic genotype to Phi stress was confirmed by the largest tolerance indices for TRL, RPA, RSA, RV, and NRF. The larger root system possessed by Atlantic probably enhanced the uptake of other trace nutrients in the growth media, which contributed to its tolerance. The results of this study are in agreement with those of Wang et al. [66], who postulated that soybean genotypes with larger root systems are more tolerant to cadmium stress. Pandey et al. [67] also reported that genotype PDM-139, a green Gram genotype, with larger root surface area and root volume was the more tolerant genotype to low P compared to those with smaller root surface area and root volume. Several other reports suggest that larger root surface area, root volume, and root hair length of plants under P-stressed growth conditions are characteristics of tolerant genotypes [68,69].
In addition, plant tolerance to Phi-stress was also determined by the hydrogen peroxide (H2O2) content formed during stress exposure. Increased formation of reactive oxygen species (ROS) such as H2O2 induces oxidative stress due to the toxicity of Phi [70]. Zhang et al. [71] postulated that Vicia sativa, which had the lowest H2O2 content was more tolerant than Phaseolus aureus which had higher H2O2 content when both were exposed to cadmium stress. According to Oyarburo et al. [72], H2O2 accumulation in leaves is reduced, antioxidant enzyme activities are increased, gene expression is upregulated and accumulation of glucanases and chitinases is induced, which correlates positively with stress tolerance of the plant. In our current study, Phi interference was observed to increase the hydrogen peroxide content in the shoots of the five potato genotypes. Nevertheless, the Atlantic genotype had the lowest increase in H2O2 content, indicating that Atlantic is more tolerant to Phi stress than the other genotypes tested. These results indicate that potato genotypes with larger root systems are more tolerant to Phi stress than genotypes with smaller root systems. Antioxidant enzymes play a critical role in plant cell defense against stress-induced cell damage caused by the formation of free radicals, mainly in the form of ROS. As a result, it has been suggested that increasing antioxidant enzyme activity may improve plant growth and yield. This result is in agreement with Ramos et al. [73], who indicated that increased SOD and CAT activity induced by low selenium concentrations increased leaf yield of Lactuca sativa L. Avila et al. [4] noted that CAT activity was low in Pi-sufficient plants but high by 71% in Phi-treated plants. Our current experiment provided similar results: the activities of antioxidant enzymes (e.g., SOD, POD and CAT) increased in all five genotypes in the presence of Phi and No-P treated plants, but decreased in Pi-sufficient plants. These antioxidant enzymes are involved in the detoxification of reactive oxygen species. Recent research has shown that Phi-anion can induce molecular changes that promote stress tolerance, such as activation of guaiacol peroxidase activity and lignin biosynthesis in maize [60], and structural and biochemical changes in periderm and cortex of potato tubers [20]. On the other hand, studies on the effects of Phi on antioxidant enzymes are still rare. All morphological variables of roots were significantly negatively correlated with antioxidant enzyme activities, MDA, H2O2 and Pro. Fresh biomass indices also showed significant negative correlation with antioxidant enzyme activity, MDA, H2O2 and Pro. The negative correlations observed under Phi stress indicated that Phi had a deleterious effect on potato root morphology and fresh biomass indices. To further confirm the tolerant potato genotype to Phi stress, a comprehensive evaluation analysis was conducted based on principal component analysis. The results evaluated the genotypes in this order: Atlantic, Longshu3, Qingshu9, Longshu6 and Gannong2.

5. Conclusions

Roots are responsible for the uptake of water and inorganic nutrients and are the primary organs affected by phosphite stress. Therefore, adaptation of roots to phosphite stress affects shoot response, physiological functions and plant growth. In the present study, the responses of five potato genotypes to 0.25, 0.5 mM Phi and Pi, and No-P were investigated. The results showed that Phi stress and No-P supply significantly reduced the size of root and shoot systems of the five potato genotypes tested. Nevertheless, the Atlantic genotype with the largest root system showed the highest tolerance to Phi stress by exhibiting the highest tolerance index values for total root length, root projected area, root surface area, root volume, number of root forks, and fresh biomass tolerance. H2O2 and MDA levels increased in shoots of all genotypes, but Atlantic genotype showed the least increase, indicating greater tolerance to Phi stress. Major antioxidant enzymes such as CAT, POD and SOD activities and proline content increased under stress conditions. Greater tolerance parameters and lower H2O2 contents were obtained from the Atlantic potato genotype under Phi stress, suggesting that potato genotypes with larger root systems may be more tolerant to Phi stress. The tolerance character of the Atlantic genotype was confirmed by comprehensive evaluation analysis using principal component analysis. The obtained results may be very useful for the selection of the genetically modified potato plants using the ptxD selection marker gene. However, the concentration and accumulation of P in shoot and root of Pi starved plants were not determined in the present study. The determination of this index will contribute to a better understanding of the mechanism of the negative effect of Phi anion on the physiological and morphological growth of potato genotypes. Therefore, future research should focus on the concentration and accumulation of P in shoot and root of plants grown under Phi stress and also determine the details of the molecular and genetic mechanisms of Phi tolerance in potato genotypes, especially in genotypes with relatively large root systems.

Author Contributions

Conceptualization, R.D. and C.S.; methodology, R.D. and C.S.; soft-ware, T.Q. and D.X.; validation, K.A. and Z.B.; formal analysis, R.D. and C.S.; investigation, R.D. and C.S.; resources, J.B.; data curation, D.X.; writing—original draft preparation, R.D., K.A. and C.S.; writing—review and editing, R.D., K.A. and C.S.; visualization, Z.B.; supervision, J.B.; project administration, J.B.; funding acquisition, J.B. All authors have read and agreed to the published version of the manuscript.

Funding

This work was supported by the National Natural Science Foundation of China (Grant No. 32060502 and 31960442), the Special Fund for Discipline Construction of Gansu Agricultural University (GAU-XKJS-2018-085, GAU-XKJS -2018-084), the special Fund for Talents of Gansu agricultural University (Grant No. 2017RCZX-44) and the Gansu Provincial Department of Education Fund (2019B-073).

Data Availability Statement

Not applicable.

Conflicts of Interest

The authors declare no conflict of interest.

References

  1. Kalayu, G. Phosphate solubilizing microorganisms: Promising approach as biofertilizers. Int. J. Agron. 2019, 2019, 1–7. [Google Scholar] [CrossRef]
  2. Achary, V.M.M.; Ram, B.; Manna, M.; Datta, D.; Bhatt, A.; Reddy, M.K.; Agrawal, P.K. Phosphite: A novel P fertilizer for weed management and pathogen control. Plant Biotech. J. 2017, 15, 1493–1508. [Google Scholar] [CrossRef] [PubMed] [Green Version]
  3. Manna, M.; Achary, V.M.M.; Islam, T.; Agrawal, P.K.; Reddy, M.K. The development of a phosphite-mediated fertilization and weed control system for rice. Sci. Rep. 2016, 6, 24941. [Google Scholar] [CrossRef] [PubMed]
  4. Ávila, F.W.; Faquin, V.; da Silva Lobato, A.K.; Ávila, P.A.; Marques, D.J.; Silva Guedes, E.M.; Tan, D.K.Y. Effect of phosphite supply in nutrient solution on yield, phosphorus nutrition and enzymatic behavior in common bean (‘Phaseolus vulgaris’ L.) Plants. Aust. J. Crop Sci. 2013, 7, 713. [Google Scholar]
  5. Heuer, S.; Gaxiola, R.; Schilling, R.; Herrera-Estrella, L.; López-Arredondo, D.; Wissuwa, M.; Delhaize, E.; Rouached, H. Improving phosphorus use efficiency: A complex trait with emerging opportunities. Plant J. 2017, 90, 868–885. [Google Scholar] [CrossRef] [PubMed] [Green Version]
  6. Yang, L.; Yang, Z.; Zhong, X.; Xu, C.; Lin, Y.; Fan, Y.; Wang, M.; Chen, G.; Yang, Y. Decreases in soil P availability are associated with soil organic P declines following forest conversion in subtropical China. CATENA 2021, 205, 105459. [Google Scholar] [CrossRef]
  7. Brödlin, D.; Kaiser, K.; Kessler, A.; Hagedorn, F. Drying and rewetting foster phosphorus depletion of forest soils. Soil Biol. Biochem. 2019, 128, 22–34. [Google Scholar] [CrossRef]
  8. Gianessi, L.P. The increasing importance of herbicides in worldwide crop production. Pest Manag. Sci. 2013, 69, 1099–1105. [Google Scholar] [CrossRef] [PubMed]
  9. Parry, M.A.; Hawkesford, M.J. Food security: Increasing yield and improving resource use efficiency. Proc. Nutr. Soc. 2010, 69, 592–600. [Google Scholar] [CrossRef] [Green Version]
  10. Haque, S.E. How Effective Are Existing Phosphorus Management Strategies in Mitigating Surface Water Quality Problems in the US? Sustainability 2021, 13, 6565. [Google Scholar] [CrossRef]
  11. Peng, L.; Dai, H.; Wu, Y.; Peng, Y.; Lu, X. A comprehensive review of the available media and approaches for phosphorus recovery from wastewater. Water Air Soil Pollut. 2018, 229, 1–28. [Google Scholar] [CrossRef]
  12. Powles, S.B.; Yu, Q. Evolution in action: Plants resistant to herbicides. Annu. Rev. Plant Biol. 2010, 61, 317–347. [Google Scholar] [CrossRef] [PubMed] [Green Version]
  13. Asaduzzaman, M.; Pratley, J.E.; Luckett, D.; Lemerle, D.; Wu, H. Weed management in canola (Brassica napus L): A review of current constraints and future strategies for Australia. Archives Agron. Soil Sci. 2020, 66, 427–444. [Google Scholar] [CrossRef]
  14. Guo, M.; Li, B.; Xiang, Q.; Wang, R.; Liu, P.; Chen, Q. Phosphite translocation in soybean and mechanisms of Phytophthora sojae inhibition. Pest. Biochem. Physiol. 2021, 172, 104757. [Google Scholar] [CrossRef] [PubMed]
  15. García-Gaytán, V.; Hernández-Mendoza, F.; Coria-Téllez, A.V.; García-Morales, S.; Sánchez-Rodríguez, E.; Rojas-Abarca, L.; Daneshvar, H. Fertigation: Nutrition, stimulation and bioprotection of the root in high performance. Plants 2018, 7, 88. [Google Scholar] [CrossRef] [Green Version]
  16. McDonald, A.E.; Grant, B.R.; Plaxton, W.C. Phosphite (phosphorous acid): Its relevance in the environment and agriculture and influence on plant phosphate starvation response. J. Plant Nutr. 2001, 24, 1505–1519. [Google Scholar] [CrossRef]
  17. Solis-Palacios, R.; Hernández-Ramírez, G.; Salinas-Ruiz, J.; Hidalgo-Contreras, J.V.; Gómez-Merino, F.C. Effect and Compatibility of Phosphite with Trichoderma sp. Isolates in the Control of the Fusarium Species Complex Causing Pokkah Boeng in Sugarcane. Agronomy 2021, 11, 1099. [Google Scholar] [CrossRef]
  18. Cerqueira, A.; Alves, A.; Berenguer, H.; Correia, B.; Gómez-Cadenas, A.; Diez, J.J.; Monteiro, P.; Pinto, G. Phosphite shifts physiological and hormonal profile of Monterey pine and delays Fusarium circinatum progression. Plant Physiol. Biochem. 2017, 114, 88–99. [Google Scholar] [CrossRef]
  19. Rampersad, S.N. Pathogenomics and management of Fusarium diseases in plants. Pathogens 2020, 9, 340. [Google Scholar] [CrossRef]
  20. Olivieri, F.P.; Feldman, M.L.; Machinandiarena, M.F.; Lobato, M.C.; Caldiz, D.O.; Daleo, G.R.; Andreu, A.B. Phosphite applications induce molecular modifications in potato tuber periderm and cortex that enhance resistance to pathogens. Crop Protect. 2012, 32, 1–6. [Google Scholar] [CrossRef]
  21. Silva, O.; Santos, H.; Dalla Pria, M.; May-De Mio, L. Potassium phosphite for control of downy mildew of soybean. Crop Protect. 2011, 30, 598–604. [Google Scholar] [CrossRef]
  22. Huang, Z.; Carter, N.; Lu, H.; Zhang, Z.; Wang-Pruski, G. Translocation of phosphite encourages the protection against Phytophthora infestans in potato: The efficiency and efficacy. Pest. Biochem. Physiol. 2018, 152, 122–130. [Google Scholar] [CrossRef] [PubMed]
  23. Mehta, D.; Ghahremani, M.; Pérez-Fernández, M.; Tan, M.; Schläpfer, P.; Plaxton, W.C.; Uhrig, R.G. Phosphate and phosphite have a differential impact on the proteome and phosphoproteome of Arabidopsis suspension cell cultures. Plant J. 2021, 105, 924–941. [Google Scholar] [CrossRef] [PubMed]
  24. Thao, H.T.B.; Yamakawa, T. Phosphite (phosphorous acid): Fungicide, fertilizer or bio-stimulator? Soil Sci. Plant Nutr. 2009, 55, 228–234. [Google Scholar] [CrossRef]
  25. César Bachiega Zambrosi, F.; Mattos, D.J.; Syvertsen, J.P. Plant growth, leaf photosynthesis, and nutrient-use efficiency of citrus rootstocks decrease with phosphite supply. J. Plant Nutr. Soil Sci. 2011, 174, 487–495. [Google Scholar] [CrossRef]
  26. Xi, Y.; Han, X.; Zhang, Z.; Joshi, J.; Borza, T.; Aqa, M.M.; Zhang, B.; Yuan, H.; Wang-Pruski, G. Exogenous phosphite application alleviates the adverse effects of heat stress and improves thermotolerance of potato (Solanum tuberosum L.) seedlings. Ecotoxicol. Environ. Saf. 2020, 190, 110048. [Google Scholar] [CrossRef]
  27. Leong, S.J.; Lu, W.-C.; Chiou, T.-J. Phosphite-mediated suppression of anthocyanin accumulation regulated by mitochondrial ATP synthesis and sugars in Arabidopsis. Plant Cell Physiol. 2018, 59, 1158–1169. [Google Scholar] [CrossRef]
  28. Trejo-Téllez, L.I.; Estrada-Ortiz, E.; Gómez-Merino, F.C.; Becker, C.; Krumbein, A.; Schwarz, D. Flavonoid, nitrate and glucosinolate concentrations in Brassica species are differentially affected by photosynthetically active radiation, phosphate and phosphite. Front. Plant Sci. 2019, 10, 371. [Google Scholar] [CrossRef] [PubMed]
  29. Burra, D.D. Defence Related Molecular Signalling in Potato. Acta Univ. Agric. Sueciae 2016, 7, 1652–6880. [Google Scholar]
  30. Gómez-Merino, F.C.; Trejo-Téllez, L.I. Biostimulant activity of phosphite in horticulture. Sci. Hort. 2015, 196, 82–90. [Google Scholar] [CrossRef] [Green Version]
  31. Han, X.; Xi, Y.; Zhang, Z.; Mohammadi, M.A.; Joshi, J.; Borza, T.; Wang-Pruski, G. Effects of phosphite as a plant biostimulant on metabolism and stress response for better plant performance in Solanum tuberosum. Ecotoxicol. Environ. Saf. 2021, 210, 111873. [Google Scholar] [CrossRef]
  32. Gómez-Merino, F.C.; Trejo-Téllez, L.I. Conventional and novel uses of phosphite in horticulture: Potentialities and challenges. Italus Hortus 2016, 23, 1–13. [Google Scholar]
  33. Quandahor, P.; Lin, C.; Gou, Y.; Coulter, J.A.; Liu, C. Leaf morphological and biochemical responses of three potato (Solanum tuberosum L.) cultivars to drought stress and aphid (Myzus persicae Sulzer) infestation. Insects 2019, 10, 435. [Google Scholar] [CrossRef] [Green Version]
  34. Jia, H.; Wang, Q.; Tao, Q.; Xue, W. Analysis and circuit implementation for the fractional-order Chen system. In Proceedings of the 8th CHAOS Conference Proceedings, Paris, France, 26–29 May 2015. [Google Scholar]
  35. Cabello, R.; De Mendiburu, F.; Bonierbale, M.; Monneveux, P.; Roca, W.; Chujoy, E. Large-scale evaluation of potato improved varieties, genetic stocks and landraces for drought tolerance. Am. J. Potato Res. 2012, 89, 400–410. [Google Scholar] [CrossRef]
  36. Murashige, T.; Skoog, F. A revised medium for rapid growth and bio assays with tobacco tissue cultures. Physiol. Plant. 1962, 15, 473–497. [Google Scholar] [CrossRef]
  37. Wilkins, D. The measurement of tolerance to edaphic factors by means of root growth. New Phytol. 1978, 80, 623–633. [Google Scholar] [CrossRef]
  38. Dawuda, M.M.; Liao, W.; Hu, L.; Yu, J.; Xie, J.; Calderón-Urrea, A.; Jin, X.; Wu, Y. Root tolerance and biochemical response of Chinese lettuce (Lactuca sativa L.) genotypes to cadmium stress. PeerJ 2019, 7, e7530. [Google Scholar] [CrossRef] [Green Version]
  39. Junglee, S.; Urban, L.; Sallanon, H.; Lopez-Lauri, F. Optimized assay for hydrogen peroxide determination in plant tissue using potassium iodide. Am. J. Analyt. Chem. 2014, 5, 730. [Google Scholar] [CrossRef] [Green Version]
  40. Hodges, D.M.; DeLong, J.M.; Forney, C.F.; Prange, R.K. Improving the thiobarbituric acid-reactive-substances assay for estimating lipid peroxidation in plant tissues containing anthocyanin and other interfering compounds. Planta 1999, 207, 604–611. [Google Scholar] [CrossRef]
  41. Dhindsa, R.S.; Plumb-Dhindsa, P.; Thorpe, T.A. Leaf senescence: Correlated with increased levels of membrane permeability and lipid peroxidation, and decreased levels of superoxide dismutase and catalase. J. Exp. Bot. 1981, 32, 93–101. [Google Scholar] [CrossRef]
  42. Bates, L.S.; Waldren, R.P.; Teare, I. Rapid determination of free proline for water-stress studies. Plant Soil 1973, 39, 205–207. [Google Scholar] [CrossRef]
  43. Pocketbook, F.S. World Food and Agriculture; Food and Agriculture Organization: Rome, Italy, 2015. [Google Scholar]
  44. Vinocur, B.; Altman, A. Recent advances in engineering plant tolerance to abiotic stress: Achievements and limitations. Curr. Opin. Biotech. 2005, 16, 123–132. [Google Scholar] [CrossRef]
  45. Zhu, J.-K. Plant salt tolerance. Trends Plant Sci. 2001, 6, 66–71. [Google Scholar] [CrossRef]
  46. Ticconi, C.A.; Delatorre, C.A.; Abel, S. Attenuation of phosphate starvation responses by phosphite in Arabidopsis. Plant Physiol. 2001, 127, 963–972. [Google Scholar] [CrossRef] [PubMed]
  47. Ram, B.; Fartyal, D.; Sheri, V.; Varakumar, P.; Borphukan, B.; James, D.; Yadav, R.; Bhatt, A.; Agrawal, P.K.; Achary, V.M.M. Characterization of phoA, a Bacterial Alkaline Phosphatase for Phi Use Efficiency in Rice Plant. Front. Plant Sci. 2019, 10, 37. [Google Scholar] [CrossRef] [PubMed] [Green Version]
  48. Plaxton, W.C.; Carswell, M.C. Metabolic aspects of the phosphate starvation response in plants. In Plant Responses to Environmental Stresses; Routledge: Oxfordshire, UK, 2018; pp. 349–372. [Google Scholar]
  49. Carswell, M.C.; Grant, B.R.; Plaxton, W.C. Disruption of the phosphate-starvation response of oilseed rape suspension cells by the fungicide phosphonate. Planta 1997, 203, 67–74. [Google Scholar] [CrossRef] [PubMed]
  50. Vinas, M.; Mendez, J.C.; Jiménez, V.M. Effect of foliar applications of phosphites on growth, nutritional status and defense responses in tomato plants. Sci. Hort. 2020, 265, 109200. [Google Scholar] [CrossRef]
  51. Lambers, H.; Plaxton, W.C. Phosphorus: Back to the roots. Annu. Plant Rev. 2015, 48, 3–22. [Google Scholar]
  52. Devaiah, B.N.; Karthikeyan, A.S.; Raghothama, K.G. WRKY75 transcription factor is a modulator of phosphate acquisition and root development in Arabidopsis. Plant Physiol. 2007, 143, 1789–1801. [Google Scholar] [CrossRef] [Green Version]
  53. Correa, J.; Postma, J.A.; Watt, M.; Wojciechowski, T. Soil compaction and the architectural plasticity of root systems. J. Exp. Bot. 2019, 70, 6019–6034. [Google Scholar] [CrossRef]
  54. Vanhees, D.J.; Loades, K.W.; Bengough, A.G.; Mooney, S.J.; Lynch, J.P. The ability of maize roots to grow through compacted soil is not dependent on the amount of roots formed. Field Crop. Res. 2021, 264, 108013. [Google Scholar] [CrossRef]
  55. Polania, J.; Rao, I.M.; Cajiao, C.; Grajales, M.; Rivera, M.; Velasquez, F.; Raatz, B.; Beebe, S.E. Shoot and root traits contribute to drought resistance in recombinant inbred lines of MD 23–24× SEA 5 of common bean. Front. Plant Sci. 2017, 8, 296. [Google Scholar] [CrossRef]
  56. Varadarajan, D.K.; Karthikeyan, A.S.; Matilda, P.D.; Raghothama, K.G. Phosphite, an analog of phosphate, suppresses the coordinated expression of genes under phosphate starvation. Plant Physiol. 2002, 129, 1232–1240. [Google Scholar] [CrossRef] [PubMed] [Green Version]
  57. Lee, T.M.; Tsai, P.F.; Shyu, Y.T.; Sheu, F. The Effects of Phosphite on Phosphate Starvation Responses of Ulva Lactuca (Ulvales, Chlorophyta) 1. J. Phycol. 2005, 41, 975–982. [Google Scholar] [CrossRef]
  58. Schroetter, S.; Angeles-Wedler, D.; Kreuzig, R.; Schnug, E. Effects of phosphite on phosphorus supply and growth of corn (Zea mays). Landbauforsch. Volkenrode 2006, 56, 87. [Google Scholar]
  59. Thao, H.T.B.; Yamakawa, T.; Myint, A.K.; Sarr, P.S. Effects of phosphite, a reduced form of phosphate, on the growth and phosphorus nutrition of spinach (Spinacia oleracea L.). Soil Sci. Plant Nutrit. 2008, 54, 761–768. [Google Scholar] [CrossRef] [Green Version]
  60. Avila, F.W.; Faquin, V.; Araujo, J.L.; Marques, D.J.; Júnior, P.M.R.; da Silva Lobato, A.K.; Ramos, S.J.; Baliza, D.P. Phosphite supply affects phosphorus nutrition and biochemical responses in maize plants. Aust. J. Crop Sci. 2011, 5, 646–653. [Google Scholar]
  61. Zambrosi, F.C.B.; Mattos, D., Jr.; Quaggio, J.A.; Cantarella, H.; Boaretto, R.M. Phosphorus uptake by young citrus trees in low-P soil depends on rootstock varieties and nutrient management. Commun. Soil Sci. Plant Anal. 2013, 44, 2107–2117. [Google Scholar] [CrossRef]
  62. Hirosse, E.H.; Creste, J.E.; Custódio, C.C.; Machado-Neto, N.B. In vitro growth of sweet potato fed with potassium phosphite. Acta Scient. Agron. 2012, 34, 85–91. [Google Scholar] [CrossRef]
  63. Balemi, T.; Negisho, K. Management of soil phosphorus and plant adaptation mechanisms to phosphorus stress for sustainable crop production: A review. J. Soil Sci. Plant Nutrit. 2012, 12, 547–562. [Google Scholar] [CrossRef] [Green Version]
  64. Richardson, A.E.; Barea, J.-M.; McNeill, A.M.; Prigent-Combaret, C. Acquisition of phosphorus and nitrogen in the rhizosphere and plant growth promotion by microorganisms. Plant Soil 2009, 321, 305–339. [Google Scholar] [CrossRef]
  65. Lambers, H.; Clode, P.L.; Hawkins, H.J.; Laliberté, E.; Oliveira, R.S.; Reddell, P.; Shane, M.W.; Stitt, M.; Weston, P. Metabolic adaptations of the non-mycotrophic Proteaceae to soils with low phosphorus availability. Annu. Plant Rev. Phosphorus Metab. Plants 2015, 48, 289. [Google Scholar]
  66. Wang, Y.; Yang, R.; Zheng, J.; Shen, Z.; Xu, X. Exogenous foliar application of fulvic acid alleviate cadmium toxicity in lettuce (Lactuca sativa L.). Ecotoxico. Environ. Saf. 2019, 167, 10–19. [Google Scholar] [CrossRef] [PubMed]
  67. Pandey, R.; Meena, S.K.; Krishnapriya, V.; Ahmad, A.; Kishora, N. Root carboxylate exudation capacity under phosphorus stress does not improve grain yield in green gram. Plant Cell Rep. 2014, 33, 919–928. [Google Scholar] [CrossRef]
  68. Gahoonia, T.S.; Nielsen, N.E. Root traits as tools for creating phosphorus efficient crop varieties. Plant Soil 2004, 260, 47–57. [Google Scholar] [CrossRef]
  69. Wu, P.; Ma, X.; Tigabu, M.; Wang, C.; Liu, A.; Oden, P.C. Root morphological plasticity and biomass production of two Chinese fir clones with high phosphorus efficiency under low phosphorus stress. Can. J. For. Res. 2011, 41, 228–234. [Google Scholar] [CrossRef]
  70. Tripathi, D.K.; Singh, S.; Singh, V.P.; Prasad, S.M.; Dubey, N.K.; Chauhan, D.K. Silicon nanoparticles more effectively alleviated UV-B stress than silicon in wheat (Triticum aestivum) seedlings. Plant Physiol. Biochem. 2017, 110, 70–81. [Google Scholar] [CrossRef] [PubMed]
  71. Zhang, F.; Zhang, H.; Wang, G.; Xu, L.; Shen, Z. Cadmium-induced accumulation of hydrogen peroxide in the leaf apoplast of Phaseolus aureus and Vicia sativa and the roles of different antioxidant enzymes. J. Haz. Mat. 2009, 168, 76–84. [Google Scholar] [CrossRef] [PubMed]
  72. Oyarburo, N.S.; Machinandiarena, M.F.; Feldman, M.L.; Daleo, G.R.; Andreu, A.B.; Olivieri, F.P. Potassium phosphite increases tolerance to UV-B in potato. Plant Physiol. Biochem. 2015, 88, 1–8. [Google Scholar] [CrossRef]
  73. Ramos, S.; Faquin, V.; Guilherme, L.; Castro, E.; Ávila, F.; Carvalho, G.; Bastos, C.; Oliveira, C. Selenium biofortification and antioxidant activity in lettuce plants fed with selenate and selenite. Plant Soil Environ. 2010, 56, 584–588. [Google Scholar] [CrossRef] [Green Version]
Figure 1. Effect of Phi, Pi and No-P on (a) number of leaves, (b) number of roots, (c) shoot length (cm), and (d) root length (cm) of five potato genotypes grown in modified MS media containing 0.25 and 0.5 mM Phi and Pi and No-P supply for 20 days. Values denote the mean of 3 replicates, ±standard deviation (SD). Means obtained with the same letter in the minuscule do not differ by Duncan Multiple range’s test (p ≤ 0.05).
Horticulturae 07 00265 g001
Figure 2. Effect of PO3, PO4 and No-P on (a) Total root length (b) Root projected area (c) Root surface area (d) Root volume (e) Number of root tips and (f) Number of root forks of five potato genotypes grown for 20 days in medium containing concentrations of 0.25, 0.5 mM PO3 and PO4 and No-P. Values symbolize the mean of 3 replicates ± standard deviation (SD). Means followed by the same lowercase letter do not differ among treatments by Duncan Multiple range’s test (p ≤ 0.05).
Horticulturae 07 00265 g002
Figure 3. Root PO3 tolerance indexes (%) of five potato genotypes under 0.5 mM Phi treatment. Qingshu9 = QS9; Longshu6 = LS6; Longshu3 = LS3; Atlantic = ATL and Gannong2 = GN2. Total root length = TRL; Root projected area = RPA; Root surface area = RSA; Root volume = RV; Number of root tips = NRT and Number of root forks = NRF. Values represent the mean of 3 replicates ± standard deviation (SD). Bars associated with different lowercase letters show significant differences by Duncan Multiple Range’s test (p ≤ 0.05).
Horticulturae 07 00265 g003
Figure 4. Effects of Phi, Pi and No-P on H2O2 and MDA content; (a) Shows H2O2 content and (b) shows MDA content in the shoots of potato genotypes. Values denote the mean of 3 replicates ± standard deviation (SD). Duncan multiple range test (p ≤ 0.05) shows large differences between bars assigned to different lowercase letters.
Horticulturae 07 00265 g004
Figure 5. Phi and Pi effects on enzyme activities and contents of proline; (a) Shows the activities of SOD; (b) Shows the activities of POD; (c) Shows the activities of CAT; (d) Contents of proline. Values denote the mean of 3 replications ± standard deviation (SD). Bars associated with different lowercase letters show significant differences by Duncan Multiple Range’s test (p ≤ 0.05).
Horticulturae 07 00265 g005
Figure 6. Scatter diagrams of arranged first two main components; PC1/PC2.
Horticulturae 07 00265 g006
Table 1. Effect of Phi, Pi and No-P supply on fresh biomass, root/shoot ratio and biomass tolerance index of five potato genotypes studied under in vitro conditions.
Genotype Biomass Accumulation (g)Root/Shoot Ratio* BTI (%)
TreatmentFresh Root WeightFresh Shoot WeightFresh Plant Weight
Qingshu9Con.Pi 0.50.087 ± 0.002 a0.156 ± 0.001 a0.243 ± 0.003 ab0.560 ± 0.006 ef100
Pi0.25 mM0.067 ± 0.004 b0.143 ± 0.0008 a0.210 ± 0.004 bc0.467 ± 0.031 fgh96.42
No-P0.033 ± 0.001 ef0. 054 ± 0.0008 c0. 087 ± 0.002 fg0.611 ± 0.019 de35.80
Phi0.25 mM0.019 ± 0.004 gh0.064 ± 0.001 bc0.083 ± 0.003 fg0.297 ± 0.072 jk30.04
Phi 0.5 mM0.018 ± 0.006 gh0.065 ± 0.001 bc0.083 ± 0.006 g0.277 ± 0.085 jk30.04
Longshu6Control0.087 ± 0.0006 a0.154 ± 0.002 a0.241 ± 0.002 ab0.565 ± 0.015 ef100
Pi0.25 mM0.097 ± 0.0006 a0.157 ± 0.001 a0.254 ± 0.001 a0.618 ± 0.007 de105.39
No-P0.025 ± 0.001 fg0.062 ± 0.003 c0.087 ± 0.003 fg0.403 ± 0.033 ghi36.51
Phi0.25 mM0.014 ± 0.0006 gh0.054 ± 0.0006 c0.068 ± 0.0006 g0.259 ± 0.015 k27.80
Phi 0.5 mM0.026 ± 0.001 fg0.057 ± 0.001 c0.083 ± 0.001 g0.456 ± 0.018 fghi34.44
Longshu3Control0.048 ± 0.001 cd0.147 ± 0.001 c0.195 ± 0.002 c 0.327 ± 0.001 jk100
Pi0.25 mM0.085 ± 0.0006 a0.089 ± 0.0006 b0.174 ± 0.000 cd0.955 ± 0.013 b89.23
No-P0.067 ± 0.002 b0.055 ± 0.001 c0.122 ± 0.003 ef 1.218 ± 0.007 a63.08
Phi0.25 mM0.037 ± 0.0006 def0.064 ± 0.0006 bc0.101 ± 0.001 fg 0.578 ± 0.002 ef57.95
Phi 0.5 mM0.024 ± 0.001 fg0.048 ± 0.002 c 0.072 ± 0.001 g0.500 ± 0.037 efg36.92
AtlanticControl0.054 ± 0.0006 bc0.148 ± 0.0006 a0.202 ± 0.000 c0.365 ± 0.005 hij100
Pi 0.25 mM0.067 ± 0.001 b0.135 ± 0.001 a0.202 ± 0.0006 c0.496 ± 0.012 fg100
No-P0.057 ± 0.001 bc 0.058 ± 0.0006 c0.115 ± 0.002 ef0.983 ± 0.019 b56.93
Phi0.25 mM0.058 ± 0.0006 bc0.084 ± 0.0006 b0.142 ± 0.0006 de0.690 ± 0.010 d69.80
Phi 0.5 mM0.046 ± 0.001 cde0.058 ± 0.001 c0.104 ± 0.002 efg0.793 ± 0.005 d51.48
Gannong2Control0.063 ± 0.001 b0.137 ± 0.001 a0.200 ± 0.001 c0.460 ± 0.006 fghi100
Pi0.25 mM0.067 ± 0.001 b0.135 ± 0.001 a0.202 ± 0.0006 c0.496 ± 0.012 fg101.00
No-P0.024 ± 0.001 fg0.044 ± 0.001 cd0.068 ± 0.001 g0.545 ± 0.031 ef34.00
Phi0.25 mM0.016 ± 0.0006 fg0.052 ± 0.001 c0.078 ± 0.001 g0.500 ± 0.032 efg18.00
Phi0.5 mM 0.008 ± 0.001 h 0.022 ± 0.003 d0.039 ± 0.003 h0.350 ± 0.052 ijk19.50
Data indicate the mean ± SD of 3 biological replications and were tested for significance using Duncan’s multiple range tests. Individual columns marked with different lowercase letters indicate significant differences (p < 0.01). * The BTI was not subjected to an analysis of variance.
Table 2. Correlation matrix describing the relationship between root morphological characteristics, fresh biomass and activities of antioxidant enzymes, MDA, H2O2 and proline in potato plants under Phi stress at 20 days after treatments.
IndexTRLRPARSARVNRTNRFFRWFSWTPW
MDA−0.87 **−0.77 **−0.81 **−0.74 **−0.78 **−0.78 **−0.67 *−0.75 **−0.84 **
H2O2−0.94 **−0.90 **−0.92 **−0.86 **−0.90 **−0.91 **−0.75 **−0.79 **−0.92 **
CAT−0.80 **−0.71 **−0.74 **−0.68 **−0.70 **−0.70 **−0.62 *−0.74 **−0.81 **
SOD−0.83 **−0.71 **−0.75 **−0.71 **−0.71 **−0.73 **−0.69 *−0.72 **−0.78 **
POD−0.87 **−0.77 **−0.82 **−0.75 **−0.77 **−0.80 **−0.69 *−0.76 **−0.85 **
Pro−0.89 **−0.80 **−0.84 **−0.77 **−0.80 **−0.82 **−0.72 **−0.81 **−0.89 **
MDA = Malonaldehyde; H2O2 = Hydrogen peroxide; CAT = Catalase; SOD = Superoxide dismutase; POD = Peroxidase; Pro = Proline; TRL = Total root length; RPA = Root projected area; RSA = Root surface area; RV = root volume; NRT = Number of root tips; NRF = Number of root forks; FRW = Fresh root weight; FSW = Fresh shoot weight and TPW = Total plant weight. * = significant difference at 5% probability level; ** = significant difference at 1% probability level.
Table 3. Principal Component, loadings related to Phi treatments variable and explained variance for final sampling.
Principal ComponentPC 1PC 2
Total root length0.3230.098
Root projected area0.2840.234
Root surface area0.2900.235
Root volume0.2600.224
Number of root tips0.2590.266
Number of root forks0.2700.279
Fresh root weight0.2980.044
Fresh root/shoot ratio0.2950.095
Malonaldehyde−0.2320.353
Hydrogen peroxide−0.3190.044
Catalase−0.1620.409
Superoxide dismutase−0.2290.374
Peroxidases−0.2380.348
Proline−0.2450.339
Eigenvalue8.8183.805
Contribution rate % 62.9827.18
Cumulative contribution rate % 62.9890.16
Table 4. Comprehensive index (C1), index weight µ(X), and comprehensive evaluation (D) of five potato genotypes under Phi and No-P stresses.
GenotypeTreatmentCI(1)CI(2)µ(X1)µ(X2)Comprehensive
Assessment Value (D)
Ranking
Qingshu9No-P2.394−1.9400.6390.2350.517
Phi 0.25−1.2520.6480.2770.5970.373
Phi 0.5−2.0790.6890.1950.6030.3183
Longshu6No-P0.832−3.5310.4840.0130.342
Phi 0.25−3.567−0.6220.0470.4190.159
Phi 0.5−3.1720.1690.0860.5390.2204
Longshu3No-P6.034−0.2661.0000.4690.849
Phi 0.250.4741.2280.4480.6780.517
Phi 0.5−1.3841.5390.2640.7210.4022
AtlanticNo-P5.160−0.2130.9130.4770.782
Phi 0.252.6493.5360.6631.0000.765
Phi 0.50.5893.0880.4690.9370.6041
Gannong2No-P0.249−3.6270.4260.0000.297
Phi 0.25−2.876−0.5820.1160.4250.209
Phi 0.5−4.043−0.1170.0000.4990.1485
Weight 0.6990.301
Publisher’s Note: MDPI stays neutral with regard to jurisdictional claims in published maps and institutional affiliations.

