1. Introduction
The changes and disturbances in the landscapes of Brazil have increased in the last two decades due to economic progress and modifications in environmental laws, such as the Brazilian Forest Code [
1]. Such changes reduced the restrictions on environmental preservation and legalized the areas that were already deforested and destined for agricultural production. Additionally, new urban settlements, pasture, and agricultural regions brought some additional pressure to forest remnants. Consequently, deforestation and degradation have been observed, resulting in a substantial loss of biodiversity and impacts on climate change [
2].
After the Amazon biome, the Brazilian Savanna (
Cerrado) and the Atlantic Forest are the regions that endure the most anthropic impacts in Brazil. The
Cerrado is the second largest biome in South America, covering about 22% of the national territory (2,036,448 km
2). On the other hand, only 12.4% of the original Atlantic Forest remains, cover 15% of the national territory. Interestingly, it contains 72% of the Brazilian population and 70% of the national gross domestic product (GDP) [
1,
2].
The landscapes are usually studied as spatial units whose heterogeneity is mainly modified by the interaction between nature and society. Thus, it is characterized by the connection or fragmentation among its different elements. Nevertheless, anthropic actions can affect and modify most landscapes, causing impacts such as deforestation, fragmentation, and loss of biodiversity. The resulting mosaic is a blend of natural and anthropogenic features that differ in size, shape, and structure [
3,
4,
5,
6].
Planning and decision-making involve choosing a course of action among several alternatives. They are based on the quantification of environmental conditions, such as land use and land cover, conservation status, and resilience of the landscape [
7,
8]. More recently, landscape indicators have been used to provide insights into conservation practices. The demand for results on small timescales has led scientists to search for measures calculated based on accessible indicators in order to serve as a basis for decision-making, meanwhile trying to encompass some of the most important ecosystems on Earth [
7,
8].
Authors such as Turner [
9], O’Neill et al. [
10], Gustafsson and Parker [
11], Mcgarigal and Marks [
12], Schumaker [
13], Moretti [
14], and Trevisan et al. [
15] studied and developed a variety of indices and descriptive measures to analyse spatial landscape patterns. Thus, modelling is considered to be an established method for obtaining information and generating hypotheses in landscape ecology and population issues [
9,
10,
11,
12,
13,
14,
15].
From this perspective, geographical information systems (GIS) and remote sensing have facilitated the characterization process of diagnostic analyses and activities. Additionally, they help simulate geographic space and natural processes, besides integrating spatial information [
16]. The efficiency of satellite imagery for monitoring land use and land cover changes and the consequent impact of anthropic activities on the environment contribute to governmental planning and action regarding the conservation of natural ecosystems [
17].
An example is the work developed by Menezes and Salgado [
18], whose objective was to identify the land use and the landscape configuration of the Ceroula Environmental Protection Area in the Angico Sub-basin, MS, Brazil. In such study, remote sensing imagery and field measurements were integrated into a GIS. The ground measurements, digital image processing, and geoprocessing techniques used revealed that the area is predominantly used for agriculture. However, the authors also reported that several areas are degraded and deforested.
Aiming to monitor land use and land cover, as well as other environmental applications, the European Space Agency (ESA) created in 2012 the Copernicus Program, an European system coordinated and managed by the European Commission for monitoring the Earth. In this context, the ESA has been currently developing a new family of missions called Sentinels, designed specifically to meet the Copernicus program’s operational needs. Each Sentinel mission is based on two satellite constellations to fulfil the coverage requirements, providing robust datasets for Copernicus Services [
19].
The Sentinel-2 mission captures optical images at a high spatial resolution (from 10 m to 60 m) over both land and coastal waters. Twin satellites, the Sentinel-2A and the Sentinel-2B, support a range of applications and services, such as Earth monitoring and observation applications [
19].
In this setting, the watershed analysis approach is of fundamental importance for being the central unit of the landscape. Additionally, water management is more efficient when a watershed is considered. In this sense, policy initiatives and the monitoring of environmental resources are also feasible for managers and decision-makers, assuring biodiversity maintenance. Forest coverage is usually restricted to small and fragmented forest remnants where several species are still found. However, these endemic species are facing a high degree of environmental degradation. Myers identified this issue in 1988 as biodiversity hotspots, whose regions have a more urgent need of conservation actions and the constant monitoring of anthropic impacts [
8,
20].
Particularly in Brazil, river basin committees were established to manage regional planning in several watersheds. They contribute to the environmental and socio-economic management plan of the watersheds and define sustainable water usage and policy rules. Interestingly, planning is predominantly done locally, that is, despite following both the state and federal legislation each municipality or county acts locally. Nonetheless, this organization is insufficient to solve and cover all the regional administrative obstacles in many cases, especially when the focus of the management is on the conservation and preservation of natural resources [
21].
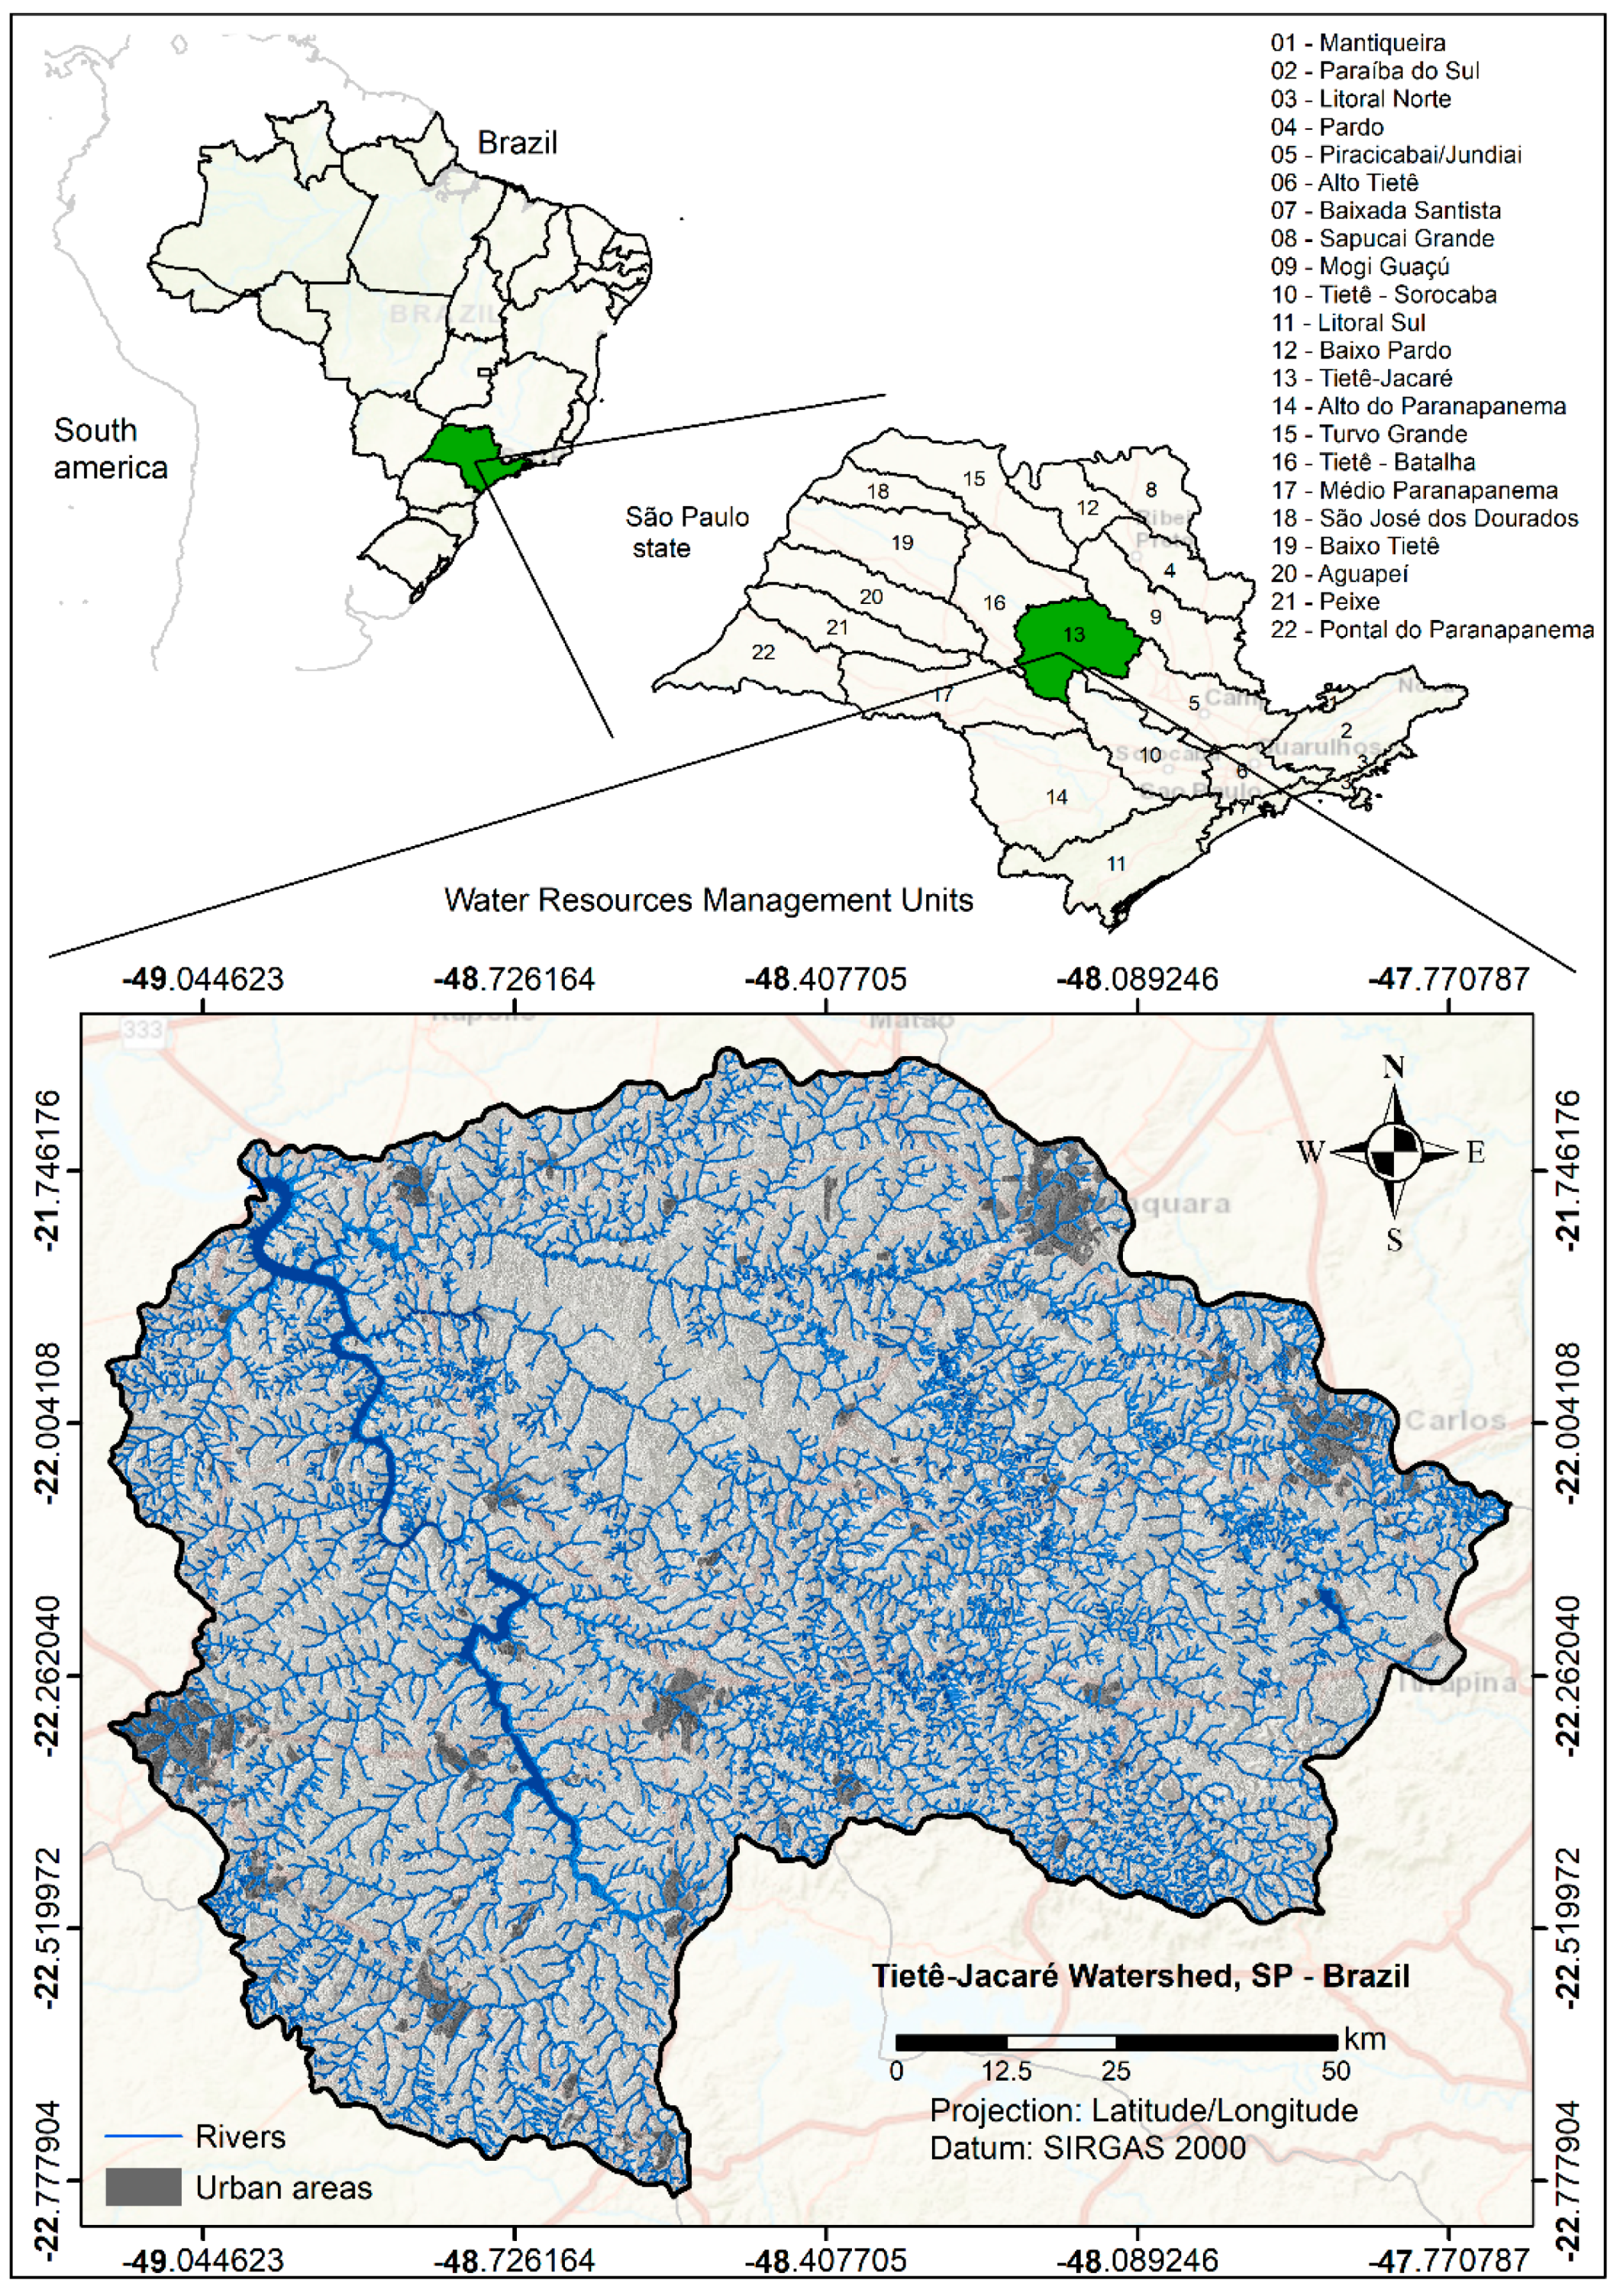
In the Tietê–Jacaré Watershed, an intense modification and an increase in agricultural activities have been identified over the past 30 years, which occur without environmental planning. Therefore, further studies are still necessary to understand the impacts of anthropic activities on a watershed scale and how they modify the landscape structure [
22,
23,
24]. This concept is also important when facing pressure from society and the financial sector that aims at sustainability over economic growth.
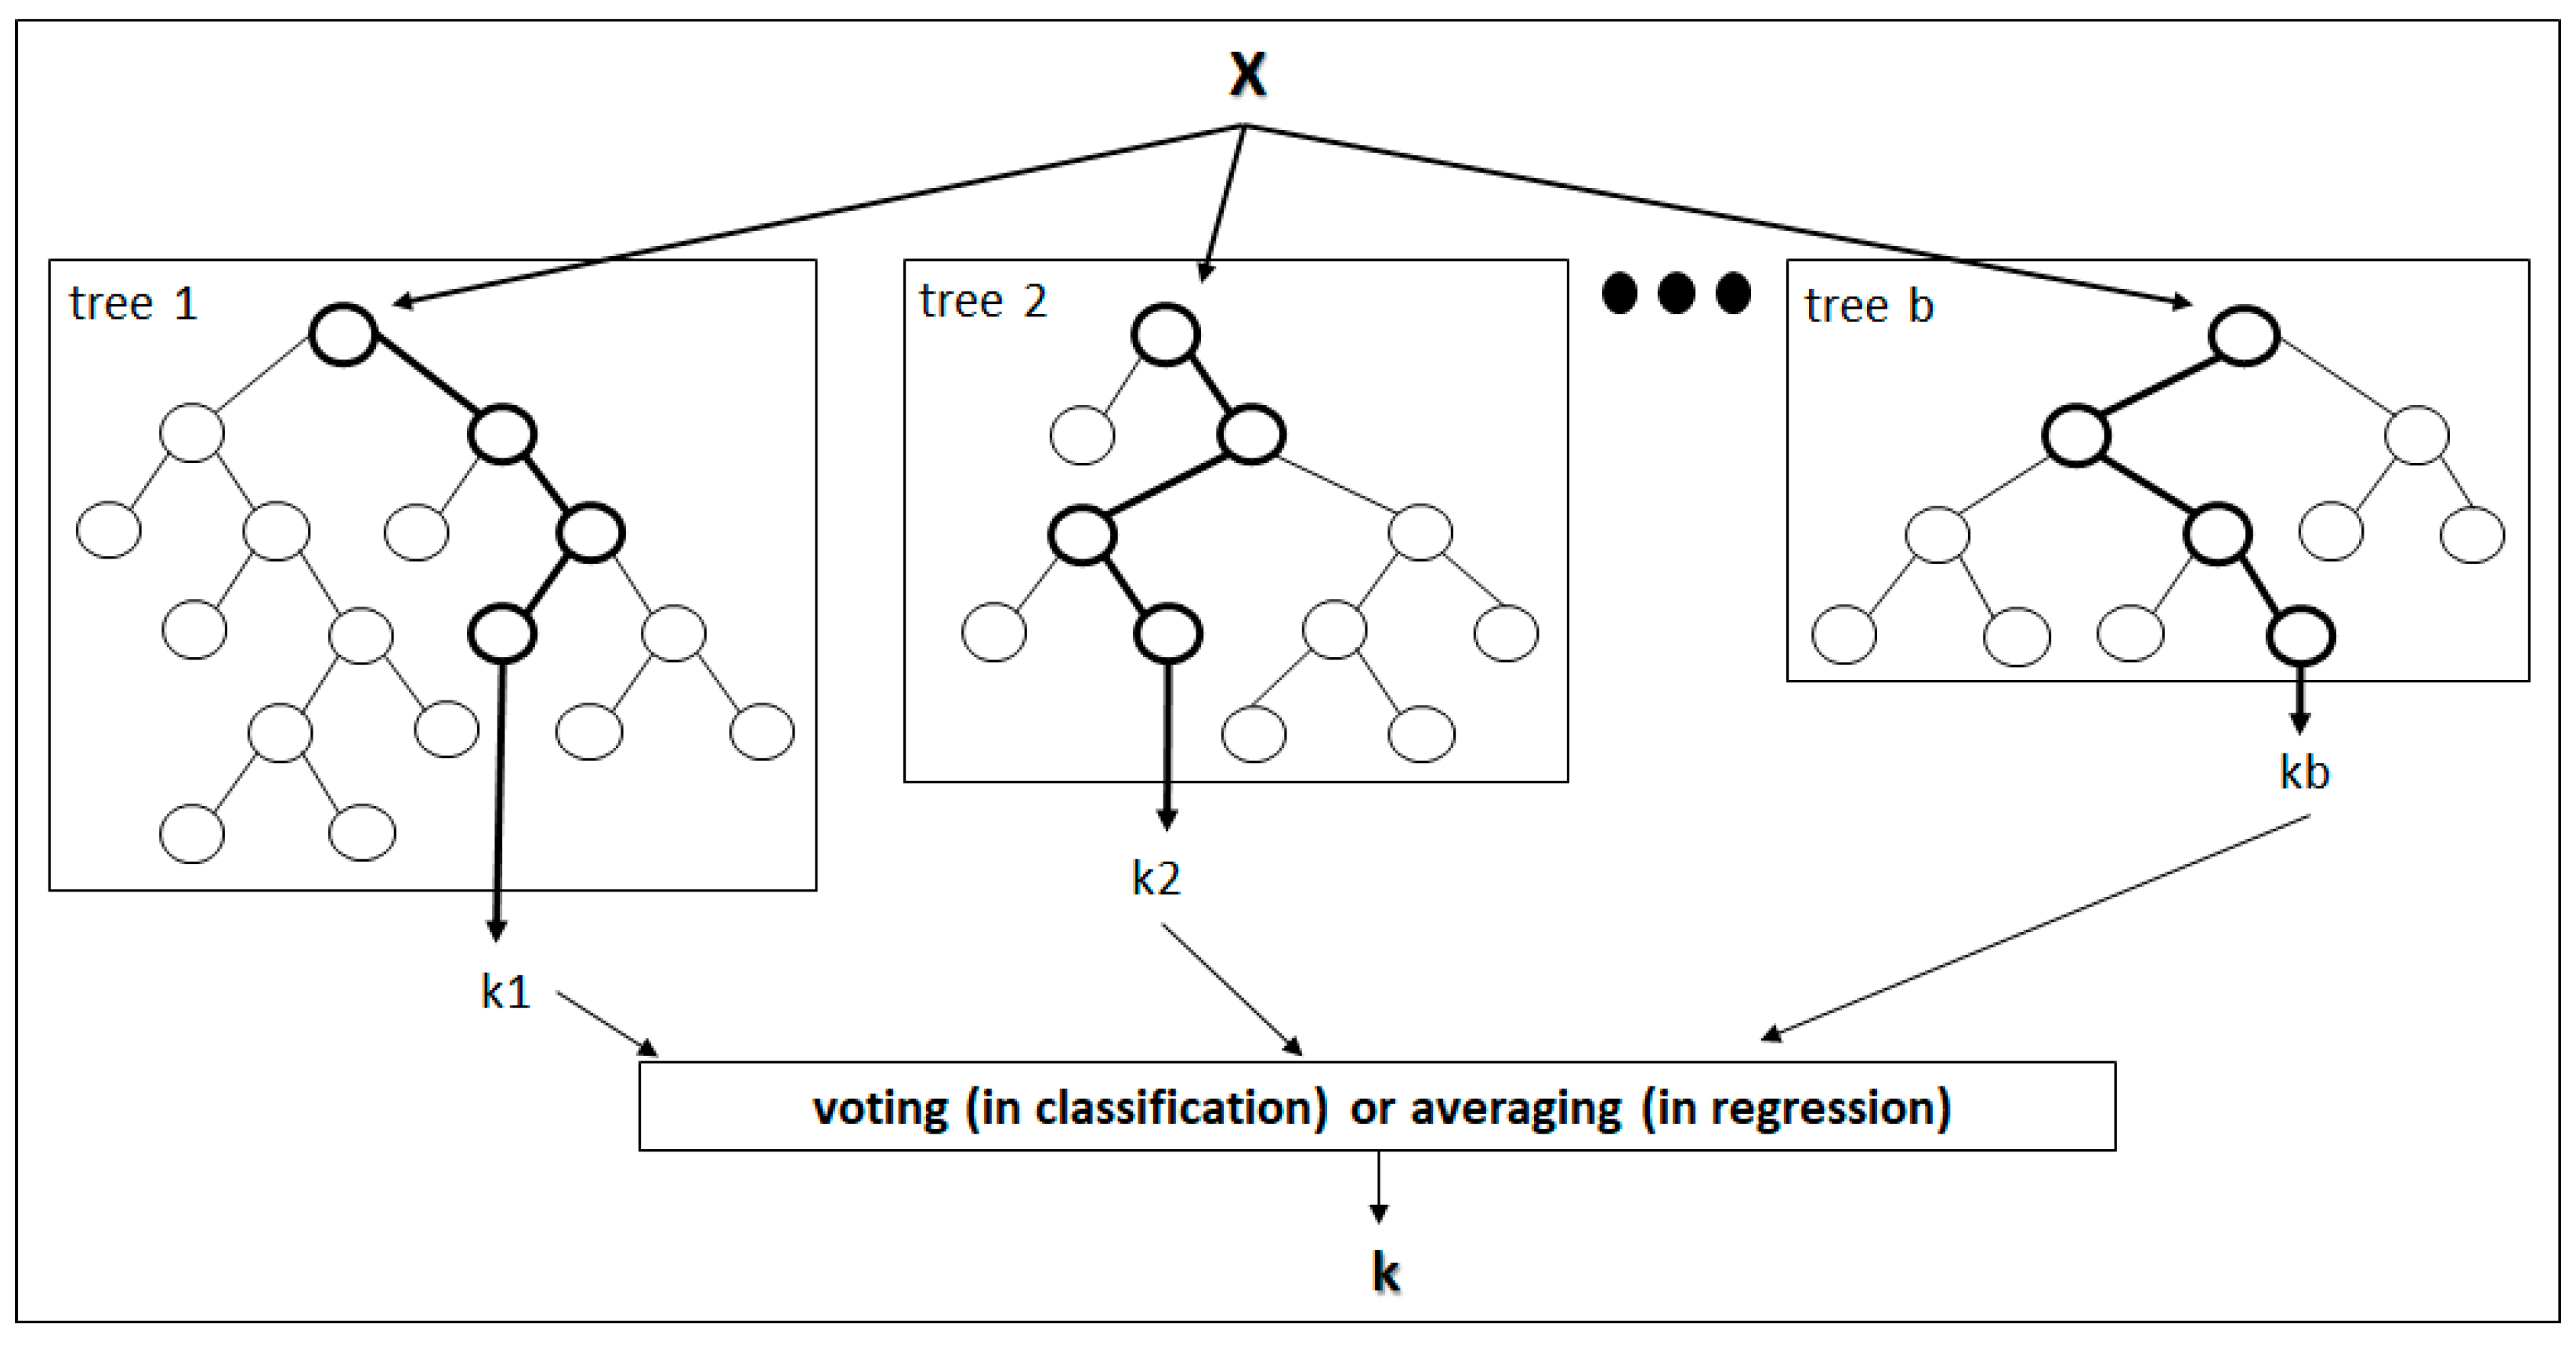
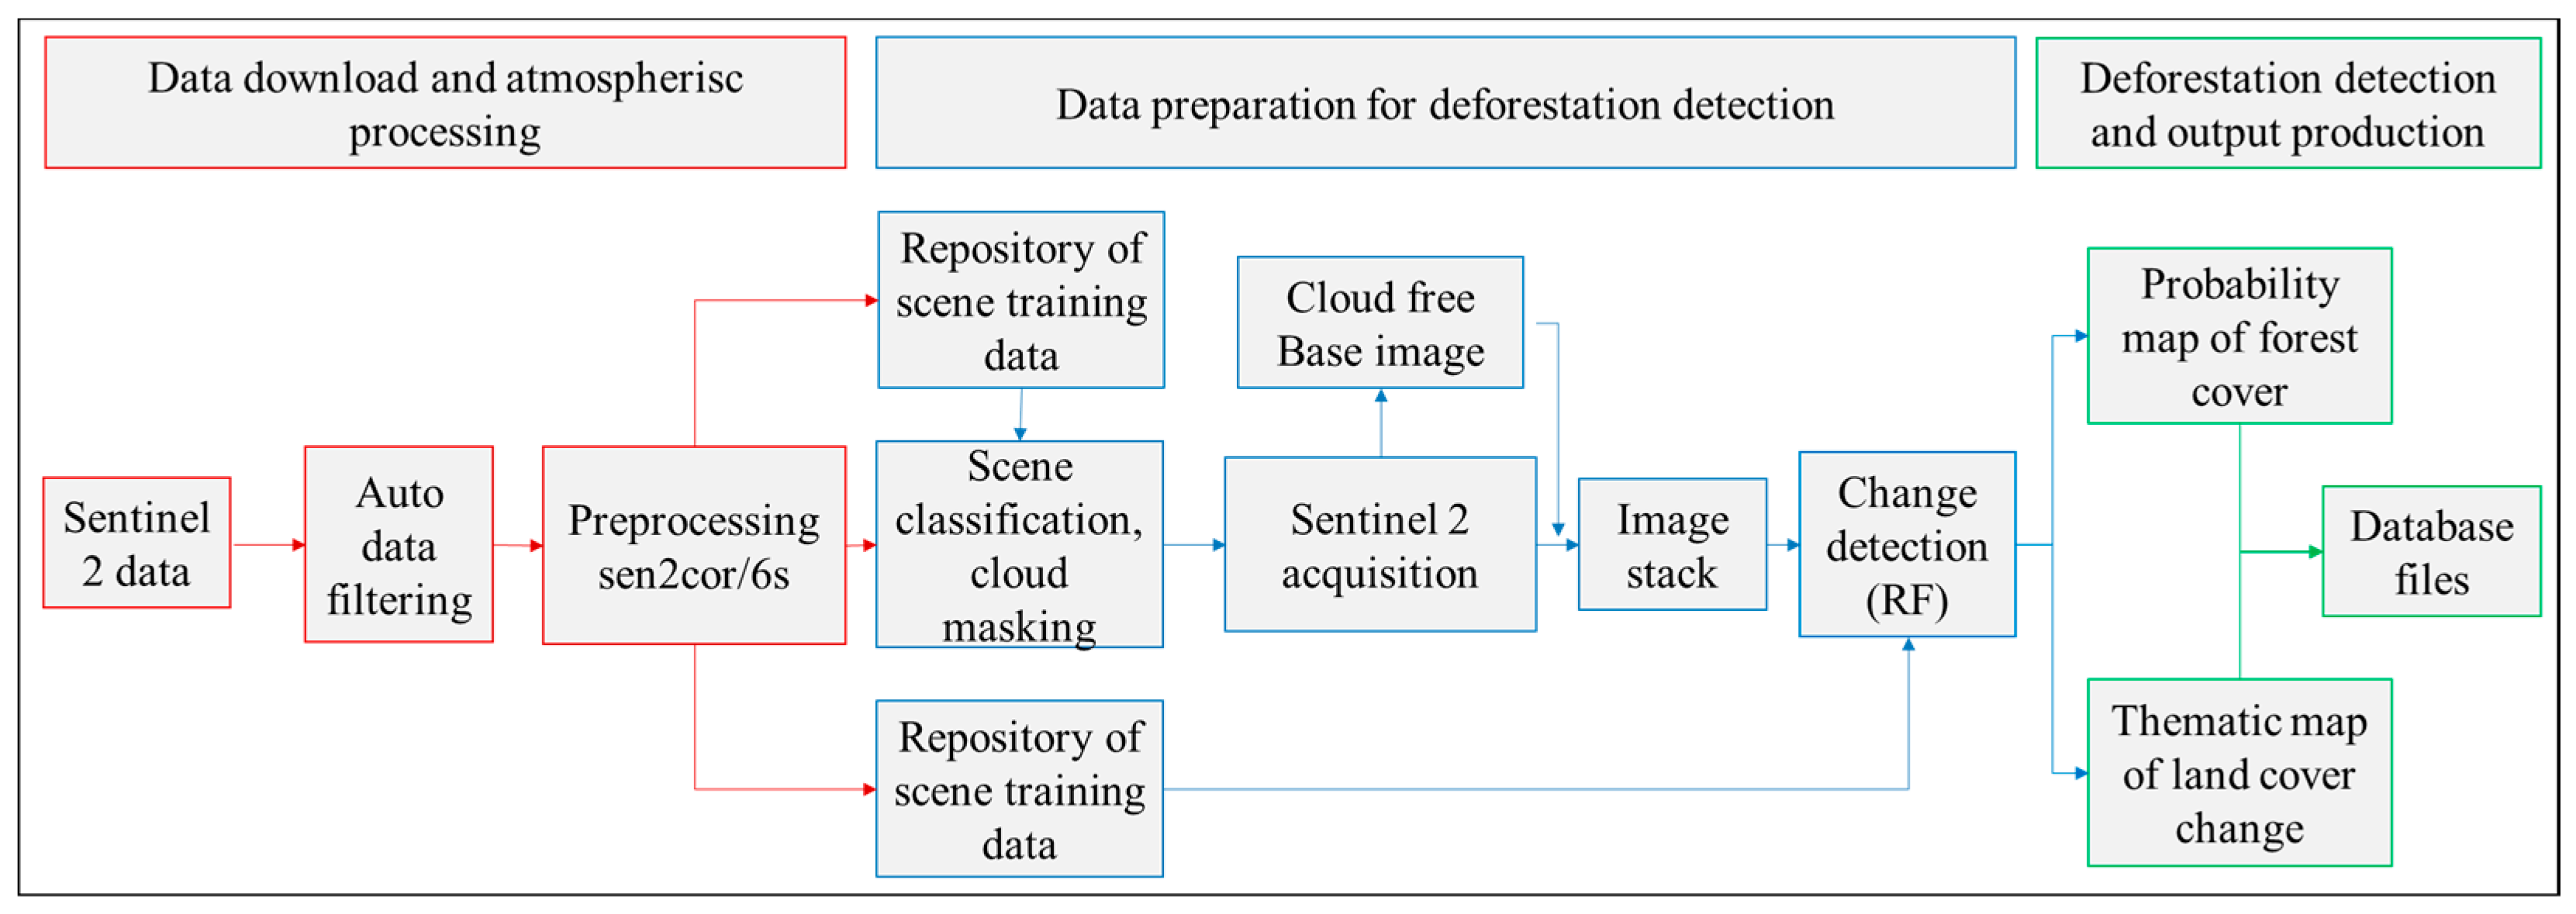
In this context, it is highly essential to conduct studies on the most efficient methods to accelerate analyses that evidence the loss of natural areas and environmental quality in the Brazilian and international contexts. To handle the large amount of data from optical imagery, machine learning such as the random forest (RF) approach is suggested for environmental studies at the watershed scale [
25,
26], as it is able to deal with many datasets [
24,
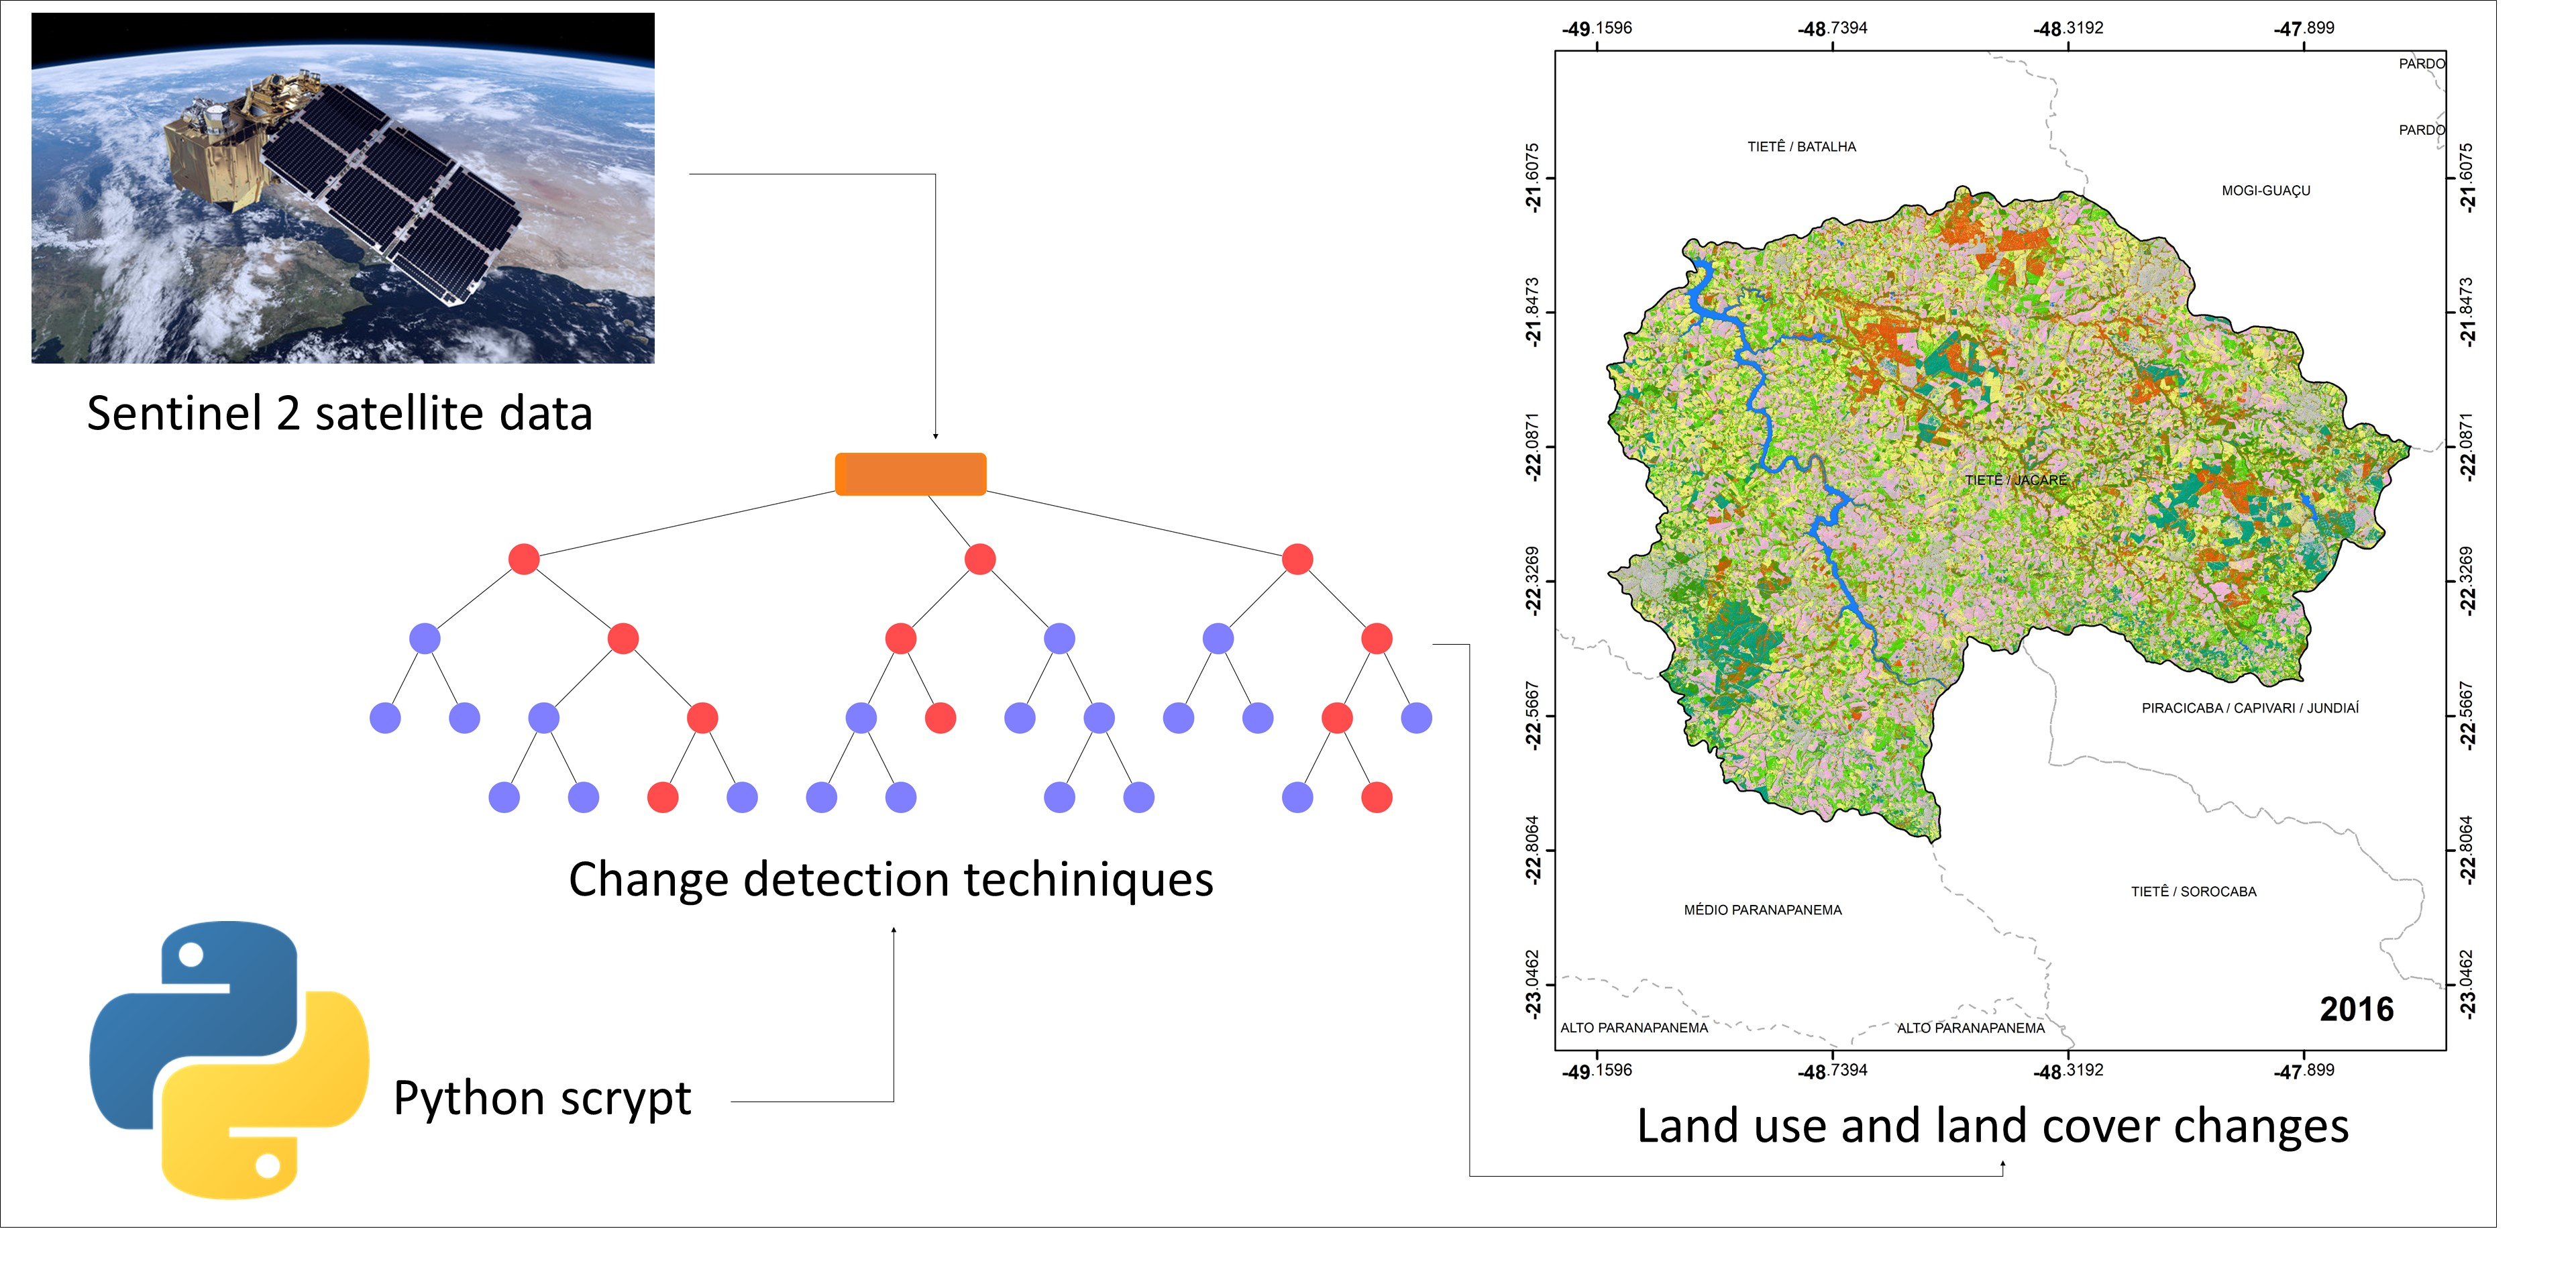
25,
26]. This study aimed to analyse the land use and land cover changes in the Tietê–Jacaré Watershed (São Paulo state, Brazil) using the RF algorithm and Sentinel-2 satellite data from 2016 to 2018 to detect landscape changes.
3. Results
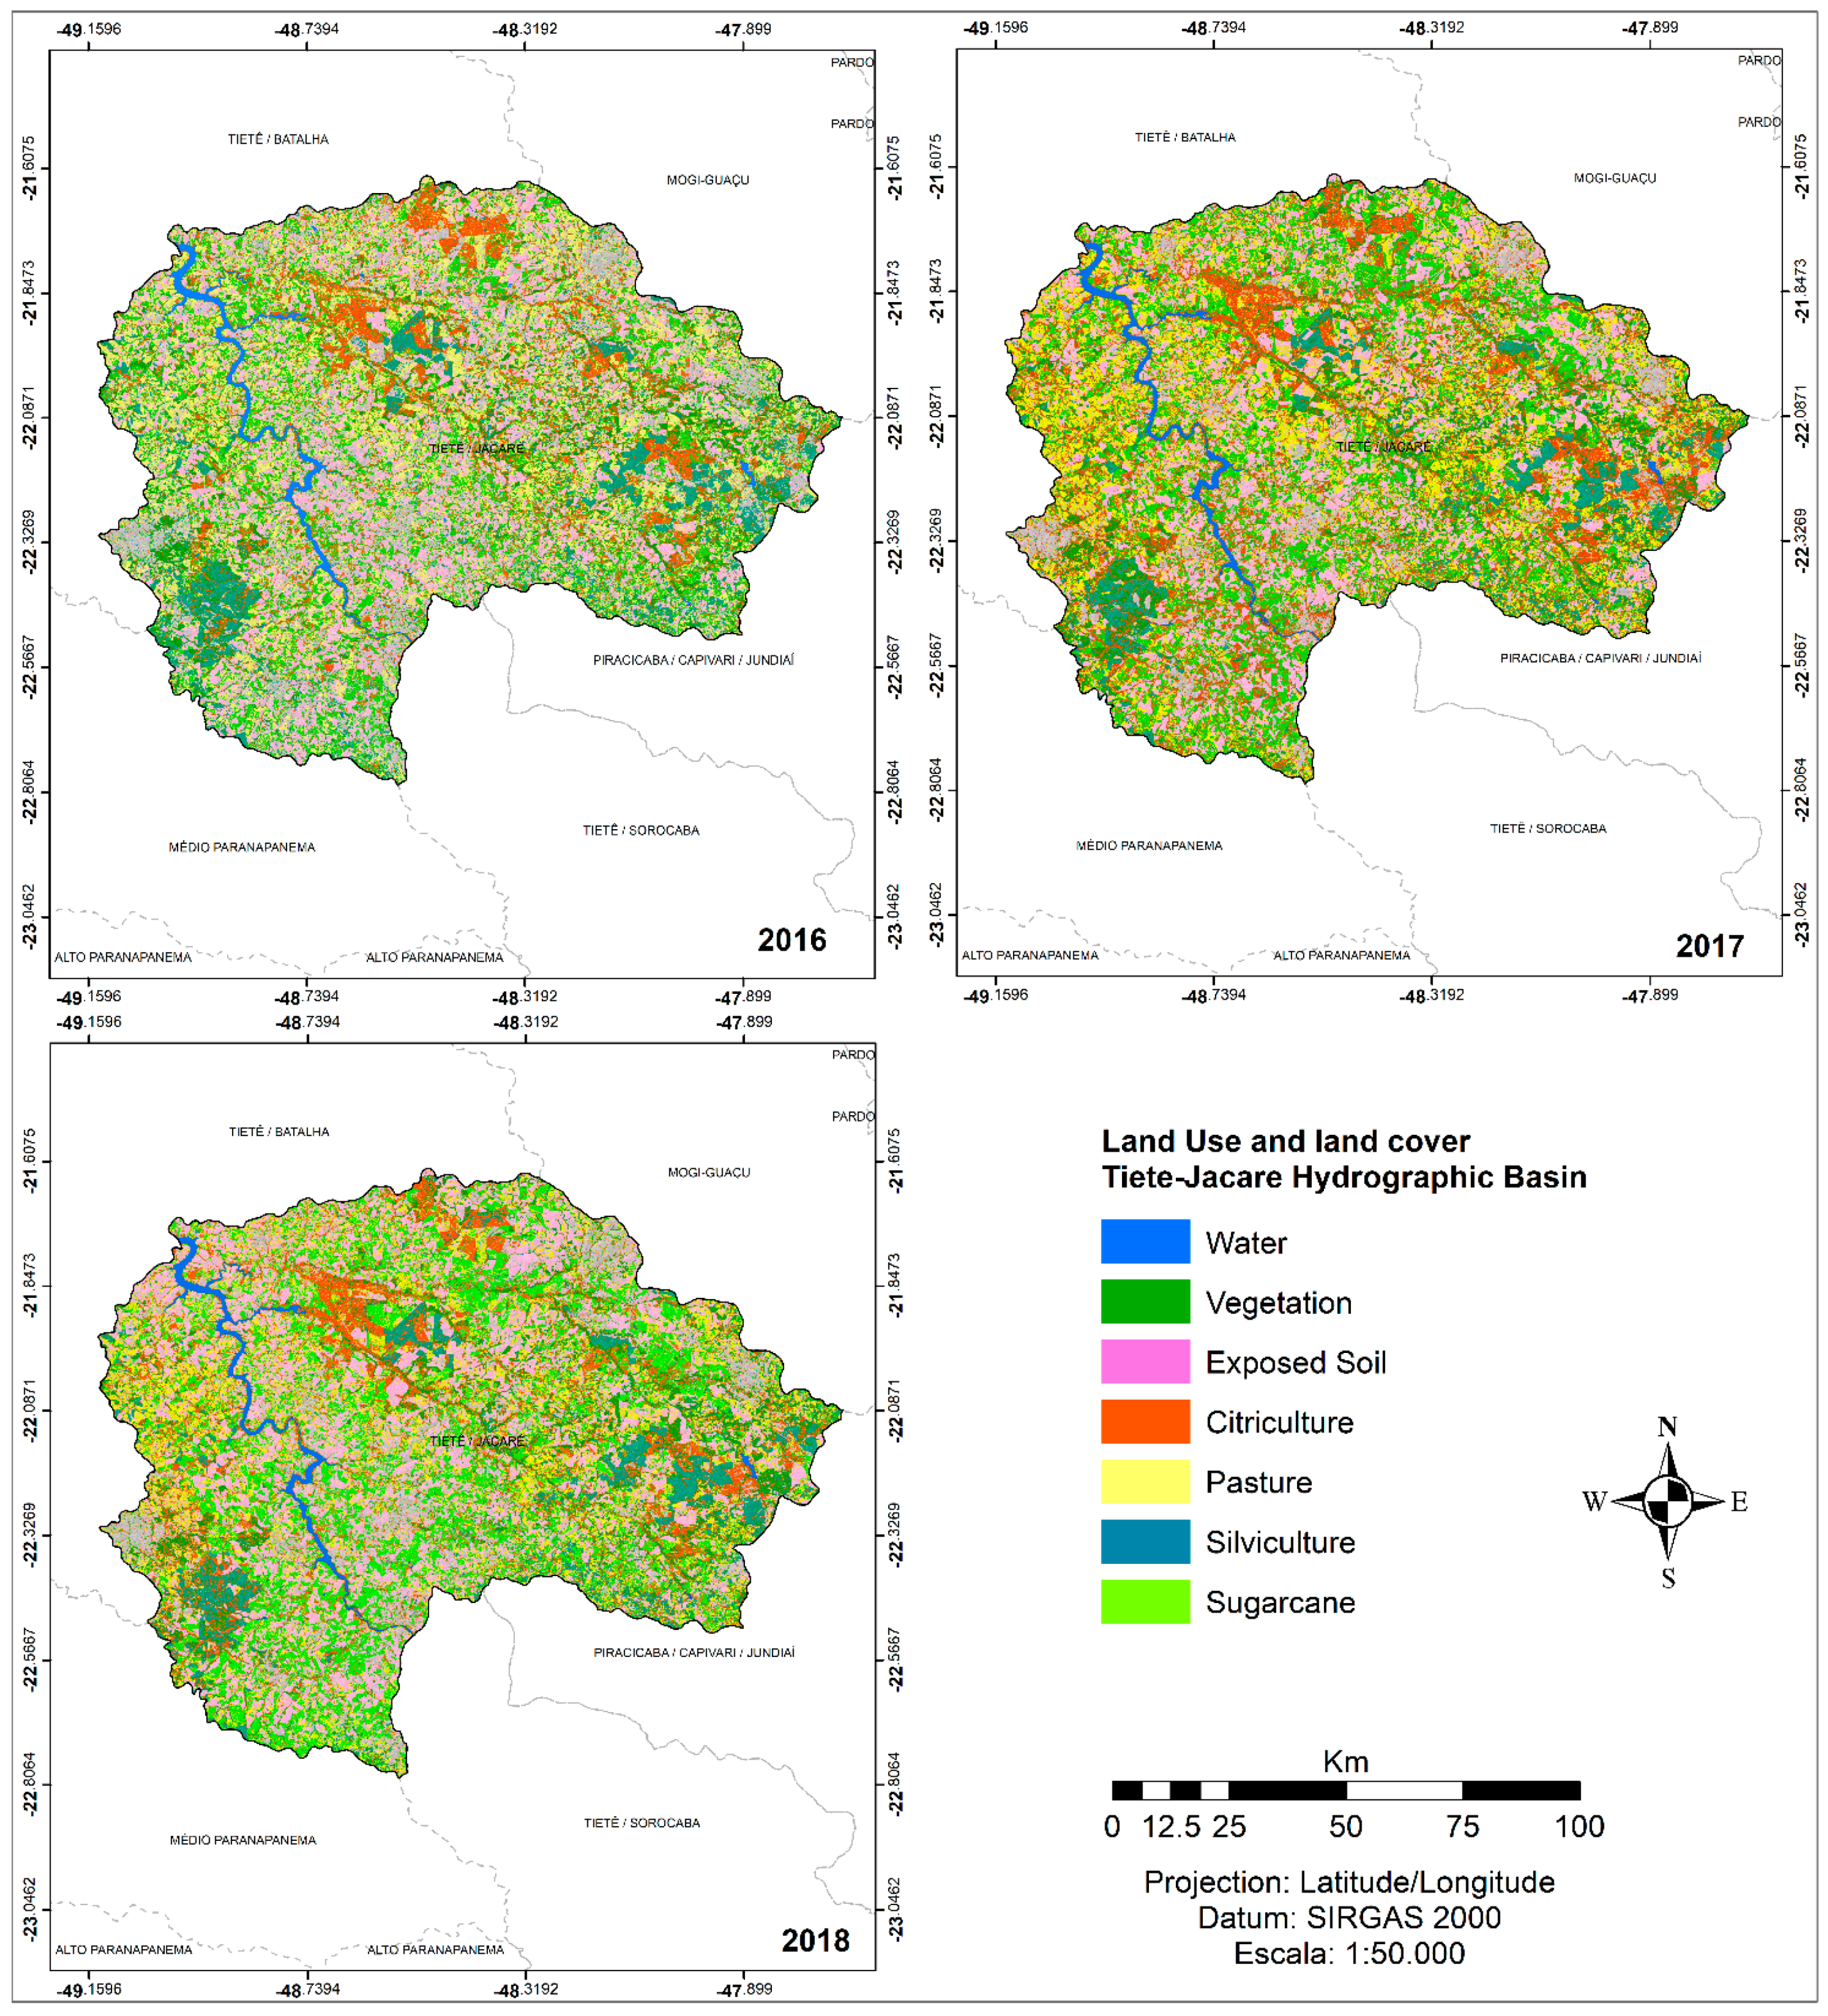
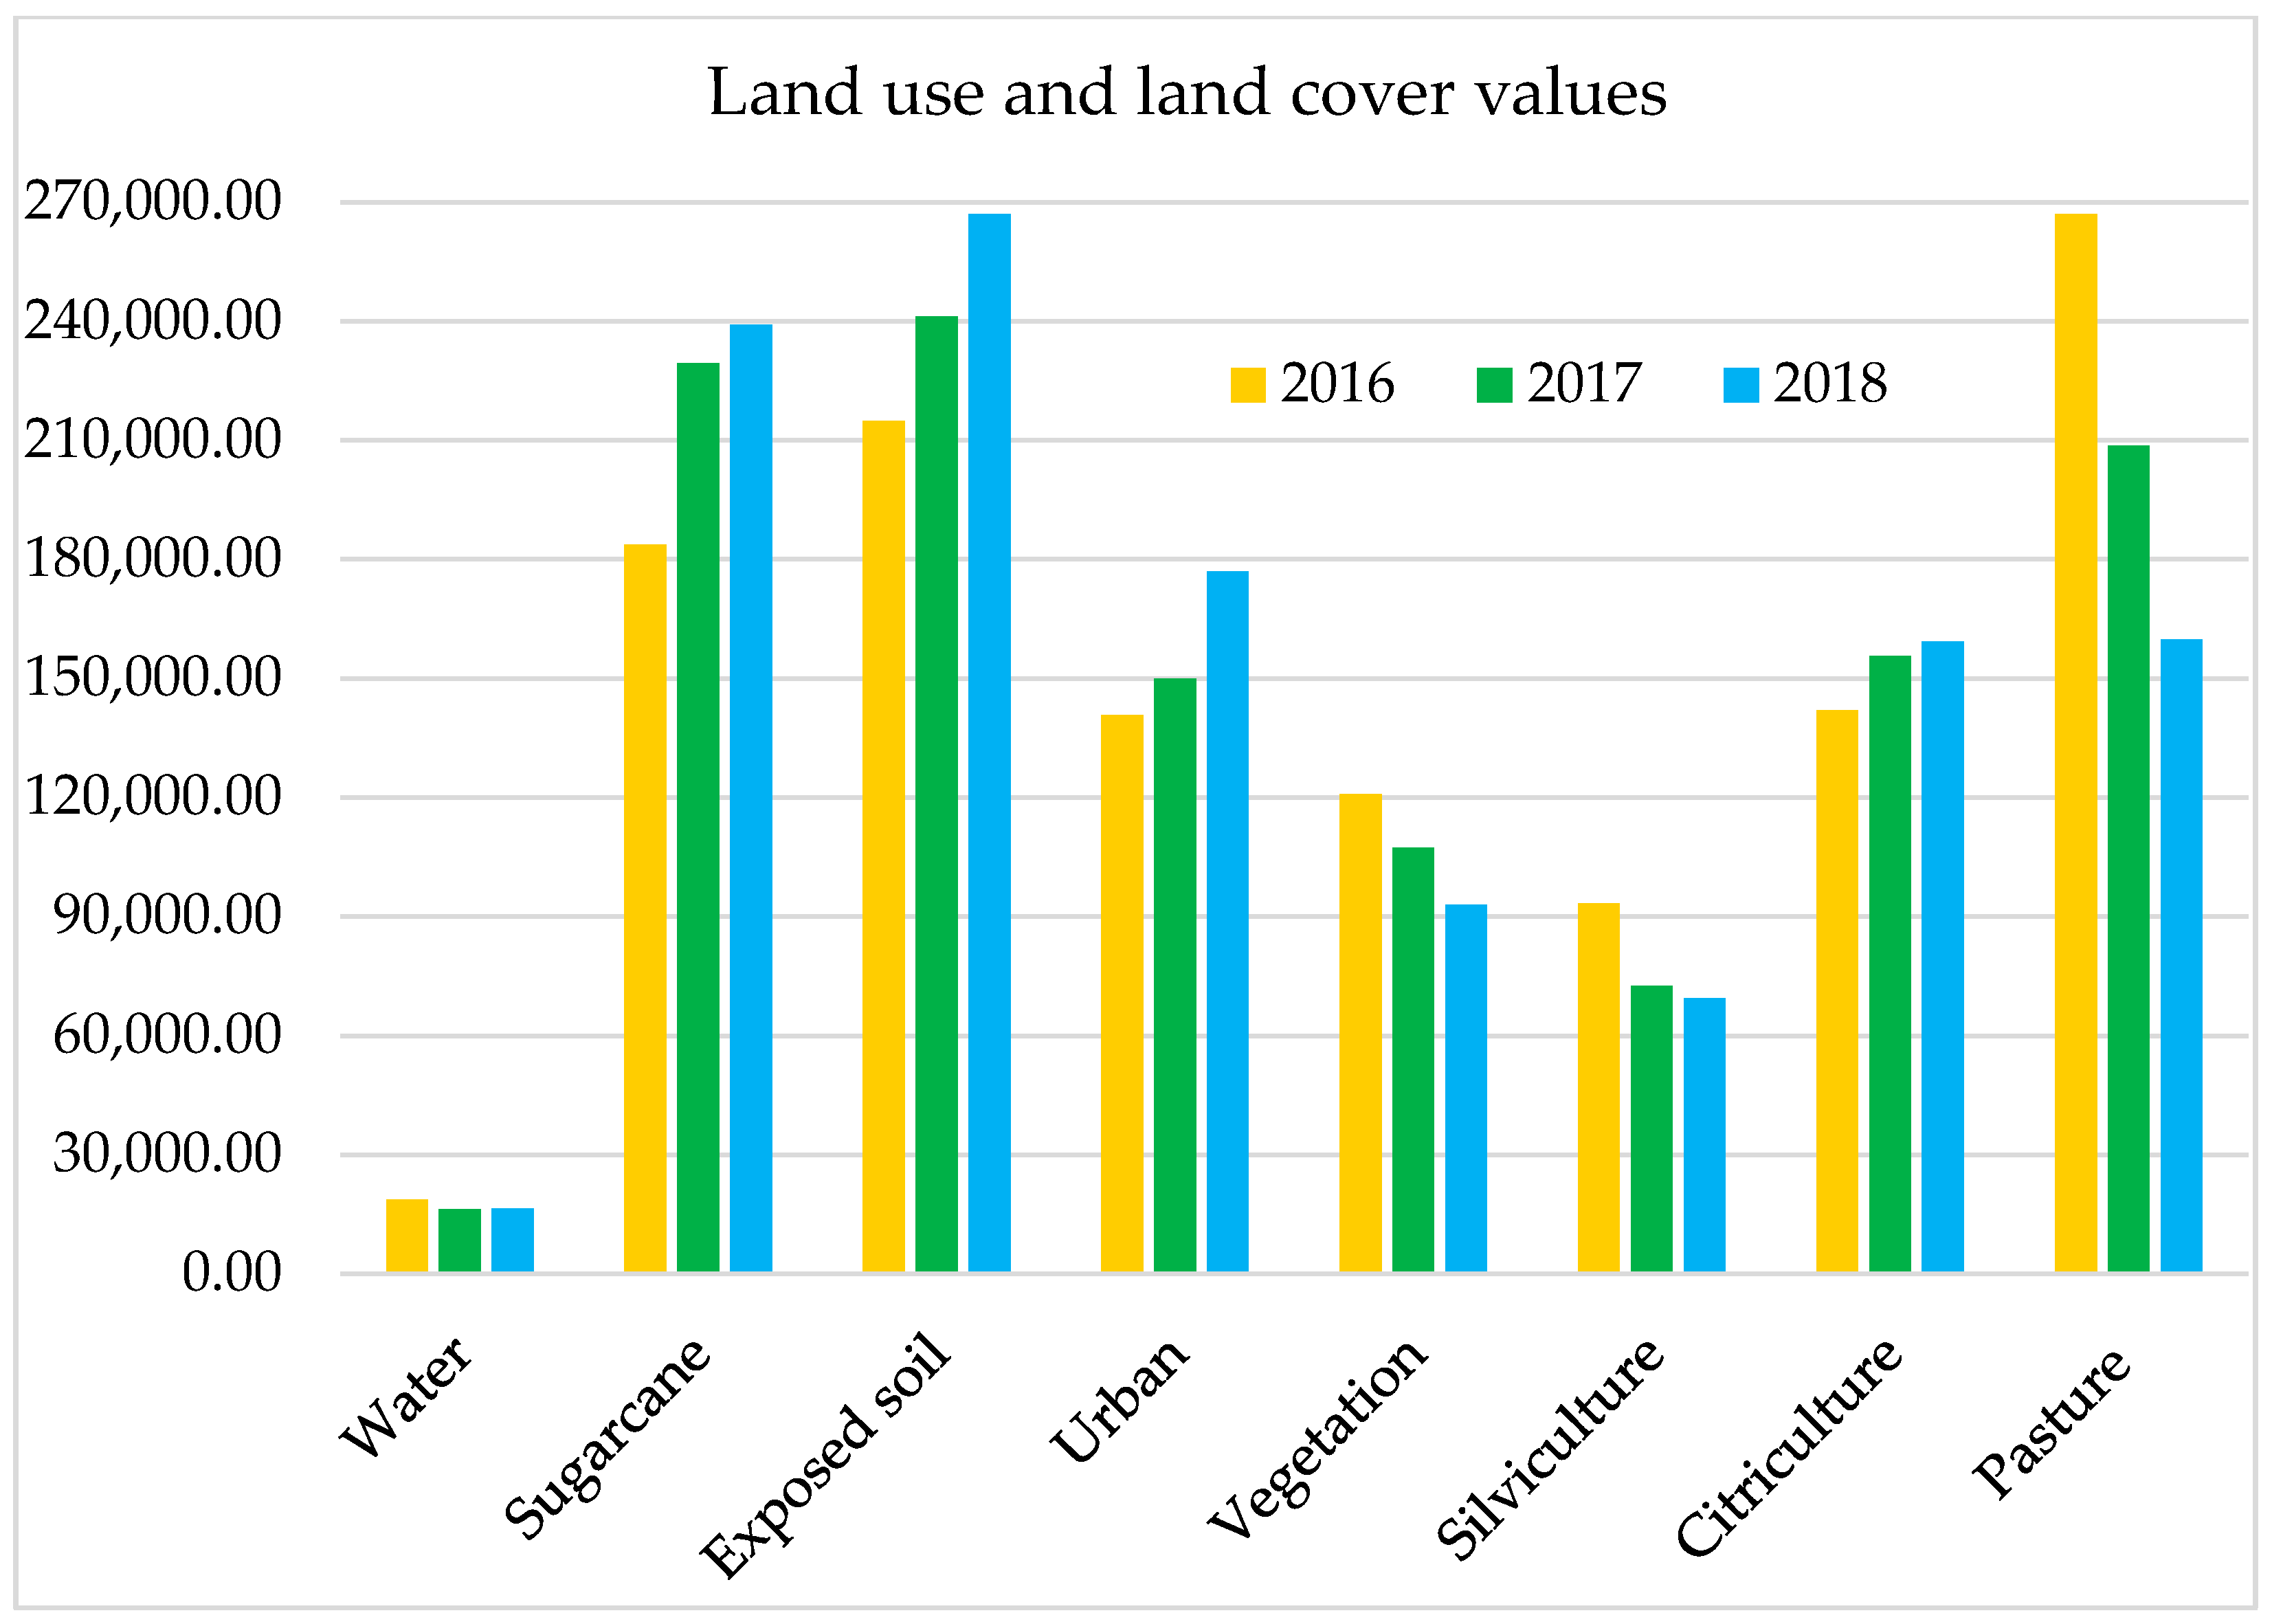
The one-year interval showed a predominance of agricultural activities, with 900,000 ha (76%) in 2018 being classified as exposed soil, citriculture, pasture, silviculture, sugar cane, urban area, vegetation, and water (
Figure 5 and
Appendix A). In 2016, 900,885 ha was occupied with agricultural activities (as opposed to 907,529 ha in 2017, and 894,719 ha in 2018), especially sugar cane (20%) activities, followed by exposed soil (22.62%), pasture (13.53), citriculture (13.58), and silviculture (5.83%) (
Figure 6 and
Table 3). The regions did not have significant changes during the analysed period; however, the small change observed could explain the consolidation state of the activities, as the regions in which agricultural activities occur are already predefined and delimited.
Because of the agricultural characteristics, in Brazil exposed soil areas are mainly associated with crops, as they refer to the fallow period and soil preparation for the next harvest. In the Tiete-Jacaré Watershed they follow the same traits, being these regions associated with sugar cane production. As the cattle economy decreased in the region over the past decades, pasture areas appear only in small territorial portions, becoming a subsistence or small-scale production activity.
The sugar cane areas are predominant in practically all municipalities of the watershed. However, in some regions other kinds of crops are prevalent, for example, citriculture and silviculture cultivations. The urban areas occupied 140,654 ha in 2016, 149,998.10 ha in 2017, and 177,015.20 ha in 2018, and this growth was more noticeable in medium to large municipalities, such as Bauru, Jaú, Araraquara, and São Carlos. Small municipalities such as Bocaina, Ibaté, and Itirapina retained their structures focused on activities related to the first and second sectors, with technical support from the larger municipalities.
The increase in the urban area reflects the urbanization process in the region, the state, and the country, which started in the 20th century as a result of the industrialization process and was considered one of the main factors for the population’s displacement from the rural to urban areas. This process also caused a change from an agrarian-exporting to urban-industrial model. Currently, more than 80% of the Brazilian population lives in urban areas, which is equivalent to the urbanization levels of developed countries. The vegetation areas occupied 120,795 ha in 2016, 107,237 ha in 2017, and 92,912 ha in 2018. These fragments are immersed in the agricultural matrix and are primarily associated with water bodies. This fact correlates with the reduction in the central water resources in the region, with a loss of 2431 ha. These natural fragments are located near the main rivers around the watershed: the Tietê–Jacaré River, in the Bariri, Itajú, Ibitinga, and Bocaina municipalities; the Jacaré–Guaçu River, in the São Carlos, Ribeirão Bonito, Ibaté, and Itirapina municipalities; the Jacaré–Pepira River, in the Dourado and Brotas municipalities; and the Jaú River, in the Jaú and Mineiros do Tietê municipalities.
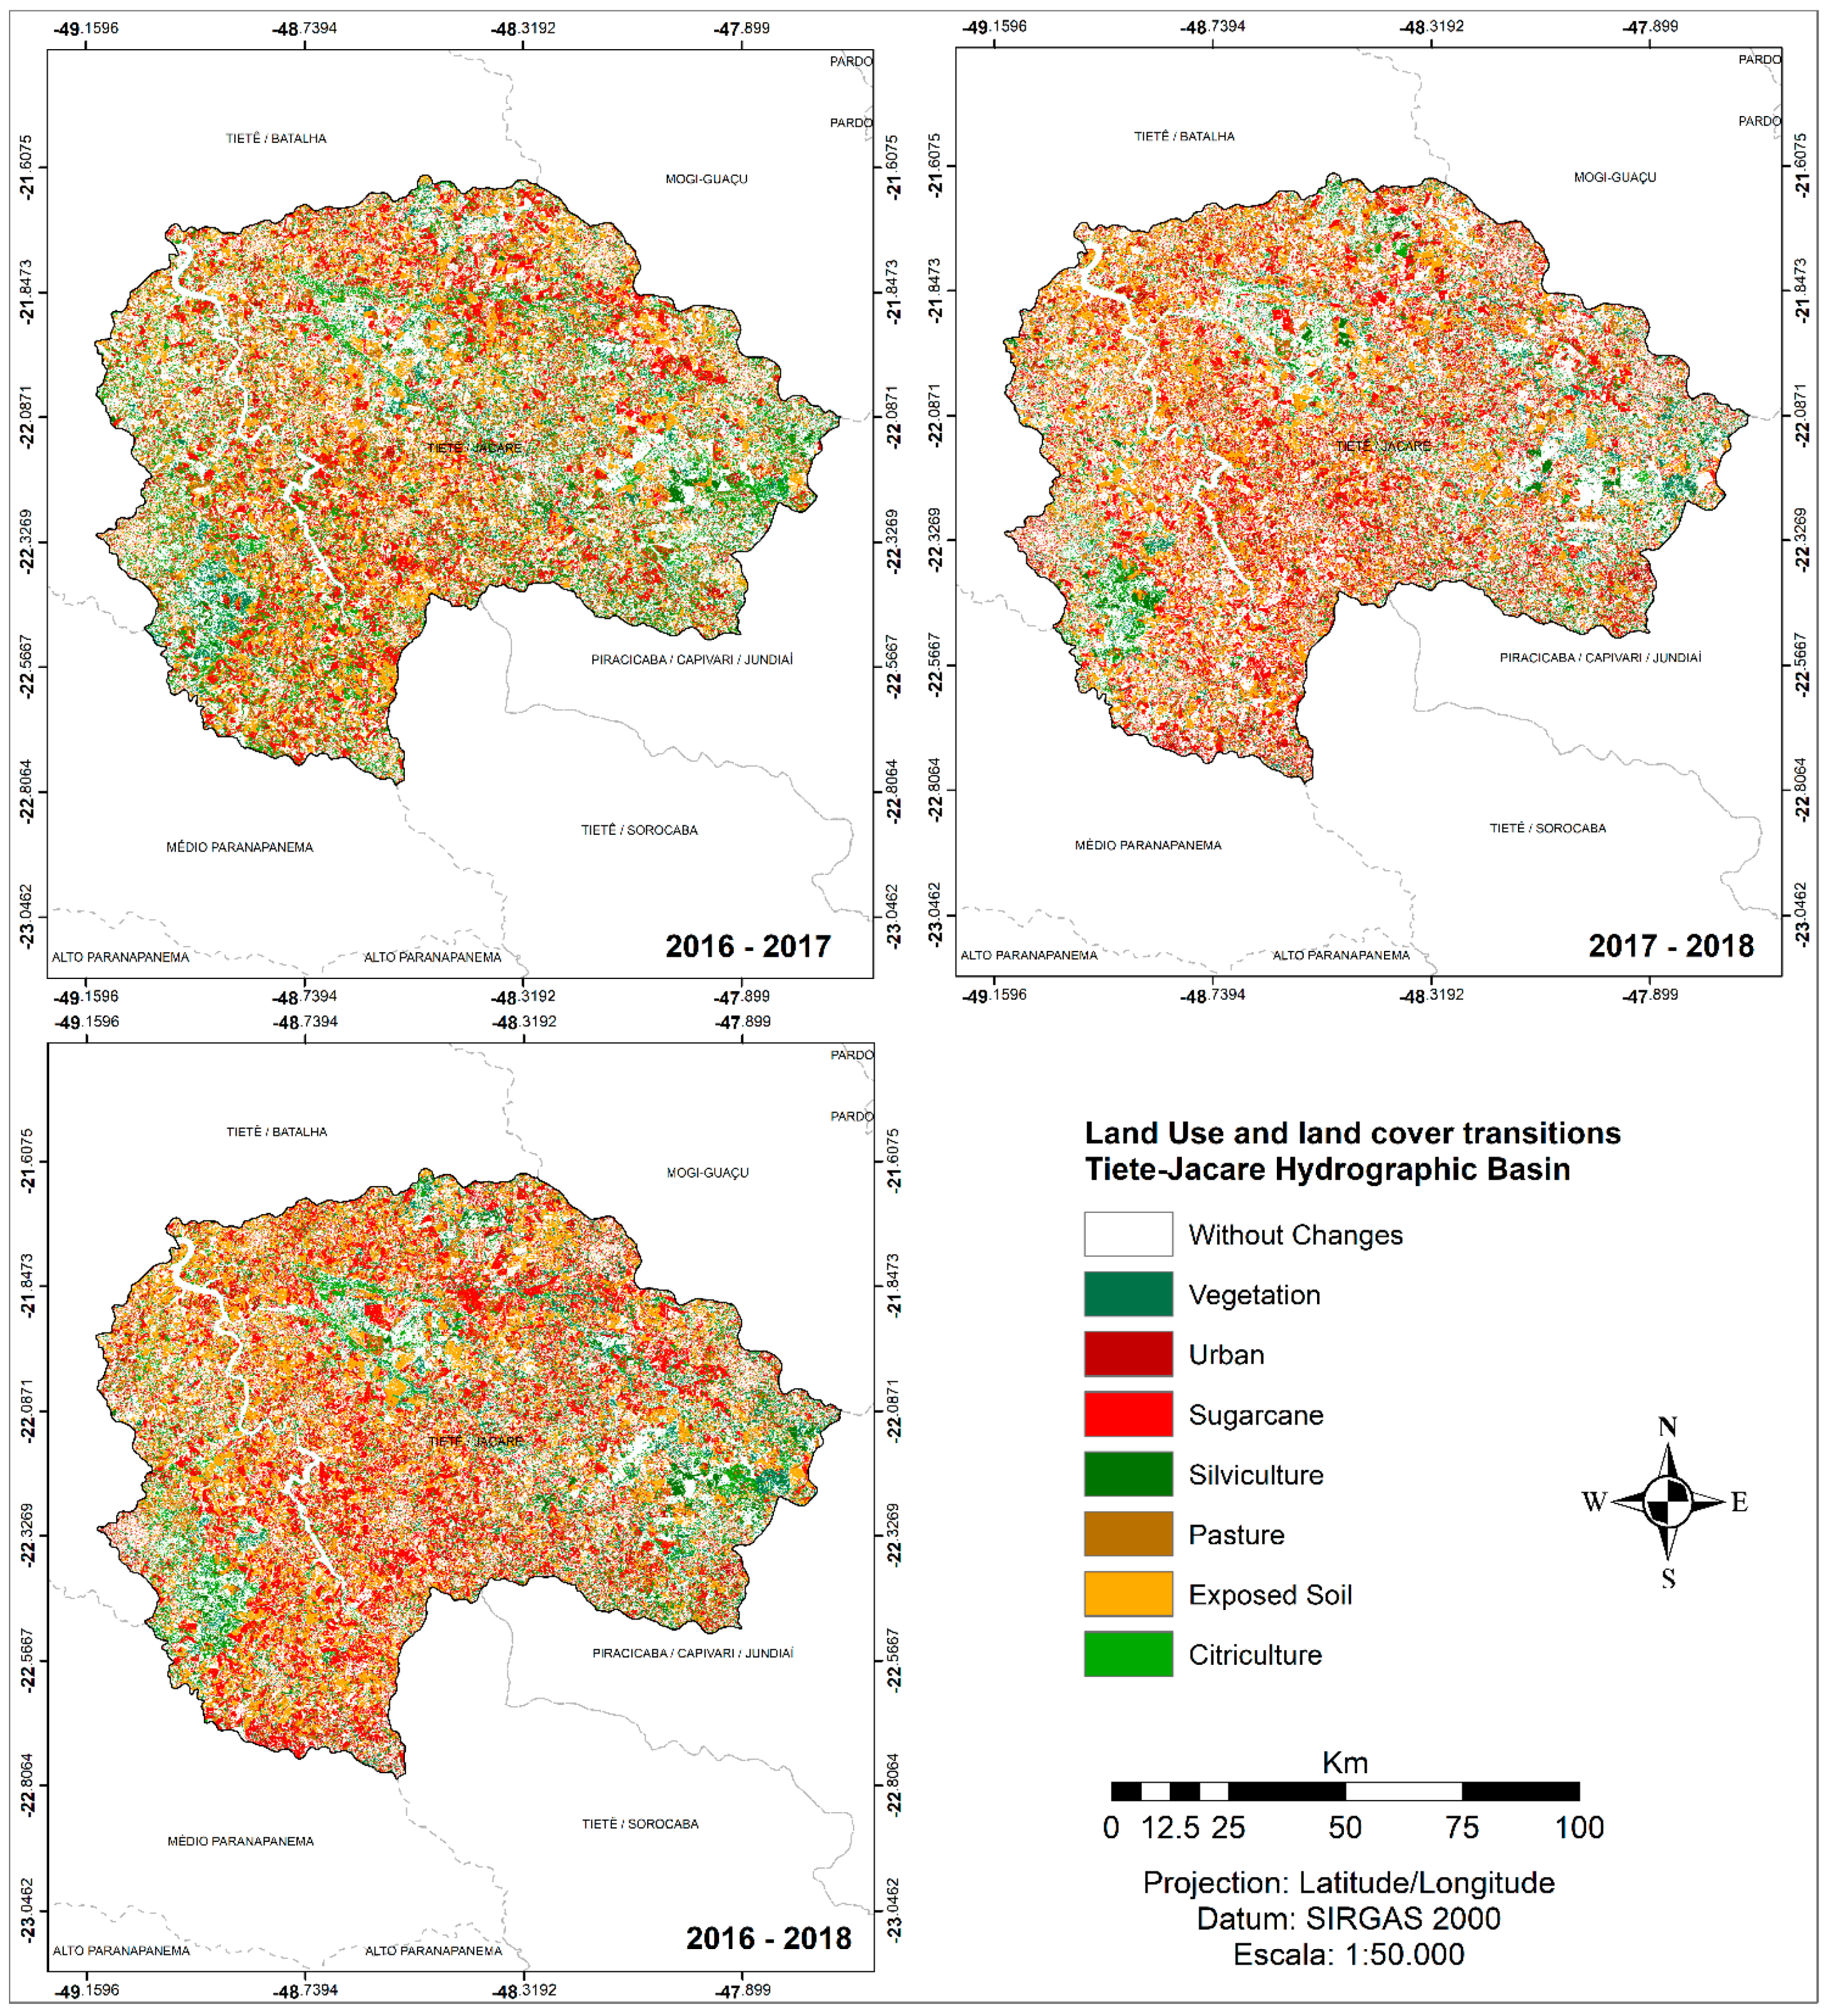
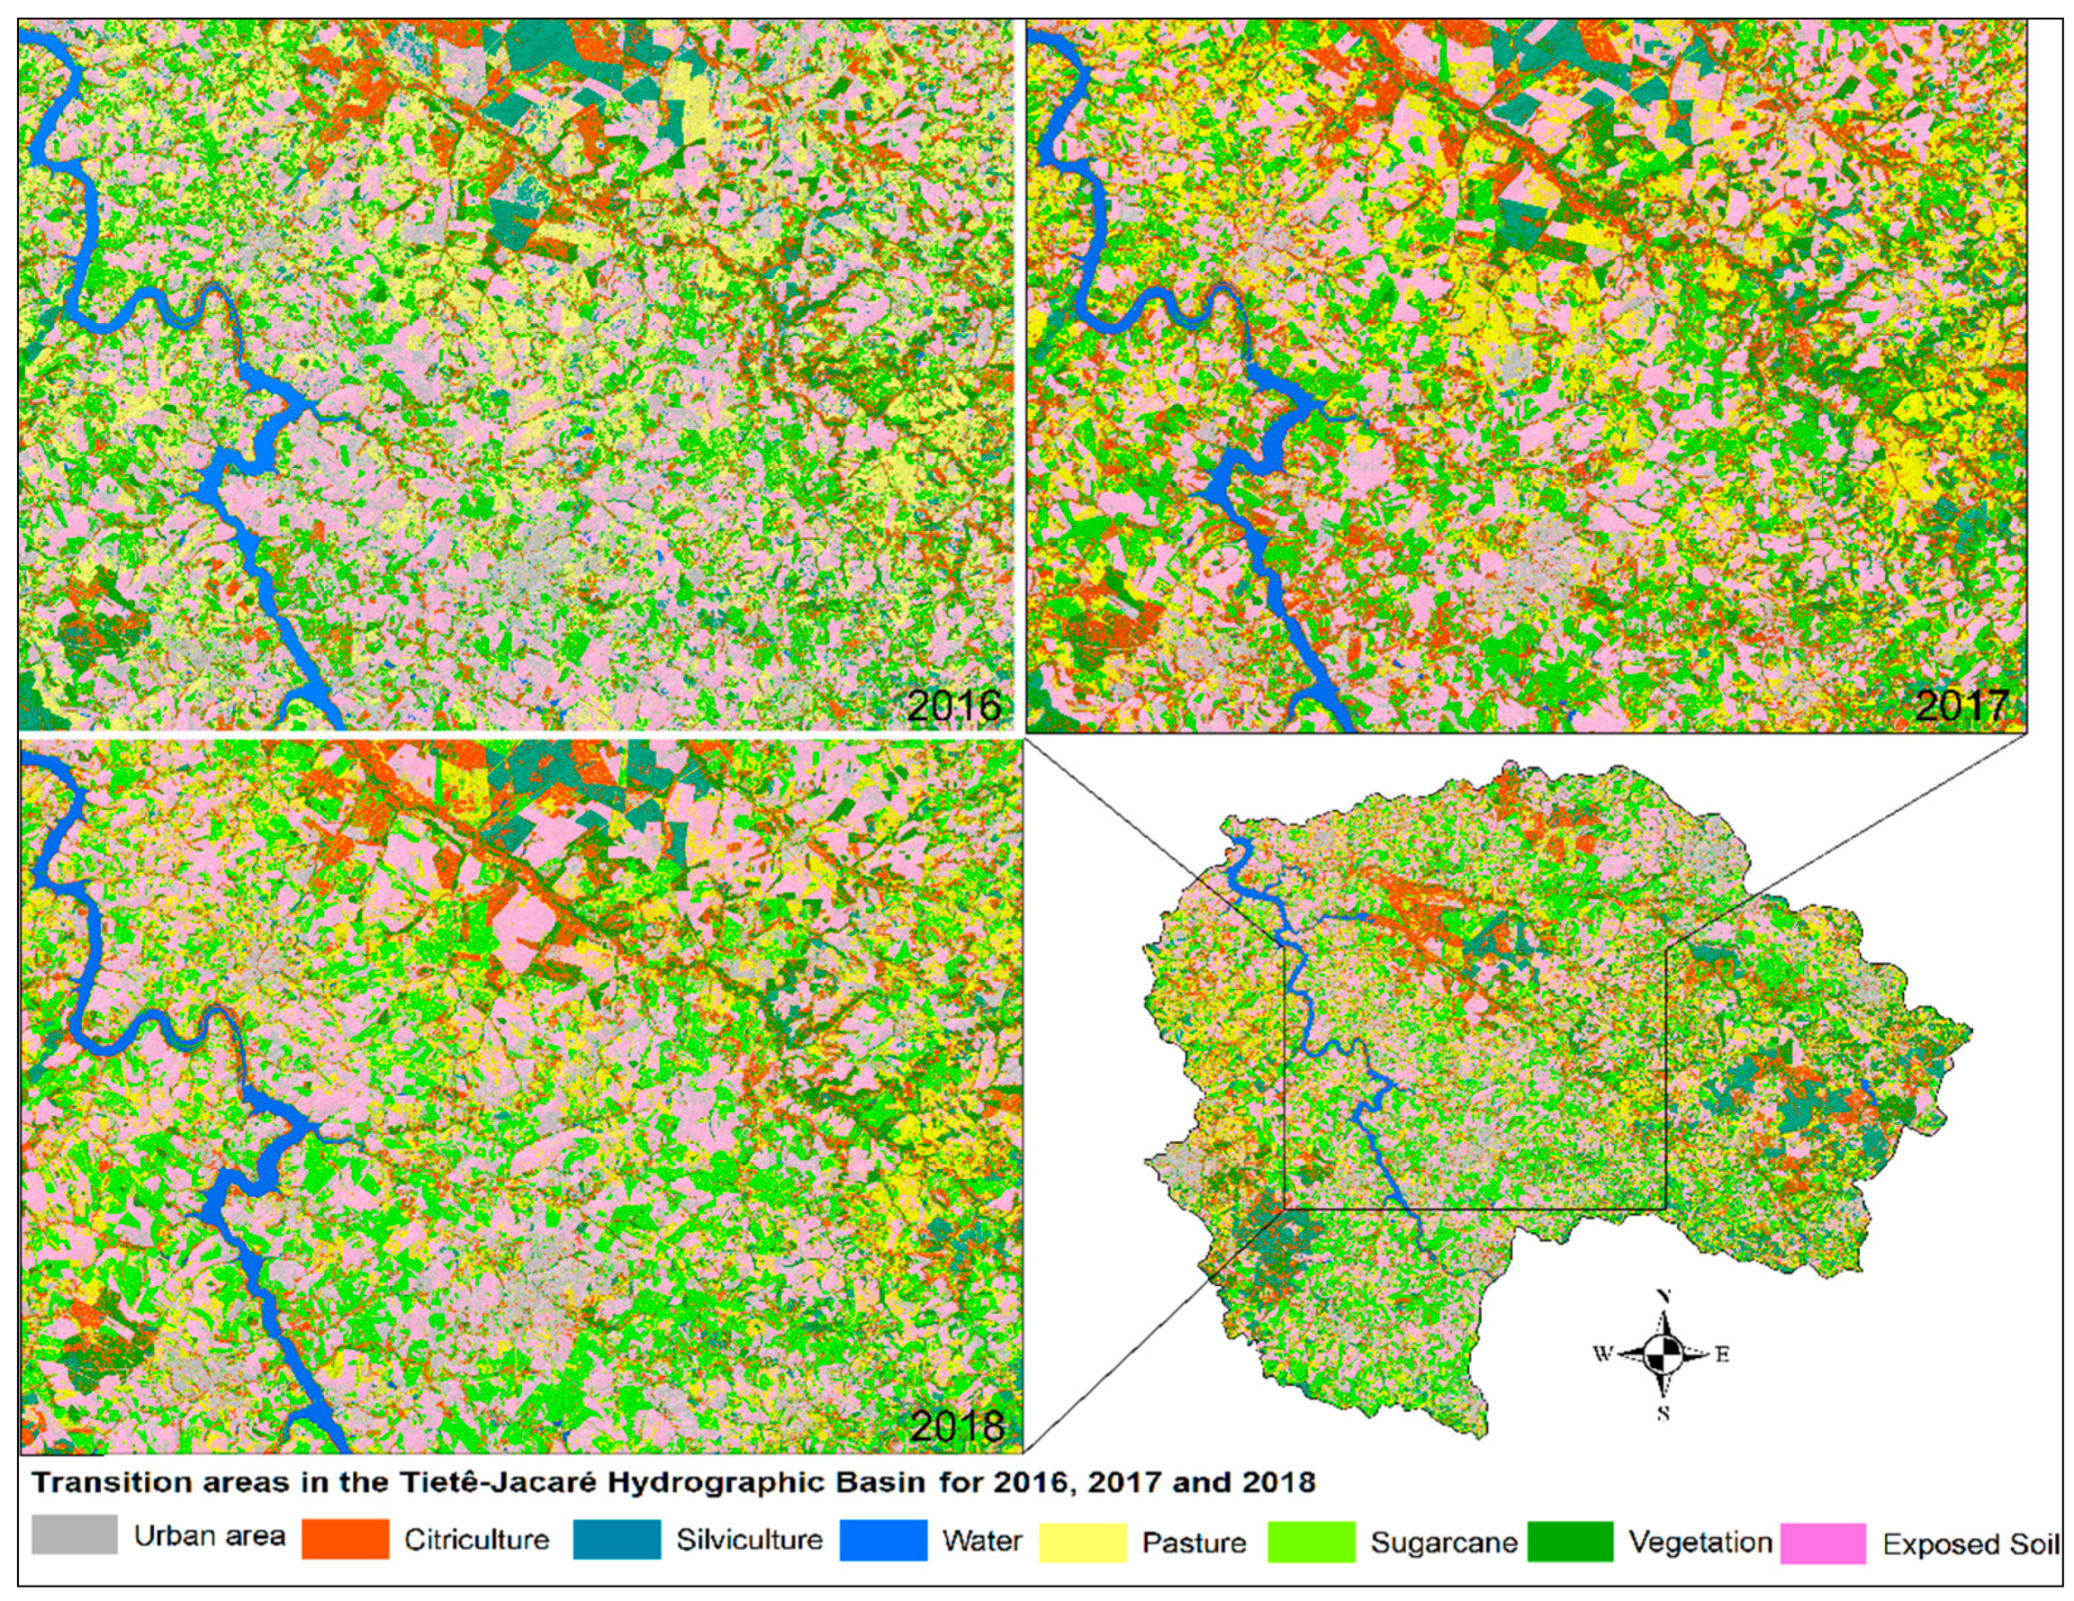
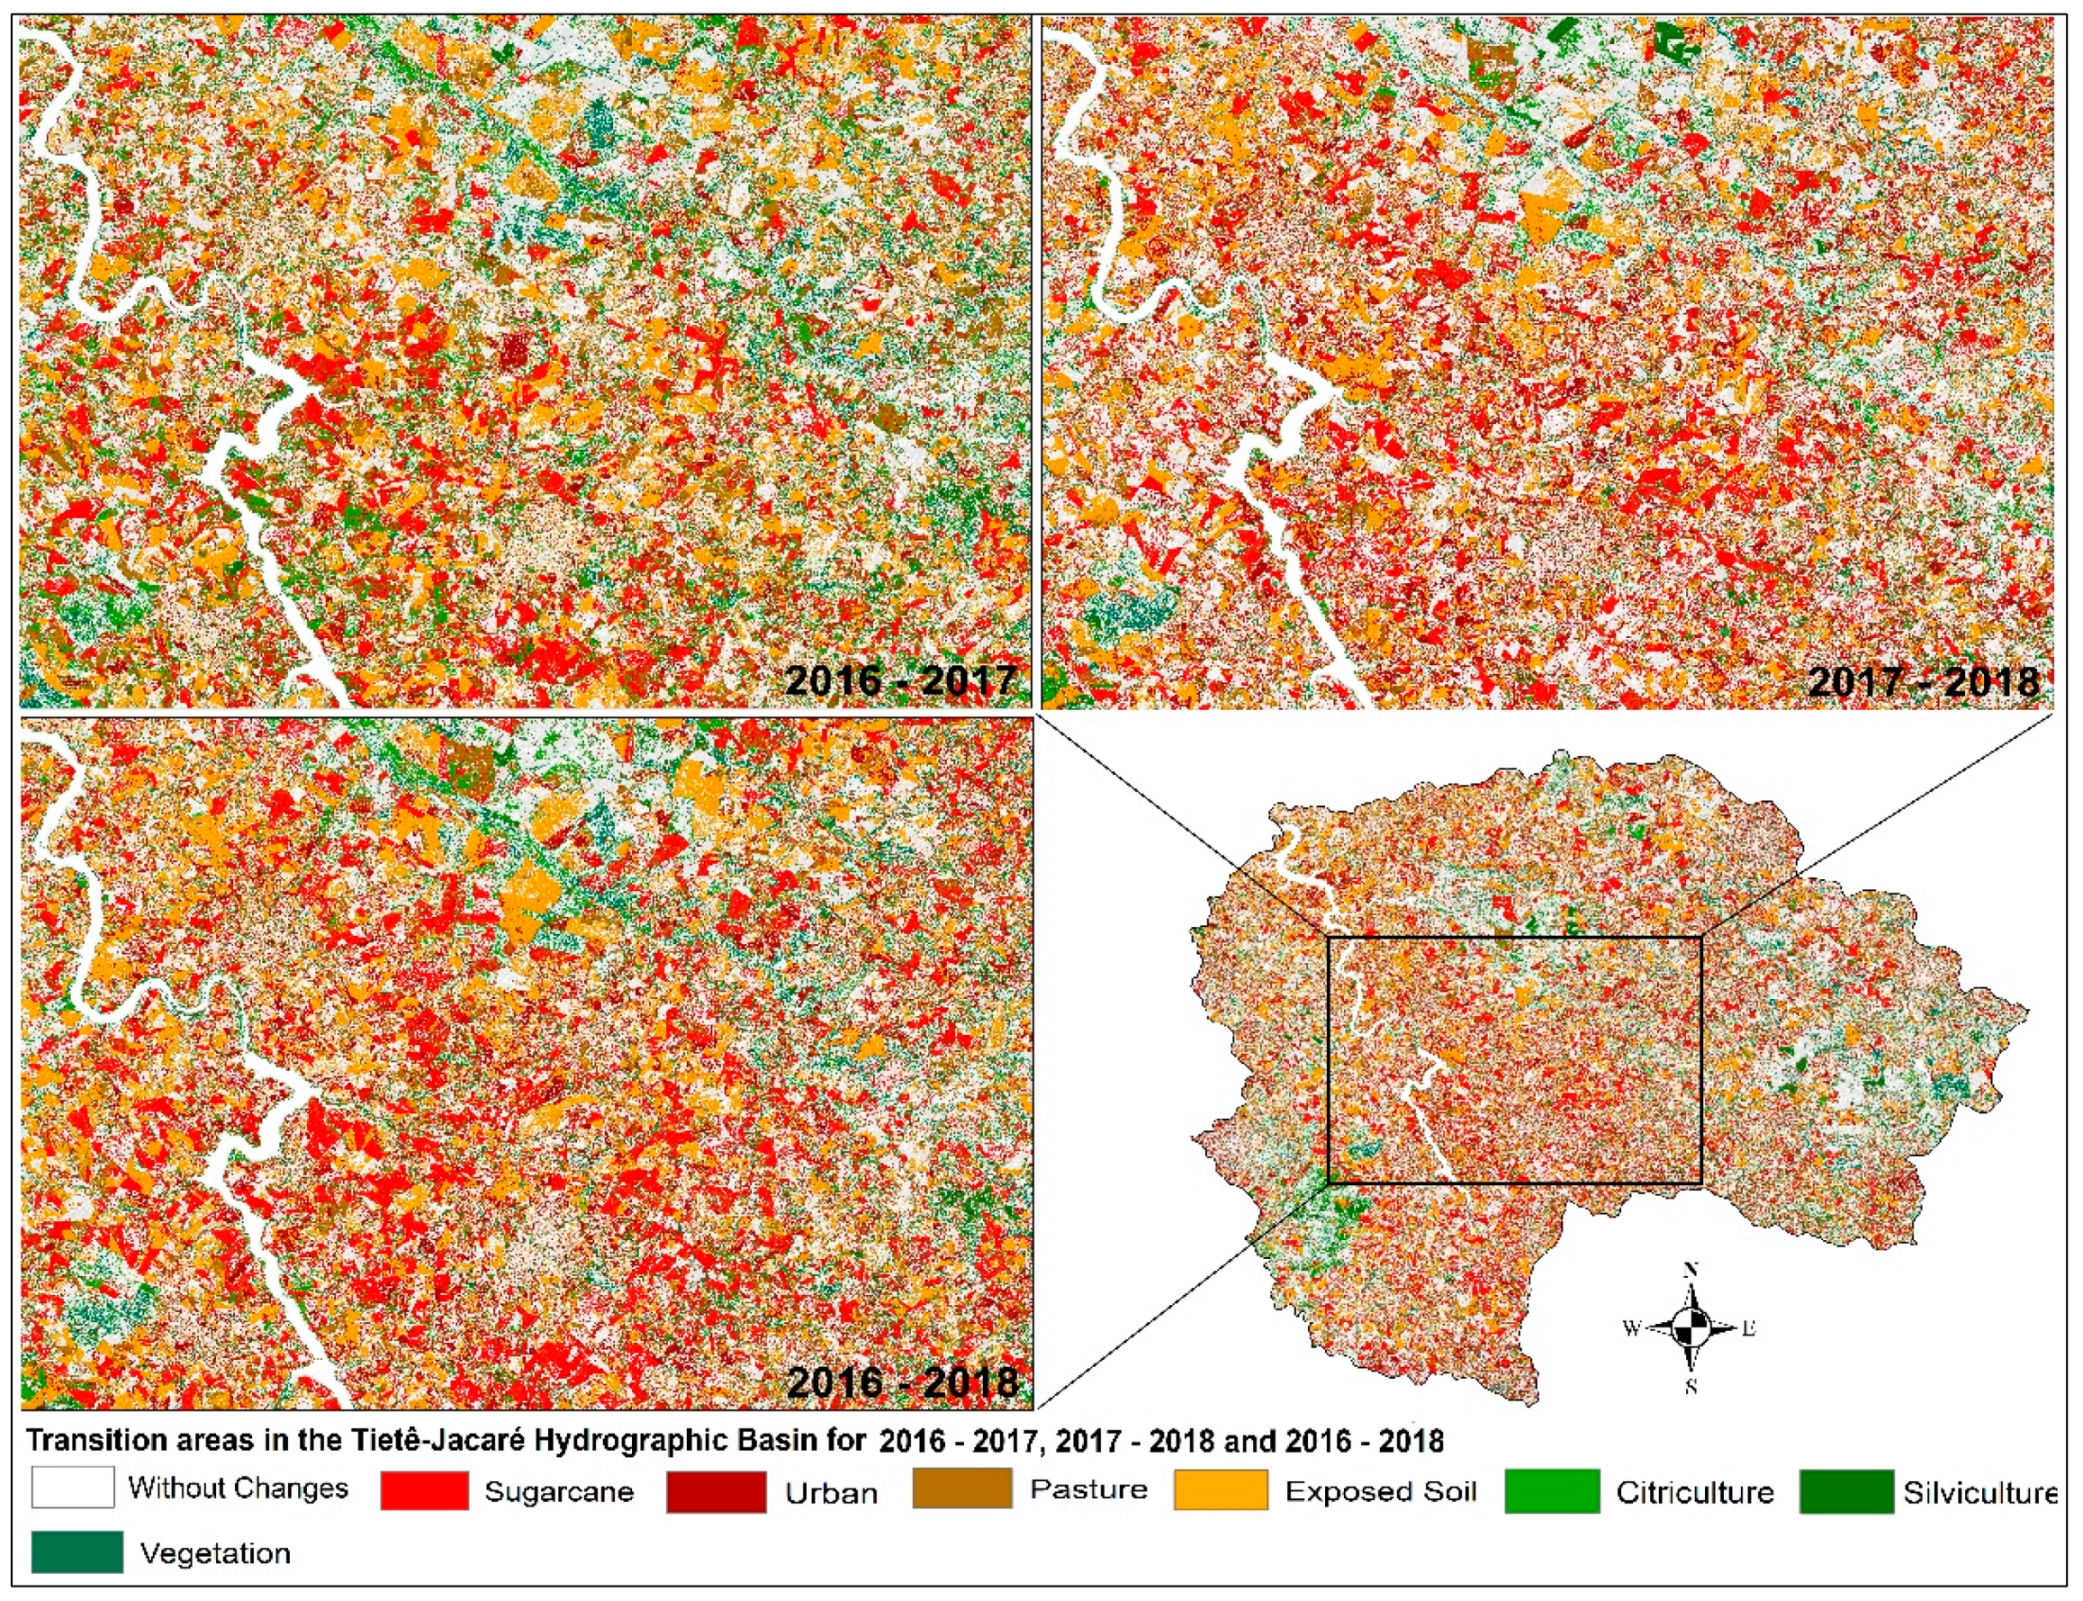
Figure 7 shows the land use and land cover transitions of the watershed region, where it is possible to observe some changes in all regions, mainly related to the growth of agricultural activities. Only urban and water areas remained without modifications. Sugar cane was the most significant vector of change.
Figure 8 and
Figure 9 show the southeast of the watershed region. It is possible to note significant transitions that happen seasonally, e.g., the transition between exposed soil to sugar cane, as well as permanent changes, e.g., the transition between vegetation to other crops. In these scenarios, the crop area increase evident in all regions was found to replace some forest areas, even near the water streams. Such behaviour occurs in different locations within the selected watershed.
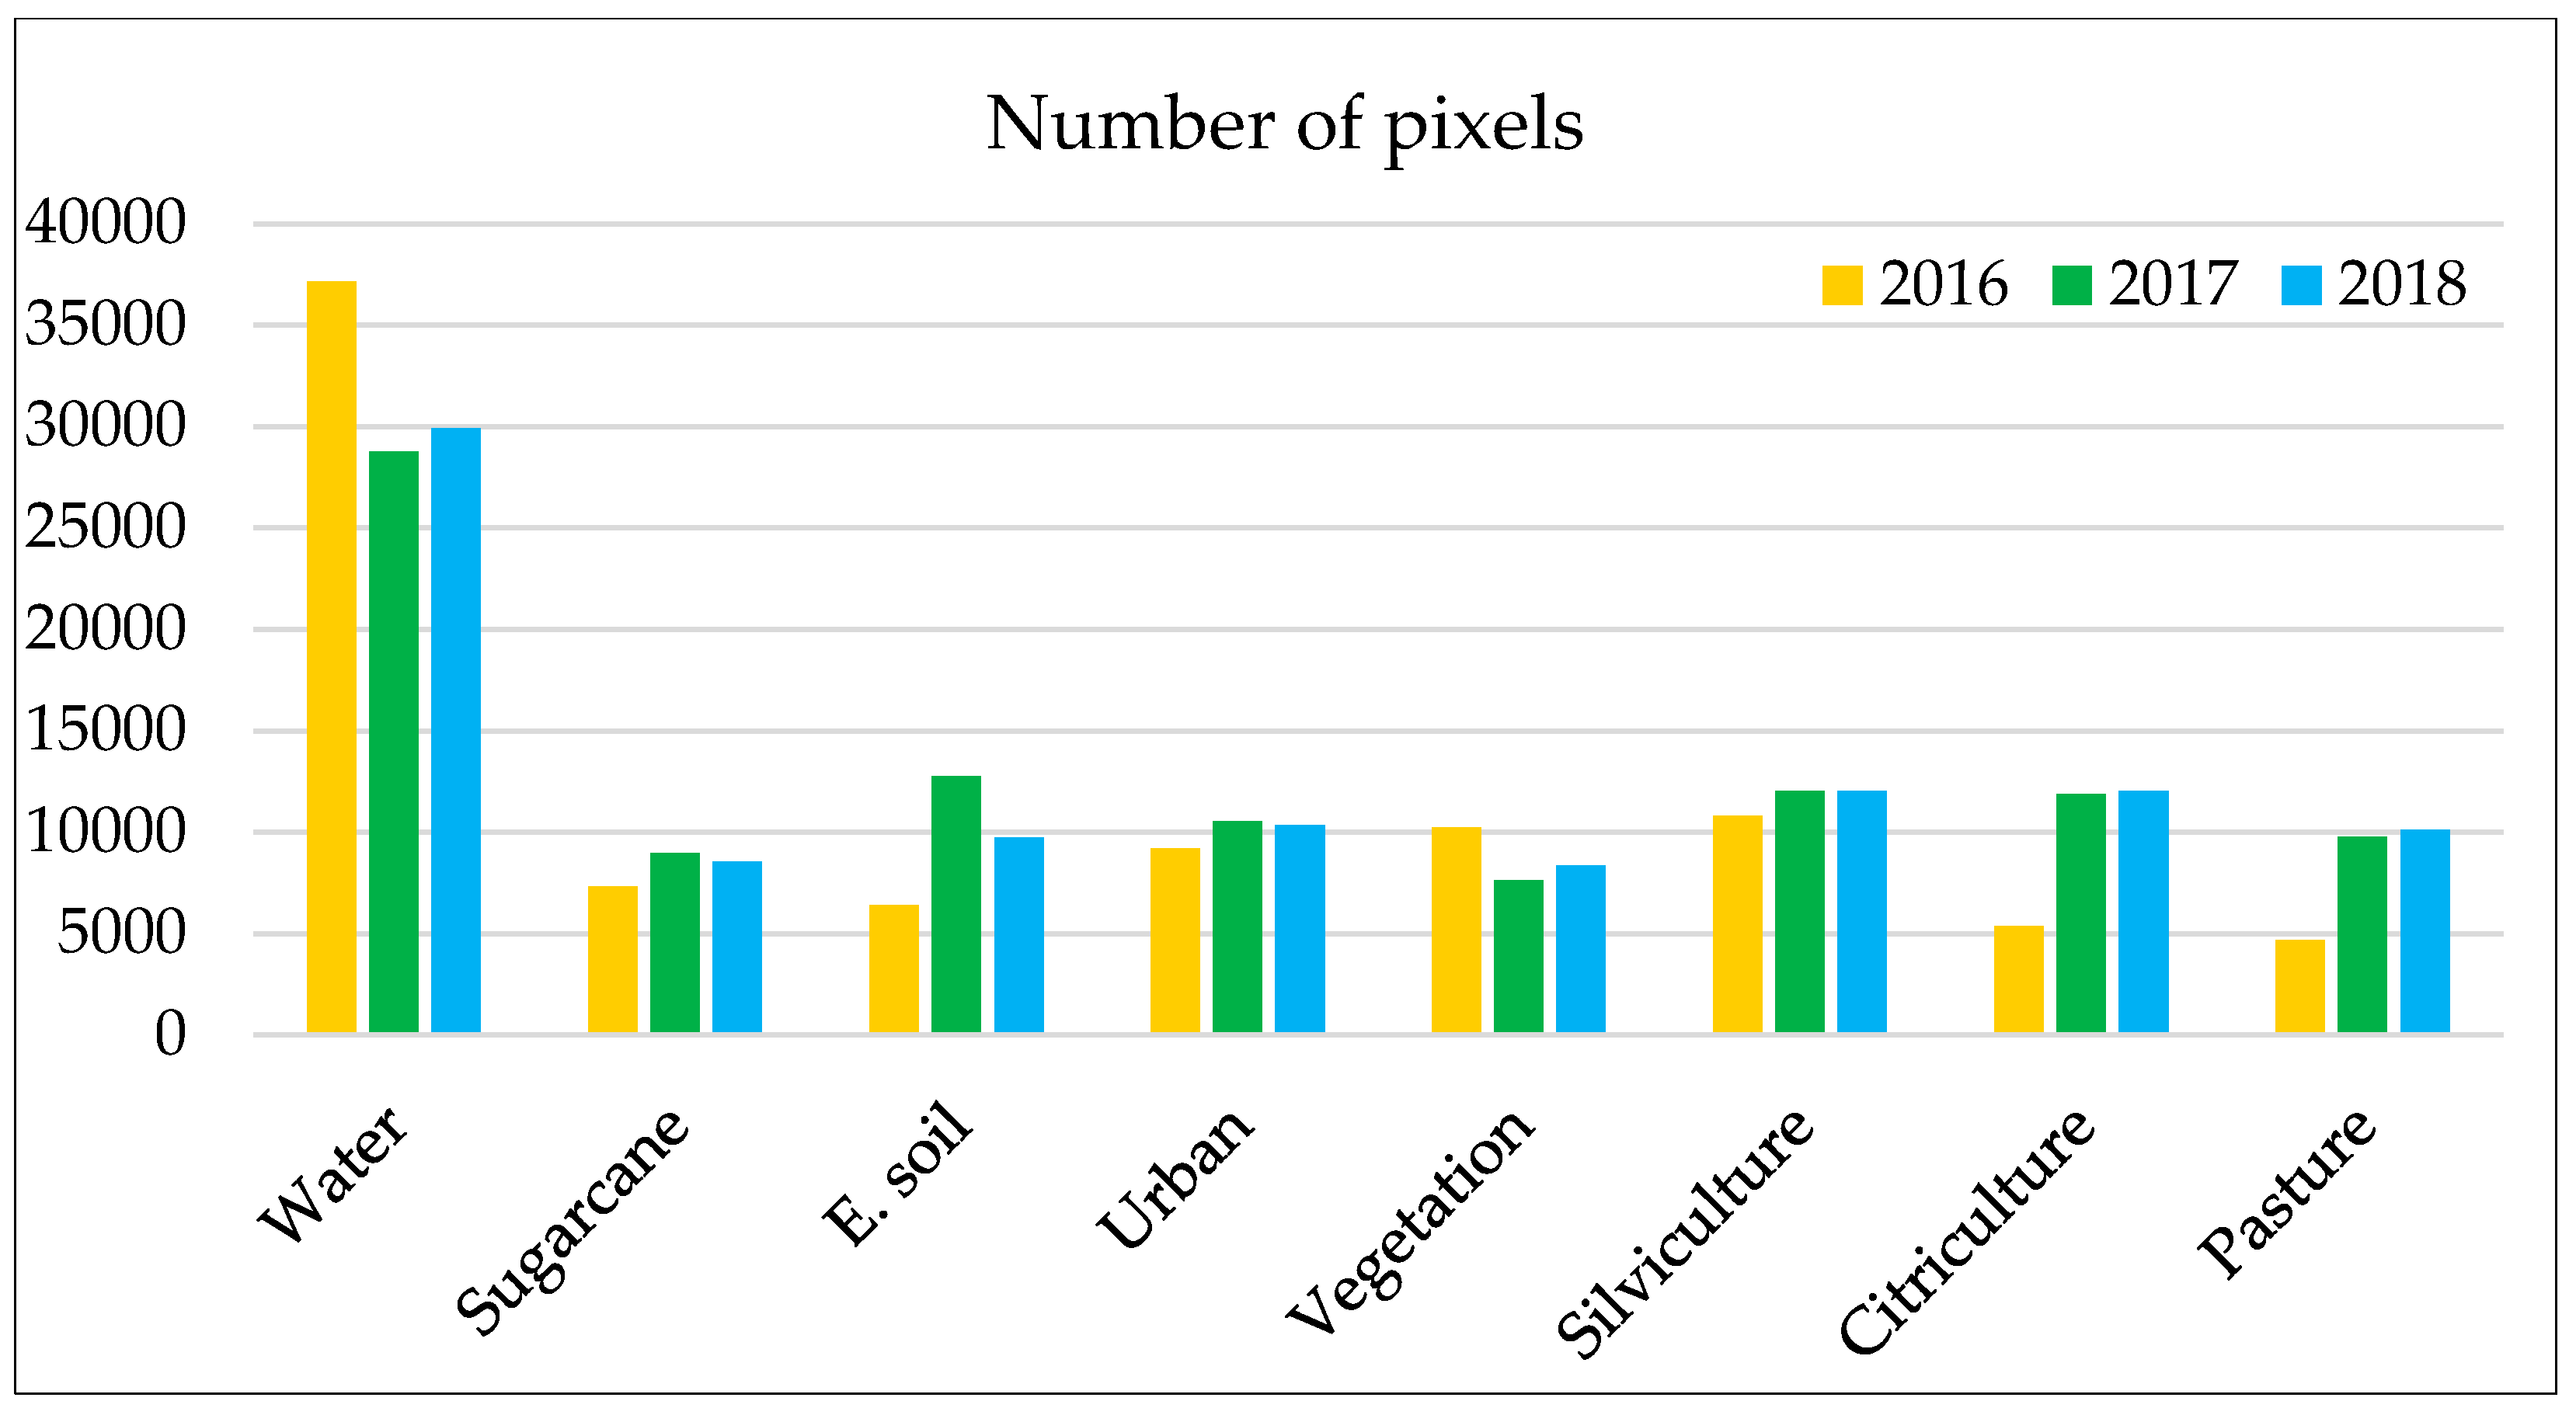
The validation was analysed and classified using the number of pixels found for each land use and land cover class in 2016, 2017, and 2018 (
Table 4,
Table 5 and
Table 6 and
Figure 10). The kappa index was classified between substantial agreement and almost perfect agreement, with a value of 0.876 in 2016, 0.854 in 2017, and 0.851 in 2018. The overall index reached a value of 0.90, 0.88 and 0.87 in 2016, 2017 and 2018, respectively. The producers’ error index was 9.77 in 2016, 12.23 in 2017, and 12.51 in 2018.
The classification demonstrated low uncertainty when considering the validation process. In 2016, for instance, urban areas were classified as other land uses (766 pixels and 8.31%), exposed soil as pasture (77 pixels and 1.20%), and vegetation as silviculture (915 pixels and 8.93%) and citriculture (436 pixels and 4.02%). In 2017, 2075 pixels of urban areas were classified as exposed soil (19.66%), while 1349 pixels (11.26%) of citriculture belonged to the vegetation class. Finally, in 2018, 2493 pixels (29.10%) of pasture were included in the exposed soil class, whereas 1003 (11.98%) and 1005 pixels (11.981%) of vegetation were classified as silviculture and citriculture, respectively.
4. Discussion
The increase and predominance of agricultural activities driven by sugar cane coincide with the history of São Paulo, which is considered to be the largest sugar cane and alcohol producer in Brazil. As is also the case in the Tietê–Jacaré Watershed, this is due to the favourable conditions for sugar cane cultivation, with a high number of areas with fertile soils and water resources, which causes the increase in average productivity in some regions to be higher than in other regions of the country [
52,
53].
These characteristics, such as natural vegetation conversion in other land use and land cover and forest loss in general, were also found in other studies on different regions in the state and the country [
54,
55,
56]. This vegetation loss value over time was similar to that reported by Moraes [
57] and Mello [
58], who also evaluated the forest and vegetation covers in the
Cerrado and the seasonal semideciduous forest regions (vegetation types present in the study area) [
57,
58]. The authors evidenced the progression of vegetation loss, isolation, and fragmentation in the landscape due to anthropic actions. Other regions in the country with different biomes and contexts also presented similar results, such as those found by Rego et al. [
6], who showed the loss of vegetation in the São Luis municipality, Maranhão state which is a highly urbanized region. It is essential to highlight that this study did not focus on the fragmentation processes and their spatial patterns. However, we noticed in our study area an increase in forest loss, and consequently in the fragmentation process, due to land use and land cover changes.
Important initiatives to analyse the land use and land cover changes in Brazil are the Brazilian Annual Land Use and the Land Cover Mapping Project (MapBiomas). The project involves a collaborative network that relies on the Google Earth Engine platform and its cloud processing and automated classifiers’ capabilities to generate Brazil’s annual time series on a scale of 1: 250.000. The results encompass the years 1985–2019, when a significant loss of vegetation was noticed in all Brazilian biomes due to agricultural activities [
59].
A management plan is then necessary to develop actions and policy strategies to minimize the impacts of land use and land cover changes, and to avoid the landscape’s fragmentation. This is an ongoing process due to the expansion of anthropogenic activities, not only for the watershed studied herein, but for the state and the country as a whole.
These negative impacts can compromise the environmental structures and ecosystem services, affecting the biodiversity, water resources, climate regulation, and the quality of soils that support forest cover and are significant energy sources for life [
60,
61]. The unplanned land use and land cover occupation and the inadequate soil management have caused several environmental problems, including soil compaction and desertification. On watersheds, these impacts decrease the infiltration of rainwater and increase runoff – factors that intensify the water erosion process and the loss of soil quantity and quality [
62,
63].
In the case of water resources management, the issue of water quantity and quality is attributed to the pollution caused by different sources, such as industrial, household, urban, and agricultural effluents, as well as to deforestation (in a landscape perspective). The contamination by effluents involves the improper discharge of materials and industrial products used in many processes, which are a complex concern to the environment, considering the concentration and volume of the waste produced. The resulting scenario is the degradation of water sources, with a consequent increase in plants and algae due to the use of nitrogen and phosphorus by farms and confined animal production [
64,
65].
Various authors debate about the negative impacts of the transition and simplification from natural or even agricultural fragments to monoculture crops [
66,
67,
68]. Zimmermann (2009) [
69] argues that the oversimplification of natural ecosystems is a result of the process for the development of agriculture in extensive monocultures, which is consequently enormously dangerous for the maintenance and conservation of the ecosystem complexity.
Freen et al. [
70] also discuss the importance of political actions for the preservation of forests and natural ecosystems to mitigate climate change. According to these authors, it is essential to increase the knowledge of the magnitude, drivers, and implications of environmental factors on biodiversity, such as forest or natural ecosystem microclimates. This information can, for instance, help to create better management and actions plans, supporting their sustainable use and keeping viable ecosystem services for future generations.
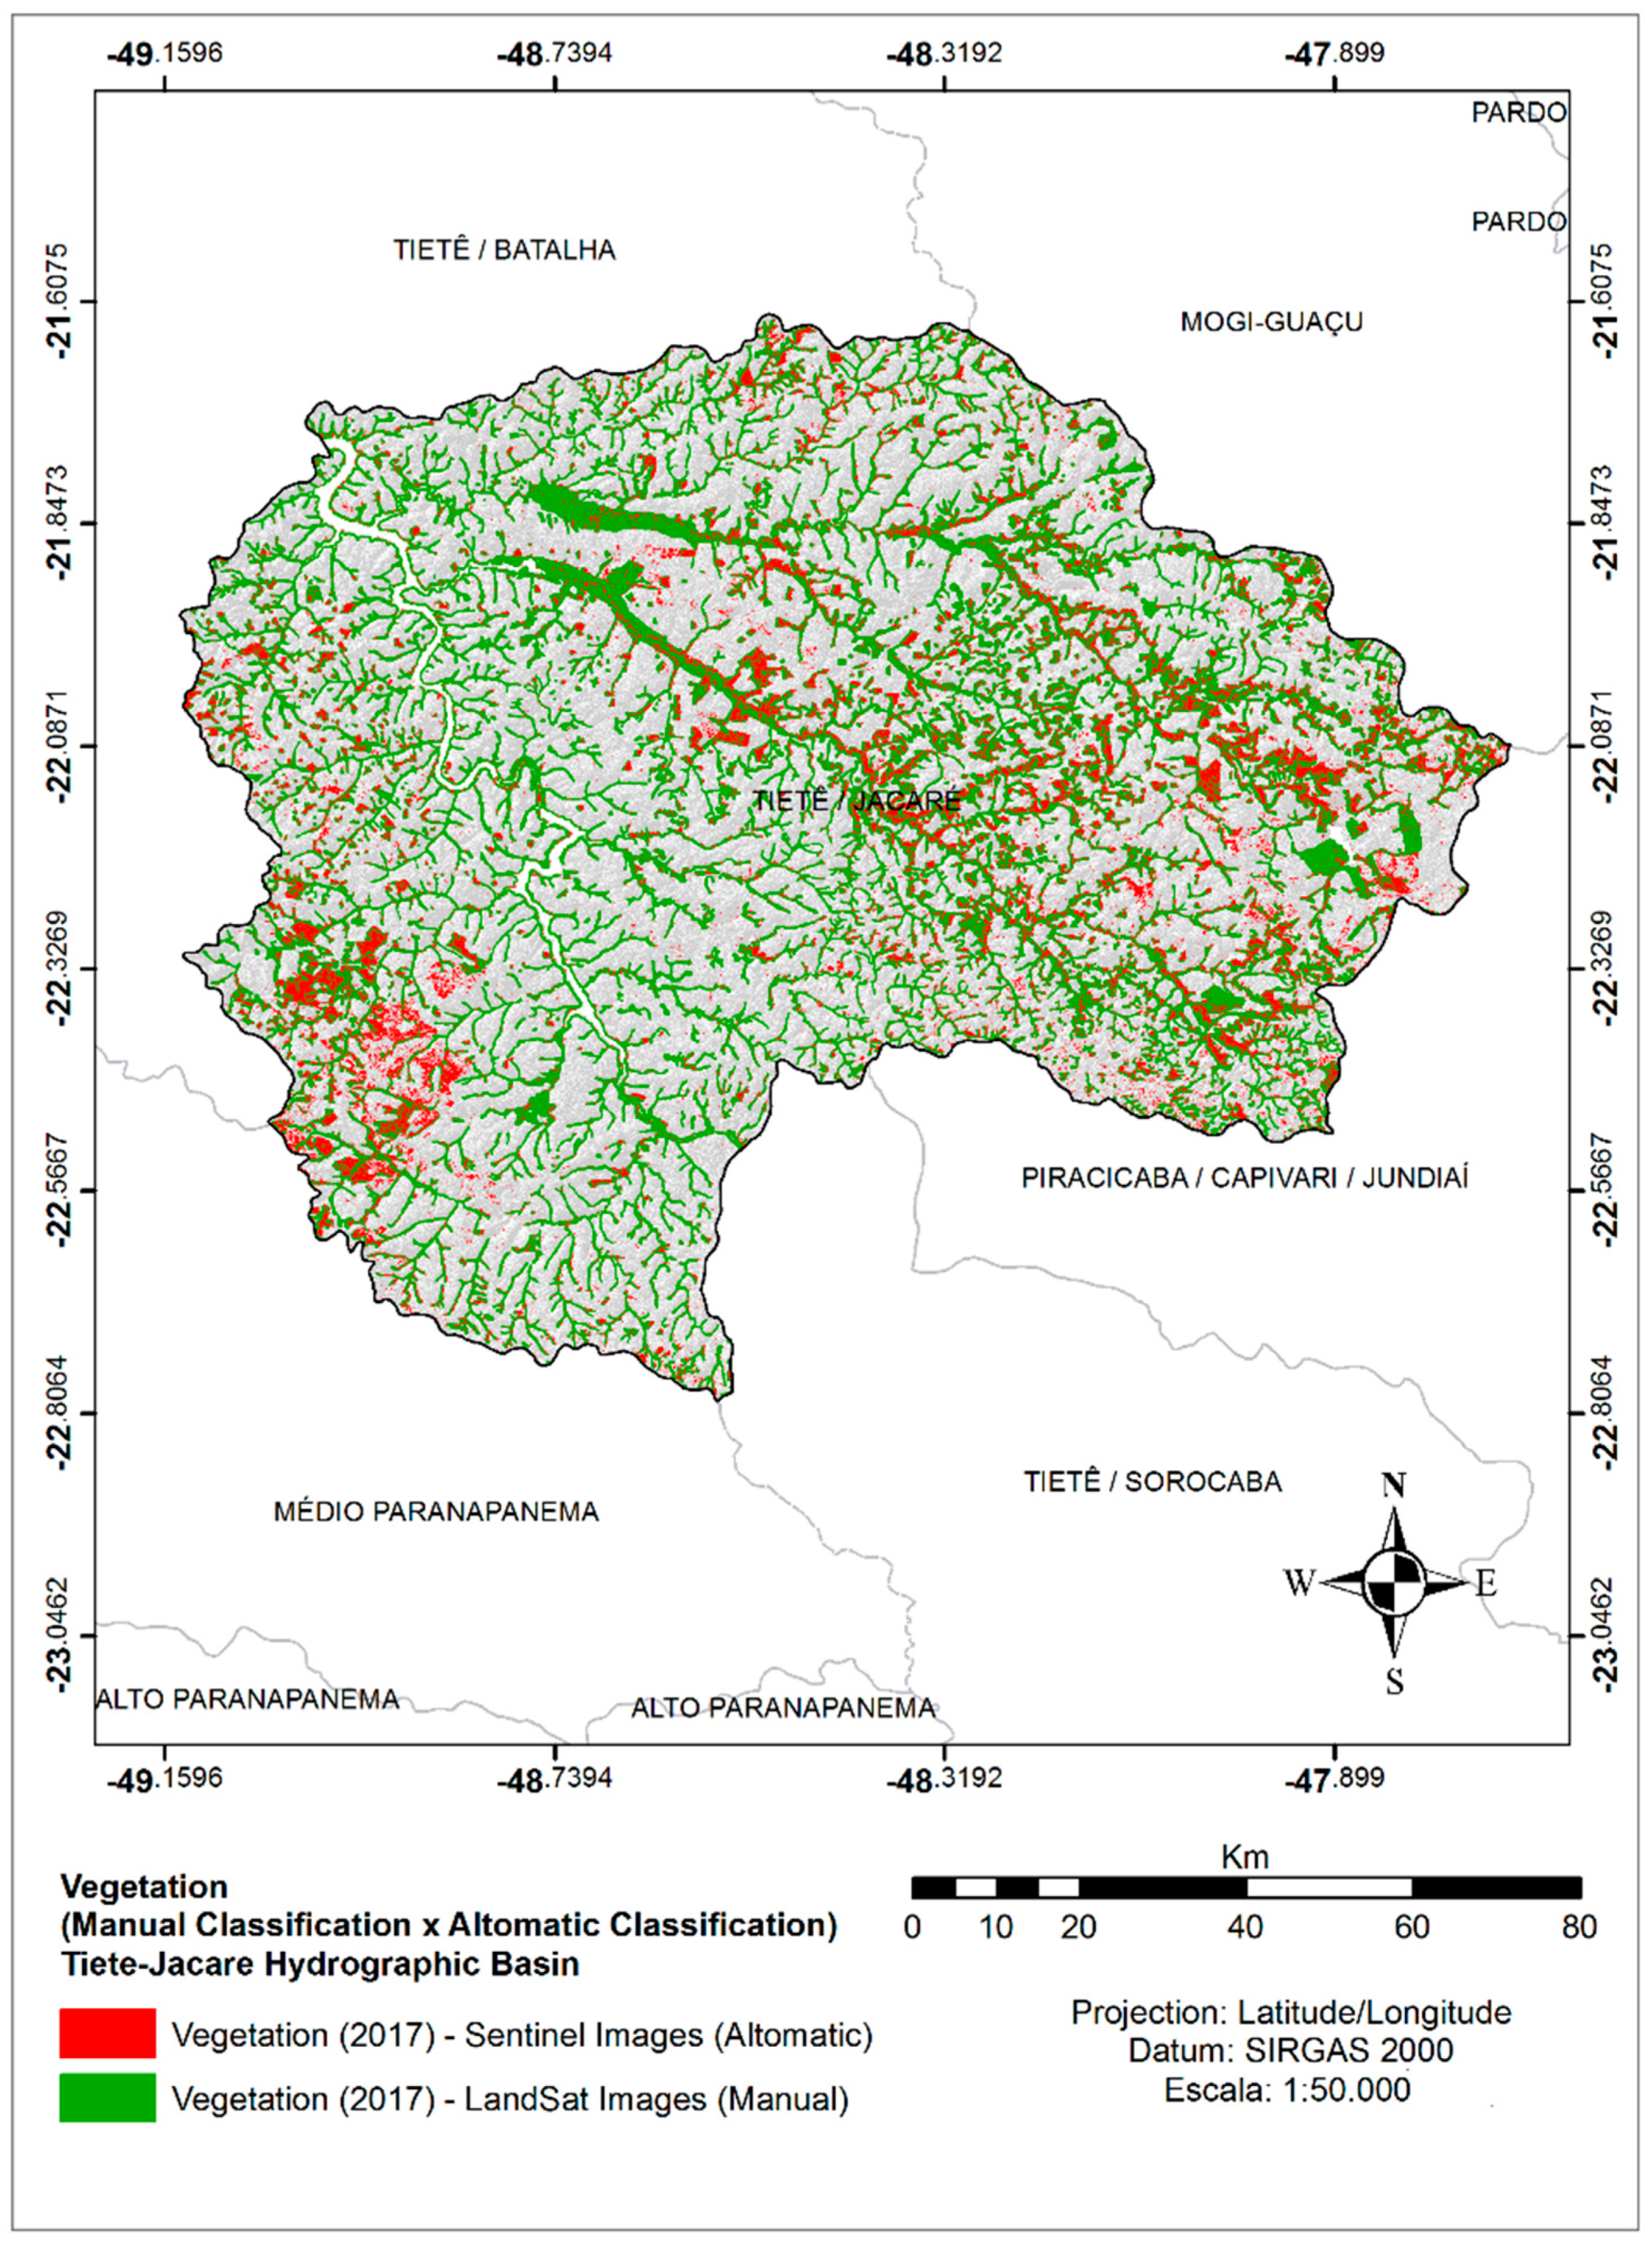
Despite the promising results that we got in terms of accuracy in our study, the methodology used for the change detection in the Sentinel-2 images (10 m of spatial resolution) showed, as expected, different results when compared to the classification of land use and land cover using the 2017 Landsat-7 images done manually by Trevisan et al. (with a 30 m of spatial resolution) [
21]. The classes with similar results in both analyses were water, silviculture, and exposed soil. However, the urban, pastures, and citriculture classes showed more areas in the Sentinel-2 images than in the Landsat-7 images. Moreover, sugar cane and vegetation were lower in the Sentinel analysis.
The differences in our results could be assigned to uncertainties related to differences in spatial resolution (Sentinel 2 = 10 m spatial resolution and Landsat 7 = 30 m spatial resolution), spectral resolution (Sentinel 2 = 4 spectral bands and Landsat 7 = 7 spectral bands), and time of acquisition between these images. Brus et al. [
71] discuss the depiction of uncertainty in the visually interpreted land use and land cover data. They state that the resolution indicates the values and degree of details in the area of interest distinguished by space, time, and topic. Therefore, lower resolution images present fewer details, thus being less accurate.
Time accuracy has a major impact on the current validity of the dataset and its subsequent use. In the land use and land cover maps derived from visual interpretation, it was possible to distinguish the quality of interpretation from the positional accuracy of the image. Brus et al. [
71] also mention that errors can be caused by incorrect category inclusion because of the subjectivity of interpretation, which differs according to individuals, leading to different results. In this study, the visual interpretation and sample classification were performed by the same individual [
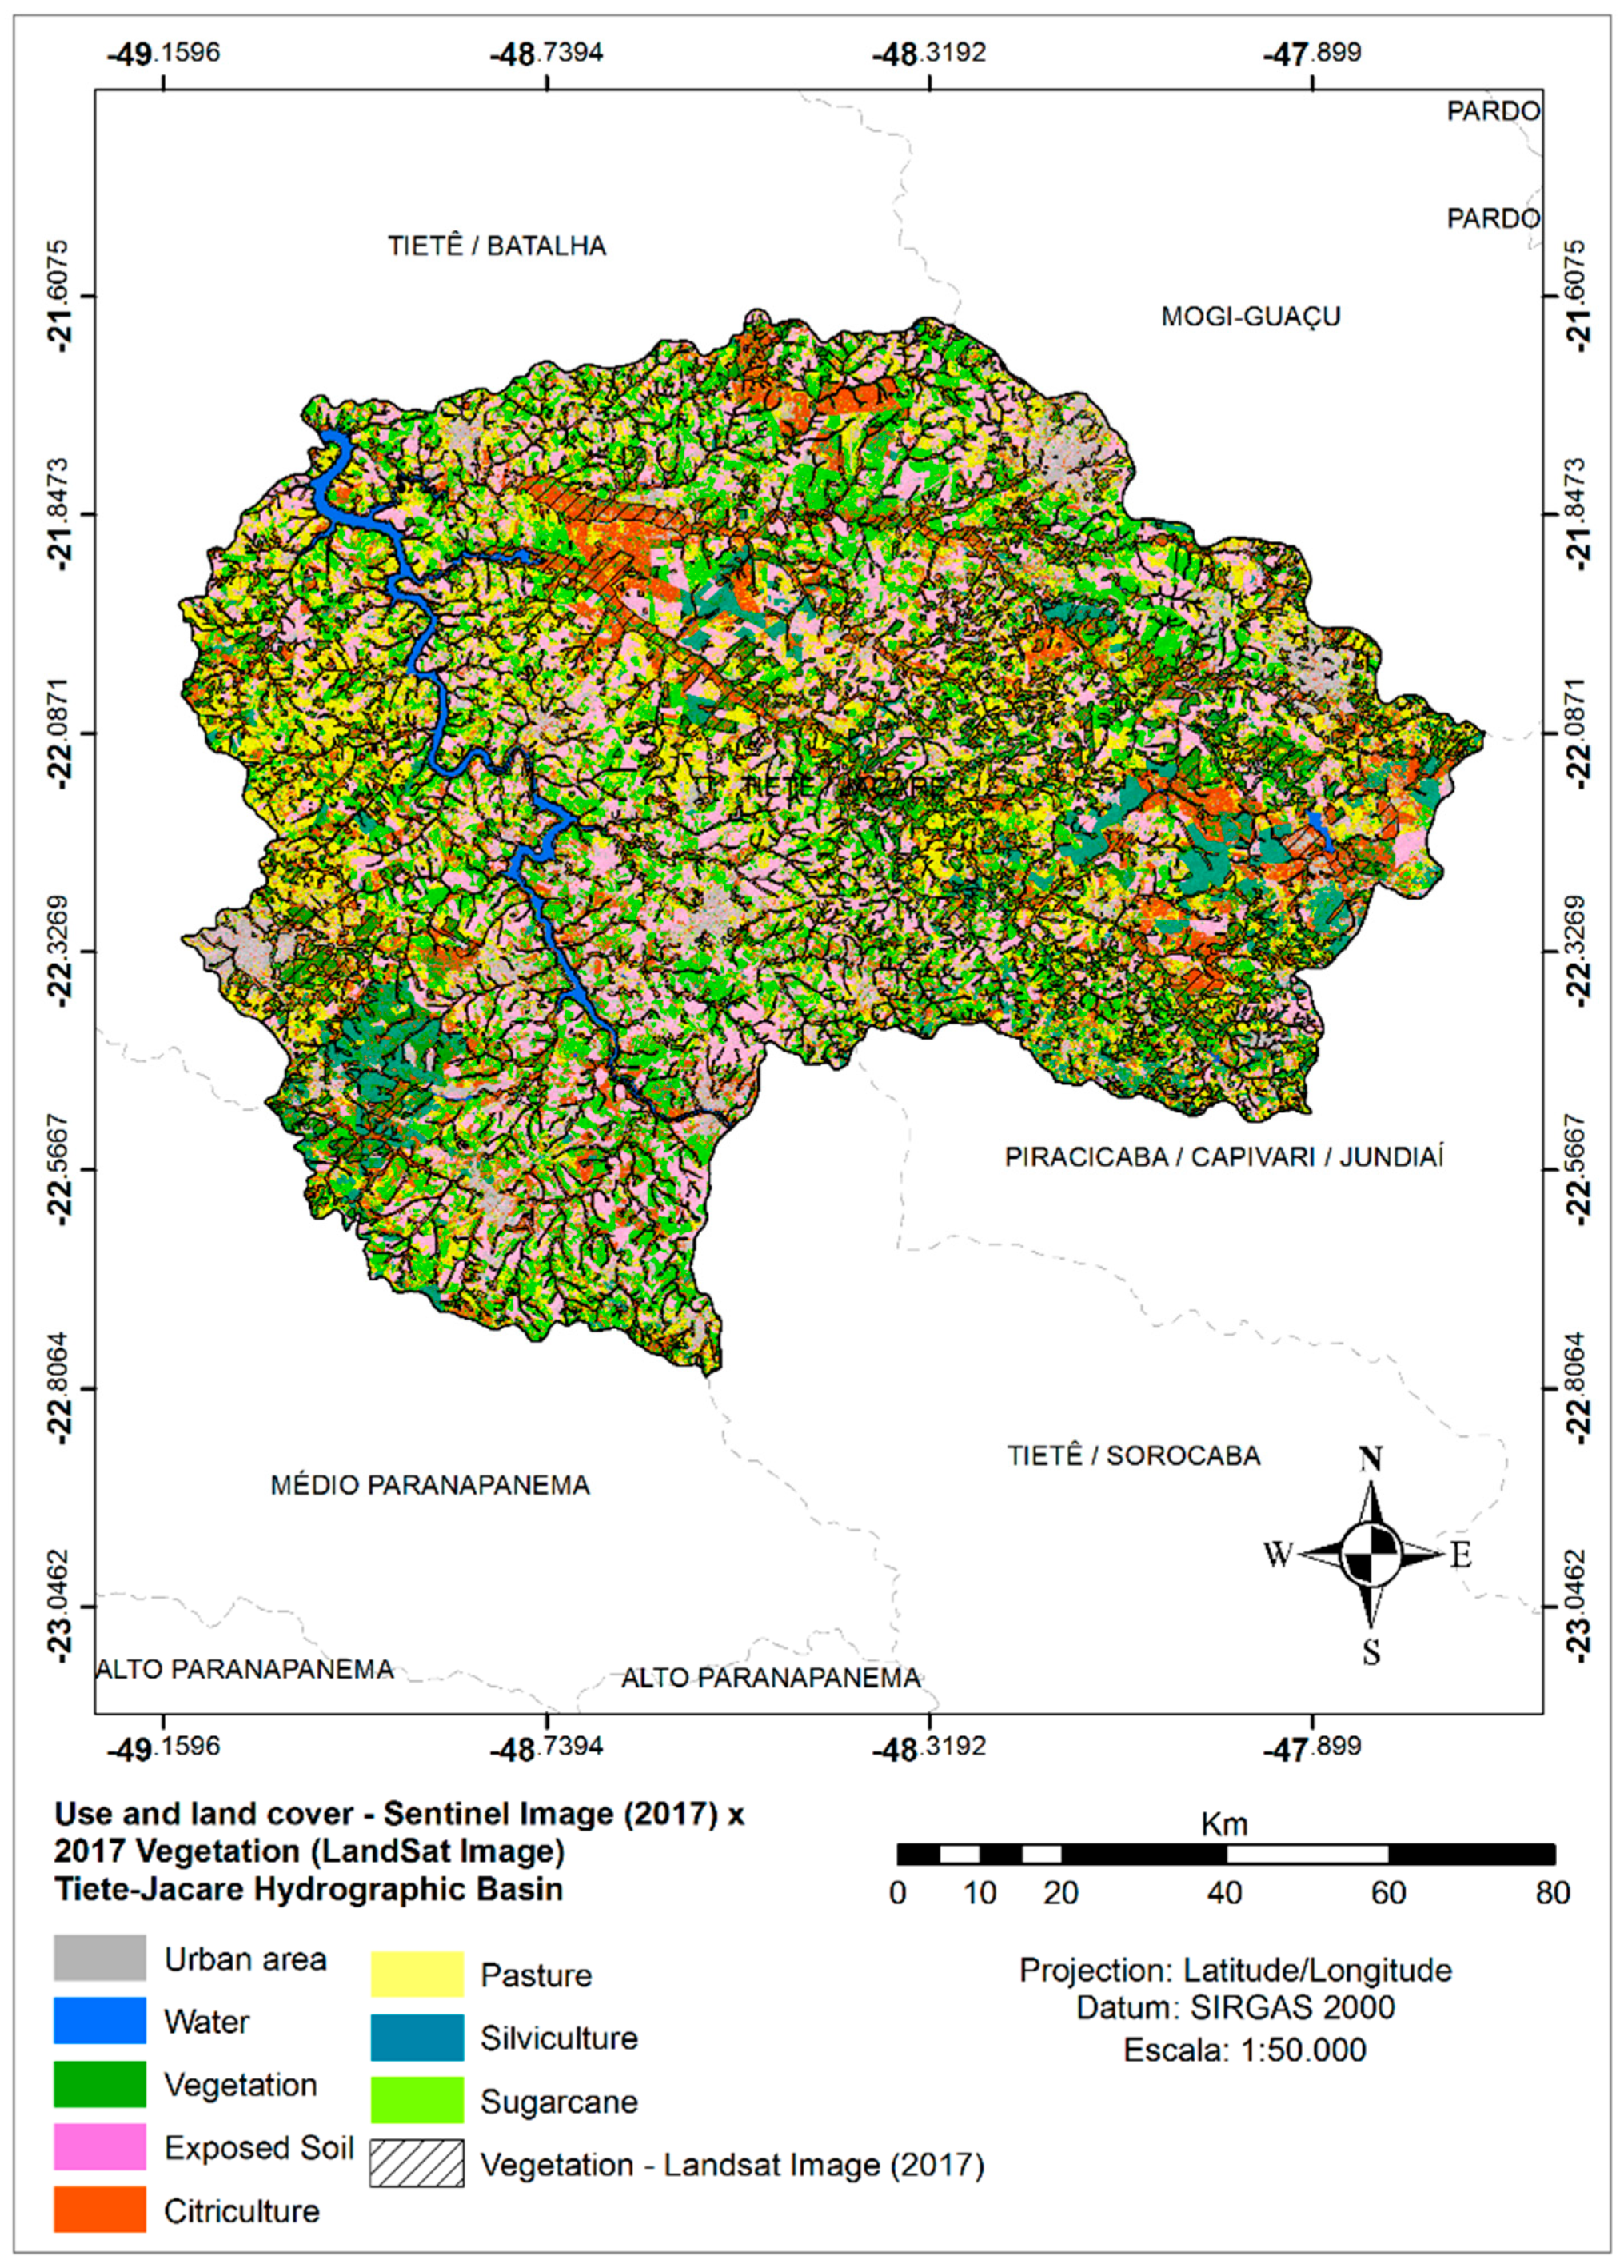
21]. The change detection presented some differences in the analysis of the classes due to the similarities between the Tiete–Jacaré Watershed pixel images. When comparing the vegetation in 2017 (
Figure 11 and
Figure 12) with the Landsat and Sentinel images, it was possible to see that there were some differences in the vegetation (
Table 7) during classification, considering that citriculture and silviculture have similar reflectance to some forest areas.
By comparing the manual with the automatic classification, we observed that 67,000 ha of the area covered by vegetation was classified as other land use and land cover types. The highest confusion with the vegetation involved the citriculture (31,000 ha), pasture (12,000 ha), and silviculture (5000 ha) classes. On the other hand, the urban and water classes did not present any problems, mainly because their reflectance was found to be different from that of the vegetation. The integration between machine learning and visual classification techniques is the best way to analyse and obtain information about the environmental and anthropic changes in different landscapes and contexts. For future studies, we plan to increase the training and validation samples and include other classes of land use and land cover, as well as other natural ecosystems. This process will be important because the natural landscape in the study area is being rapidly modified and converted. Through our methodology, we can detect the changes faster in order to provide the necessary information to decision-makers to act in the conservation of the natural ecosystems still present in the area.
Figure 11 shows the comparison between both classifications for 2017 (automatic and manual). It is possible to see that the automatic classification diverges from the manual in small areas, especially related to the riparian vegetation found near streams. Although the comparison was made visually, it is worth highlighting that the maps were based on two different sensors, resulting in images acquired at different spatial and spectral resolutions.
The study conducted by Sakamoto et al. [
60] proposes a method to use multi-temporal Landsat Satellite data for determining a water index to constantly monitor the spatial distribution of rice planted in Japan without using complex interactive manual operations [
60]. According to the authors, this method has a much more straightforward approach when compared to the semi-automatic or automatic techniques, as it determines the water index based on statistical analyses using manual training data or the difference in histogram distribution information between flooded and non-flooded pixels.
Fisher et al. [
72] used 1 m pixel images from the Digital Globe Satellite and 30 m pixel images from the Landsat Satellite to evaluate the impact of the spatial resolution of a satellite image on land use and land cover classification via the ArcGIS Feature Analyst tool and on total suspended solids (TSS) load estimates from the Soil and Water Assessment Tool (SWAT) for the Camboriú watershed in Santa Catarina state, southeastern Brazil. The authors found that the models using 1 m data had better results for predicting both analyses. Moreover, besides higher costs, the high spatial resolution requires additional analysis time.
Other critical aspects for enhancing mapping accuracy are the increase in the number of spectral bands and the increase of the radiometric resolution. Rao et al. [
73] worked in a comparative study to evaluate the utility of the simulated 12-bit LISS-III sensor against the original 7-bit LISS-III sensor for land use and land cover classification. An increase of 3% was noticed in the overall accuracy when using high radiometric resolution data.
The development and variation of machine learning (ML) techniques and visual classification could increase the speed and accuracy for classifying land use and land cover changes in natural and anthropic landscapes. Additionally, such approach could support government agencies’ efforts to avoid deforestation and to develop action plans so as to mitigate the impacts of these processes on the landscapes, thus increasing sustainability in the different biomes worldwide [
74,
75,
76]. An example is the work conducted by Ximenes et al. [
77], who provided a map of the terrestrial ecoregions of the Purus–Madeira interfluve in the Brazilian Amazon region using the random forest technique. They developed an ecoregion map from a set of variables, including altitude, slope, drainage density and percentage of tree cover, and a vegetation map related to the environmental diversity of the region that can reproduce valid and accurate results over different areas.
5. Conclusions
The Tietê–Jacaré Watershed has high potential for the development of agricultural activities, as observed by the land use and land cover classification documenting the predominance of such activities in the region. Furthermore, these datasets corroborate the demographic analyses of 1970, 1980, 1991, and 2015 [
22]. They show that the region’s growth process is due to the intensification of the urbanization processes (especially the large municipalities, such as São Carlos, Araraquara, Bauru, and Jaú) and the expansion of land use areas due to agricultural activities.
The growth of anthropic activities and the loss of natural areas can compromise the biodiversity still present in the study site. Furthermore, it may represent a loss of environmental services and functions, and consequently of benefits from natural areas that provide resources and support for the maintenance of urban and agricultural activities. Therefore, necessary actions such as the revision of the Forest Code and other environmental laws should be discussed more scientifically, focusing on the conservation of ecosystems. In this way, they should aim at the benefits of the preservation and conservation of natural areas, rather than focusing on the advance of anthropogenic activities or financial interests.
The diversification and rotation of crops is a possibility to control soil fertilization since monocultures interfere with nutrient cycles, causing soil impoverishment and leading to problems such as desertification and salinization. Desertification is a dynamic process that results in the transformation of certain areas into a desert, whereas salinization refers to the degradation of environments under humid climates with the formation of islands of exposed and loose sand.
The use of Sentinel-2 images and the random forest machine learning approach enabled a temporal analysis of the Tietê–Jacaré Watershed region. This methodology allowed us to identify the driving forces that promote the changes in the landscape, contributing to discussions about their consequences over time. Such tools can also accelerate the analysis of evidence of the loss of natural areas and the regional environmental quality, as well as the growth of negative impacts on the watershed landscape, which culminate in the reduction of vegetation areas and water networks. Additionally, the implementation and use of machine learning can increase the efficiency and accuracy of the analysis in studies related to deforestation and the impacts of land use and land cover changes in natural and anthropic landscapes, which is an important factor for the sustainability of the different biomes worldwide.


 ,
, 


