Abstract
The rapid changes in the services sector encourage companies to improve the processes for developing and delivering new services. An effective new service development process is not possible without planning. Business entities can plan their time, organise activities, and prioritise tasks according to the complexity or the total duration of the process. However, in the context of new service development, the planning aspect is still not sufficiently emphasised. It is noted that the aim is often to identify the factors that could reduce the duration of this process. However, there is a lack of relevant data based on certain expressions of time. The lack of such research limits the improvement of the planning processes for new service development projects. In order to evaluate the possibilities of application of the proposed new service development model for companies providing services, an empirical evaluation was conducted, using methods of expert survey, program evaluation and review, and Monte Carlo simulation. Guidelines for further research were formulated based on the obtained results.
1. Introduction
With the consistent growth of the services sector, more and more businesses tend to start their operations in this sector from the development of new services. In order to differentiate themselves from their competitors, companies of various profiles undertake the development of new services. Therefore, it can be said that this is one of the main ways to expand into new markets. New service development (hereinafter—NSD) is also widely discussed in the scientific literature. The ScienceDirect website has seen a steady increase in publications under the keyword new service development. Over the last decade, publications on this topic have covered a wide range of research areas: social sciences (2520 publications), environmental science and energy (2030 publications), medicine and dentistry (2245 publications), engineering (1725 publications), computer science (1556 publications). The continuity of research on this topic is often determined by the ever-changing consumer behaviour, competitiveness, and the need to seek innovative solutions. NSD is explored in research papers covering further research perspectives [], service innovation [], and the benefits of this process for organisations []. Despite the differences across the sectors, the development of new services remains a very important area of research.
Not all business entities succeed in developing a new service (hereinafter—NS) that could be successfully positioned in the market [,]. Ref. [] claims that one of the interpretations of the formally understood process of growth is that many companies have an established NSD process, but its implementation and application in practice are the key problems. Ref. [] note that a spontaneous and unsystematic procedure of NSD is one of the main reasons for failure. According to [], lower investment in raw materials often encourages service companies to choose a simple and fast development process. As a result, companies do not tend to carry out complex and time-consuming development projects. A similar opinion was expressed by [], saying that, usually, companies that are facing the need to develop a new product or service make quick decisions closely resembling the product idea of their competitors, and then, attempts are made to gradually change or improve the features of the product that has already been released by the competitors.
According to [], it is not entirely clear why services are being updated constantly and how the upper-level management uses the existing strengths to prepare new offers. One of the main problems in defining the NSD, as identified by [], could be the difficult and inexplicable decision-making process. It can be stated that the NSD process encourages businesses to make less rational decisions because of its complexity or scale. This is also supported by the fact that each stage is implemented faster than it should be and, as a result, a balanced planning of this process is not ensured. Following the findings of [], an active strategic management of NSD is an essential component to gaining momentum and maintaining a competitive advantage as services become the key to differentiation.
Improper preparation, incorrect allocation of resources, a lack of connection between the customers and the company, insufficient involvement of the customers, and an inefficient NSD planning process can also lead to the failure of this process. The consultants of [] tried to determine the factors that have the greatest impact on the successful launch of a product or a service. They found that there is no connection between the amount of money a company invests in the development of a new service and the guaranteed level of its success. They also did not find any correlation between success and the average frequency with which a new product or a service were introduced to the market. This means that it is necessary to evaluate different factors and plan this process consistently during the development of an NS. Measures related to the performance of the NSD process are often analysed in scientific works. Although most authors express varying attitudes towards the impact of specific measures on the effectiveness of NSD, it is observed that customer involvement, internal and external communication, as well as learning and knowledge management are the predominant topics. According to [], customer involvement refers to a dynamic process whereby the company and the customer collaborate and implement the innovations into the upcoming projects of NSD. Ref. [] collected data from different service companies and found that the involvement of customers and professionals in the different phases of the NSD process indirectly affects sales and the efficiency of that project’s development. On the other hand, [] claim that despite the recognised importance of the consumer element, there is no empirical evidence on the effectiveness of customer interaction and the results that might be achieved through it.
Analysing the significance of communication in the context of NSD, [] indicate that the communication factor occurs at all stages of NS development and it is relevant to external factors such as suppliers, competitors, potential customers, and investors. According to [], the company needs to practice a multidisciplinary and cross-sectoral organic team structure to enable its members to share ideas through open communication. In this way, external risks can be effectively reduced, and the success rate of an NS development project can be increased. Ref. [] agree with these insights and claim that internal communication and information exchange are the key points to the effectiveness of NSD and to the overall success of the process.
While forming the systemic learning model for new service development, [] found that the application of learning methods increases the efficiency of the NSD process. Ref. [] introduced the new service development maturity model and concluded that strategy, information, process formalisation, and user involvement are essential to the effectiveness of NSD. Ref. [] found that learning competencies promote the development of the core competencies and, as a result, improve the effectiveness of NSD. A similar study was conducted by []. The researchers studied the ability of the employees to absorb the knowledge needed to develop a new product. Based on the data from 98 product development teams, the researchers found that absorptive capacity is closely related to the outcomes of employee performance that are significant in product development and innovation management.
Based on these findings, factors such as customer involvement and internal and external communication have been analysed quite extensively. The benefits of such measures and the need to apply them in practice have also been examined. There is still a lack of research that would determine the reasonable duration of this process (based on time expressions) during the development of new services. A study focused on the duration of NSD would allow for a reasonable identification of time-saving opportunities (reserve), an identification of actions that should be taken first and last, as well as the duration of the implementation at each stage. These reasons suggest the need to develop an NSD model that would allow for time-based data. For companies in fast-growing sectors (energy, medicine, transport, etc.), time-based data would allow for rational NSD decisions and thus facilitate the coordination of the whole process between consumers, employees, managers, and other stakeholders. In the context of companies in the energy sector, the model could be applied in the development of services based on environmental technologies []. In other sectors, the proposed model could be adapted to develop services based on technological innovation.
Many researchers that are trying to develop NSD models aim to improve the process by considering the current trends in the service sector and customer behaviour and by evaluating the effectiveness of models developed in the past or their applicability to the current conditions. Unfortunately, there is a lack of tools covering the entire NSD cycle to manage this process at each stage []. Ref. [] point out the lack of tools to assess the NSD processes. Ref. [] emphasise that the new sophisticated model of NSD should include factors such as the participation of customers and employees, management support, the culture of innovation, and NSD strategy formation. According to [], the major models of NSD are too vague. Most of the models presented in the scientific literature are composed only of stages. External environments, tasks, or procedures related to this process are generally not included. Ref. [] claim that a new model of NSD should be developed because of the important role of service sector workers and customers in the overall process of NSD.
The available models for NSD still fail to explain many unclear aspects. It is observed that many NSD models found in the scientific literature are too narrow: they are focused on the dimension of a business entity only or they are dedicated to solving specific problems. With the rapidly changing needs of consumers and the increasing competitiveness in the service sector, an NSD model that focuses on the dimension of a company is no longer sufficient. Therefore, it should be necessary to supplement the new model with other dimensions. Usually, NSD models are formed without the justification of the suitability for the composition and methodology of application. These factors led to the formation of the NSD model with the data-based components that would make it possible to apply it flexibly in any business enterprise by determining a reasonable duration for the implementation of the whole process [].
The uniqueness of the proposed NSD model can be based on the following aspects:
- The structure of the proposed NSD model allows individual actions to be analysed both at different stages of the process and with regards to individual dimensions. This structure of the model includes the integrated dimensions of organisations, competitors, and consumers. As a result, it provides additional information about internal and external factors that may affect specific stages during the NSD process. By assessing the impact of such factors, a business entity can make rational NSD-related decisions before moving on to the next stage.
- All the actions set out in the new NSD model are detailed according to each stage and the location of the dimension in the model. However, the increased level of detail in the model does not complicate the practical application process. Firstly, actions are closely interlinked at each of the stages and across the different dimensions. Secondly, each action tells the business entity what goal should be achieved. It is not possible to move on to the next action without achieving the specified goals. Thirdly, the actions listed in the different dimensions indicate not only the tasks but also the role of other components included in the process (such as consumer involvement, interrelationship, evaluation of recommendations, suggestions, etc.). Finally, the completion of each stage is marked with an overall result, and without achieving this result, the business entity cannot move on to the next stage.
- The short-term post-launch review of NS monitoring was integrated into the implementation phase of the proposed NSD model. This solution solved three problems that are present in some other models of NSD: (1) defining when the development of the NS is completed and its full-scale launch might be started; (2) identifying the duration of the required monitoring (short-term or long-term); (3) identifying the areas where the knowledge gained from monitoring could be used.
The scientific literature offers many methods for effective process planning. These methods differ in terms of the consistency of the results, their completeness, the complexity of the application, and the time required for the implementation. Based on the results of the comparative analysis of the project management methods [], it was determined that it is appropriate to choose the PERT method for the empirical study of the proposed model because: (1) It is often combined with the Monte Carlo simulation in order to compare the results [,,,,]. Ref. [] compared project management techniques that are helpful when working with uncertain data. They found that the Monte Carlo simulation combined with the PERT method allows for more reliable results. (2) PERT provides a comprehensive outline of all key project activities and their interdependencies []. (3) The application of PERT uses a three-point estimation technique that creates an opportunity to plan a project when certain data are not available, i.e., not to apply the method to a parallel project that could take a very long time due to its size or complexity. Given the above aspects, the method of PERT allows for a reasonable duration of the project or its individual stages. The flexibility, adaptability, and easy application have led to the decision to use this method.
2. Methodology for Applying the Proposed Model
The methodology developed for the proposed model consists of the following steps: (1) research preparation, (2) data processing, (3) execution of research (Figure 1).
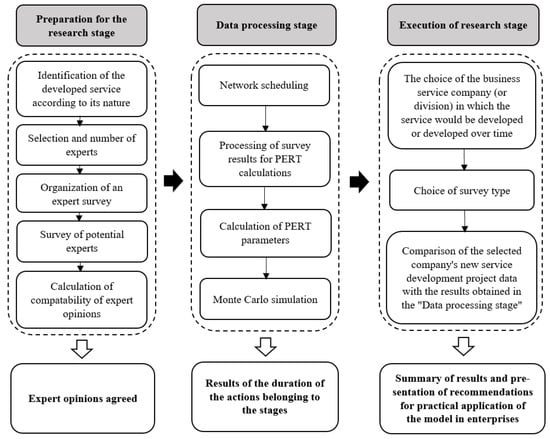
Figure 1.
Model application scheme (source: proposed by the authors).
The first stage focuses on aspects relating to the experts. The second stage is dedicated to the processing of the survey results for the calculations of the PERT and Monte Carlo methods. Finally, in the third stage, the calculation of the obtained results is verified at every step of the new service development. The verification can be done after the selection of a service-providing company where a new service (hereinafter—NS) is under development or has been developed in the recent years.
Identification of the developed service according to its nature. Given that many modern businesses develop new services, improve their delivery processes, and expand the range of services by considering consumer needs, changes in the competitive environment, and market-dominant technological innovations, the new NSD model and its implementation algorithm are recommended for all businesses that belong to at least one of the groups listed below []:
- A completely new service that has no equivalent in the world or in certain territories (cities, countries, regions). For example, a service with analogues in other countries is going to be developed/implemented in a country where it has not yet been launched (sharing services, self-service post offices, etc.).
- A company wants to change its business direction or expand its range of services (e.g., a company that is providing training services wants to start providing e-learning services to reach a larger circle of customers).
- A company has developed a product (such as an e-scooter) and is considering not only the idea of selling it but also the possibility of using this product in the provision of their services.
- A company regularly develops new technological solutions (e.g., artificial intelligence, cybersecurity, cloud enablement, etc.) that are adapted in the later stages of service provision, and such a company at the same time becomes both the developer and the administrator of the service.
Selection of experts. The consultants from [] point out that the information and communications technology sector (hereinafter—ICT) grew the fastest within the services sector during the period of 2007–2017. According to the data provided by [], the value of the developed services in the ICT sector was more than 3%, and the value of production was only 0.3% during the same period. It is also necessary to note that the activities related to coding and IT development generated the biggest value in the ICT sector (more than 49%) in 2017. According to [], it can be assumed that the choice of the ICT sector is favourable due to the innovative solutions it creates, which can be used in many other sectors. The parallel between the ICT and the energy sector can also be seen in the scientific literature about environmental sustainability [,], energy consumption [,], and even waste management []. The experts were selected from IT companies in Lithuania and Denmark, due to the consistent growth of the ICT sector, the rapidly growing need for specialists, and the widely used innovations. According to [], Denmark is one of the ten countries where Lithuania exports the biggest number of IT-based services. In the report of high-tech employment provided by [], it was observed that the fixed average annual employment growth rate in activities that require specific knowledge was the same in Denmark and Lithuania during the period of 2008–2017. Considering this information, it was proposed that experts should be selected according to their general competencies in the NSD process and their experience in the Lithuanian and Danish IT sectors where there are plans to implement new services. When determining the required number of experts, it was recommended to follow the methodological assumptions of [], suggesting that 7–9 experts are sufficient to ensure accurate results.
Organisation of an expert survey. Questionnaires were sent to the potential experts via e-mail due to the easier organisation of the survey, the low cost of time and money, the possibility to retain anonymity, and the convenience for the respondents.
Survey of the potential experts. Experts who participated in this study were selected from Lithuanian and Danish IT companies according to the following 5 criteria: (1) experience with an ongoing NS project or an NS project that has been completed in the recent years, (2) general work experience in business service companies (at least 11 years), (3) experience with NSD processes (at least 6 years), (4) education (university degree), (5) current job position (management position). The IT sector experts were interviewed to perform a three-point estimation and use these data for PERT and Monte Carlo modelling calculations.
The search was carried out in several stages, which allowed the probability to be reduced that the potential expert to whom the survey questionnaire would be sent did not meet all the criteria. Based on the expert selection criteria, Linkedin Sales Navigator was selected. In the first stage, this tool allowed the search to be narrowed according to the criteria of IT sector, current positions, and expert experience (years). In the second step, data files with expert contact details were configured using available personal contact search websites (e.g., RocketReach.co, Getemail.io, Hunter.io). This stage ensures that the survey form will not be sent via Linkedin but directly via email to the person of your choice. In this case, even if a person is wrongly selected, he or she may be rejected on the basis of the selection criteria set out in the questionnaire. In the third stage, the prepared survey questionnaires were sent directly to all potential experts. In the fourth stage, it was assessed whether the experts met the remaining criteria set for them, as well as whether the questionnaires were properly completed.
The questionnaire for Lithuanian experts was prepared in Lithuanian, and the questionnaires sent to Danish experts were prepared in English. The questionnaires (see Appendix A) were divided into four groups according to the required information: (1) the facts required to determine the suitability of potential experts to participate in the study, (2) the information required to determine whether an NS project is under development or has been developed recently in the represented company, (3) the three-point estimation, (4) two open questions to obtain additional information about the NSD processes. The questionnaires to the experts from Lithuanian and Danish IT companies were sent at the same time.
After completing the survey of potential experts, the selection of experts followed three successive stages: (1) analysing the answers provided in the questionnaires, (2) evaluating the information provided by the experts about NSD and its provision in the represented company, (3) assessing the number of the interviewed experts that meet the selection criteria.
In the first stage, incomplete questionnaires and those that reproduced the same values too many times should be rejected. After selecting only the properly completed questionnaires, the second stage can begin when it is necessary to evaluate whether a company is currently developing or has developed a new service within the set period. When the answer is “No”, these questionnaires must be rejected as the company does not meet this specific criterion. Once the selection has been narrowed again, the third stage assesses the information about the experts (their competencies according to the established criteria). It was proposed to select only those experts that meet the requirements of all three assessment stages for the compatibility of opinions.
A total of 65 experts from companies operating in the IT segment were invited to participate in the expert survey organised in Lithuania. Of those, 18 confirmed their participation, but only 8 were selected according to the set selection criteria. In Denmark, the questionnaire was sent to 72 experts at the initial stage to conduct the same survey. Of those, 13 experts agreed to fill in the questionnaires. However, only 8 participants met all the criteria.
The questionnaires were sent to Lithuanian and Danish experts by e-mail with the possibility to complete them in two ways: by filling in the questionnaire file that was attached to the email or by doing it directly on the website SurveyMonkey for which an active link was provided. In this way, the experts were able to choose the most acceptable and convenient way to participate.
Calculation of the compatibility of expert opinions. After selecting the suitable experts for the next stages, it is necessary to calculate the compatibility of their opinions. The questionnaires asked the experts to perform a three-point estimation for the entire NSD process. According to this, the compatibility of expert opinions was calculated in twelve groups (Table 1).

Table 1.
Recommended data entry table for three-point estimation.
Having divided all the listed durations of the actions belonging to the stages of the NS development into twelve groups, the compatibility of expert opinions is calculated. It is proposed that this should be calculated according to the criterion of chi-square χ2, when the number of the analysed objects (in this case, the actions assigned to the stages of the proposed model) is higher than 7 (m > 7).
Processing of the survey results for PERT calculations. Once it is ensured that the expert opinions in all twelve groups are consistent, it is necessary to establish the characteristics of the data situation for the variation lines of the actions assigned to each stage. When the number of experts is n, the n variations of PERT calculation can be performed. However, this would cost a lot of time and it is completely unnecessary. Therefore, it is suggested to calculate the arithmetic average, mode, or median depending on the values in the variation line (Table 1).
Calculation of the PERT parameters. After determining the measures of central tendency at each stage of the NS development, it is recommended that the obtained data for each stage is summarised. The PERT parameters can then be calculated: the PERT weighted average, the earliest and the latest deadlines for project-related events, and the work reserves.
Once the duration of the events has been determined, the periods of the tasks (in this case, the actions) can be calculated: the earliest start and end of the task, the latest start and end of the task, the time reserve, and the possible critical path. According to [,,], when calculating the parameters of the PERT grid, it is important to take the following conditions into account:
- The earliest start time of the work is equal to zero: ,
- the latest times of events are determined by assuming the latest time of the final event: ,
- when calculating the latest start time of the work (, it is assumed that: ,
- works without a reserve constitute a critical path.
The weighted average of PERT is equal to the probability of 50%. In addition to the above-mentioned factors, the standard deviation (SD) can be calculated, which shows how the individual observations are laid out in relation to the average (Figure 2). A 68% probability is equal to one sigma (σ). A 95% probability is equal to two sigmas (σ). When there are three sigmas (σ), the probability is 99.7%.
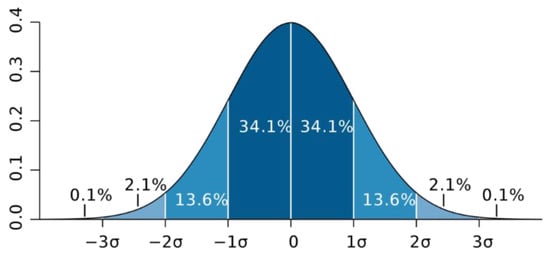
Figure 2.
Standard deviation.
Monte Carlo simulation. Because PERT calculations are performed with uncertain data, it is also recommended that the Monte Carlo simulation method be applied, which can ensure the planning reliability due to its functionality and possibility to combine it with the PERT method. According to [], the Monte Carlo simulation has many advantages. Firstly, this approach helps to solve issues that may be too complicated analytically (e.g., in chaotic models with many components). Secondly, this method opens the possibility to fully explore the space of problem parameters when the specific parameters are given. Finally, the obtained results are quite easy to interpret. Ref. [] claims that one of the biggest advantages of using the Monte Carlo method is the ability to assess the risks of the process duration. Ref. [] found that the result obtained by using the modelling method of Monte Carlo is closer to the practical end value of the project duration. By combining the simulation methods of PERT and Monte Carlo, it is possible to estimate the duration of the NSD process and to select the safest and closest value for the practical duration of a similar project.
The last stage is dedicated to carrying out the activities related to the empirical verification of the proposed model in a company that is currently developing a new service or has developed an NS in the recent years.
Selecting the companies. To determine the number of companies required for the proper verification of the proposed model, the criteria set out in similar research methodologies were adopted. Ref. [] presented a model for the process of developing new transport services for wheelchair users and tested it in practice in one company. A similar strategy was used by [], who tested the proposed conceptual NSD system empirically in one municipality of New Zealand. Ref. [] tested the proposed technical plan of NSD in practice at three biotechnology companies. Ref. [] conducted a case study to investigate the impact of NSD on the reorganisation of operational resources. Data were collected from three UK service providers (small and medium companies) that rely on the knowledge of their employees to solve the specific requirements of their customers. Given the above examples, it can be claimed that 2–3 companies are sufficient for the model verification.
Choosing the method for the expert survey. It was observed that many NSD-related studies tend to test the practical application of the proposed models or systems by using an interview method. Ref. [] tested the proposed NSD model by using a focus group discussion. A similar study was conducted by [] who used two methods: expert interviews and focus group discussion. To test the proposed model empirically, [] conducted in-depth interviews with the CEOs of service companies to obtain more information about the NSD practices. One of the most extensive studies to test the proposed NSD model was conducted by []: (1) semi-structured interviews via telephone to obtain information on current corporate practices of NSD, (2) workshops for research and for companies to present their ideas, (3) structured in-depth interviews conducted in the final stage, which allowed more detailed information to be obtained about the NSD processes and the ideas expressed during the workshops to be summarised.
Ref. [] used a great variety of survey methods, but the information about consumers and their involvement in the process of NSD was mainly collected by using the methods of interview and focus group discussion. According to the insights of the above-mentioned authors, it can be assumed that group surveys are the most appropriate method to conduct research about consumer involvement in NSD. Although the in-depth interviews can provide additional information about the NSD project or the company, it is very important to choose the most appropriate type of interview. According to the opinion of [,], standardised (structured) interviews are mostly used for quantitative research, while semi-structured and unstructured interviews are more suitable for qualitative research. Ref. [] notes that the format of a structured interview resembles a questionnaire when the aim is to collect one type of information from all respondents. Due to its characteristics, a standardised (structured) interview can be conducted not only in a face-to-face meeting but also by using other tools of communication (e.g., the internet, telephone, e-mail) or applications (e.g., Teams, Skype). Based on these aspects, the method of a standardised (structured) interview was chosen for the practical testing of the proposed model in service companies.
3. Discussion and Results
After systematising the obtained answers, the compatibility of the expert opinions was calculated (Table 2). Given that the number of objects under consideration (in this case, the actions assigned to the stages of the proposed model) is higher than 7 (m > 7), the compatibility of opinions provided by the experts was calculated according to the criterion of chi-square χ2. The calculations were performed using the IBM SPSS statistical software that improves the process of determining the compatibility of opinions.
Table 2.
Results of the compatibility of experts opinions.
According to the chosen level of significance α = 0.05 from the χ2 distribution table with the degree of freedom ν = 7, a critical value χkr2 was found to equal 14.07. After calculating the compatibility of the expert opinions according to the chi-square χ2criterion, it was found that the opinions were consistent (because χ2 > χkr2) and the results could be used in further stages of the study.
Based on the duration of actions provided by the experts, the measures of central tendency (arithmetic average, mode, or median) were determined in the next stage of the study. Although the opinions of Lithuanian and Danish experts were consistent in all groups, the extreme values in the variation lines may distort the data.
The results of the PERT weighted average show that in all stages of the NS development process, the duration of actions is longer in Lithuania (see Table 3).
Table 3.
PERT parameters.
After the calculation of the standard deviation in the case of Lithuania, the following results were obtained (Table 3): there is a 68% probability of completing the whole process in 467 to 501 days, a 95% probability of completing the whole process in 450 to 517 days, and a 99.7% probability of completing the whole process in 434 to 534 days.
When the calculation was repeated in the case of Denmark, the following results were obtained (Table 3): there is a 68% probability of completing the whole process in 412 to 447 days, a 95% probability of completing the whole process in 395 to 464 days, and a 99.7% probability of completing the whole process in 378 to 481 days.
According to the results, it can be claimed that it is not possible to completely avoid indeterminacy in the process. Even with historical data, the implementation of the ongoing project is unpredictable and some unexpected events may change its course. Following this insight, it is appropriate to additionally apply the Monte Carlo simulation that fits perfectly with the PERT method. Thousands, or even millions, of random variable mutations are used in the Monte Carlo simulation. The distribution of probability generated by this method is extremely accurate. As a result, this is one of the most popular methods used in project planning and management processes.
The Monte Carlo simulation was performed using the @RISK software from the Palisade Decision Tools software package. By using the RiskPERT function, the Monte Carlo simulation opens the possibility to set the duration required to perform an action/step/process. This duration is determined by performing 1–100 mathematical simulations where 100–n iterations are performed optionally. To obtain the most accurate results, it is necessary to choose the correct number of iterations required to perform the action/step/process. In the case of the NS development in the Lithuanian IT sector, two mathematical simulations were performed (with 100,000 and 1,000,000 iterations) (Table 4).
Table 4.
Monte Carlo simulation results.
A control test was performed during the Monte Carlo simulation to verify whether the process duration obtained by the PERT calculation is the same or similar to the result obtained by the mathematical modelling. The process duration obtained by calculating the PERT weighted average (484.0) (Table 3) and the Monte Carlo simulation (480.9) was found to be very similar. Therefore, it can be stated that the RiskPERT function selected in the @RISK software is suitable for this type of modelling.
The calculations for the cases of Lithuania and Denmark showed that within 99% the duration of the activities is longer than under the PERT method. According to [,,], such a deviation is likely or possible if similar studies and their results are followed.
When a different number of iterations was set in the @RISK software in the case of the NS development in the Lithuanian IT sector, the same results were obtained. According to the set number of iterations, similar results were also obtained in the case of Denmark. Therefore, it can be assumed that the chosen number of iterations is adequate to ensure reasonable results.
4. Results of Testing the Model in the IT Companies
The application of the proposed model in the service-providing companies (in this case, the IT sector) was conducted in December of 2020. Some Lithuanian experts who performed the three-point estimation agreed to participate in the further stages of the study. It must be noted that all the necessary information to determine the competencies of the experts, as well as the information about the ongoing, or completed, NSD projects in a company was collected in the previous stage of the research. Taking these aspects into account, the only criterion that was established was for the company to comply with the legal definition of Article 3 of [], which states that: (1) micro-enterprises include those companies that have less than 10 employees and their annual income consists of less than EUR 2 million; (2) small enterprises include those companies that have less than 50 employees and their annual income consists of less than EUR 10 million; (3) medium enterprises include those companies that have less than 250 employees and their annual income consists of less than EUR 50 million.
Based on the data of [] published in the publication Number of Enterprises Operating in Lithuania by Legal Forms and Number of Employees, it was concluded that a major part of Lithuanian companies has 0–9 employees. In total, there are 72,542 enterprises of this type. The number of enterprises with 10 to 49 employees is 12,264, and there are 2901 companies that have 50 or more employees. Regarding the official form of legal entities, most companies are registered as limited liability companies and individual enterprises. Based on the data of [], the structure of the Lithuanian ICT sector is similar to the overall picture of Lithuania and the EU. In 2018, a major part of legal entities in the ICT sector consisted of micro-enterprises (employing up to 10 employees), while the rest of the market was occupied by SMEs in IT. Although the majority consists of companies that are classified as micro-enterprises, a big number of these companies and their annual establishment processes are accompanied by a number of de-registrations of large companies. According to the data of the [], approximately 10,000 enterprises classified as SMEs were registered in Lithuania during 2017–2019. During the same period, 4000 companies of this type were de-registered. Given this information, three companies were selected for the interviews: one micro-enterprise (with less than 10 employees) and two small companies (with less than 50 employees).
According to the author of [], ensuring anonymity is essential. To keep the experts participating in the study anonymous, the names of the IT companies were coded: VS1, S1 and S2. The first IT company (VS1) belongs to the group of micro-enterprises in terms of the SME entity status. In 2020, the company had 7 employees. This company has been operating for less than 5 years, and it focuses on developing IT-based solutions that provide data transfer, sharing, and storage services.
The second IT company (S1) belongs to the group of small enterprises in terms of the SME entity status. In 2020, the company had more than 13 employees. This company has been operating for more than 5 years, and it is engaged in IT projects of various profiles, such as the development of electronic payment platforms, archiving systems, and data automation systems.
The third IT company (S2) belongs to the group of small enterprises in terms of the SME entity status. In 2020, the company had more than 18 employees. This company has been operating for more than 5 years. It works with IT projects related to data security and storage, as well as the development of programming and analytical tools.
To test the proposed NSD model empirically, a closed interview-type standardised (structured) questionnaire was prepared. According to the stages of the proposed model (preparation, analysis, formation, realisation), it was divided into 4 parts that contained 8 actions. For each of the actions, additional explanations were provided. The aim of the study was to empirically test the formed NSD model with every stage (preparation, analysis, formation, and realisation), getting the actual durations of execution of the NS project currently being developed, or having already been completed, in the IT sector. The actual values provided by the experts create an opportunity to compare them with the values of the durations obtained and modelled during the research. The interviews were conducted remotely (taking the pandemic situation of 2020 into account).
The proposed interview method and its application methodology for checking the validity of the NSD model have several key advantages:
- Data can be obtained faster. IT projects generally take more than a year to be fully completed. The duration for implementing more complex and larger projects can sometimes take even longer. Therefore, obtaining data for each development stage of the NS would probably take a lot of time.
- Better scope for data comparison. The data of standardised (structured) closed interviews can be collected simultaneously from several companies of different sizes. As a result, there is a possibility to compare the results obtained across the different sections, i.e., not only with the results of PERT and Monte Carlo simulations but also across the companies.
- It is easier to collect the information. The IT companies that belong to the groups of micro and small enterprises based on their SME status often develop technological solutions with the aid of European Union funds. Therefore, some additional subjects such as experts, partners, and controlling authorities can also participate in the projects. Meanwhile, medium-sized IT companies tend to use Agile methods that are focused not only on the long-term goals but also on team activities (across the employees, departments, and companies). These aspects suggest that data collection could possibly be complicated at times due to the nature of the projects carried out in a company or the number of the involved participants.
The proposed verification method of the NSD model has some limitations. An NS is not developed in real conditions (using the proposed model in parallel from the beginning to the end of the project). It is also difficult to determine whether the proposed methodology is compatible with other methods.
After comparing the figures from PERT and Monte Carlo simulation with the actual data of the implementation of the IT projects provided by the representatives of the companies, the following results of the study were obtained (Table 5).
Table 5.
Summarised research results (Lithuania).
The total implementation duration of the NSD process in the companies (VS1, S1, S2) fits in with the result range of PERT (99%) and Monte Carlo (99.7%): 534.23 ≤ IT company ≤ 708.33. This information proves that the three-point estimation performed by the selected experts is reliable. It can also be claimed that the proposed NSD model and the application methodology can be applied in the case of NSD by allowing a company to set a reasonable timeframe for each stage. The fact that some of the stages were completed earlier than expected leads to the question of whether the model and its application methodology would remain valid in the case where the process is completed earlier or later than expected. According to some authors [,,], the paradox of project planning that defines the main feature of this process is uncertainty. As a result, it can be claimed that there is a possibility of a difference between the planned and the actual results because the NSD process can be affected by various factors (e.g., a reduction of the budget, redundancies, force majeure). The methodology of the proposed model can be used as a support tool for planning a reasonable duration of activity implementation and for meeting deadlines. Given the data from the companies VS1, S1, and S2, it can be said that some of the stages are implemented faster. As a result, companies would have time to implement other actions and stages while still having the opportunity to complete the project earlier than planned when implementing their NS development project under real-life conditions. If a company needs more time than expected to complete one stage, it can still keep on planning the future stages in advance to finish the project on time. Although the duration of implementation provided by some companies does not fit in the timeframe suggested by the PERT and Monte Carlo methods, the NSD model and the application methodology developed for NSD can help to plan the process and ensure the maximum time accuracy of every action. Firstly, it is possible to plan the time by combining both methods and choosing the safest duration estimate. Secondly, adopting the best practices of the projects that are being developed, or have already been implemented, in other service-providing companies is an option. Thirdly, it is possible to compare the actual NS development durations of the previous stages with the modelled cases and to plan the time of the further stages of the project accordingly. Finally, a business entity can rely on the best practices of foreign project planning if such data was used for modelling.
It is recommended that the proposed model and the methodology developed for it be applied for the following reasons. Firstly, it is a helpful tool that allows a business entity to plan the duration of actions and to meet the set deadlines. Secondly, the application of the proposed model is not complex. Although it is yet unknown whether it is possible to use the proposed model and its application methodology with other project management methods, it is assumed that this support tool could be applied both individually and in combination with other tools. Finally, the proposed model and the methodology do not require significant financial resources. The only additional tool a business entity is required to use is the software for the Monte Carlo simulation. However, the proposed model and its application methodology require a certain amount of time that the business entity would have to devote to the expert surveys and the processing of the submitted data.
Based on the results of the empirical research, it is possible to provide basic recommendations that would allow the successful application of the new NSD model in business enterprises. The proposed model has been tested in IT companies. As a result, it is recommended to apply it only to those NSD projects whose implementation is based on IT application.
It is suggested to involve the CEOs, directors, and other senior employees for the three-point estimation. Senior employees of the service sector typically have a lot of experience and competencies gained during the planning processes of NSD. Where possible, it is also recommended to select experts from the same sector and in the same job roles.
It is appropriate to apply and combine PERT and Monte Carlo methods in the NS development process. For the most accurate planning of the duration of the whole process, it is recommended to account for every action. Based on the obtained results, it is possible to plan which actions should be implemented first and what could be done later. It is also possible to set a time reserve.
5. Conclusions
Given the uncertainties that businesses face when developing new services, the originality of this study is based on the proposed decisions to obtain a reasonable time frame for the implementation of the activities, as well as an extended approach to the possibilities and benefits of using the PERT and Monte Carlo methods to improve this process. The results of the study contribute to the scientific literature with new knowledge of the development of new services and contribute to the continuity of research on the subject.
The results revealed that the timeframe of the development of new services can be planned in the following ways: first is combining the PERT and Monte Carlo methods, which allows for the safest duration estimates; second is adopting the best practices of other service projects; and finally is using the estimated durations model of the NSD process and comparing the data with the actual durations.
The results of the study proved that it is possible to determine reasonable durations of the process implementation by combining both methods. As a result, a business entity can focus on these durations while carrying out the project activities. Accordingly, due to its universal composition (rationally selected stages, dimensions, and assigned actions), the proposed NSD model could be adopted by other fields or platforms (e.g., engineering, energy, construction, sharing services, etc.) when a new service needs to be developed.
Despite the scope of the investigation, it has several limitations. In particular, the study was carried out in one sector only, which makes it difficult to assess the application of the proposed model in the context of other sectors. Secondly, although the simulated duration of the activities was compared to the actual duration, more precise options for the model and its application would require a parallel approach from the start to the end of the project. Finally, it is not entirely clear whether the model is compatible with other methodologies. Further theoretical guidelines for the development of the argument, conditioned by the scope of the study, could focus on the triangulation of data or the use of several methods, thereby improving the internal and external validity of the study. A wider corporate model test would also allow for more information on the methods used at individual stages of the development of new services and on the possibilities for improving the model.
Author Contributions
I.S. writing—review and editing; P.Š. writing—original draft. Both authors have read and agreed to the published version of the manuscript.
Funding
This research received external funding from Vilnius Gediminas Technical University.
Institutional Review Board Statement
Not applicable.
Informed Consent Statement
Not applicable.
Data Availability Statement
Data sharing not applicable.
Conflicts of Interest
The authors declare no conflict of interest.
Appendix A. Questionnaire of Lithuanian and Danish Experts (for Three-Point Estimation)
Dear expert,
I am a doctoral student at Vilnius Gediminas Technical University, Faculty of Business Management, and working on my research called Modelling of Service Development Process. The aim of this research is to formulate the intermediate recommendations for the improvement of new services development and to prepare for the approval of the proposed model in the company that is developing a new service after determining the duration of work at each stage of the process of new service development. In order to achieve the aim, I kindly ask you to assign the following evaluations to the actions assigned to each stage of the model (preparation, analysis, formation, realization): (1) optimistic, the shortest duration; (2) the most expected value of the duration; (3) pessimistic, the longest duration. Your answers will help to determine all possible durations of work.
Based on the ethics of researchers, I undertake and warrant you that all requirements of confidentiality will be respected and fulfilled. If you wish, I can send you the summarized results of this survey after completing the research. I am grateful for your insights.
General Information about an Expert
| 1. | Represented company (write in) | |
| 2. | Education (write in) | |
| 3. | Job position (write in) | |
| 4. | Total work experience in the service sector (in years) (underline the best option or specify your own) | 0–3 6–10 16–20 4–5 11–15 21–25 Other (please specify) |
| 5. | Your experience in creating, developing and introducing new services to the market (in years) (underline the most appropriate option or write your own answer) | 0–3 6–10 16–20 4–5 11–15 21–25 Other (please specify) |
| 6. | Would you agree to participate in another stage of the research if necessary? (underline) | Yes No |
| 7. | Would you like to see the final results of the research that would be sent to you via this e-mail? (underline) | Yes No |
Information about the Development and Provision of New Services in the Representative Company
| 1. | Is your company currently developing a new service or has launched a new service during a period of one year? (underline) | Yes No |
| 2. | Has the company you represent currently or no more than one year ago developed a product that would be used by your company or another company to provide a service? (underline) | Yes No |
| 3. | Has the company you represent currently or no more than one year ago developed technological solutions that would be used by the company you represent or other companies to provide a service or improve the delivery process (e.g., reduce time costs, distribute customer flows, etc.)? (underline) | Yes No |
Information about Duration of the Individual Tasks Assigned to the Stages of New Service Development
Choose the values of work duration (days) to the individual tasks assigned to the stage of preparation
| No. | Individual tasks of the stage | Duration of work (in days) | ||
| optimistic time | most likely time | pessimistic time | ||
| 1. | Identifying the demand to develop a new service (taking the market trends, competitive environment, prevailing environmental conditions, and user experience into account) | |||
| 2. | Generating new ideas (generating ideas according to the identified need to develop a new service) | |||
| 3. | Employee involvement in the process of new ideas generation (staff selection, process coordination, evaluation of ideas) | |||
| 4. | Customer involvement in the process of new ideas generation (process coordination, evaluation of ideas) | |||
| 5. | Evaluation of exceptionality of the newly generated ideas | |||
| 6. | Evaluation of possibility to realize the newly generated ideas in the current market conditions or in the current technological way | |||
| 7. | Evaluation of the relevance of the idea to potential customers | |||
| 8. | Evaluation of the relevance of the idea to specific groups of customers | |||
Choose the values of work duration (days) to the individual tasks assigned to the stage of analysis
| No. | Individual tasks of the stage | Duration of work (in days) | ||
| optimistic time | most likely time | pessimistic time | ||
| 1. | Evaluation of the general preparation of staff (identification of available, missing, and additionally required competencies) | |||
| 2. | Evaluation of the possible expenses incurred during the development of a new service | |||
| 3. | Competitor analysis | |||
| 4. | Evaluation of the possibility to apply innovations to the newly developed service | |||
| 5. | Evaluation of licenses (evaluation and identification of patents, licenses, or other limiting factors) | |||
| 6. | Identifying the specific needs of customers | |||
| 7. | Assessment of ideas proposed by customers towards the newly developing service (evaluation of customer expectations and experiences when the conceptual service has not yet been tested) | |||
| 8. | Portrait formation of the targeted customer (e.g., according to age, education, generation (baby boomers, X, Y, Z), incomes) | |||
Choose the values of work duration (days) to the individual tasks assigned to the stage of formation
| No. | Individual tasks of the stage | Duration of work (in days) | ||
| optimistic time | most likely time | pessimistic time | ||
| 1. | Employee involvement in the development process of a conceptual service (staff selection, process coordination) | |||
| 2. | Simulation of conceptual service delivery among company employees (process monitoring, evaluating the observations of employees) | |||
| 3. | Elimination of shortcomings of a conceptual service identified by employees | |||
| 4. | Training of employees involved in the process of new service development (development of necessary competencies) | |||
| 5. | Threat assessment of potential new competitors | |||
| 6. | Customer involvement in the process of testing a conceptual service (selection of target customers, process coordination and monitoring) | |||
| 7. | Assessment of observations and recommendations expressed by customers (process monitoring, evaluating the observations of customers) | |||
| 8. | Elimination of shortcomings of a conceptual service identified by customers | |||
Choose the values of work duration (days) to the individual tasks assigned to the stage of realization
| No. | Individual tasks of the stage | Duration of work (in days) | ||
| optimistic time | most likely time | pessimistic time | ||
| 1. | Preparing a marketing plan for a newly developed service (selection of marketing channels, implementation of selected marketing solutions) | |||
| 2. | Formulating the pricing of a new service | |||
| 3. | Choosing the distribution channels for the new service | |||
| 4. | Evaluating the response of the direct competitors to the newly developed service | |||
| 5. | Improvements caused by the reaction of direct competitors (technological improvements, set an earlier date of launching, changes in pricing) | |||
| 6. | Trial release of the newly developed service to the customers | |||
| 7. | Short-term post-launch assessment of a newly developed service | |||
| 8. | Execution of the minor changes before the full-scale launch | |||
Open Questions
Which steps of the new service development process (preparation, analysis, formation, realization) usually require more time than it was planned?
________________________________________________________________________________________________________
In which of the steps involved in the development of new services do you usually feel the greatest need to save extra time?
________________________________________________________________________________________________________
References
- Kitsios, F.; Kamariotou, M. Mapping new service development: A review and synthesis of literature. Serv. Ind. J. 2019, 40, 682–704. [Google Scholar] [CrossRef]
- Gustafsson, A.; Snyder, H.; Witell, L. Service Innovation: A New Conceptualization and Path Forward. J. Serv. Res. 2020, 23, 111–115. [Google Scholar] [CrossRef]
- Heimonen, J.; Kohtamäki, M. Measuring new product and service portfolio advantage. Int. Entrep. Manag. J. 2018, 15, 163–174. [Google Scholar] [CrossRef]
- Bhuiyan, N.A. framework for successful new product development. J. Ind. Eng. Manag. 2011, 4, 746–770. [Google Scholar] [CrossRef][Green Version]
- Koku, P.S. New-Product Introduction. In Decision Making in Marketing and Finance; Palgrave Macmillan: New York, NY, USA, 2014. [Google Scholar]
- Edvardsson, B.; Meiren, T.; Schaefer, A.; Witell, L. Having a strategy for new service development—Does it really matter? J. Serv. Manag. 2013, 24, 25–44. [Google Scholar] [CrossRef]
- Torney, M.; Kuntzky, K.; Herrmann, C. Service Development and Implementation—A Review of the State of the Art. In Proceedings of the 1st CIRP Industrial Product-Service Systems (IPS2) conference, Cranfield, UK, 1–2 April 2009; pp. 1–8. [Google Scholar]
- Jin, D.; Chai, K.; Tan, K. New service development maturity model. Manag. Serv. Qual. Int. J. 2014, 24, 86–116. [Google Scholar] [CrossRef]
- Dhargalkar, K.; Shinde, K.; Arora, Y. A universal new product development and upgradation framework. J. Innov. Entrep. 2016, 5, 27. [Google Scholar] [CrossRef]
- Santos, J.B.; Spring, M. New service developement: Managing the dynamic between services and operations resources. Int. J. Oper. Prod. Manag. 2013, 33, 800–827. [Google Scholar] [CrossRef]
- Stevens, E.; Dimitriadis, S. Managing the new service development process: Towards a systemic model. Eur. J. Mark. 2005, 39, 175–198. [Google Scholar] [CrossRef]
- Kindström, D.; Kowalkowski, C. Development of industrial service offerings: A process framework. J. Serv. Manag. 2009, 20, 156–172. [Google Scholar] [CrossRef]
- Mckinsey & Company. How to Make Sure Your Next Product or Service Launch Drives Growth. 2017. Available online: https://www.mckinsey.com/business-functions/marketing-and-sales/our-insights/how-to-make-sure-your-next-product-or-service-launch-drives-growth (accessed on 7 September 2019).
- Jian, Z.; Liu, Y. The Impacts of Customer Interaction and Social Capital on New Service Development Performance. Am. J. Ind. Bus. Manag. 2016, 6, 1133–1145. [Google Scholar] [CrossRef][Green Version]
- Melton, H.L.; Hartline, M.D. Customer and Frontline Employee Influence on New Service Development Performance. J. Serv. Res. 2010, 13, 411–425. [Google Scholar] [CrossRef]
- Carbonell, P.; Escudero, A.I.R.; Pujari, D. Customer Involvement in New Service Development: An Examination of Antecedents and Outcomes. J. Prod. Innov. Manag. 2009, 26, 536–550. [Google Scholar] [CrossRef]
- Gaus, O.; Neutschel, B.; Raith, M.G.; Vajna, S. How Designed Communication Supports New Product & Service Development. iBusiness 2013, 5, 10–17. [Google Scholar] [CrossRef]
- Hsu, P.H. Constructing a Innovative Service Development Process Base on Ethics. Int. J. Soc. Sci. Humanit. 2017, 7, 76–81. [Google Scholar] [CrossRef]
- Storey, C.; Perks, H. Mixing rich and asynchronous communication for new service development performance. R&D Manag. 2014, 45, 107–125. [Google Scholar] [CrossRef]
- Backmann, J.; Hoegl, M.; Cordery, J.L. Soaking It Up: Absorptive Capacity in Interorganizational New Product Development Teams. J. Prod. Innov. Manag. 2015, 32, 861–877. [Google Scholar] [CrossRef]
- Deloitte. Deloitte Technology Fast 50 Central Europe 2020: Powerful Connections. 2020. Available online: https://www2.deloitte.com/content/dam/Deloitte/ce/Documents/fast50/ce-technology-fast-50-results-report-2020.pdf (accessed on 20 March 2021).
- Klein, R. Modellgestütztes Service System Engineering—Theorie und Technik Einer Systematischen Entwicklung von Dienstleistungen; Springer: Wiesbaden, Germany, 2007. [Google Scholar]
- Santana, F.E.; Cardoso, C.C.; Ferreira, M.G.G.; Catapan, M.F.; Montanha, I.R.; Forcellini, A.F. Towards a more inclusive service development process for the wider population. Des. Stud. 2018, 55, 146–173. [Google Scholar] [CrossRef]
- Biemans, W.G.; Griffin, A.; Moenaert, R.K. New Service Development: How the Field Developed, Its Current Status and Recommendations for Moving the Field Forward. J. Prod. Innov. Manag. 2016, 33, 382–397. [Google Scholar] [CrossRef]
- Skačkauskienė, I.; Švogžlys, P.; Lemańska-Majdzik, A. Formation of a Conceptual Model for New Services. Pol. J. Manag. 2019, 19, 374–384. [Google Scholar] [CrossRef]
- Švogžlys, P. Modeling of Services Development Process. Ph.D. Thesis, Vilnius Gediminas Technical University, Vilnius, Lithuania, 15 June 2021. [Google Scholar]
- Hahn, E.D.; Martín, M.M.L. Robust project management with the tilted beta distribution. SORT-Stat. Oper. Res. Trans. 2015, 39, 253–272. [Google Scholar]
- Hajdu, M. Effects of the application of activity calendars on the distribution of project duration in PERT networks. Autom. Constr. 2013, 35, 397–404. [Google Scholar] [CrossRef]
- Hendradewa, A.P. Schedule Risk Analysis by Different Phases of Construction Project Using CPM-PERT and Monte-Carlo Simulation. In Proceedings of the IOP Conference Series: Materials Science and Engineering, Makasar, Indonesia, 27–29 November 2018; Volume 528, p. 012035. [Google Scholar] [CrossRef]
- Koulinas, G.K.; Xanthopoulous, A.S.; Tsilipiras, T.T.; Koulouriotis, D.E. Schedule Delay Risk Analysis in Construction Projects with a Simulation-Based Expert System. Buildings 2020, 10, 134. [Google Scholar] [CrossRef]
- Tysiak, W. Risk Management in Projects: The Monte Carlo Approach versus PERT. In Proceedings of the 6th IEEE International Conference on Intelligent Data Acquisition and Advanced Computing Systems: Technology and Applications, Prague, Czech Republic, 15–17 September 2011; pp. 906–910. [Google Scholar]
- Wyrozębski, P.; Wyrozębska, A. Challenges of project planning in the probabilistic approach using PERT, GERT and Monte Carlo. J. Manag. Mark. 2013, 1, 1–8. [Google Scholar]
- Aziz, R.F. RPERT: Repetitive-Projects Evaluation and Review Technique. Alex. Eng. J. 2014, 53, 81–93. [Google Scholar] [CrossRef]
- Skačkauskienė, I.; Švogžlys, P. Evaluation of Composition Suitability of the Model for New Service Development. J. Bus. Econ. Manag. 2021, 22, 847–866. [Google Scholar] [CrossRef]
- Mckinsey Global Institute. Globalization in Transition: The Future of Trade and Value Chains. 2019. Available online: https://www.mckinsey.com/featured-insights/innovation-and-growth/globalization-in-transition-the-future-of-trade-and-value-chains (accessed on 8 January 2020).
- Eurostat. ICT Sector—Value added, Employement and R&D. 2017. Available online: https://ec.europa.eu/eurostat/statistics-explained/index.php/ICT_sector_value_added,_employment_and_R%26D#The_size_of_the_ICT_sector_as_measured_by_value_added (accessed on 20 January 2021).
- Grandi, P.; Khanna, S.; Ramaswamy, S. Which Industries Are the Most Digital (and Why?). 2016. Available online: https://hbr.org/2016/04/a-chart-that-shows-which-industries-are-the-most-digital-and-why (accessed on 15 April 2021).
- Murshed, M. An empirical analysis of the non-linear impacts of ICT-trade openness on renewable energy transition, energy efficiency, clean cooking fuel access and environmental sustainability in South Asia. Environ. Sci. Pollut. Res. 2020, 27, 36254–36281. [Google Scholar] [CrossRef]
- Nathaniel, S.P.; Murshed, M.; Bassim, M. The nexus between economic growth, energy use, international trade and ecological footprints: The role of environmental regulations in N11 countries. Energ. Ecol. Environ. 2021, 1–17. [Google Scholar] [CrossRef]
- Arshad, Z.; Robaina, M.; Botelho, A. The role of ICT in energy consumption and environment: An empirical investigation of Asian economies with cluster analysis. Environ. Sci. Pollut. Res. 2020, 27, 32913–32932. [Google Scholar] [CrossRef]
- Xiaoyong, Z.; Dequn, Z.; Qunwei, W.; Bin, S. How information and communication technology drives carbon emissions: A sector-level analysis for China. Energy Econ. 2019, 81, 380–392. [Google Scholar]
- Vlachokostas, C. Closing the Loop Between Energy Production and Waste Management: A Conceptual Approach Towards Sustainable Development. Sustainability 2020, 12, 5995. [Google Scholar] [CrossRef]
- Bank of Lithuania. Exports and Imports of Services by Type of Service and Country 2020. Available online: https://www.lb.lt/en/exports-and-imports-of-services-by-type-of-service-and-country (accessed on 7 June 2020).
- Eurostat. High-Tech Statistics—Employment. Average Annual Growth Rate of Employment in KIA in 2008–2017. 2019. Available online: https://ec.europa.eu/eurostat/statistics-explained/pdfscache/46747.pdf (accessed on 5 December 2020).
- Libby, R.; Blashfield, R.K. Performance of a composite as a function of the number of judges. Organ. Behav. Hum. Perform. 1978, 21, 121–129. [Google Scholar] [CrossRef]
- Karabulut, M. Application of Monte Carlo simulation and PERT/CPM techniques in planning of construction projects: A Case Study. Period. Eng. Nat. Sci. 2017, 5, 408–420. [Google Scholar] [CrossRef]
- Li, L.; Zhou, S.; Deng, T. Application of Activity-on-arrow Network in Product Development Management. In Proceedings of the IOP Conference Series: Materials Science and Engineering, Guangzhou, China, 20–22 December 2019; Volume 806, p. 012058. [Google Scholar]
- Tsolaki, A.S. PERT/CPM. 2018. Available online: http://apppm.man.dtu.dk/index.php/PERT/CPM (accessed on 12 September 2020).
- Howard, J. Monte Carlo Simulation Advantages and Disadvantages. 2019. Available online: https://jameshoward.us/2019/09/07/monte-carlo-simulation-advantages-and-disadvantages/ (accessed on 12 September 2020).
- Deshmukh, P.; Rajhans, N.R. Comparison of Project Scheduling techniques: PERT versus Monte Carlo simulation. Ind. Eng. J. 2018, 11, 1–10. [Google Scholar] [CrossRef][Green Version]
- Shekar, A. An Innovative Model of Service Development: A process guide for service managers. Innov. J. Public Sect. Innov. J. 2007, 12, 1–18. [Google Scholar]
- Rapaccini, M.; Saccani, N.; Pezzotta, G.; Burger, T.; Ganz, W. Service development in product-service systems: A maturity model. Serv. Ind. J. 2013, 33, 300–319. [Google Scholar] [CrossRef]
- Bolderston, A. Conducting a Research Interview. J. Med. Imaging Radiat. Sci. 2012, 43, 66–76. [Google Scholar] [CrossRef]
- Bryman, A. Integrating quantitative and qualitative research: How is it done? Qual. Res. 2006, 6, 97–113. [Google Scholar] [CrossRef]
- Alshenqeeti, H. Interviewing as a Data Collection Method: A Critical Review. Engl. Linguist. Res. 2014, 3, 39–45. [Google Scholar] [CrossRef]
- Law on the Development of Small and Medium Enterprises of the Republic of Lithuania. 2017. Available online: https://e-seimas.lrs.lt/portal/legalAct/lt/TAD/468c37b3dd5211e6be918a531b2126ab (accessed on 12 January 2021).
- Statistics Lithuania. Number of Enterprises in Operation and Persons Employed in Them by Legal FORM and personnel Group at the Beginning of the Year. 2021. Available online: https://osp.stat.gov.lt/statistiniu-rodikliu-analize?hash=ffc222a4-14df-4de3-bafe-779342ad3aff#/ (accessed on 12 January 2021).
- Eurostat. Business Demography by Size Class (from 2004 onwards, NACE Rev. 2). 2018. Available online: https://ec.europa.eu/eurostat/databrowser/view/bd_9bd_sz_cl_r2/default/table?lang=en (accessed on 20 January 2021).
- Statistics Lithuania. Business in Lithuania: SMEs in Operation. 2020. Available online: https://osp.stat.gov.lt/verslas-lietuvoje-2020/veikiancios-svv-imones (accessed on 12 November 2020).
- Flemming, J.; Zegwaard, K.E. Methodologies, methods and ethical considerations for conducting research in work-integrated learning. Int. J. Work.-Integr. Learn. 2018, 19, 205–213. [Google Scholar]
- Mäntysalo, R.; Kangasoja, J.K.; Kanninen, V. The paradox of strategic spatial planning: A theoretical outline with a view on Finland. Plan. Theory Pract. 2015, 16, 169–183. [Google Scholar] [CrossRef]
- Samset, K.; Volden, G.H. Front-end definition of projects: Ten paradoxes and some reflections regarding project management and project governance. Int. J. Proj. Manag. 2016, 34, 297–313. [Google Scholar] [CrossRef]
- Zandvoort, M.; Van der Vlist, M.J.; Klijn, F.; Van den Brink, A. Navigating amid uncertainty in spatial planning. Plan. Theory 2018, 17, 96–116. [Google Scholar] [CrossRef]
Publisher’s Note: MDPI stays neutral with regard to jurisdictional claims in published maps and institutional affiliations. |
© 2021 by the authors. Licensee MDPI, Basel, Switzerland. This article is an open access article distributed under the terms and conditions of the Creative Commons Attribution (CC BY) license (https://creativecommons.org/licenses/by/4.0/).