Article

The Morphology and Differentiation of the Content of International Debate on Renewable Energy. A Bibliometric Analysis of Web of Science, Scopus, and Twitter

by
Katarzyna Sanak-Kosmowska
* and
Jan W. Wiktor
*
Department of Marketing, Cracow University of Economics, 31-510 Cracow, Poland
*
Authors to whom correspondence should be addressed.
Energies 2021, 14(21), 7094; https://doi.org/10.3390/en14217094
Submission received: 30 September 2021 / Revised: 18 October 2021 / Accepted: 20 October 2021 / Published: 30 October 2021

Abstract

:
This paper aims to identify a bibliometric profile, presenting the results of research and debates in social media on renewable energy sources (RES). It analyses current scientific publications (2019–2021) and tweets posted in July 2021 by international Twitter users. The subject of the study is an analysis of key words in articles, the results of research, and the content of tweets (hashtags #renewables) related to renewable energy (RE) as well as an assessment of the morphology of content and the degree of its differentiation in the analysed data resources. The conducted analysis facilitates an assessment of similarities of key words in scientific papers and the content of debates in social media—on Twitter, a global platform. In its methodological dimension, the work is based on a bibliometric analysis (articles in both bases) and the analysis of Twitter data. This methodological approach allows for identifying the main trend, profile, and bibliometric characteristics of scientific papers representing two streams of information: articles in bases and the content (hashtags) of authentic and unguided international debates on Twitter. The focus on this platform results from a great popularity of social media as a platform for social debate, expressing comments and opinions and providing an opportunity to gain understanding of social, cultural, and environmental issues related to renewable energy sources from the perspective of social media participants. The objective of the paper and the proposed methodological approach relates to a knowledge gap in the area of renewable energy, and, more specifically, climate change and sustainable development.

1. Introduction

The problem undertaken in the paper is significant in its cognitive and methodological dimensions. It relates to offering an answer to the following questions: to what extent is the issue of renewable energy reflected in scientific research studies published in Scopus and WoS, and is this problem presented in the form of spontaneous and unguided discussions on Twitter? Seeking a specific product of various streams of information: the co-occurrence, similarity, or differentiation of the content of key words in the abstracts of scientific papers on renewable energy and the categories of tweets in RE hashtags is an interesting and significant issue in its cognitive aspect. The paper has four parts. Section 1, Introduction, presents a theoretical framework of the title problem. It points to the significance of RES in solving problems related to climate change. Section 2, Materials and Methods, presents the characteristics of the applied methods and sources of data. The analysis is based on two types of data: scientific publications in Scopus and Web of Science (2019–2021), and tweets posted by Twitter users in July 2021. Section 3, Discussion, presents a discussion on the obtained results: 2443 key words related to “renewable energy” in papers published by WoS and Scopus, and 18,000 tweets posted by 1598 international Twitter users (including 448,116 key words and 1124 hashtags “#Renewableenergy”). The discussion focuses on three analytical themes: most prolific authors, top themes, and key words and co-occurrence of key words. The analysis allows for answering the key question: to what extent do key words in articles coincide with words used on Twitter? Part 4 presents a synthesis of the results of research and analyses, and describes research limitations and further research directions in analysing the title problem. The paper presents the results of the authors’ research and may have a considerable cognitive value. It contributes to the knowledge about the bibliometric profile of research studies and their results, and social debates in social media related to renewable energy sources, climate change, environmental protection, and the contemporary world’s sustainable development.
Research studies on renewable energy sources represent a significant area of international scientific research related to sustainability, climate change, and the development of methods of counteracting the negative and multidimensional effects of global warming [1,2,3,4,5].
Issues related to renewable energy in the context of sustainable development and climate change are complex and multidimensional. It is a truly global problem, affecting everybody everywhere, presently and in the future. It is not placed within political, social, or economic boundaries [6,7]. It has an international, national, and local dimension in the context of political declarations and decisions, legal regulations, economic policies (including climate, energy, and environmental policies) [8,9,10,11,12,13], business, technical, technological and social activities, educational standards, and the social awareness of sustainability and climate change, consumer lifestyles, households, and consumption related to demand for energy and the potential, sources, and structure of its supply [14,15,16,17,18,19,20,21,22,23,24]. These issues are undertaken in research studies representing various areas and disciplines of social sciences, and widely discussed in the media including social media (Figure 1). This is an important context justifying the title problem of the paper.
Renewable energy issues are a significant element of international activities including those carried out by the UN and its agencies, The Intergovernmental Panel on Climate Change (IPCC) [25], The International Renewable Energy Agency (IRENA) [26], the EU, expert and research centres, as well as universities. Reductions in greenhouse emissions require coordinated cooperation and solutions developed at international, global, and local (national) levels in the areas related to science, politics, and social matters. This is the only way in which the world can adopt a decarbonization strategy, shift towards a zero- or low-emission economy (e.g., [27]), and prevent a climate catastrophe. These issues are of key significance in the context of the title problem of the paper.
The original and historical significance is attributed to the Report of the World Commission on Environment and Development, Our Common Future United Nations, 1987 (Report G.H. Brundtland [28]). The WCED Report is important for several reasons: it creates and defines the concept of sustainability, it is the first international document of such great impact, and it defines threats resulting from anthropogenic climate changes.
The United Nations Framework Convention on Climate Change (UNFCCC) (the Earth Summit, Rio de Janeiro, 1992) set the goals and principles for international cooperation aimed to reduce greenhouse emissions responsible for climate change [29].
The findings of the Earth Summit and the Framework Convention are updated annually at the COP (UN Conference of the Parties). They have specific formal characteristics corresponding to international legal standards. They are also subject to in-depth scientific analyses and social assessments. They are not presented and evaluated in this paper. We only wish to stress the significance of two fundamental documents: the Kyoto Protocol and the Paris Agreement. The Kyoto Protocol (1997–2012) supplements and operationalises the UNFCCC. It is an international agreement which, despite much controversy, aims to counteract global warming. It specifies negotiated reductions in greenhouse gas emissions until 2012, which are annexed to the treaty (by at least 5% to reach the level of 1990) [30].
The COP21 conference in Paris, the United Nations Framework Convention on Climate Change, 21st Conference of the Parties, adopted the Paris Agreement (XI’2016). The Agreement was the first universal and binding document concerning climate change, aimed to reduce greenhouse gas emissions and to promote decarbonization and RES development. The Agreement committed all countries (195 countries ratified the Paris Agreement) to submit up to 2020 long-term plans of reducing greenhouse gas emissions in accordance with the IPCC methodology to achieve the threshold of 2 °C, and, as a target, 1.5 °C above pre-industrial levels in order to mitigate the risk and damage caused by climate change. [31,32].
The UN Agenda for Sustainable Development Goals (2015) [33] identifies 17 Sustainable Development Goals and 169 targets to be achieved by the world by 2030. The goals and targets refer to 5 areas—5xP: people, planet, prosperity, peace, and partnership. Without going into detail, we wish to stress that the structure of goals and targets of the 2030 Agenda points to the significance of actions aimed to counteract climate change and its negative effects through RE development. Goal 13 is of key significance: “Take urgent action to combat climate change and its impacts”. The causes of climate change (greenhouse gas emissions), and targets and recommendations for particular countries are identified in this very context. A crucial role in the activities in this area is played by renewable energy sources (RES). According to the 2030 Agenda, combating climate change is a global challenge. Climate changes and global warming affect all the continents. They are mainly caused by greenhouse gas emissions resulting from human activities and the lack of sustainability—the effect of the excessive use of energy based on fossil fuels (hard coal, oil, earth gas, and uranium derived from mined ore). Presently, greenhouse gas emissions are the highest in the history of meteorological observations [34,35,36]. The effects of climate changes are reflected in the anomalies of historically shaped weather patterns, the intensity of extreme weather conditions, and the rising levels of seas and oceans. These changes will have a major impact on the lives of individuals, societies, economies, and the world of nature. The impacts of these changes are presented by, e.g., J.S. Goldstein and S.A. Qvist [37] and D. Wallace-Wells [38]. In this context, goals and targets are set for reducing the pace of average annual warming rates to 3%. This specific goal is set by the Kyoto Protocol [30] and the Paris Agreement [31], as well as the EU agenda (its specific goals referred to particular member states) [39].
A significant trend of activities aimed to counteract adverse changes, or even a climate catastrophe, is attributing greater importance to renewable energy sources (RES) and decarbonization and a shift of the energy sector, industries, transport, agriculture, and households towards an economy based on clean technologies. Clean energy is based on renewable sources which are replenished in relatively short periods of time (solar energy, water, wind, biomass, biofuels, geothermal energy, and, with some reservations, nuclear energy generated in a closed fuel cycle using FBR reactors) [40,41,42]. Table 1 presents major types of renewable energy sources.
Renewable sources reduce the production and emission of greenhouse gases and contribute to achieving sustainable development goals and solving the world’s climate problem.
According to REN 21 data, RES accounted for 17.7% of the global supply of electricity in 2019 [43] (see also the results based on the BP technology [44]) with considerable differences in the share of RES in particular countries and regions. There are also differences in RES investment outlays, their structure, the costs of “the green transformation”, subsidy systems implemented in many countries under their climate policies, and the energy efficiency of such solutions, especially in short periods of time [45,46,47]. In 2019, renewable energy represented 19.7% of the energy consumed in the EU-27, only 0.3% short of the 2020 target of 20%. Figure 2 presents the overall share of energy from renewable sources in Europe in 2019, based on Eurostat Research.
An important role in EU and EEA countries is played by the directive on promoting energy based on renewable energy sources [48].
The role of the green transformation of the EU economy is stressed in “Fit for 55” (17 July 2021). The programme identifies the actions of the EU and member states aimed to achieve a 55% reduction in emissions by 2030 (as compared with 1990). With regard to RES, it proposes amendments to the directive on renewable energy sources (RED II). Its objective is to increase the share of RES in the EU energy mix from 32% to approx. 38–40%. The specific recommendations relate to such issues as the framework for hydrogen certification and changes of criteria for sustainable biomass aimed to increase its use in energy generation. It is an element of the EU’s energy policy designed to achieve neutrality in 2050 [49,50].
An important aspect of debates on RES is the confrontation of political, social, and economic options related to arguments in favour of and against renewable energy, particularly nuclear energy. RES advocates stress the positive effects of green energy and the possibility of eliminating the adverse impacts of the use of fossil fuels on climate, economy, environment, society, public health, and life quality. Simultaneously, the opponents point to significant investment outlay and low profitability, additional environmental costs, not fully proven effects of RES, or the links between climate issues and left-wing political movements. Some representatives of ecological and climate movements feel strongly against nuclear energy (e.g., [51,52]). Despite the objective results of research studies of climate changes and official international declarations and agreements, the lack of social confidence and bias remain unchanged (see [2]).
A broader analysis of RES is not required here. We only wish to stress that interest in renewable energy is fully justified. Apart from political and legal activities and systems for monitoring sustainability goals (e.g., [53]), RES are also the subject of interest to studies undertaken by a number of disciplines (e.g., [54]). RE issues are the subject of extensive studies, assessments, and recommendations in social sciences, including economics, management sciences, and political science, as well as natural and technical disciplines. Such undertakings take the form of diagnostic analyses, projects, and evaluations. Some projects, implemented by international networks (epistemic communities, P. Haas, [55]) have an interdisciplinary character. They relate to different aspects of RES—technical, environmental, economic, and political. They contribute to a better understanding of RE issues, providing explanations and interpretations, and creating trends for developing and implementing international and national programmes [56,57,58,59,60].
In the analyses of the causes of global warming and in creating directions for the RES-based energy transformation, there is a general consensus among scientists, confirmed by national and international academies of science and professional associations and research institutes, e.g., Intergovernmental Panel on Climate Change, IPCC [25,61].
According to C. Mathers, out of 24,210 abstracts of scientific papers on climate change published in 2013–2014 only five (0.02%) deny man’s impact on global warming [62].
On 9 August 2021, the Intergovernmental Panel on Climate Change (IPCC) presented the assumptions of Report VI concerning climate change. The Report was based on the analysis of 14,000 scientific studies on global warming. The document, on the basis of an appropriate methodological approach, presents a scenario and the trajectory of changes and effects of global warming in the coming decades (source: climate change is widespread, rapid, and intensifying [63]).
RES issues attract the attention of the media, inspiring and moderating social debates on sustainability, climate change, and renewable energy. A special role in such debates is played by social media. Based on many-to-many relationships (Hoffman and Novak [64]), they perform numerous or even all the functions attributed to the media (McQuail [65]).
We should emphasise that the literature on the subject contains many original methodological and research approaches to the issue of RES. Some of the researchers focus on the topics related to selected countries using comparative analyses [66]. It is also worth paying attention to the research based on the data mining classification methods [67].
Bibliometric analysis is an important tool in exploring RE—the title problem. This method is widely used in assessing RE research studies, their trends and classifications by areas and disciplines, publications in particular countries, and changes in the course of time (e.g., [68,69,70,71]). Bibliometric analysis is also a basis for the study presented in this paper.

2. Materials and Methods

The analysis presented in this paper is based on two types of sources. The first is the data obtained from a bibliometric analysis of scientific publications in Scopus and Web of Science. The other source is tweets posted by Twitter users.

2.1. Bibliometric Analysis

According to A. Prichard [72], bibliometrics is a set of research techniques that can be used in analysing publications. Presently, bibliometric analysis is a widely used research method, allowing authors to systematically review literatures (e.g., [73]), map the thematic structures of selected terminology (e.g., [74]), and identify research trends (e.g., [68]).
Bibliometrics is an important and rapidly developing trend in the analysis of science and its achievements carried out within the framework of the science of science communication, research information, and the analyses of science development as an information process [75]. Bibliometrics is a process of literature analysis based on mathematical and statistical methods. It is a way of documenting and analysing the status of the scientific knowledge of the world and its problems and describing the forms of presenting research results.
Bibliometric analyses give much attention to formal and methodological issues and definitions. These areas are of crucial importance in bibliometrics [76,77,78,79,80].
It is important to identify, following the proposal of D. Nicholas and M. Richte [79], two components, or approaches and trends: descriptive bibliometrics and behavioural bibliometrics. Descriptive bibliometrics describes and analyses, using statistical methods, the characteristics (parameters) of scientific publications, and it describes the institutional structure of science and research areas. Behavioural bibliometrics focuses “on the analysis of relations between the characteristics of scientific publications on the basis of the analyses of citations” ([75], p. 17). In the context of the development of scientific literatures, bibliometric analysis is an indispensable tool of formal research studies in science and studies of science, and its significance is as great as that of scientific research itself. There are a number of dimensions and approaches in bibliometrics, which are dependent on research goals. It is also important from the perspective of the objective of this paper. Bibliometric analyses have their autotelic value and, simultaneously, a utilitarian character—their results facilitate an analysis of scientific research and scientific steams of information on a massive scale in the area of specific RE-related issues, as well as social debates on Twitter, comparative analyses, and assessments of differences and similarities at an international level. An example of such resources and streams of information in scientific research are scientific publications indexed in the Scopus and WoS databases as well as tweets posted by Twitter users.
Bibliometric analyses offer various possibilities, but they also have limitations, particularly in social sciences, including economics and its research subsystems, political science, international relations, and management sciences. In recent years research has much focused on online resources, and the analysis of Twitter data, its principles, and specific online characteristics is a significant component of bibliometric sciences including webometrics [81]. A key function of bibliometrics is the registration of accomplishments, their scientific description using adopted characteristics and criteria (e.g., key words and abstracts), assessments of the impact of authors and works on the development of science (a given discipline), and the evaluation of scientific journals and their significance as platforms for formalised scientific communication. This function is supplemented—in accordance with the logic of scientific research—by seeking and identifying certain patterns and laws which serve to describe generalised and specific results. Examples of such patterns in bibliometrics include Bradford’s law of scattering [82], Lotka’s law [83], and Zipf’s law [84]. An analysis of bibliographic material—massive information resources and streams—is a basis for formulating generalizations, but consideration should also be given to natural limitations with regard to time, space, and forms of publications.
We emphasise clearly that in the field of research on renewable energy sources, the use of the bibliometric analysis method has a long history. Among the numerous studies conducted by international authors, studies devoted to specific issues deserve special attention: selected technologies [85,86], economic and social problems [87,88], research trends [89,90,91,92], supply chain [93,94], and trends and future RES [95,96,97].
All bibliometric analyses are characterised by specific time- and space-related factors. They can take the form of narrow (local), medium, and broad (global) analysis, and the criterion of range can refer to space, the size of bibliographic databases, the number of measurement units, etc.
According to Corsini et al. [98], there are a number of benefits resulting from the use of bibliometric methods: (i) a broad review of scientific literatures, (ii) a broader base for problem assessment as compared with traditional, sometimes biased, reviews of specific scientific works, and (iii) contemporary bibliometric analyses based on massive streams of scientific information have a greater cognitive value than subjective analyses. Bibliometric analyses can be divided into three main groups: (i) review techniques, (ii) evaluative techniques, and (iii) relational techniques. In management sciences, Zupic and Cater propose workflow recommendations for mapping scientific research based on bibliometric methods [99]. The authors identify the following phases of work: (1) project design, (2) compilation of bibliometric data, (3) analysis, (4) visualization, and (5) interpretation. The proposed research procedure coincides with PRISMA recommendations [100,101]. Figure 3 presents the phases of work related to the bibliometric analysis conducted for the purpose of this paper. Scopus and Web of Science (WoS) queries were executed on 27 July 2021:
Scopus: TITLE-ABS-KEY (“renewable economy”) AND PUBYEAR > 2018 AND PUBYEAR < 2022
WoS: TS = (“renewable economy”), Indexes = SCI-EXPANDED, SSCI, A&HCI, CPCI-S, CPCI-SSH, BKCI-S, BKCI-SSH, ESCI, CCR-EXPANDED, IC Timespan = 2019–2021.
Search results—in accordance with the adopted procedure—are presented in Table 2.
Attention should be given to a considerable difference in the number of records in Scopus and WoS (relation 1–1.32), as well as a relatively low share of all publications in “social sciences” (9.64%) in the total group of publications identified under keyword “renewable energy”. Figure 2 presents the share (%) of other scientific areas in the OECD classification. Nearly half of publications in Scopus (45.9%) are classified as Engineering and Energy. It is also the case of Web of Science—46% of papers are classified as Energy Fuels, 21% as Science Technology, 20% as Engineering, and merely 2% as Economics. Such results are partially justified. They reflect technical sciences’ interest in RES (Engineering and Energy) and practices in this area. They represent the original and natural spheres of these disciplines and their focus on solving specific problems related to RES development, seeking new techniques and technologies, developing R&D activities, and innovative solutions, as well as analyses and development work in the field of green energy. In both Scopus and Web of Science, 99% of papers are published in English. Among papers belonging to the discipline of social science, which contain the keyword “renewable energy”, the overwhelming majority of publications represent authors from the USA (463 in Scopus (0.97%) and 1250 in Web of Science (1.98%)) and China (399 in Scopus (0.84%) and 1488 in Web of Science (2.36%)). This result can be attributed to the real sphere: in 2010–2020, China (USD 916.5 billion) and the USA (USD 443.9 billion) were the largest investors in REN (excluding large hydropower [43]). We regard it as a significant cognitive value of the analysis. It contributes to debates on RES and provides insights into the morphology of the problem from the perspective of linking the international differentiation of scientific publications in social sciences to the investment outlays of countries represented by the largest number of publications.
A large number of papers in the analysed field come from India, the UK, Germany, Spain, and Australia. Figure 4 presents a map of country specific production, developed for bibliometric records in the final base as a result of combining search results in Scopus and Web of Science for the needs of bibliometric analysis (N = 2443).

2.2. Twitter Analysis

The analysis of posts published by Twitter users is a relatively new research technique, which is used on an increasing scale in social sciences, particularly in sociology, psychology, political sciences, and management sciences. Conducting a structured analysis of tweets can result not only in content analysis [102] and describing Twitter users’ characteristics but also in sentiment analysis [103]. A detailed review of the sentiment analysis techniques of Twitter data is presented by Alsaeedi and Khan [104,105]. The research study presented in this paper gives special attention to the use of an appropriate and reliable method of collecting tweets. Consideration is given to one of three research methods:
  • Data collection using MAXQDA2020 [106];
  • Data collection using Add-on for Google Docs Tweet Archiver [107];
  • Data collection using “rtweet” for R [108].
All the above methods have a number of advantages, but they do not allow for collecting historical data older than 7 days. Such a possibility is provided by search_fullarchive for R, available along with Twitter Academic API Developer. Additionally, rtweet allows for collecting a maximum of 18,000 tweets, and for this reason it is used in this paper for the needs of our analyses. The limitation mentioned above on the number of analysed tweets limits the possibility of a broader inference about the studied dependencies. For this reason, we emphasise some caution in result analysis. From the point of view of the purpose of this article, it complies with methodological standards and meets methodological rigour.
Tweeter query was executed on 27 July 2021: search_fullarchive (#renewableenergy, n = 18,000, from Date = 202106170000, to Date = 202107270000).
Due to the number of tweets marked by the analysed hashtag, it was not possible to use the same analytical period for articles in Scopus and WoS. However, this methodological approach was regarded as appropriate in the context of the goal of the paper and the characteristics and limitations of the analysis of Twitter data. Search results are presented in Table 3.
The base of tweets created in this way was then subject to introductory 4-phase analysis and cleaning.
The first phase analysed the authors of tweets. The use of rtweet allowed for identifying 1600 unique users adding tweets or retweets marked by the hashtag #renewableenergy.
Their locations were checked in the second phase (Figure 5). It is an important element of the analysis of tweets. It should be noted that locations are provided by users in an arbitrary way—not all Twitter users turn on the location function and provide such information along with posts. In total, the analysed users provided more than 399 different locations. Most tweeters do not disclose their locations, which is widely discussed in social media ([64,109,110]). In addition, it should be noted that scientific debates are dominated by China and the USA, and in the case of Twitter such activities carried out by Chinese internet users are not recorded or simply not disclosed.
In the third phase of the analysis special attention is given to text messages and the use of tweeters’ hashtags. Preparations for data mining included the removal of such graphical signs as emoticons and stars, as well as acronyms “http” and “https”. In order to create a list of unique words in tweets, the applied hashtags were unified (#Renewableenergy, #RenewableEnergy, #renewables, #renewableenergies, and #RenewableEnergies). The fourth phase, using tidytext, reconverted text to lowercase (to avoid text duplications resulting from variations in capitalization), removed punctuation, and assigned a unique ID associated with the tweet. These were significant editing and formal steps resulting from the methodological standard of the analysis of Twitter data and the characteristics of the applied analytical packages.
The introductory bibliometric analysis was conducted using VOS Viewer software, developed by Van Eck and Waltman [111]. The main advantage of this software is the easy visualisation of the co-citation network. The next step was the use of R package Bibliometrix [112] and other R packages [113]. To achieve the main goal of the study, we also used text2vec, which allows for creating the matrixes of the analysed records. The records were then referred to the results of Twitter analysis. Twitter data was collected using rtweet [114]. Some of the analyses were based on MAXQDA2020. The comparison of keywords in scientific papers in both bases and tweets was based on Pearson’s chi-squared statistical test.

3. Results

An in-depth bibliometric analysis aimed to achieve the goals of the paper, focused on three main areas:
  • Most prolific authors;
  • Top themes and keywords;
  • Co-occurrence of keywords.

3.1. Most Prolific Authors

The most prolific authors, both of articles and tweets, have been identified.
A group of 20 authors published 6–13 articles on RES. Six authors published more than 10 texts. In the case of Scopus and Web of Science, in the analysed period (2019–2021), the following researches authored or co-authored the most considerable quantity of documents (above nine, the number is given in parentheses): Wang Y. (13), Zhang Y. (12), Liu J. (11), Zhang C. (11), Zhang J. (11), and Mohammadi-Ivatloo B. (10). The list of authors who had six or more publications in selected years is presented in Figure 5. As already mentioned, out of 2443 articles the largest numbers came from China (517 publications in combined Scopus and WoS bases), the USA (474 publications), India (361), UK (241), Germany (235), and Spain (232). Additionally, the analysis focused on the most relevant affiliations. The results indicated that scientific centres most frequently affiliating research on “renewable energy” included (above 20, the number is given in parentheses) Denmark’s Aalborg University (33 articles), China’s North China Electric Power University (32), Tsinghua University (21), and the University of California in the USA (21).
The most productive nicknames were acquired in the studied collection of tweets. Figure 6 presents top users in #renewableneergy among 1598 analysed users. More than 600 #renewableenergy hashtags were added by the following tweeters: johnSNOWMTAINER (present on Twitter since June 2018, in July 2021: 2671 followers), EnergyrefferalX (present on Twitter since June 2019, in July 2021: 1795 followers), and RepublicofNatu1 (present on Twitter since April 2019, 491 followers). All the above users focus on environmental-related issues. Other top users are presented in Figure 7.
It should be noted that only 268 users in “renewableenergy” had a verified account in the analysed period. The blue checkmark “Verified on Twitter” informs users that an account which arouses public interest is authentic. To get blue verified, an account must be reliable, noteworthy, and active. The user’s identity must be confirmed by an official page name and an ID photo. A verified account should also be affiliated with a recognizable institution, brand, or public figure. It indicates that tweets marked as “renewableenergy” were mainly posted by individual users.

3.2. Top Themes and Keywords

The other area of discussion was an analysis of top themes and keywords. First, the analysis comprised articles from Scopus and Web of Science. The use of Bibiometrix allowed for counting words and their co-occurrence. The analysed items included titles and abstracts as well as keywords. The analysis of titles resulted in identifying four most popular words (bigrams): renewable energy (495 occurrences), energy transition (72 occurrences), sustainable development (65 occurrences), and energy consumption (52). An analysis of the co-occurrence of words in abstracts and keywords led to similar results. The occurrence of keywords in the analysed articles is visualised in Figure 8 in the form of a WordCloud.
The identification of keywords in the analysed publications and the use of VOSviewer is a basis for hierarchical cluster analysis. Keywords were selected with more than 45 repetitions, excluding geographical names, for the sample of 2443 (publications from Web of Science) (95% probability, 2.06% confidence interval). The conducted analysis (the results are presented in Figure 9) allows for identifying seven clusters. Their characteristics, comprising a synthesis of 968 keywords, are shown in Table 4.
Hierarchical cluster analysis leads to the conclusion that the characteristics through keywords are clearly positive. Most keywords express “positive narration” related to new technologies, the significance of RES, social changes and positive social attitudes to climate change, and the role of RES as a counteracting factor. This is a significant diagnostic conclusion of the analysis. Simultaneously, it corresponds to the results of other studies presented in the Introduction, including those conducted by C. Mathers. This conclusion is a major contribution to scientific and social debates on RE, and fills existing knowledge and methodological gaps. It can arouse readers’ interest and promote a positive attitude to the energy and climate challenges of the contemporary world. Additionally, it can contribute to international debates and debates in social sciences, and inspire and promote the role of RES at an international, national, and local level. In turn, keywords related to negative phenomena mostly appear in cluster 3 (described by keywords related to ecology—115 items) and cluster 6 (keywords related to education and the necessity to counteract threats—95 items).
The use of “hashtagcloud” in rtweet allows for creating an analogous WordCloud for tweets marked with hashtag “renewableenergy”. Due to it being the subject of search in this analysis, hashtag “renewableenergy” is not included in Figure 10.
Due to the nature of a large number of the analysed keywords (968), we decided to conduct tweet sentiment analysis. The analysis was based on sentimentr for R. The package makes use of a technique called the “bag of words”, dividing a sentence into particular words, and each word is referred to as a “gram”. All punctuation signs, with the exception of punctuation breaks, are removed, and an algorithm checks each word in a dictionary to check whether it is a positive or negative word. However, instead of ignoring context, the sentimenter app pays attention to negators—reversing words. Amplifiers and de-amplifiers were also considered and weighted. Giving consideration to the above, the algorithm assigns a result to each sentence based on the equation of sentiment scores with a positive result indicating positive sentiment, and a negative result is assigned to negative sentiment. The higher the result, the higher the intensity of sentiment. The results were visualised using plot_ly (Figure 11). Out of 18,000 tweets, 3178 (17.66%) were negative, 9040 (50.22%) were neutral, and 5782 (32.12%) were positive. These results can be regarded as moderately positive. On the one hand, they show a considerable advantage (1–1.82) of positive tweets over negative. On the other hand, attention should be given to neutral tweets (50.22%). Such results show the extent of social interest in RES on Twitter, and, with some methodological reservations, this important conclusion can be referred to other social media platforms. Apart from a critical diagnosis, we conclude that institutions which deal with RE, climate, and sustainability actively participate in social media debates and the moderation of unbiased discussions, characterised by well-founded arguments and the power of persuasion. This is the way to create a powerful platform for social activities in support of the concept of RE and its positive impact on climate protection.
At the beginning of the analysis, the spelling of all keywords and hashtags was unified by introducing small letters and removing spaces. Then, two sets were combined by using the keyword WORDS$ as an identifier of the same keyword, and all items were filtered which were counted at least once for the same WORD$. For the RxC test, i.e., Pearson’s chi-squared statistical test, the set was narrowed down to at least 4-fold counts—both in the column of keywords (MOST) and the column of hashtags (HASH). The result of the test using R (chisq.test(chi2$MOST, chi2$HASH) points to a strong correlation between both sets: statistic = 2262.308, 1971 degrees of freedom, p = 4.507 × 10⁻⁶ (Figure 12).
Due to the obtained result indicating a strong correlation between the sets, we also decided to conduct ordinary least regression analysis. The keyword and the hashtag “renewable energy” were intentionally excluded from the set prepared in the course of the analysis—this word was a criterion for identifying articles and tweets, and for this reason it was overrepresented in the analysed sets.
Regression analysis pointed to a moderate correlation between keywords from the analysed scientific articles and tweeters’ hashtags (coefficient of determination R2 = 0.169). Interestingly (and importantly from a scientific perspective), the coefficient of determination has a similar value in the case of a more reasonable distribution of residuals if, instead of the counts of hashtags, their logarithm is taken into account. This observation can indicate that the frequency of the occurrence of hashtags increases exponentially (Figure 13).
The main results of the analysis are as follows:
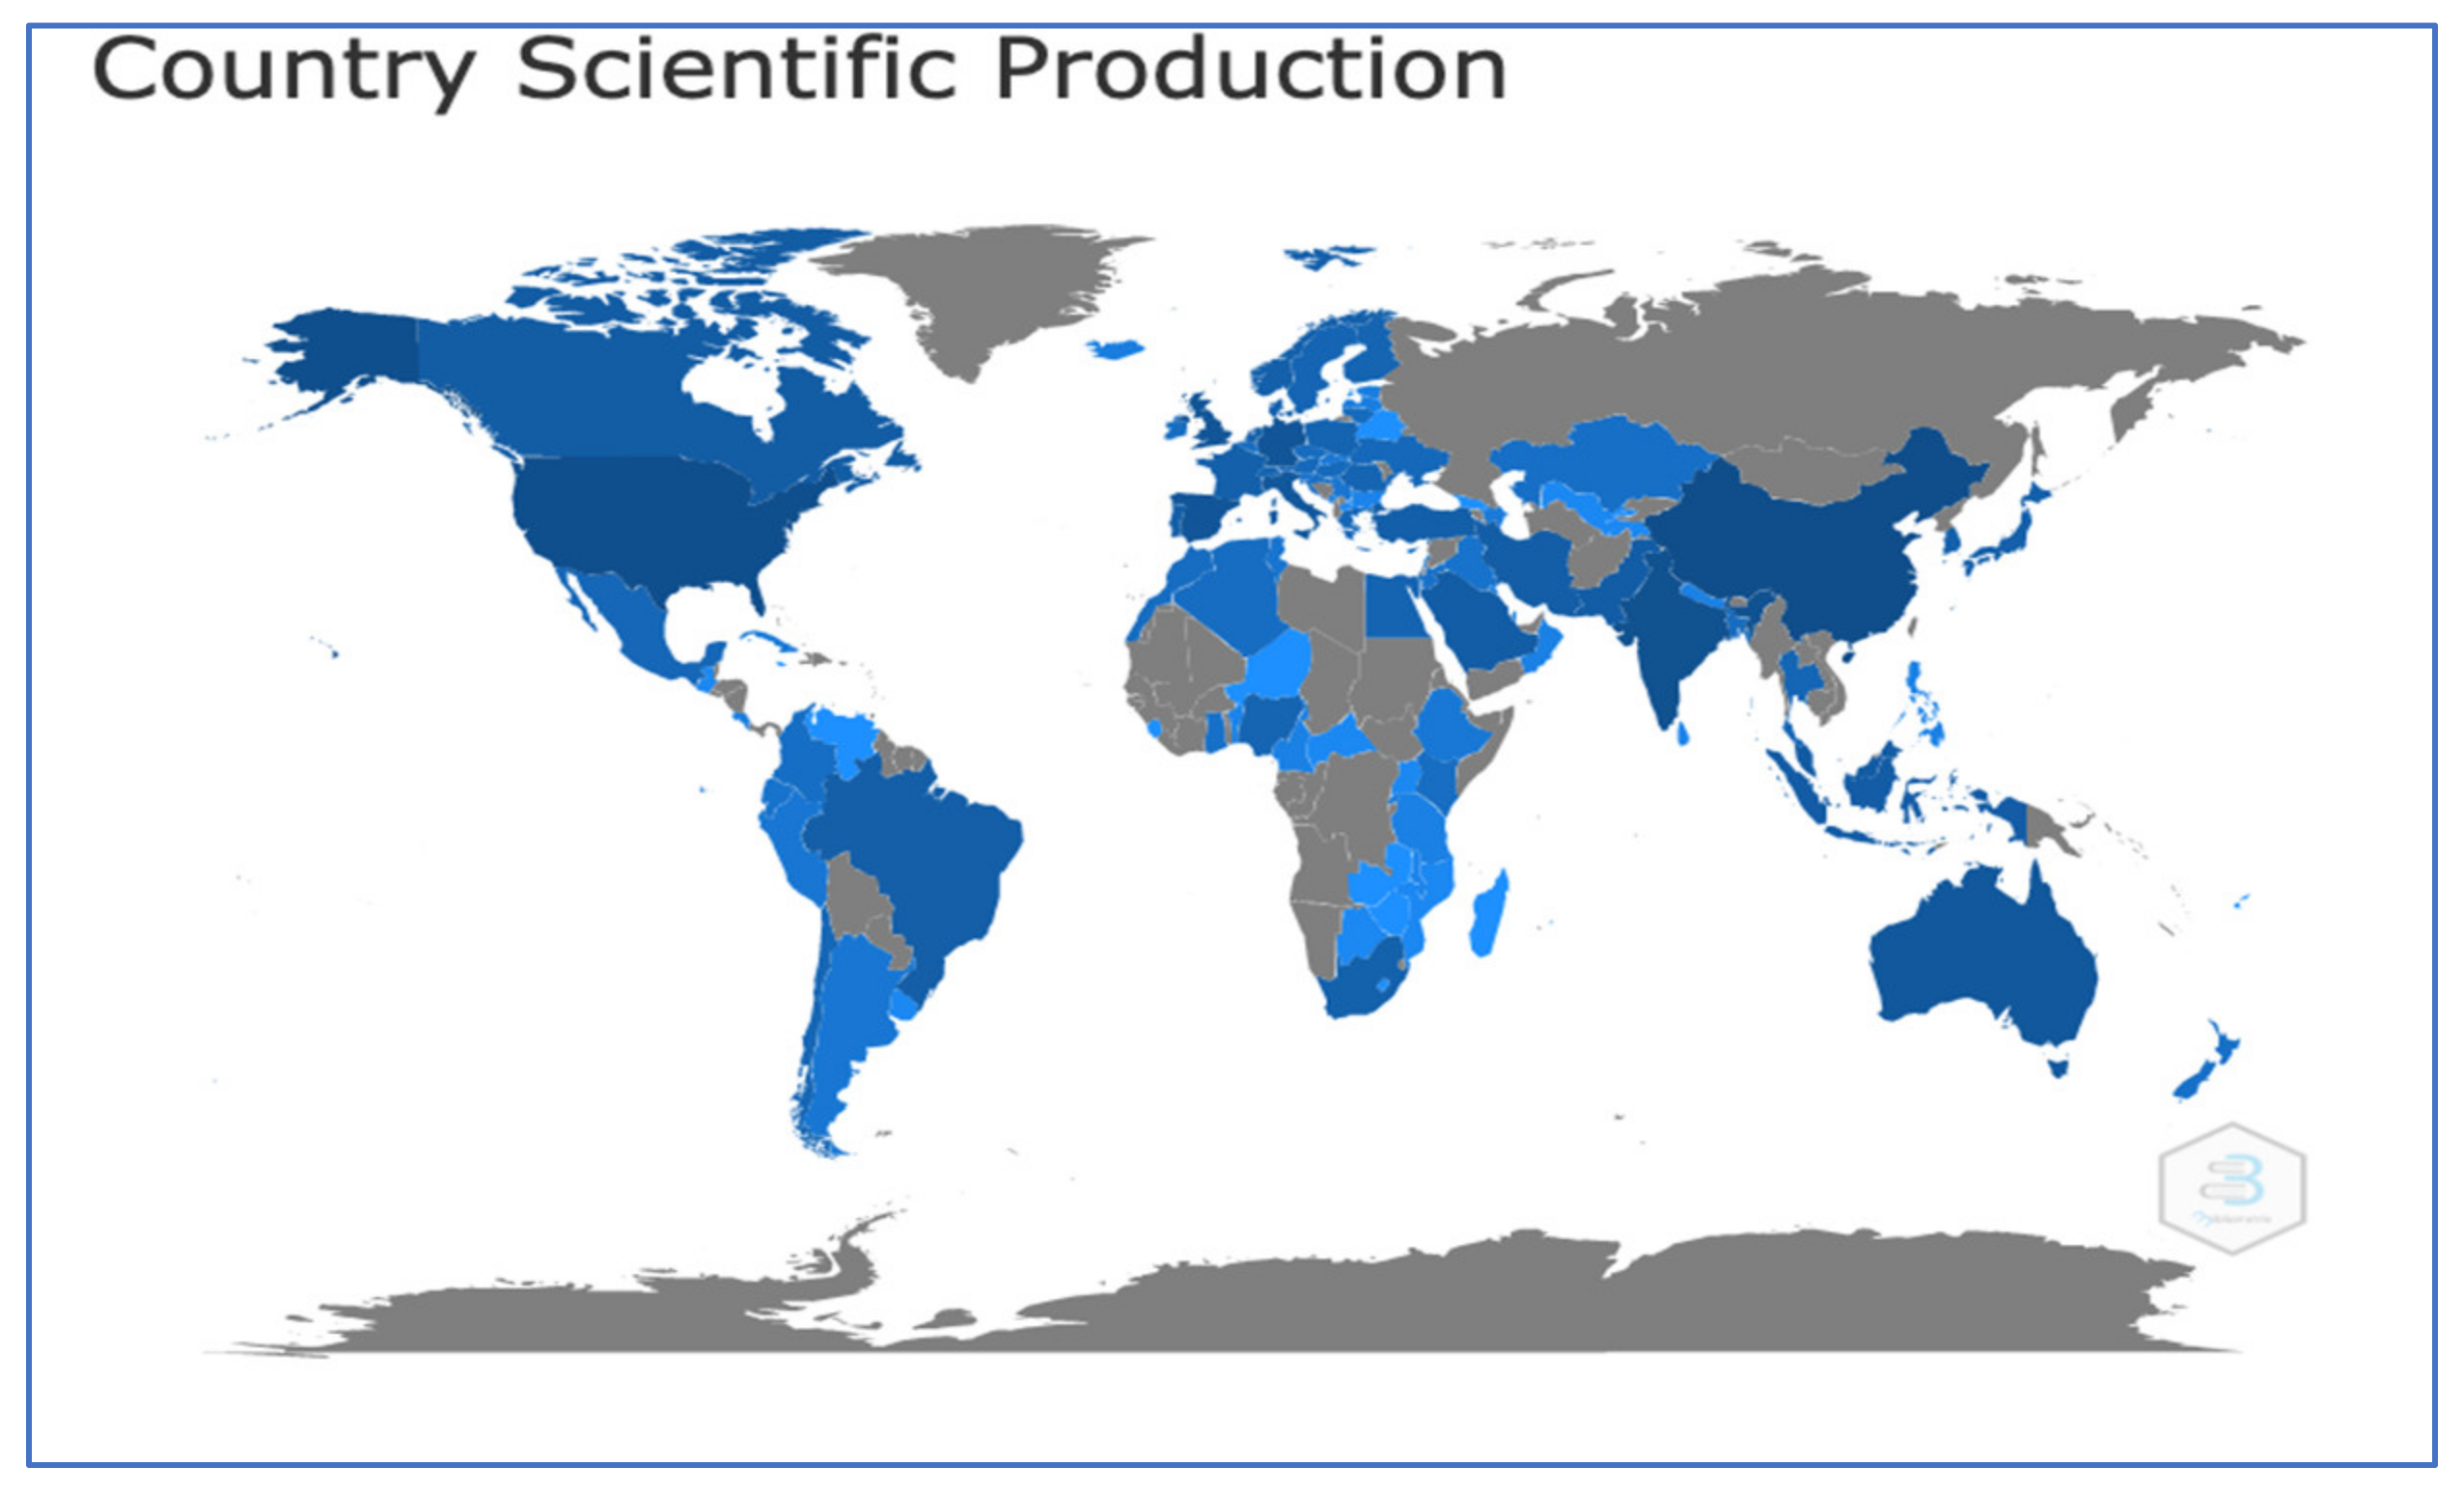
  • The overwhelming majority of articles on RE and RES in social sciences were written by authors from China (21.2%) and the USA (19.4%). This conclusion is significantly correlated with the use of renewable energy in both countries: China and the USA are the world’s leaders in RES investment;
  • A smaller group of authors is represented by India (14.8%), the UK (9.9%), Germany (9.6%), and Spain (9.5%). In total, authors from six countries published 2060 indexed articles in Scopus and WoS (84.32). This is a significant conclusion from a cognitive perspective and a key element of debates on data and its interpretation. It points to a visible concentration of research studies and a certain asymmetry in the distribution of publications by country;
  • A group of 20 authors published from 6 to 13 indexed articles in both databases, and six researchers published 10–13 articles (most prolific authors);
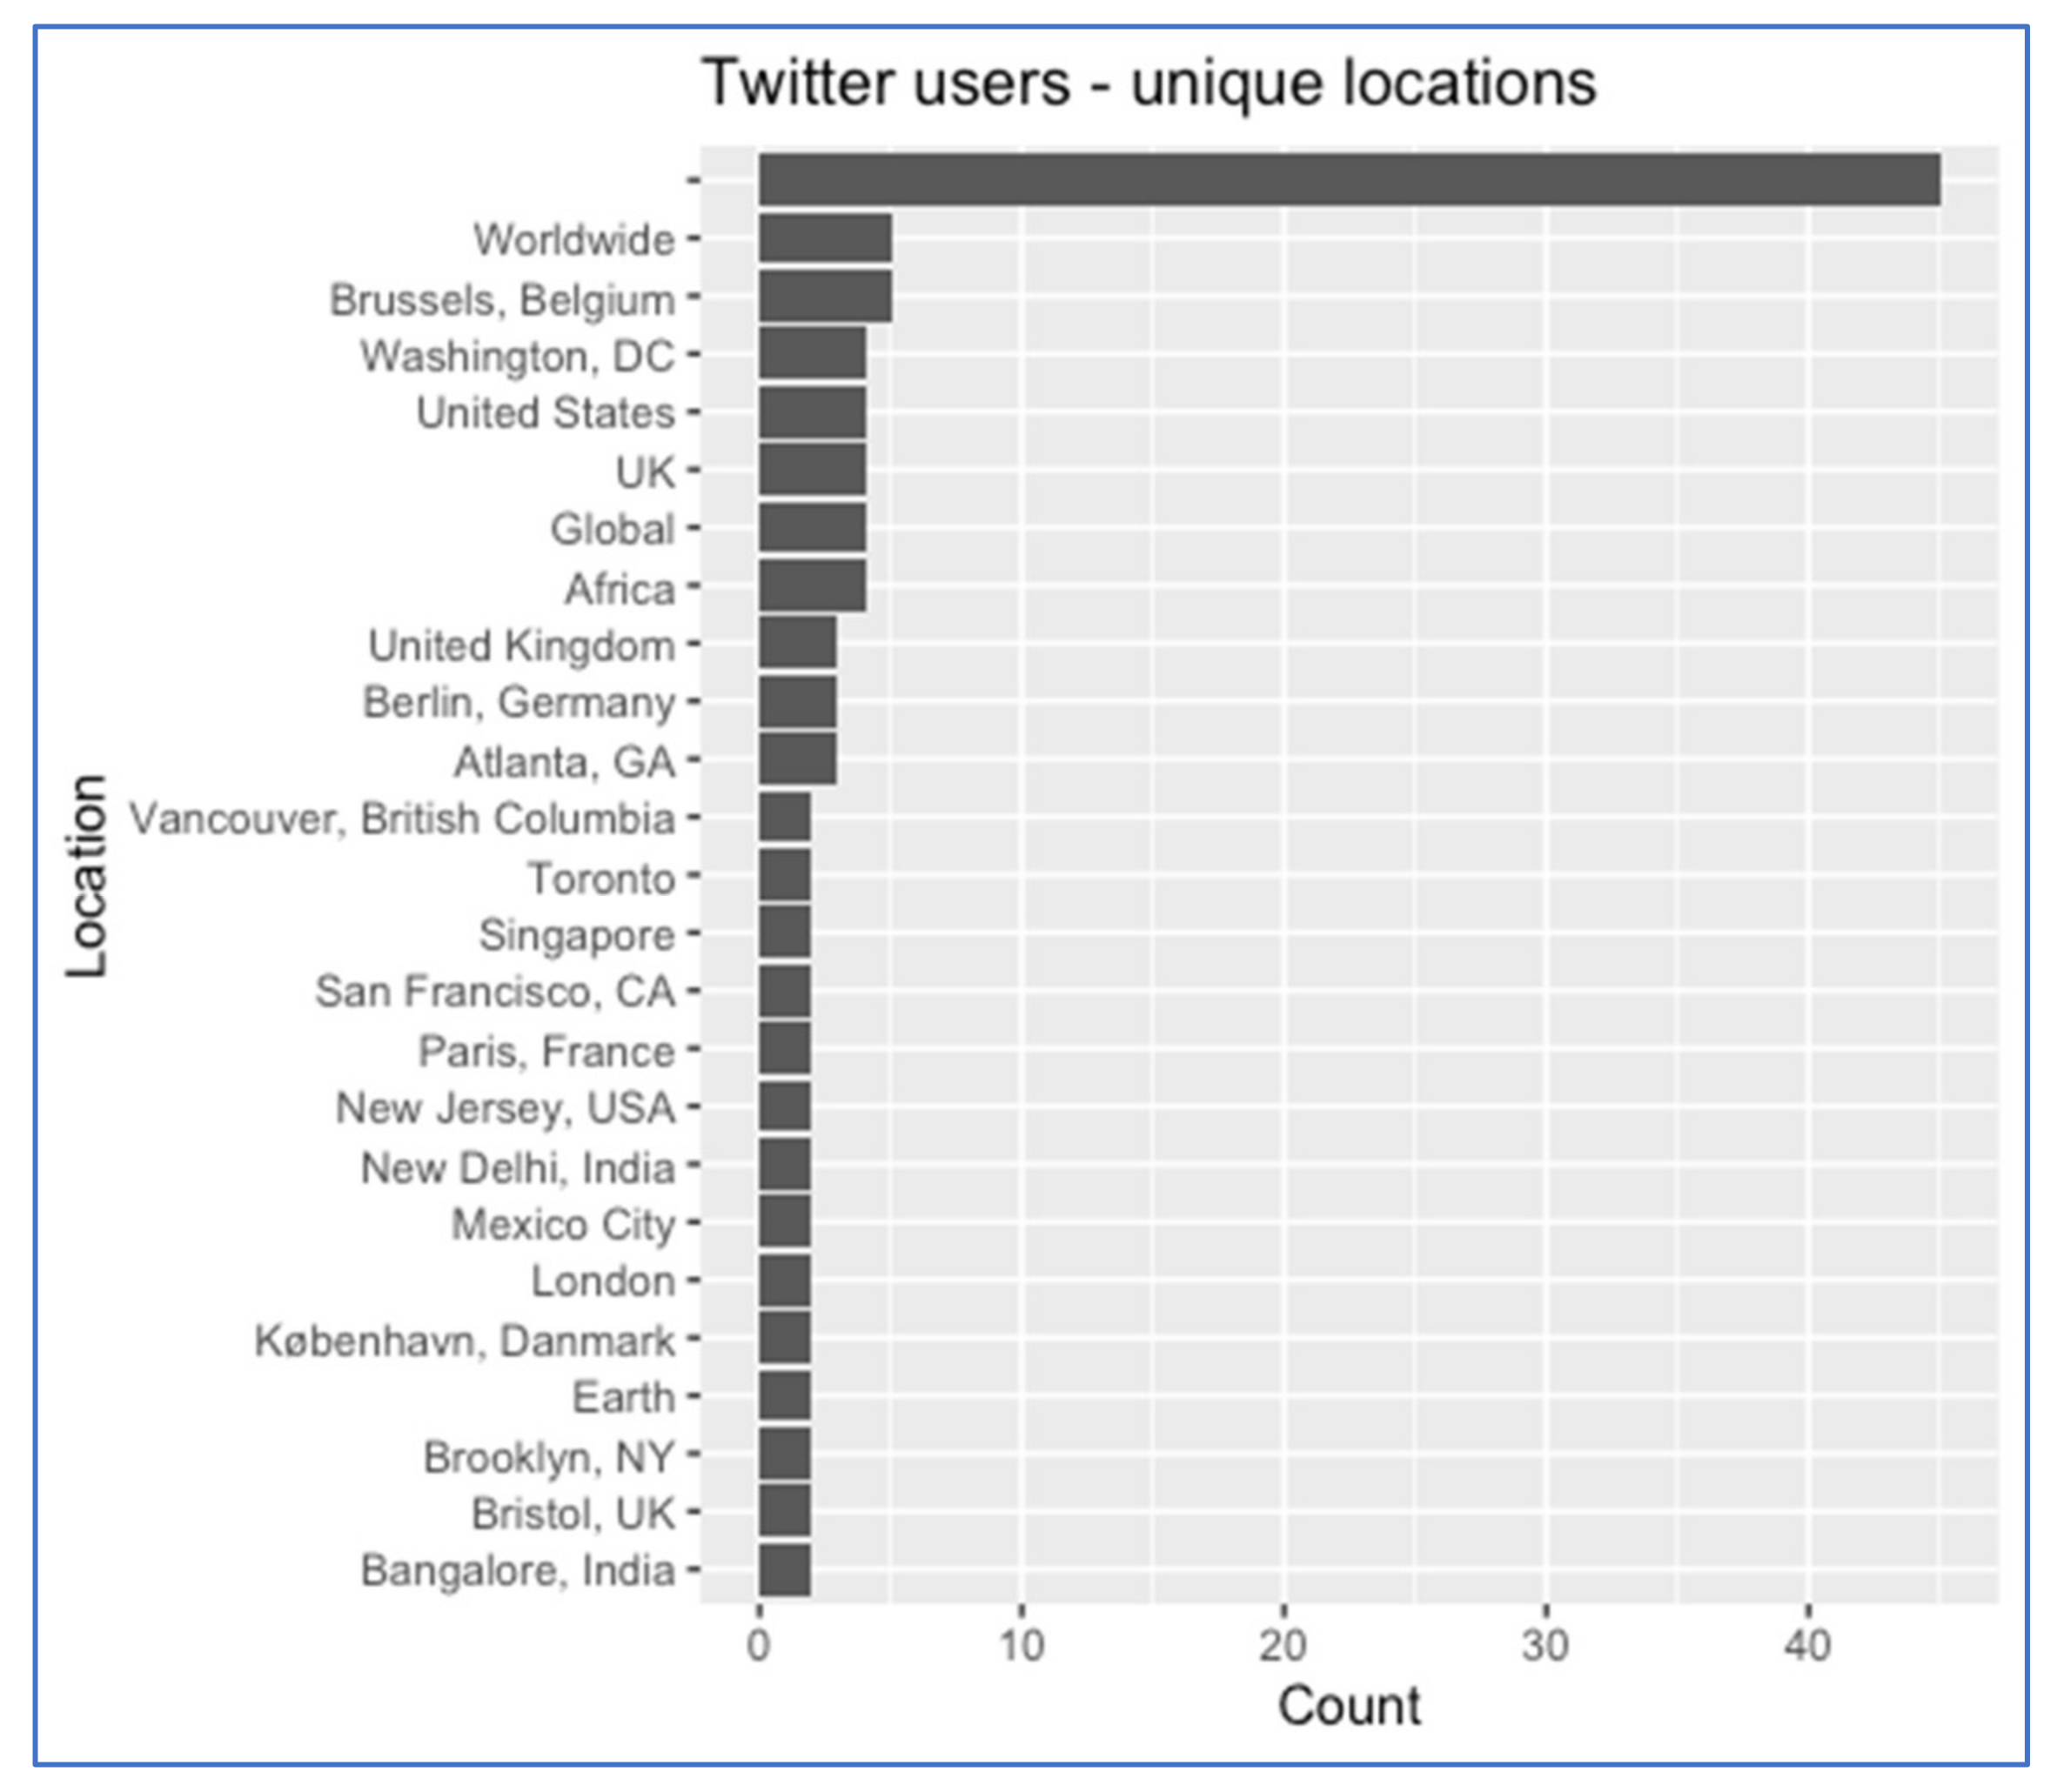
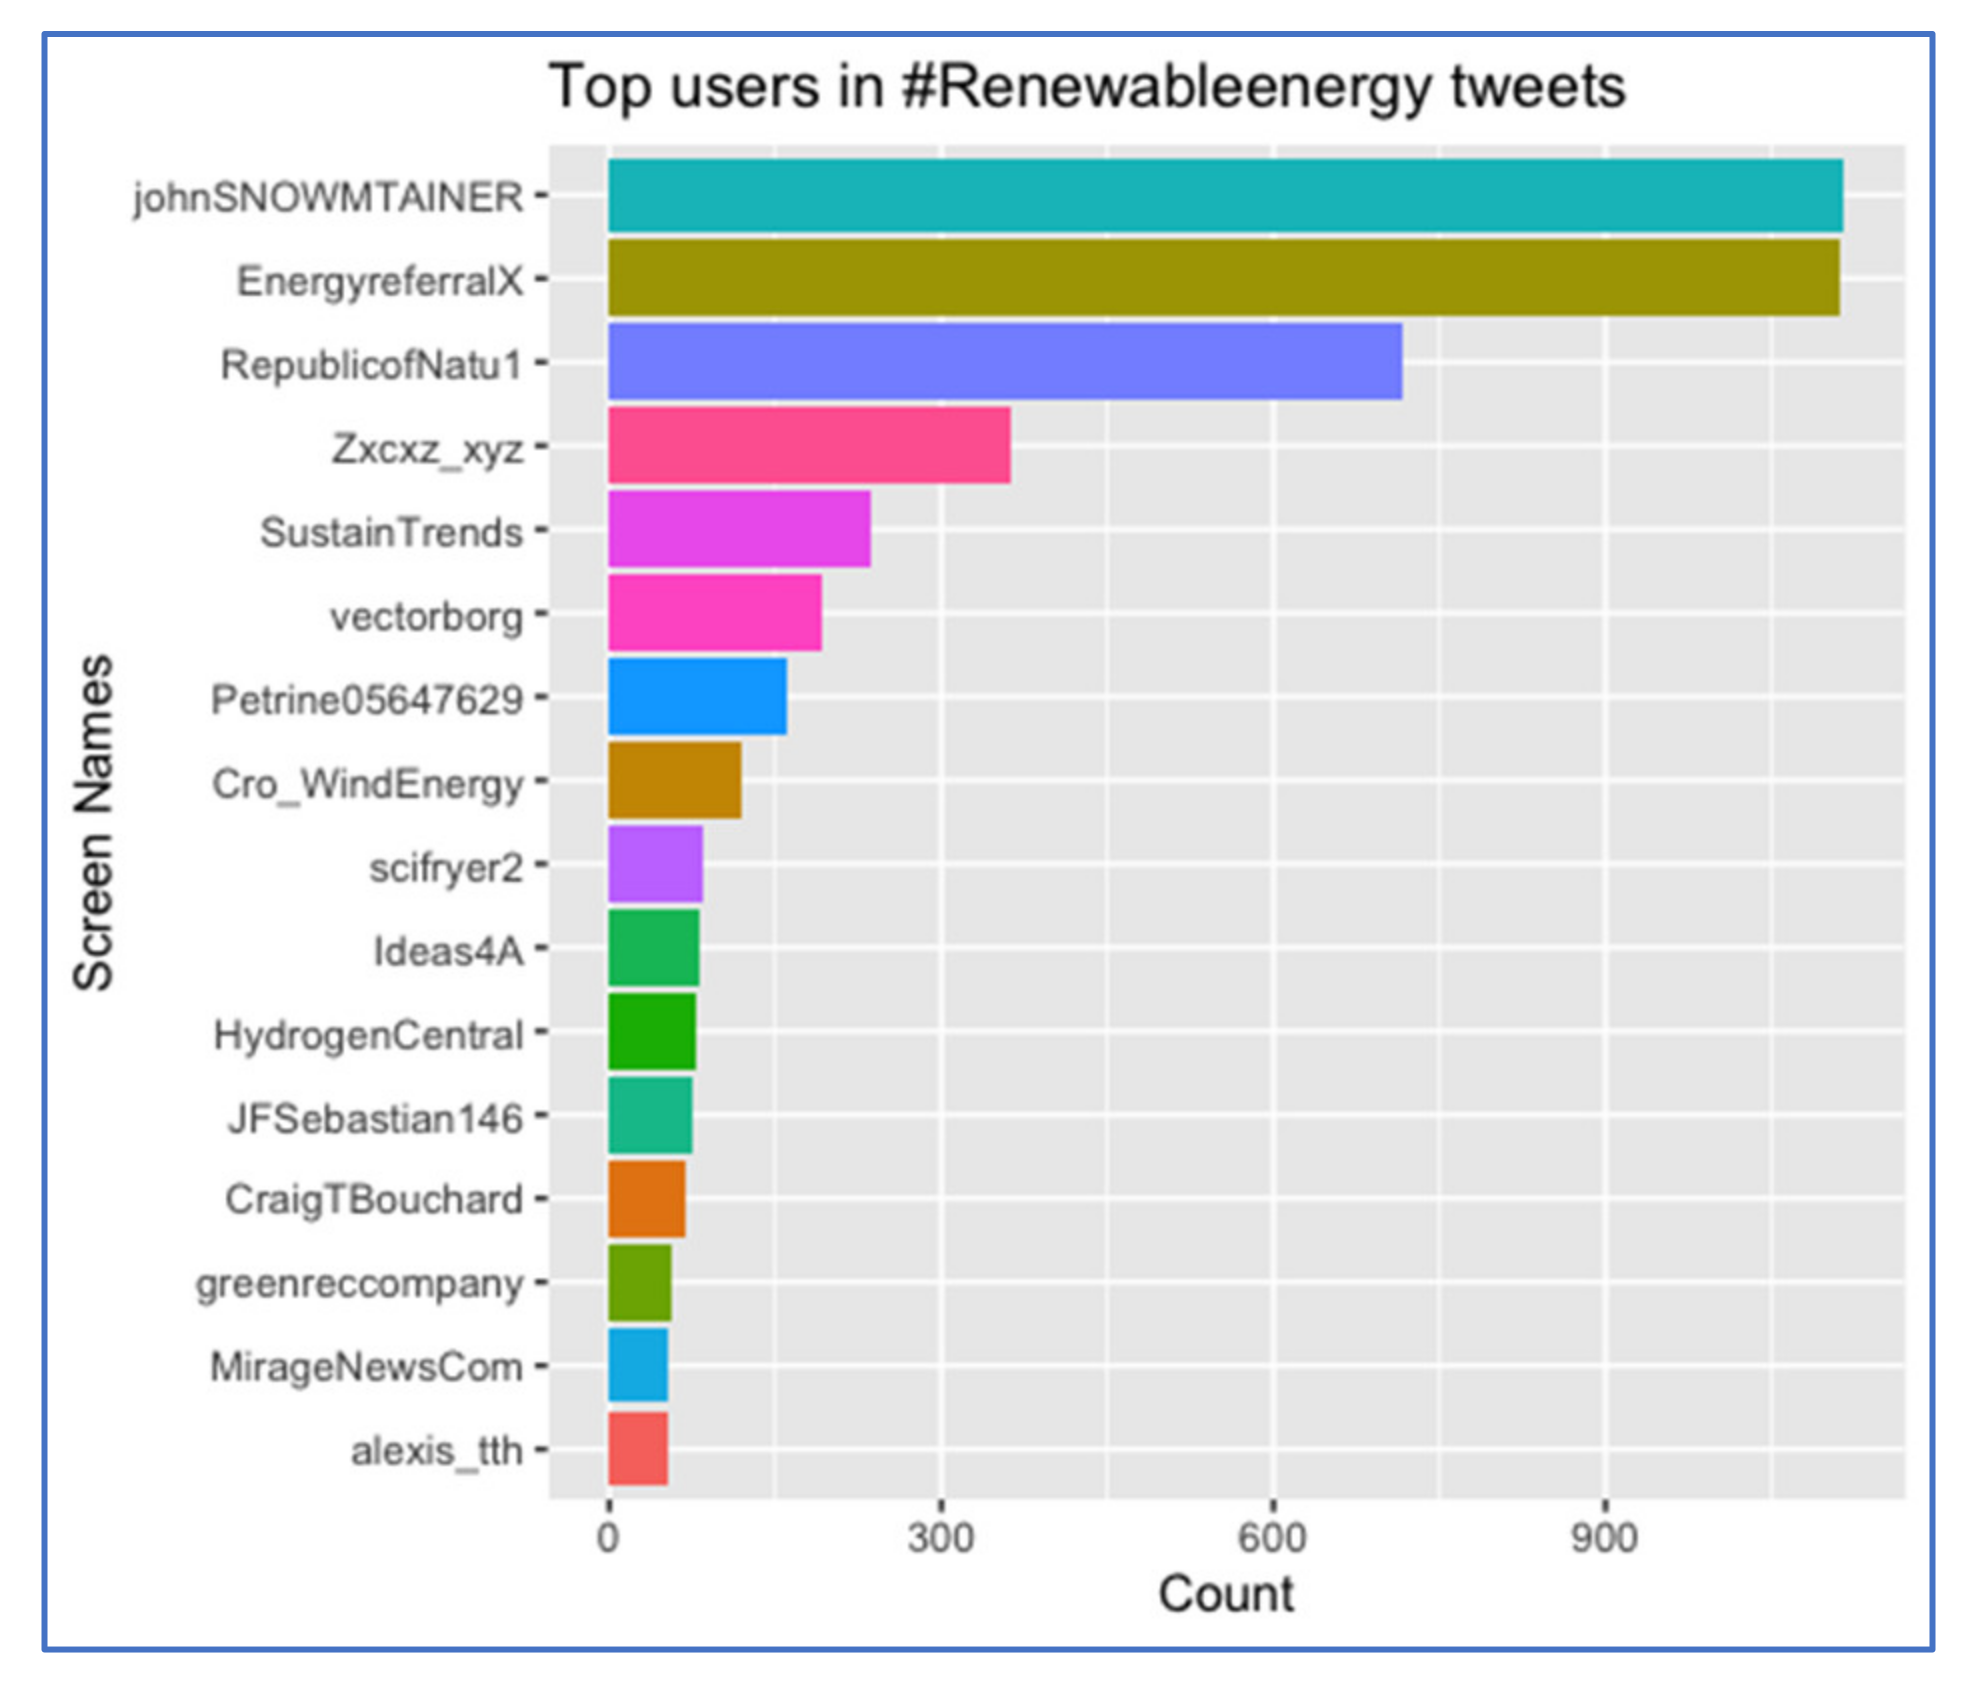
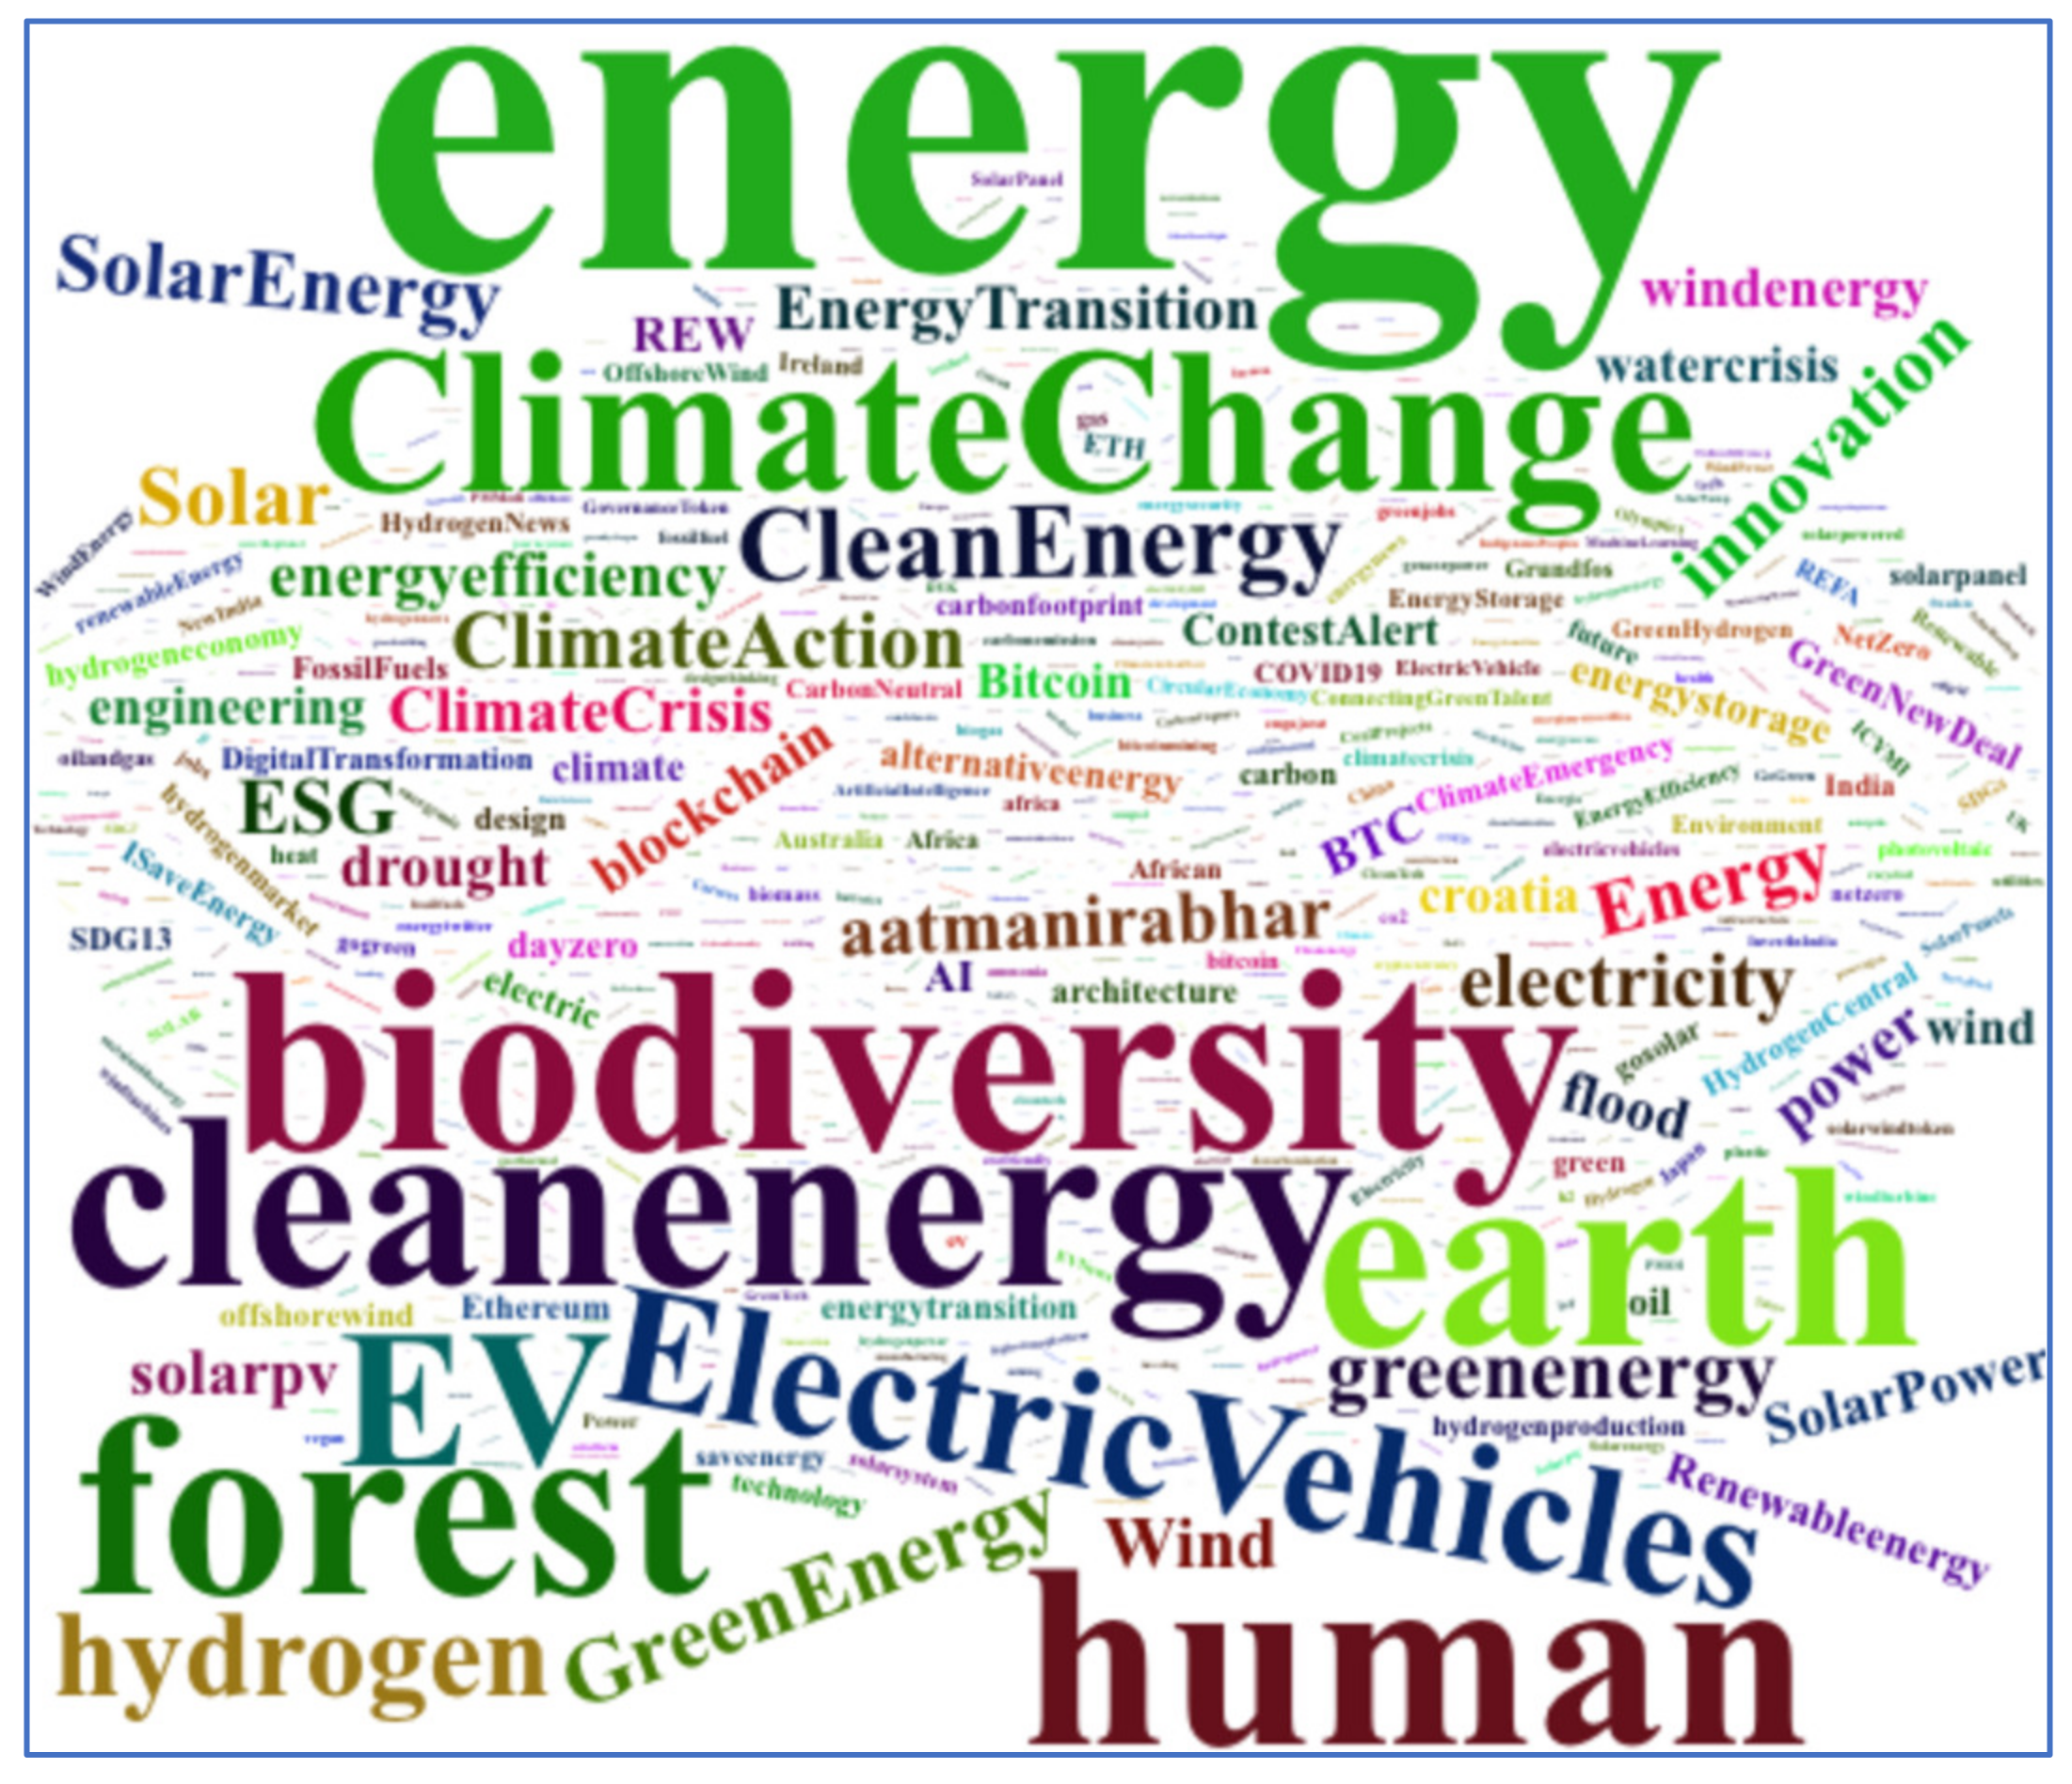
  • Out of 1598 Twitter users, only 268 (16.8%) had a verified account, confirming its authenticity. This is an important fact—both from a formal and methodological perspective. It indicates that we need to be cautious in our interpretations and assessments. In the analysed period, more than 600 hashtags of #renewableenergy were added to tweets by three users, who had from 491 to 2671 followers. The analysis of geographical locations points to the absence of tweets (or, possibly, the fact of hiding these locations) posted by Twitter users from China. This observation can be considered from the perspective of the domination of Chinese authors in scientific publications;
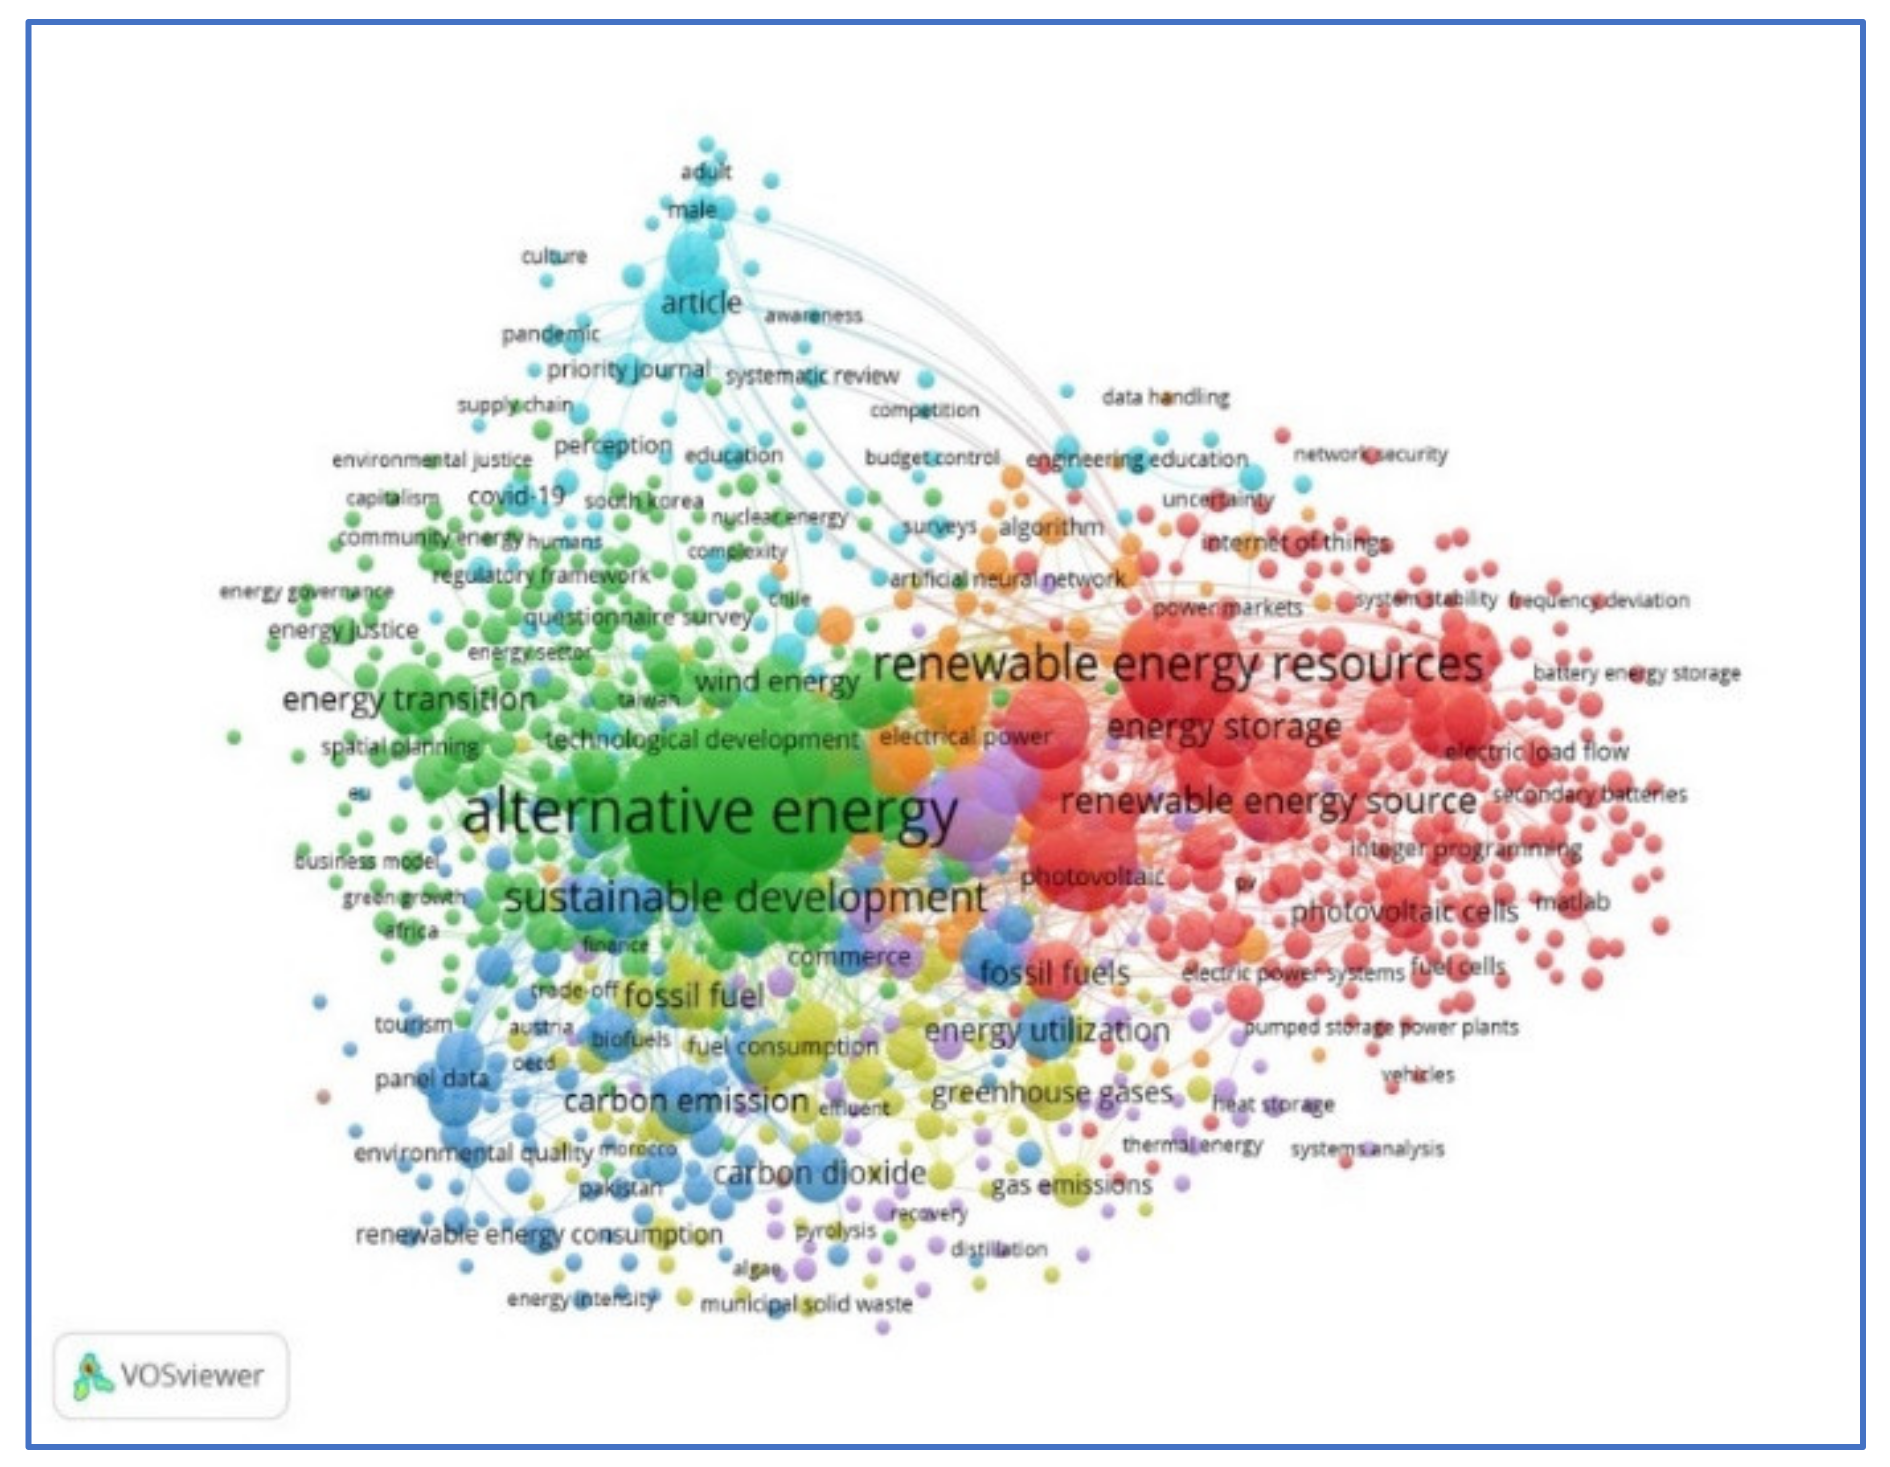
  • The analysis of the co-occurrence of keywords in articles’ titles and abstracts leads to the conclusion that top themes and keywords are as follows: renewable energy (495 occurrences), energy transition (72), sustainable development (65), and energy consumption (52). Similar results are obtained from the analysis of abstracts;
  • The cluster analysis of 968 keywords with more than 45 repetitions (excluding geographical names) leads to the identification of seven clusters. Keywords expressed positive narration, relating to new technologies, ecology, agriculture and production, hydrology and urban development, counteracting threats, and analytical methods. On a limited scale, keywords related to negative phenomena were found in clusters connected with ecology and the necessity to counteract threats;
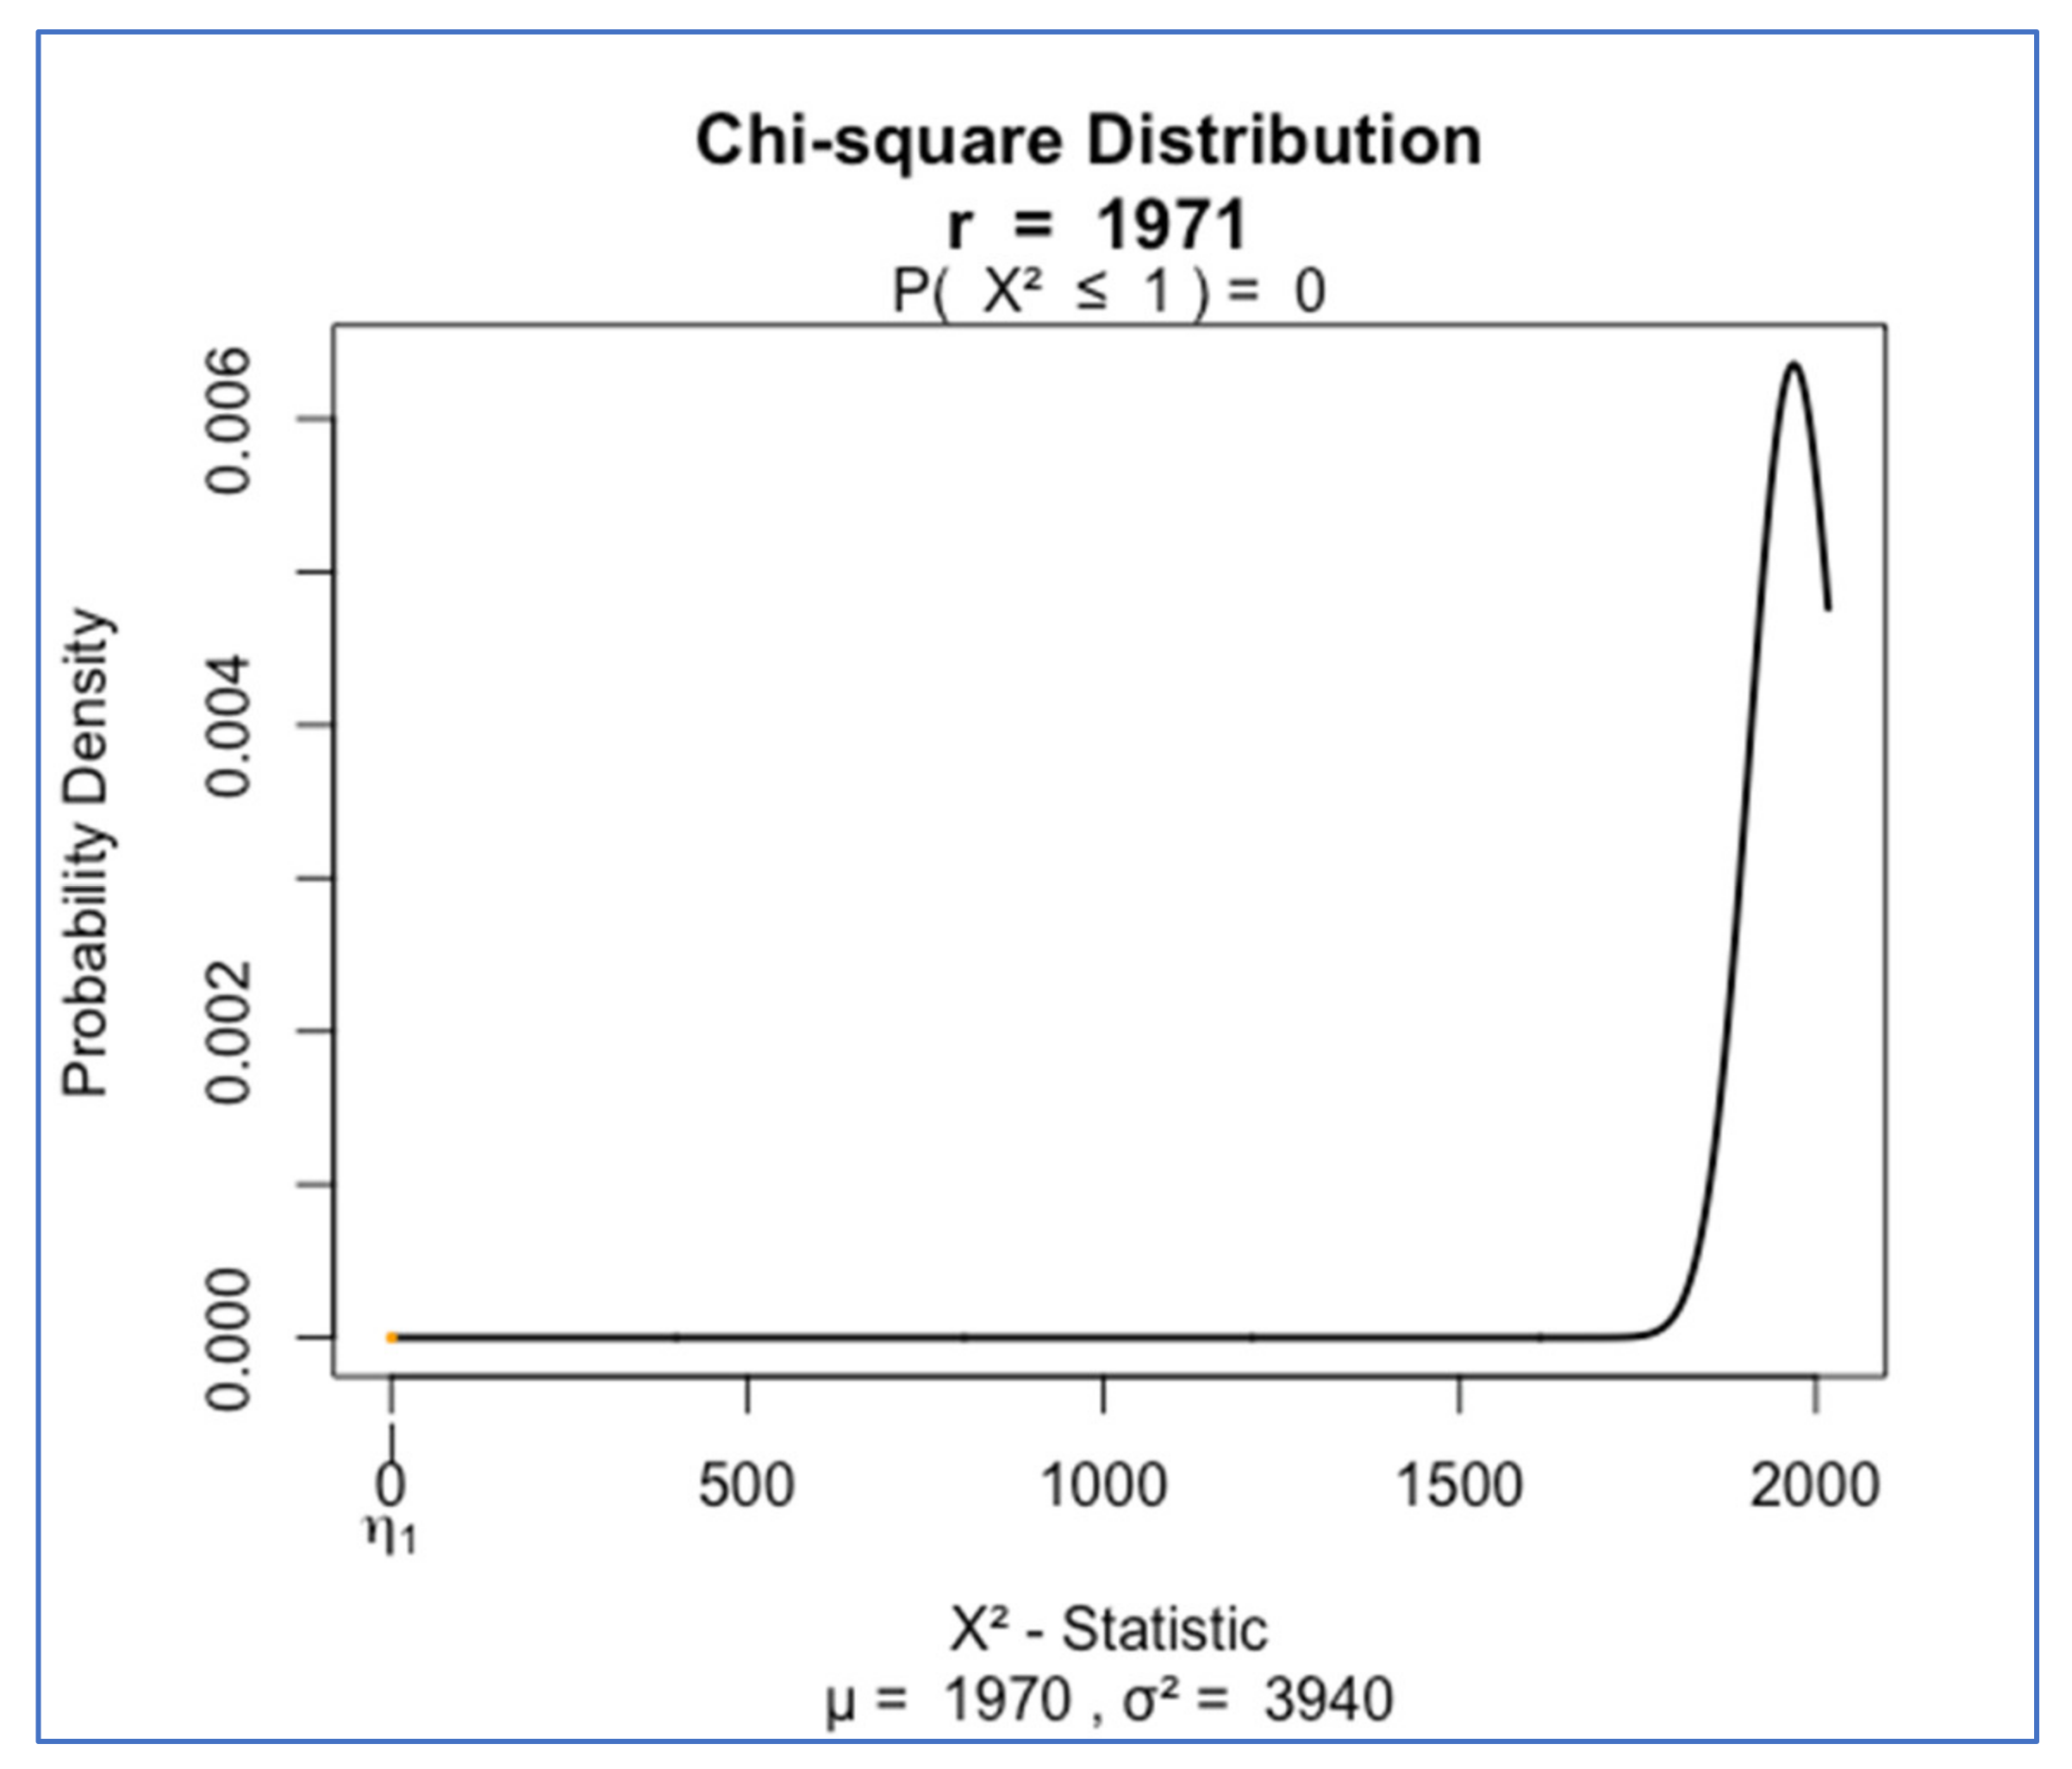
  • The comparison of keywords in articles and tweets and the identification of the degree of co-occurrence in both databases were based on chi-2 analysis. Regression analysis indicated a moderate correlation between keywords in articles and hashtags (coefficient of determination R2 = 0.169). Interestingly (and importantly from a scientific perspective), the coefficient of determination has a similar value in the case of a more reasonable distribution of residuals if, instead of the counts of hashtags, their logarithm is taken into account. This observation can indicate that the frequency of the occurrence of hashtags increases exponentially.

4. Discussion

The research study aimed to identify similarities and differences between keywords and hashtags related to renewable energy, used by the authors of scientific publications and tweeters. This objective was achieved using the bibliometric analysis of articles published in indexed journals in Scopus and WoS as well as Twitter posts.
Issues related to renewable energy, including RES, are the subject of a large number of research studies and publications. In 2019–2021, Scopus comprised 47,738 articles across all scientific disciplines, and WoS—63,088. The detailed bibliometric analysis comprised a total of 2443 articles in social sciences (Scopus) and Arts & Humanities, Proceedings Social Science & Humanities (CPSI-SSH), Social Science Citation Index (SSCI-WoS). The analysis focused on 18,000 tweets related to RE, posted by 1598 Twitter users, and 448,116 words from 1124 hashtags. The results indicate that issues related to renewable energy are widely discussed in scientific publications as well as in social media.
The presented results show a large scale of research studies in renewable energy. The results seem to refer to the significance of publications in preparing periodical ICPP reports—let us just mention that each of six IPCC reports (AR—Assessment Report) published in 1990–2021 was based on the results of research studies, e.g., AR 5 (2014) was based on more than 12,000 articles, and AR 6 (2021)—more than 14,000 [25,34]. Simultaneously, the analysis of tweets corresponds to international social research studies [115]. The results of these studies indicate that 72% of respondents from 30 countries of the world show concern about climate change, treating this issue as an indication of responsibility to future generations [115]. Simultaneously, there is a visible discrepancy between the declarations and actual pro-climate and pro-energy actions taken by consumers, prosumers, and flexumers. We emphasise this issue in the discussion of results. It is a significant and relatively new element of understanding RE-related issues by the world of science and social media. In this context, the obtained results contribute to RE research studies, showing a new way of thinking about renewable energy in a broad perspective of scientific research based on methodological rigor and spontaneous unguided discussions in international social media. We are convinced that the presented results, described in the context of global energy and climate problems and sustainability, will stimulate further research of the ways to integrate the results of scientific research with social media debates on RES. We hope that J. Perl’s recommendation in connection with The Book of Why: The New Science of Cause and Effect will stimulate the process of seeking the causes and effects of the title problem of this paper: “you are smarter than your data. Data do not understand causes and effects; humans do” [116]. We must also emphasise that the list of analysed keywords was limited to “renewable energy” (and similar). In the future, it will be necessary to replicate research focused on more specific keywords, for example, reflecting the discussion on selected types of renewable energy.

5. Conclusions

The study presented in this paper has its limitations. In a methodological dimension, they relate to the concentration on publications in social sciences and no attention was given to other disciplines. This limitation results from the authors’ own areas of scientific research. It also shows directions for further research—creating interdisciplinary teams and undertaking broader in-depth analyses beyond discipline boundaries and improving methods of exploring relations between documents, resources, and information streams in different locations (bases of articles and social media). Another limitation is the analysis of debates based only on Twitter, with no consideration given to other social media platforms. It results from the formulated problem area in the analysis of Twitter posts and the similarity of keywords in two sources of information. A methodological limitation is related to the semi-structural character of data in social media, and the lack of their regularity, dynamics, and heterogeneity. In the limitations of social media as a source of information we also point to the possible occurrence of false positive and false negative errors related to webometric analysis [117]. We also emphasise the research limitations resulting from the research techniques: rtweet allows you to analyse only a limited number of tweets. Thus, it is not possible to make generalised conclusions. However, due to the dynamic and spontaneous nature of informal communication in social media, we should assume that it is challenging to formulate specific integrated and generalised rules in the studied environment. An interesting research direction will undoubtedly be replicating this research over time and observing dynamic changes in the area of activity of tweeter users, sentiment analysis, and the frequency of adding content.
An important direction in further research will be an analysis of the attitudes of other social media users to RE and an analysis of those users from the perspective of their socioeconomic characteristics. It should refer to climate change and RES and present such issues at individual, social, cultural, and national levels on the basis of specific social segmentation and stratification criteria determined by international social studies.
Designing future research studies, we stress the need to increase the sample size (other scientific disciplines and social platforms) and to use methodological triangulation. A significant and interesting aspect of future research will be an attempt to identify differences in the perception of RE at individual, social, national, and international levels and to seek correlations between scientific achievements and contributions made by particular countries to counteracting climate change, transforming economic systems, and promoting RES. We believe that it will be necessary to analyse the profile of scientific papers on RES as well as those considered for future IPCC reports and materials for annual COP conferences. We also stress the significance of the future research of social media users in the context of RES with regard to their declarations, attitudes, and behaviours in connection with climate change and their actual—not only verbal—actions in the area of RES. When the substantive and methodological aspects of research in both information environments are integrated (scientific publications and content in social media), future research studies can allow for identifying and assessing the role of renewable energy in scientific research and translating it to concrete decisions made by international institutions, national governments, and enterprises. Efforts in this area can promote appropriate social behaviours and social media users’ attitudes, assigning them the role of prosumers and flexumers in the area of RES in the context of climate changes and their causes and great multidimensional impact on the social, economic, and environmental ecosystem. Such trends in research can be regarded as the contribution and obligation of scientific studies in diagnosing, explaining, and predicting the contemporary world’s energy and climate problems, constituting an impact factor in the social responsibility of science for disseminating the results of research.

Author Contributions

Conceptualization, J.W.W.; methodology, K.S.-K.; software, K.S.-K.; validation, K.S.-K. and J.W.W.; formal analysis, J.W.W.; investigation, K.S.-K.; resources, J.W.W.; data curation, K.S.-K.; writing—original draft preparation, K.S.-K.; writing—review and editing, J.W.W.; visualization, K.S.-K.; supervision, J.W.W.; project administration, K.S.-K.; funding acquisition, J.W.W. All authors have read and agreed to the published version of the manuscript.

Funding

This research was funded by Cracow University of Economics, grant number 83/ZZM/2020/POT.

Institutional Review Board Statement

Not applicable.

Conflicts of Interest

The authors declare no conflict of interest.

References

  1. Mohtasham, J. Review Article-Renewable Energies. Energy Procedia 2017, 74, 1289–1297. [Google Scholar] [CrossRef] [Green Version]
  2. Pettenger, M.E. The Social Construction of Climate Change; Routledge: London, UK, 2007. [Google Scholar]
  3. Potrč, S.; Čuček, L.; Martin, M.; Kravanja, Z. Sustainable renewable energy supply networks optimization—The gradual transition to a renewable energy system within the European Union by 2050. Renew. Sustain. Energy Rev. 2021, 146, 111186. [Google Scholar] [CrossRef]
  4. de La Cruz-Lovera, C.; Perea-Moreno, J.; de La Cruz-Fernandez, L.; Montoya, F.; Alcayde, A.; Manzano-Agugliaro, F. Analysis of research topics and scientific collaborations in energy saving using bibliometric techniques and community detection. Energies 2019, 12, 2030. [Google Scholar] [CrossRef] [Green Version]
  5. Harjanne, A.; Korhonen, J.M. Abandoning the concept of renewable energy. Energy Policy 2019, 127, 330–340. [Google Scholar] [CrossRef] [Green Version]
  6. Daly, H. Beyond Growth. In The Economics of Sustainable Development; Beacon Press: Boston, MA, USA, 1996. [Google Scholar]
  7. Abramovay, R. Beyond the Green Economy; Routledge: London, UK, 2016. [Google Scholar]
  8. Degarmo, D. International Environmental Traties and State Behavior: Factors Influencing Cooperation; Routledge: London, UK, 2015. [Google Scholar]
  9. Nordhaus, W. The Climate Casino: Risk, Uncertainty, and Economics for a Warming World; Yale University Press: New Haven, CT, USA, 2013. [Google Scholar]
  10. Maslin, M. Global Warming: A Very Short Introduction; OUP: Oxford, UK, 2008. [Google Scholar]
  11. Vogler, J. Climate Change in World Politics; Palgrave MacMillan: London, UK, 2016. [Google Scholar]
  12. Kamran, M.; Fazal, M.R. Renewable Energy Conversion Systems; Academic Press: London, UK, 2021. [Google Scholar]
  13. MacKay, D.J.C. Sustainable Energy—Without the Hot Air; UIT Cambridge: Cambridge, UK, 2008. [Google Scholar]
  14. Comparing Renewable Energy Policies in Europe. Available online: https://cicero.oslo.no/en.remix (accessed on 10 August 2021).
  15. Fanzo, J. A Path to Sustainable Food Systems. Curr. Hist. 2021, 120, 313–319. [Google Scholar] [CrossRef]
  16. Gernaat, D.E.H.J.; de Boer, H.S.; Daioglou, V.; Yalwe, S.G.; Müller, C.; van Vuuren, D.P. Climate change impacts on renewable energy supply. Nat. Clim. Chang. 2021, 11, 119–125. [Google Scholar] [CrossRef]
  17. Keohane, R.O. The Global Politics of Climate Change: Chalenge for Political Science. Political Sci. 2012, 48, 19–26. [Google Scholar] [CrossRef] [Green Version]
  18. Moser, S.; Kleinhückelkotten, S. Good Intents, but Low Impacts: Diverging Importance of Motivational and Socioeconomic Determinants Explaining Pro-Environmental Behavior, Energy Use, and Carbon Footprint. Environ. Behav. 2018, 50, 626–656. [Google Scholar] [CrossRef] [Green Version]
  19. Kahan, D.M.; Corbin, J.C. The Polarizing Impact of Science Literacy and Numeracy on Perceived Climate Change Risk. Nat. Clim. Chang. 2012, 2, 732–735. [Google Scholar] [CrossRef] [Green Version]
  20. He, L.; Zhang, S.; Chen, Y.; Ren, L.; Li, J. Techno-economic potential of a renewable energy-based microgrid system for a sustainable large-scale residential community in Beijing, China. Renew. Sustain. Energy Rev. 2018, 93, 631–641. [Google Scholar] [CrossRef]
  21. Ropuszyńska-Surma, E.; Węglarz, M. Profiling End User of Renewable Energy Sources among Residential Consumers in Poland. Sustainability 2018, 10, 4452. [Google Scholar] [CrossRef] [Green Version]
  22. Gródek-Szostak, Z.; Suder, M.; Kusa, R.; Szeląg-Sikora, A.; Duda, J.; Niemiec, M. Renewable Energy Promotion Instruments Used by Innovation Brokers in a Technology Transfer Network. Case Study of the Enterprise Europe Network. Energies 2020, 13, 3445. [Google Scholar] [CrossRef]
  23. Scarpa, R.; Willis, K. Willingness-to-pay for renewable energy: Primary and discretionary choice of British households’ for micro-generation technologies. Energy Econ. 2010, 32, 129–136. [Google Scholar] [CrossRef]
  24. Sanderink, L.; Nasiritousi, N. How institutional interactions can strengthen e_ectiveness: The case of multi-stakeholder partnerships for renewable energy. Energy Policy 2020, 141, 111447. [Google Scholar] [CrossRef]
  25. The Intergovernmetal Panel on Climate Change, IPCC. Available online: https://www.ipcc.ch/ (accessed on 8 August 2021).
  26. IRENA. Available online: http://www.irena.org/irenamembership (accessed on 6 August 2021).
  27. Barrett, A. Stability of Zero-growth Economics Analysed with a Minskyan Model. Ecol. Econ. 2018, 146, 228–239. [Google Scholar] [CrossRef]
  28. Our Common Future. Report of the World Commission on Environment and Development. Available online: http://www.un-documents.net/our-common-future.pdf (accessed on 5 August 2021).
  29. United Nations Framework Convention on Climate Change. Available online: https://treaties.un.org/Pages/ViewDetailsIII.aspx?src=IND&mtdsg_no=XXVII-7&chapter=27&Temp=mtdsg3&clang=_en (accessed on 10 August 2021).
  30. Kyoto Protocol—Targets for the First Commitment Period. Available online: https://unfccc.int/process-and-meetings/the-kyoto-protocol/what-is-the-kyoto-protocol/kyoto-protocol-targets-for-the-first-commitment-period (accessed on 10 August 2021).
  31. Paris Agreement. Report of the Conference of the Parties to the United Nations Framework Convention on Climate Change. Available online: https://unfccc.int/resource/docs/2015/cop21/eng/10.pdf (accessed on 28 September 2021).
  32. Adoption of the Paris Agreement. Available online: https://unfccc.int/resource/docs/2015/cop21/eng/l09r01.pdf (accessed on 28 September 2021).
  33. The Sustainable Development Goals, SDG. Available online: http://www.un.prg.esa/ff.dwp-content/uploads/2015/08/AAAAOutcome.pdf (accessed on 5 August 2021).
  34. Shindell, D.; Faluvegi, G.; Seltzer, K.; Shindell, C. Quantified, localized health benefits of accelerated carbon dioxide emissions reductions. Nature Clim. Chang. 2018, 8, 291–295. [Google Scholar] [CrossRef] [PubMed]
  35. Raftery, A.; Zimmer, A.; Frierson, D.; Startz, R.; Liu, P. Less than 2 °C warming by 2100 unlikely. Nat. Clim. Chang. 2017, 7, 637–641. [Google Scholar] [CrossRef] [PubMed]
  36. Rogelj, J.; den Elzen, M.; Höhne, N.; Fransen, T.; Fekete, H.; Winkler, H.; Schaeffer, R.; Sha, F.; Riahi, K.; Meinshausen, M. Paris Agreement climate proposals need a boost to keep warming well below 2 °C. Nature 2016, 534, 631–639. [Google Scholar] [CrossRef] [PubMed] [Green Version]
  37. Goldstein, J.S.; Qvist, S.A. A Brigth Future: How Some Countries Have Solved Climate Change and the Rest Can Follow; Public Affairs: New York, NY, USA, 2019. [Google Scholar]
  38. Wallace-Wells, D. The Uninhabitable Earth. Life after Warming; Tim Duggan Books: New York, NY, USA, 2019. [Google Scholar]
  39. Sustainable Development Indicators. Available online: https://ec.europa.eu/eurostat/web/sdi/overview (accessed on 5 August 2021).
  40. Renewables, Fuels and Technologies. Available online: https://www.nrel.gov/learning/re_basics.html (accessed on 28 September 2021).
  41. Renewable Energy Directive on the Promotion of the Use of Energy from Renewable Sources and Amending and Subsequently Repealing. Available online: https://eur-lex.europa.eu/LexUriServ/LexUriServ.do?uri=OJ:L:2009:140:0016:0062:en:PDF (accessed on 28 September 2021).
  42. Report from the Commission to the European Parliament, the Council, The European Economic and Social Committee, and the Committee of the Regions. Available online: https://eur-lex.europa.eu/legal-content/EN/ALL/?uri=CELEX%3A52013DC0175 (accessed on 28 September 2021).
  43. Renewables 2021 Global Status Report, Renewable Energy Policy Network for the 21st Century. Available online: https://www.bp.com/content/dam/bp/business-sites/en/global/corporate/pdfs/energy-economics/statistical-review/bp-stats-review-2019-full-report.pdf (accessed on 6 August 2021).
  44. BP Statistical World Energy Review. Available online: https://www.bp.com/content/dam/bp/business-sites/en/global/corporate/xlsx/energy-economics/statistical-review/bp-stats-review-2019-all-data.xlsx (accessed on 6 August 2021).
  45. Renewables 2021, Global Status Report. Available online: https://www.ren21.net/wp-content/uploads/2019/05/GSR2021_Full_Report.pdf (accessed on 6 August 2021).
  46. Prokopenko, O.; Chechel, A.; Sotnyk, I.; Omelyanenko, V.; Kurbatova, T.; Nych, T. Improving state support schemes for the sustainable development of renewable energy in Ukraine. Polityka Energetyczna 2021, 24, 85–100. [Google Scholar] [CrossRef]
  47. Ragwitz, M.; Steinhilber, S. Effectiveness and efficiency of support schemes for electricity from renewable energy sources. Wiley Interdiscip. Rev. Energy Environ. 2014, 3, 213–229. [Google Scholar] [CrossRef]
  48. Directive 2009/28/EC of the European Parliament and of the Council of 23 April 2009 on the Promotion of the Use of Energy from Renewable Sources and Amending and Subsequently Repealing Directives 2001/77/EC and 2003/30/EC. Available online: http://data.europa.eu/eli/dir/2009/28/oj (accessed on 7 August 2021).
  49. Fit for 55’: Delivering the EU’s 2030 Climate Target on the Way to Climate Neutrality. Available online: https://eur-lex.europa.eu/legal-content/EN/TXT/?uri=CELEX%3A52021DC0550 (accessed on 7 August 2021).
  50. European Commission. 2050 Long-Term Strategy. Available online: https://ec.europa.eu/clima/policies/strategies/2050_en (accessed on 10 August 2021).
  51. Klein, N. This Changes Everything: Capitalism vs. the Climate; Simon & Schuster: New York, NY, USA, 2014. [Google Scholar]
  52. Chapman, D.A.; Lickel, B.; Markowitz, E.M. Reassessing emotion in climate change communication. Nat. Clim. Chang. 2017, 7, 850–852. [Google Scholar] [CrossRef]
  53. Progress towards the Sustainable Development Goals, Report of the Secretary-General. Available online: https://www.un.org/ga/search/view_doc.asp?symbol=E/2017/66&Lang=E (accessed on 6 August 2021).
  54. Haas, R.; Panze, C.; Resch, G.; Ragwitz, M.; Reece, G.; Held, A. A historical review of promotion strategies for electricity from renewable energy sources in EU countries. Renew. Sustain. Energy Rev. 2011, 15, 1003–1034. [Google Scholar] [CrossRef]
  55. Haas, P.M. Introduction: Ecpistemic Communities and International Policy Coordination. Int. Organ. 1992, 46, 1–35. [Google Scholar] [CrossRef] [Green Version]
  56. World Wildlife Fund WWF. The Energy Report—100% Renewable Energy by 2050; WWF International: Gland, Switzerland, 2011. [Google Scholar]
  57. Long-Term Strategy for 2050–A Clean Planet for All. Available online: https://ease-storage.eu/news/long-term-strategy-2050/ (accessed on 10 August 2021).
  58. Project Stanford University—Global Climate & Energy Project. Available online: http://gcep.stanford.edu/research/index.html (accessed on 6 August 2021).
  59. International Energy Outlook 2017 (i 2050). Available online: https://www.eia.gov/outlooks/ieo/pdf/0484(2017).pdf (accessed on 8 August 2021).
  60. Eurostat. Renewable Energy Statistics. Available online: https://ec.europa.eu/eurostat/statistics-explained/index.php?title=Renewable_energy_statistics (accessed on 10 August 2021).
  61. Anderegg, W.R.L.; James, W.; Prall, J.W.; Harold, J.; Schneider, S.H. Expert credibility in climate change. Proc. Natl. Acad. Sci. USA 2010, 107, 12107–12109. [Google Scholar] [CrossRef] [PubMed] [Green Version]
  62. Mathers, C. Calorie Restriction and Longer life in Nematode Worms. Available online: https://colinmathers.com/2014/06/27/calorie-restriction-and-longer-life-in-nematode-worms/ (accessed on 8 August 2021).
  63. Climate Change Widespread, Rapid, and Intensifying. Available online: https://www.ipcc.ch/2021/08/09/ar6-wg1-20210809-pr/ (accessed on 10 August 2021).
  64. Hoffman, D.L.; Novak, T.P. Marketing in Hypermedia Computer-Mediated Environments: Conceptual Foundation. J. Mark. 1996, 60, 50–68. [Google Scholar] [CrossRef]
  65. McQuail, D. Mass Communication Theory; Sage Publication: Thousand Oaks, CA, USA, 2010. [Google Scholar]
  66. Streimikiene, D.; Kyriakopoulos, G.; Lekavicius, V.; Siksnelyte-Butkiene, I. Energy Poverty and Low Carbon Just Energy Transition: Comparative Study in Lithuania and Greece. Soc. Indic. Res. 2021, 1–53. [Google Scholar] [CrossRef]
  67. Anagnostopoulos, T.; Kyriakopoulos, G.L.; Ntanos, S.; Gkika, E.; Asonitou, S. Intelligent Predictive Analytics for Sustainable Business Investment in Renewable Energy Sources. Sustainability 2020, 12, 2817. [Google Scholar] [CrossRef] [Green Version]
  68. Ferrari, G.; Pezzuolo, A.; Nizami, A.-S.; Marinello, F. Bibliometric Analysis of Trends in Biomass for Bioenergy Research. Energies 2020, 13, 3714. [Google Scholar] [CrossRef]
  69. XiaoRong, H.; DeJian, Y. Bibliometric analysis of international cooperation in biomass energy research. Curr. Sci. 2019, 117, 1785–1793. [Google Scholar]
  70. Huaqi, C.; Ho, Y.S. Highly cited articles in biomass research: A bibliometric analysis. Renew. Sustain. Energy Rev. 2015, 49, 12–20. [Google Scholar]
  71. Kosch, O.; Szarucki, M. An overview of 25 years of European scientific collaboration in the field of strategic management: A bibliometric analysis. Eur. Manag. Rev. 2021, 18, 51–69. [Google Scholar] [CrossRef]
  72. Prichard, A. Statistical Bibliography or Bibliometrics? J. Doc. 1969, 25, 348–349. [Google Scholar]
  73. Grzybowska, K. Identification and Classification of Global Theoretical Trends and Supply Chain Development Directions. Energies 2021, 14, 4414. [Google Scholar] [CrossRef]
  74. Lis, A.; Sudolska, A.; Pietryka, I.; Kozakiewicz, A. Cloud Computing and Energy Efficiency: Mapping the Thematic Structure of Research. Energies 2020, 13, 4117. [Google Scholar] [CrossRef]
  75. Klincewicz, K.; Zemigła, M.; Mijał, M. Bibliometria w Zarządzaniu Technologiami i Badaniami Naukowymi; MniSzW: Warsaw, Poland, 2012.
  76. Nowak, P. Bibliometria. Webometria. Podstawy. Wybrane Zastosowania; Wydawnictwo Naukowe Uniwersytetu Adama Mickiewicza: Poznań, Poland, 2006. [Google Scholar]
  77. Narin, F.; Moll, J. Bibliometrics. Annu. Rev. Inf. Sci. Technol. 1977, 12, 35–58. [Google Scholar]
  78. With, H.D.; McCain, K.W. Bibliometrics. Annu. Rev. Inf. Sci. Technol. 1988, 24, 119–186. [Google Scholar]
  79. Nicholas, D.; Richtie, M. Literature and Bibliometrics; Bingley: London, UK, 1978. [Google Scholar]
  80. Kosch, O.; Szarucki, M. Transatlantic affiliations of scientific collaboration in strategic management: A quarter-century of bibliometric evidence. J. Bus. Econ. Manag. 2020, 21, 627–646. [Google Scholar] [CrossRef] [Green Version]
  81. Thelwall, M. A history of webometrics. Bull. Am. Soc. Inf. Sci. Technol. 2012, 38, 18–23. [Google Scholar] [CrossRef]
  82. Bradford, S.C. Sources of information on specyfic subject. Engineering 1934, 137, 85–86. [Google Scholar]
  83. Lotka, A.J. The frequency distribution of scientific productivity. J. Wash. Acad. Sci. 1926, 16, 317–324. [Google Scholar]
  84. Zipf, G.K. Human Behavior and the Principle of Least Effort. An Introduction to Human Ecology; Addison-Wesley Press: Cambridge, UK, 1949. [Google Scholar]
  85. Tarragona, J.; de Garcia, A.; Cabeza, L.F. Bibliometric analysis of smart control applications in thermal energy storage systems. A model predictive control approach. J. Energy Storage 2020, 32, 1017041–10170413. [Google Scholar] [CrossRef]
  86. Jiang, D.J.; Shi, B.I.; Ouyang, H.; Fan, Y.; Lin Wang, Z.; Chen, C.M.; Li, Z. A 25-year bibliometric study of implantable energy harvesters and self-powered implantable medical electronics researches. Mater. Today Energy 2020, 16, 100386. [Google Scholar] [CrossRef]
  87. Sarkodie, S.A.; Owusu, P.A. Bibliometric analysis of water–energy–food nexus: Sustainability assessment of renewable energy. Curr. Opin. Environ. Sci. Health 2020, 13, 29–34. [Google Scholar] [CrossRef]
  88. Brown, M.A.; Soni, A.; Doshi, A.D.; King, C. The persistence of high energy burdens: A bibliometric analysis of vulnerability, poverty, and exclusion in the United States. Energy Res. Soc. Sci. 2020, 70, 101756. [Google Scholar] [CrossRef]
  89. Calderón, A. Where is Thermal Energy Storage (TES) research going?—A bibliometric analysis. Solar Energy 2020, 200, 37–50. [Google Scholar] [CrossRef]
  90. Chen, H.-Q.; Wang, X.; He, L.; Chen, P.; Wan, Y.; Yang, L.; Jiang, S. Chinese energy and fuels research priorities and trend: A bibliometric analysis. Renew. Sustain. Energy Rev. 2016, 58, 966–975. [Google Scholar] [CrossRef]
  91. Wang, Y.; Lai, N.; Zuo, J.; Chen, G.; Du, H. Characteristics and trends of research on waste-to-energy incineration: A bibliometric analysis, 1999–2015. Renew. Sustain. Energy Rev. 2016, 66, 95–104. [Google Scholar] [CrossRef]
  92. Mao, G.; Liu, X.; Du, H.; Zuo, J.; Wang, L. Way forward for alternative energy research: A bibliometric analysis during 1994–2013. Renew. Sust. Energ. Rev. 2015, 48, 276–286. [Google Scholar] [CrossRef]
  93. Azevedo, S.G. Supply chain of renewable energy: A bibliometric review approach. Biomass Bioenergy 2019, 126, 70–83. [Google Scholar] [CrossRef]
  94. Payman, A.; Searcy, C.; Jaber, M.Y. Energy-related performance measures employed in sustainable supply chains: A bibliometric analysis. Sustain. Prod. Consum. 2016, 7, 1–15. [Google Scholar]
  95. Yu, H.; Wei, Y.; Tang, B.; Mi, Z.; Pan, S. Assessment on the research trend of low-carbon energy technology investment: A bibliometric analysis. Appl. Energy 2016, 184, 960–970. [Google Scholar] [CrossRef]
  96. Menéndez-Manjón, A.; Moldenhauer, K.; Wagener, P.; Barcikowski, S. Nano-energy research trends: Bibliometrical analysis of nanotechnology research in the energy sector. J. Nanopart. Res. 2011, 13, 3911–3922. [Google Scholar] [CrossRef]
  97. Paananen, A.; Makinen, S.J. Bibliometrics-based foresight on renewable energy production. Foresight 2013, 15, 465–476. [Google Scholar] [CrossRef]
  98. Corsini, F.; Certoma, C.; Dyer, M.; Frey, M. Participatory energy: Research, imaginaries and practices on people’ contribute to energy systems in the smart city. Technol. Forecast. Soc. Chang. 2018, 142, 322–332. [Google Scholar] [CrossRef]
  99. Zupic, I.; Čater, T. Bibliometric Methods in Management and Organization. Organ. Res. Methods 2015, 18, 429–472. [Google Scholar] [CrossRef]
  100. PRISMA Statement. Available online: http://prisma-statement.org/PRISMAStatement/CitingAndUsingPRISMA (accessed on 10 August 2021).
  101. Huang, Z.; Chen, H.; Liu, Z. The 100 top-cited systematic reviews/meta-analyses in central venous catheter research: A PRISMA-compliant systematic literature review and bibliometric analysis. Intensiv. Crit. Care Nurs. 2020, 57, 102803. [Google Scholar] [CrossRef] [PubMed]
  102. Chew, C.; Eysenbach, G. Pandemics in the Age of Twitter: Content Analysis of Tweets during the 2009 H1N1 Outbreak. PLoS ONE 2010, 5, e14118. [Google Scholar] [CrossRef] [PubMed]
  103. Öztürk, N.; Ayvaz, S. Sentiment analysis on Twitter: A text mining approach to the Syrian refugee crisis. Telemat. Inform. 2018, 35, 136–147. [Google Scholar] [CrossRef]
  104. Alsaeedi, A.; Zubair, M. A Study on Sentiment Analysis Techniques of Twitter Data. Int. J. Adv. Comput. Sci. Appl. 2019, 10, 2. [Google Scholar] [CrossRef] [Green Version]
  105. Khan, S. Qualitative Research Method: Grounded Theory. Int. J. Bus. Manag. 2014, 9, 224. [Google Scholar] [CrossRef] [Green Version]
  106. Schneiker, A. Telling the Story of the Superhero and the Anti-Politician as President: Donald Trump’s Branding on Twitter. Political Stud. Rev. 2019, 17, 210–223. [Google Scholar] [CrossRef]
  107. Ciechanowski, L.; Jemielniak, D.; Gloor, P. TUTORIAL: AI research without coding: The art of fighting without fighting: Data science for qualitative researchers. J. Bus. Res. 2020, 117, 322–330. [Google Scholar] [CrossRef]
  108. Hill, S.; Scott, R.A. Developing an Approach to Harvesting, Cleaning, and Analyzing Data from Twitter Using R. Inf. Syst. Educ. J. 2017, 15, 42–54. [Google Scholar]
  109. Kreft, J. Za Fasadą Społeczności. Elementy Zarzadzania Nowymi Mediami; Wydawnictwo Uniwersytetu Jagiellońskiego: Kraków, Poland, 2015. [Google Scholar]
  110. Castells, M. The Risk of the Network Society; Blackwell: Cambridge, MA, USA, 2009. [Google Scholar]
  111. Van Eck, N.J.; Waltman, L. Software survey: VOSviewer, a computer program for bibliometric mapping. Scientometrics 2010, 84, 523–538. [Google Scholar] [CrossRef] [PubMed] [Green Version]
  112. Aria, M.; Cuccurullo, C. Bibliometrix: An R-tool for comprehensive science mapping analysis. J. Informetr. 2017, 11, 959–975. [Google Scholar] [CrossRef]
  113. R Development Documentation. Available online: https://www.r-project.org/ (accessed on 10 August 2021).
  114. R: Collecting and Analyzing Twitter Data. Available online: https://mkearney.github.io/nicar_tworkshop/#1 (accessed on 10 August 2021).
  115. IPSOS. Climate Change: Citizens are Worried but Torn between a Need to Act and Rejection of Constraints. Available online: https://www.ipsos.com/en/climate-change-citizens-are-worried-torn-between-need-act-and-rejection-constraints (accessed on 13 August 2021).
  116. Pearl, J.; Mackenzie, D. The Book of Why: The New Science of Cause and Effect; Basic Books Pearl: New York, NY, USA, 2018. [Google Scholar]
  117. Almind, T.C.; Ingwersen, P. Informetric analyses on the world wide web: Methodological approaches to ‘webometrics’. J. Doc. 1997, 53, 404–426. [Google Scholar] [CrossRef] [Green Version]
Figure 1. Morphology of the problem.
Energies 14 07094 g001
Figure 2. Overall share of energy from renewable sources (source: Eurostat Research, 2020).
Energies 14 07094 g002
Figure 3. Phases of preparatory work for the needs of bibliometric analysis presented in the paper.
Energies 14 07094 g003
Figure 4. Country specific production of articles indexed in Scopus and Web of Science (keyword “renewable energy” 2019–2021). The blue illustrates the number of publications in selected countries—the darker the colour, the more publications in the analysed period.
Energies 14 07094 g004
Figure 5. Twitter users—unique locations.
Energies 14 07094 g005
Figure 6. Most relevant authors of articles indexed in Scopus and Web of Science (2019–2021).
Energies 14 07094 g006
Figure 7. Top users in #renewableenergy tweets.
Energies 14 07094 g007
Figure 8. WordCloud of authors’ keywords.
Energies 14 07094 g008
Figure 9. WordCloud of authors’ keywords.
Energies 14 07094 g009
Figure 10. WordCloud of Twitter hashtags.
Energies 14 07094 g010
Figure 11. Sentiment analysis by tweet.
Energies 14 07094 g011
Figure 12. Chi-square distribution.
Energies 14 07094 g012
Figure 13. Plot of residuals vs. predicted values.
Energies 14 07094 g013
Table 1. Major types of renewable energy sources.
Type of Renewable EnergySourceAdvantagesDisadvantages
Solar EnergySunlightInfinite resource, environmentally friendly, works in many climatesExpensive and requires a lot of space, solar manufacturing is not good for the environment
Wind EnergyWindLow operational costs, efficient use of land space, renewable and clean source of energyNoise and environmental problems, intermittent
Geothermal EnergyUnderground heat of earthInfinite resourceLimited only to volcanic areas, energy fluid needs to be pumped back into the underground reservoirs faster than it is depleted, management is required to maintain sustainability
Biomass EnergyPlant or animal wasteCost effective and carbon neutralExpensive and requires a lot of space
Hydropower (or Hydroelectric Power)Gravitational force of failing or flowing waterFlexible and reliableExpensive
Tidal EnergyMovement tideLong lifespans, zero-carbon emissions, high power outputExpensive, environmental issue, limited site availability
Wave EnergyMovement of seawaterEnvironmentally friendly, reliableLimited only to seaside and islands, expensive
Table 2. Results of the literature search strategy.
DescriptionScopusWeb of Science
Results in all scientific disciplines/all catalogues47,73863,088
Results narrowed down to:
-
“social sciences” (Scopus)
-
Arts & Humanities (A& HCI)
-
Conference Proceedings Social Science & Humanities (CPCI -SSH)
-
Social Science Citation Index (SSCI) (WoS)
3323 (6.75%)7367 (11.68%)
Results after removal of duplicated records, incomplete records, and manual verification of disciplines1114 (33.52%)1329 (18.13%)
Results used in further bibliometric analysis2443 (2.20%)
Table 3. Results of Twitter search strategy.
Tweets marked as hashtag #renewableenergy, published by Twitter from 15 to 27 July 202118,000 tweets
Number of unique Twitter users who use the hashtag #renewablenergy at least once in the analysed period1598 users
Number of analysed words448,116
Number of analysed hashtags1124
Table 4. Characteristics of clusters.
No.ClusterExamples of Keywords
1Keywords related to technology (249 items)Big data, blockchain, energy storage, biogas, biomasses, solar power, wind power, electric power, hybrid power systems
2Keywords related to social issues and social changes (246 items)Action plan, business development, business models, climate change, community development, law, governance approach
3Keywords related to ecology (115 items)Carbon emission, coal industry, ecological footprints, environmental degradation, pollution, destruction, negative effects
4Keywords related to agriculture and production (102 items)Agricultural emission, agricultural robots, anaerobic digestion, greenhouse gases, recycling, life cycles, waste treatment
5Keywords related to hydrology and urban development (95 items)Ground water, housing, hydroelectric power, photovoltaic, residential building, residential energy, urban growth, water supply, zero energy buildings
6Keywords related to education and the necessity to counteract threats (95 items)Controlled study, data mining, e-learning, education, engineering education, future research direction, health care policy
7Keywords related to analytical methods (66 items)Artificial neural networks, cluster analysis, data handling, fuzzy logic, machine learning, trend analysis
Publisher’s Note: MDPI stays neutral with regard to jurisdictional claims in published maps and institutional affiliations.

