Review

State-of-the-Art Review of Positive Energy Building and Community Systems

by
Gokula Manikandan Senthil Kumar
1 and
Sunliang Cao
1,2,3,*
1
Renewable Energy Research Group (RERG), Department of Building Services Engineering, Faculty of Construction and Environment, The Hong Kong Polytechnic University, Hong Kong, China
2
Research Institute for Sustainable Urban Development (RISUD), The Hong Kong Polytechnic University, Hong Kong, China
3
Research Institute for Smart Energy (RISE), The Hong Kong Polytechnic University, Hong Kong, China
*
Author to whom correspondence should be addressed.
Energies 2021, 14(16), 5046; https://doi.org/10.3390/en14165046
Submission received: 12 July 2021 / Revised: 10 August 2021 / Accepted: 12 August 2021 / Published: 17 August 2021

Abstract

:
A positive energy system that produces more renewable energy than its demand while ensuring appropriate comfort levels is an excellent path towards increasing the portion of renewable energy, reducing carbon emission, and increasing the energy system’s overall performance. In particular, it has been believed as step forward towards zero energy systems. Recent progress in positive energy building and community levels is gaining interest among different stakeholders. However, an inadequate understanding of the positive energy system is widely noticed in many projects, and a shortage of standard details on the positive energy system still prevails in the research community. Therefore, a state-of-the-art review of positive energy building and community is conducted in this paper. Firstly, this paper begins with the definitions and concepts of positive energy buildings and communities. Secondly, it comprehensively describes the energy supplies, demands, indicators, storage, energy management, roles of stakeholders, and bottlenecks of positive energy systems. Thirdly, the main differences between positive energy buildings and communities are summarized. Fourthly, the impact of smart energy grids and new energy vehicles on the positive energy buildings and communities is derived. As a conclusion, this paper shows that even though all the energy-efficient buildings such as passive buildings, nearly zero energy buildings, zero energy buildings, positive energy buildings look like an up-trending scale of renewable penetration, considerable differences are visible among all, and the same thing applies to the community level. Furthermore, considerable differences exist when comparing between positive buildings and communities regarding both the technical and economic perspectives.

1. Introduction and Background

The world’s energy consumption is snowballing, primarily because of the fast advances in the developing part of the world. The building sector’s energy demand is estimated to represent around 40% of global energy usage [1]. The building sector accounts for 30% of global GHG emissions [2]. Buildings play a vital role in solving energy-related problems because of their large share in global energy consumption with their long life term [3]. Many countries believe that focusing on the building sector is essential to cut down the energy consumption and carbon emissions, leading them to achieve climate targets. The Swiss 2000-Watt Society vision recognizes buildings as a potential contributor to increase energy efficiency and decrease GHG emissions [4]. However, the ideal way to attain this goal in the building sector is not yet clear.
The pace of transition from conventional energy to renewable energy has been increasing over the last two decades [5]. It is estimated that the share of renewable energy in global electricity generation increased to 29% in 2020, up from 27% in 2019 [6]. Together with governments, many private sector entities and regional communities play a prime role in renewable energy growth by actively contributing their part [7]. Renewable energy development is occurring in parallel with the shift from centralized to decentralized energy production [8]. Goldthau reported that cost-savings, efficiency gains, increased power capacity, higher system reliability and stability and market developments are the factors pushing towards the decentralization of energy production [9]. Various climate/energy targets such as the Paris Agreement [10] and the 2030 Climate & Energy framework [11] have been proposed in the current decade, which accelerate the actions and measures to increase the portion of renewable energy, decrease the energy demand and increase the energy efficiency. To achieve these targets, a decade-old concept named net-zero energy system (NZES) [12] has come back with a renewed identity called positive energy system (PES). Many countries and organizations have already established regulations to bring NZES. For instance, the Energy Performance of Buildings Directive (EPBD) created the guidelines for the promotion of NZEB and requires the European Union member states to follow it [12].
PEB is an ambiguous term that generally defines the building which generates more energy than its demand in a year. The concept of positive energy building (PEB) claims improvements over NZEB in several areas, such as on/off-site renewable energy generation, purchasing renewable energy credits, reducing carbon emission, reducing GHG emission, reducing building energy cost, reducing overall building cost, and supporting the utility grid. Different definitions are being followed to state PEBs based on energy, exergy, cost, emission, and grid connection, listed in Table 1. Rather than considering exporting the excess energy and importing the deficit, the emphasis in PEB shifts to maximizing energy performance in a systematic approach. Efforts have been concomitantly being made on formulating clear definitions of the positive energy system (PES) to provide clarity and theoretical framing [13]. In addition to the theoretical issues, PES also comes with many practical issues because of introducing several new designs in buildings and modifications in conventional energy technology.
New notions called positive energy community [20,21] and positive energy district [22,23,24] were coined to estimate the potential impact and feasibility of positive energy concept in the urban context. A broad range of interpretation and operative technical challenges must be performed to discover the urban scale’s positive energy objectives. The number of community buildings is expected to increase as a consequence of rapid urbanization. Therefore, it is essential to examine and improve the building energy at the community level. Dealing with the system where renewable energy resource is shared, four concepts are used: positive energy campus (PECa) [25], positive energy portfolio (PEP), positive energy community (PEC) [26] and positive energy district (PED) [13,22,27]. These concepts are derived from the PEB concept by replacing the building term to campus, portfolio, community, and district, respectively. Campus, portfolio and community define a cluster of buildings that contain renewable energy systems in a specific location. However, it is differed by the ownership: an institution owns a campus, a single entity owns a portfolio and the occupants/users of the community share the community. District is a big group and a combination of campus, portfolio, and community together. Li and Wen [28] said that being a collaborative concept, buildings can freely share their renewable energy generation, storage, and information mutually within the community. Huang and Sun [29] studied that grouping of buildings with comparable energy characteristics gives fewer benefits due to limited interaction, and grouping of buildings with different energy characteristics results in incredible benefits. Sun et al. [30] said that the combination of different buildings could exhibit significant advantages at the community level, such as reduced energy cost and reduced grid interaction. IEA EBC Annex 83 [13] explains that PEC should reduce the burden on interconnected energy grid by providing options for increasing load matching generation and self-consumption, technologies for various energy storage, and energy flexibility with optimized energy strategies. Researchers and policymakers have foreseen that the role of PEBs and PECs are crucial to attaining the climate/energy targets [31,32].
Nevertheless, some researchers believe that positive energy may be subject to a controversial interpretation. Research organizations such as the Fraunhofer Institute for Buildings Physics (Fraunhofer IBP) and Building Performance Institute Europe (BPIE) have stated that it is not easy to emphasize PEBs as an option for future European building standards when European member countries are already struggling with NZEBs [33]. However, a radical change in the building energy sector is cardinal to address the projected climate change as a result of the unprecedented surge of construction industry in developing nations, as well as to ensure the availability of affordable energy to all. Essentially, PEB is not an unrealistic concept, but is technically feasible with increasing market uptake, and will become reliable and economically viable [13]. To accomplish this, the research in this field should be moved beyond demonstration and towards mainstream implementation. Besides, compared to the technical challenges, a more critical point is the political will to show the right signals to the market [33]. The government must explore how PEBs can be fully integrated into national legislation and enforced in regulatory policies to oblige the construction and the energy markets. It should encourage researchers to examine the commercial uptake of innovative energy technologies. The policies should gently force the market forward by incentivizing the mandatory energy performance and recognizing the voluntary initiatives.
To illustrate the evolution and trend of ZEB and PEB, a series of searches were made on the web of science website in August 2021, searching for the critical keywords based on the title. According to the investigation, there are 379 publications with ZEB in their title and 17 publications about PEB. When accounting for all the popular PEB related keywords such as positive energy building, plus-energy building and plus-energy house, the total number of publications on PEB becomes 56. A detailed comparison of ZEB and PEB publications is illustrated by year in Figure 1. Similarly, the total number of publications on ZEC related keywords such as zero energy community, zero energy district and zero energy neighborhood is 40. The total number of publications on PEC associated keywords, such as positive energy community, plus-energy community, positive energy district, plus-energy district and energy positive neighborhood, becomes 14. Figure 2 shows the comparison of the number of publications on ZEC and PEC by year. It informs that there is no uniformity even in the title of positive energy-related publications. Moreover, from the literature review, it is noticed that there is no systematic review on positive energy concepts such as PEB and PEC. Many positive energy-related works are overshadowed and titled as zero energy.
Therefore, this paper aims to fix the academic gap by delivering a comprehensive review on positive energy building and community while systematically differentiating it from low energy and zero energy concepts. A series of comparisons between two different scales of positive energy concepts, such as building and community, should be addressed to illustrate the similarity and dissimilarity among its key factors. Moreover, the impacts of rapidly penetrating two modern developments in the building sector, such as the smart energy grid and the new energy vehicles, are inevitable when discussing the PES. Firstly, the smart energy grid incorporates the latest advancements and shifts the energy industry towards a new era of power reliability, availability and efficiency [34,35,36]. Digitalization of energy networks enables bi-directional communication between the utility and the customers [37,38]. Secondly, while the number of electric vehicles was rapidly increasing and predicted to explode in the coming years, EV charging stations in buildings are already ubiquitous and can become a standard building component in the next decade to fulfil consumers’ demands [39,40]. Charging in residential and commercial buildings will continue to be the dominating location for the foreseeable future in the EV markets [41,42,43].

2. Methodology

Despite the extensive debate of the PEBs and PECs over a decade, there is no universal definition to represent these concepts yet. The state-of-the-art review of the positive energy building and community is conducted based on the outline depicted in Figure 3. It shows that it is composed based on six primary headings: positive energy building (Section 3), positive energy community (Section 4), the difference between PEB and PEC (Section 5), the impact of the smart energy grid (Section 6), the impact of new energy vehicle (Section 7), and future outlooks and future works (Section 8). Firstly, this paper reviews the energy supply, energy demand, energy balance, and it helps to understand the broad definition of PEBs and PECs clearly. Secondly, it elaborates its details based on different energy storage and energy management system. The perspective of different stakeholders on PEBs and PECs are discussed comprehensively. Challenges and bottlenecks involved in positive energy buildings and communities sorted out step by step. The impacts of modern technologies on PEBs and PECs, such as smart energy grids and new energy vehicles, are described. This paper also states the main difference between the PEBs and PECs, and their future outlooks.

3. The Positive Building Energy System

PEB refers to an energy-efficient building that generates more energy from renewables than its consumption to attain positive status on primary energy utilization, carbon emission, and energy cost while maintaining comfort on an annual basis [25,44]. This emphasis shifts to maximizing energy performance in a systematic approach, such as increased load matching and reduced grid interaction [44]. The comfort of the building should not be sacrificed to increase the energy-efficiency or decrease the energy demand of the building [45]. The comfort level depends on many factors like climate condition, local tradition, culture, and the purpose of the building. The renewables can be either integrated into the building footprint or supplied as external energy support to the building [25]. When the building generates excess energy, it exports to the grid, and when the building demands energy, then it imports from the grid. This two-way energy flow results in a net export of energy to the grid in a specific period [46]. Harkouss [47] summarized the net-zero energy buildings’ design in three steps (passive strategies, energy-efficient technologies, and renewable energy systems, which can also be partially applied to PEBs despite more stringent measures to enhance the energy efficiency and renewable penetration. Researchers are highlighting the aspects that should be prioritized when designing PEBs: passive techniques [48,49], energy-efficient measures [48,50] and renewable energy generation [51,52]. Typical examples of the PEBs in different parts of the world are listed in Table 2, with their characteristics of the annual demand, generation, and net export to the utility grid. Echohaven house is a single-family house constructed in Calgary (AB, Canada), and it achieves net energy positivity of 199 kWh by generating 6164 kWh and consuming 5965 kWh through following energy efficiency measures and load reducing strategies mainly via recovering the maximum possible heat from the drainage water, ventilation outlet and kitchen exhaust [48]. The Hadera kindergarten in Israel attained net positivity of 4455 kWh by adhering to a passive solar design, external shading and an insulated façade, which is not commonly practiced in Israel, and natural ventilation in order to reduce the energy consumption, and by using an innovative automated chimney for ventilation and a two-step daylight controller for lighting [49]. The renewable energy in the Lombardo Welcome Center in the USA is effectively designed using 529 rooftop PV panels, solar glass along the exterior wall, and a 20-panel dual-axis tracking array so as to realize the PEB status [52]. Also in the USA, the Lincoln Net Positive Farmhouse is constructed to consume 70% less energy than the standard building code, and annually produce 48% more energy than it demands [51]. A large overhanging roof holds 428 kW of PV made the six-story SDE4 building in Singapore reach PEB status with an annual net surplus of 148,595 kWh [53]. An annual surplus generation made a building in New Zealand become PEB; nevertheless, it is named ZEB [50]. A mobile app is made to access the information from the monitoring device that helps the owner view real-time performance data to conserve comfort in the house that only demands passive heating and natural ventilation [50].

3.1. Energy Supply, Demand and Their Balances

3.1.1. Passive Energy Techniques of PEBs

PEB emphasizes reduced energy consumption, increased energy efficiency, and excess energy generation to meet its demand. Figure 4 compares the supply, demand, and balance of a PEB with a ZEB and a conventional building. It illustrates that PEB status can be achieved by reducing consumption and increasing energy-efficiency in a systematic approach rather than merely increasing the generation. In contrast with conventional buildings that mainly depend on electric appliances, such as electric heater/cooler and artificial lighting, in order to maintain comfortable lighting and temperature level of the building, PEB utilizes passive design strategies by taking advantage of the local climate to reduce the energy consumption. Rodriguez-Ubinas et al. [55] used the following categorization to study passive energy techniques and their effects on building performance: building envelope, building orientation and geometrical attributes, other passive approaches, and hybrid solutions. The passive design strategies have substantial potential to reduce energy consumption and can help to achieve PEB [55,56,57,58]. Passive cooling dissipation techniques such as natural ventilation and natural night ventilation have been presumed as essential for improving the indoor environment quality and reducing cooling demands [59,60,61]. Passive cooling approaches paired with a lower cooling load can provide good thermal summer comfort while reducing cooling energy usage [62,63]. Furthermore, natural night ventilation cools the exposed structure that has absorbed heat from the day before and helps to reduce the overheating risk of passive buildings [62,64]. Tobias et al. [65] evaluated the overall energy efficiency and comfort provided by controlled natural ventilation in energy-efficient offices and non-refurbished building stock to a mechanically ventilated reference. Adam et al. [66] assessed the resilience of several passive cooling control systems in achieving optimal comfort and energy scenarios for low-energy indoor office buildings under current and future adverse weather.

3.1.2. Energy Performance and Efficiency of PEBs

The energy performance and efficiency of the PEBs should follow more stringent standards than nearly or net zero-energy buildings to minimize the local demand. Mokhtara et al. [68] analyzed various energy efficiency measures, such as solar thermal and geothermal appliances for space heating, space cooling, and domestic hot water needs, to attain PEB status using the analytic hierarchy process (AHP) method. Erhorn et al. [58] compared different energy-efficient technologies for heating, ventilation, and lighting systems when renovating a traditional school building into a PEB. The energy-efficiency of the system has been improved by using a mechanical ventilation system with high heat recovery rates even with the combination of natural ventilation and maximized daylight usage by using electrical sensors for shading and lighting [58]. Javed et al. [69] made a systematic and demonstrative study using ground source heating and cooling systems for a positive energy kindergarten in Norway. The result shows that it is practical to reach a seasonal COP of more than 6 for heat pump systems and a seasonal energy efficiency ratio of more than 80 for free ground cooling systems [69].

3.1.3. Renewable Energy Systems of PEBs

The combination of the on-site and off-site renewable energy systems varies for PEBs, which depend on the factors of climatic and geological conditions, building types, and techno-economic and techno-political constraints. Harkouss [47] analyzed 30 different simulated cases in eight different climatic zones for NZEB analysis, but the results essentially show that 18 cases are already PEBs. Harkouss [47] also compared all the cases, and the unifying factor is that most cases depend on PV systems to support the electric demand while relying on geo/solar-thermal to support the thermal demands. Their results showed that moderate continental regions rely more on geothermal systems, while semi-arid, humid subtropical and humid continental regions rely more on solar collectors, and the marine west coast and Mediterranean regions rely on both of the aforementioned technologies [47]. Compared to the high latitude regions, the PEBs in the tropical and subtropical regions can generally have a better grid-interaction performance considering the good matching between the cooling-dominated demands and the solar resources [14]. Dinkel et al. [70] proposed that the buildings in tropical countries have high load matching and low grid interaction factors due to the availability of high solar irradiance, which matches the cooling demand period. Zomer et al. [71] assessed the photovoltaic systems’ performance in a positive energy solar energy laboratory building located in Brazil, and both the simulated and experimental results illustrate that the performance ratio of all the cases considered in the study is around 80%. Compared with ground-mounted PV, BIPV in PEB can outperform even it is not ideally installed and partially shaded when the electrical system design follows architectural decisions [71]. On the other hand, the PV supported PEBs in the high-latitude regions will impose higher seasonal stresses on the electric grid [72]. Cao [73] analyzed an NZEB, which is already PEB on an annual basis, with a variable rated capacity of photovoltaics and wind turbine in Finnish conditions. The results show that the PEB [73] in Finland imposes significant importing (up to 17 kWh/m2·mon, December) and exporting (up to 18 kWh/m2·mon, July) stresses on the grids in winter and summer, respectively.

3.1.4. Utility Grid Interaction in PEBs

The flow of energy from the utility grid to the conventional building is one-directional. In contrast, the energy performance of PEBs is complex, and the bi-directional energy flow is the core aspect of PEBs. Much like the electricity grid, the district heating/cooling grid can also play a vital role in PEBs. Wang et al. [15] noticed that the annual electricity consumption and generation of a studied zero-energy building have already achieved the positive energy performance: the annual electricity generation of 7305.9 kWh from a combination of PV and wind turbines can fulfill the building’s total energy demand of 6008.9 kWh from lighting, appliances, and the auxiliary heating for SDHW and floor heating system; the remaining 1297 kWh of electricity is used for the water pumping, the charging of electric vehicles, and the exportation to the grid for financial benefits [15]. Dumont et al. [74] concluded that HP/ORC unit, coupled with a 138.8 m2 solar thermal collector roof, could remake a Danish single-family house into a PEB under annual electricity generation of 3012 kWh and total electrical demand of 2318 kWh. When transitioning from NZEB to PEB, rather than concentrating solely on the quantity of energy used and exchanged, equal consideration should be provided to energy quality, for instance, aiming for the least amount of energy wasted during the grid interaction and the least amount of energy transformed into lower quality types [44]. It is vital to understand how, where, and when the energy is shared within the system boundary and the options for energy cascading that can effectively use energy flows and improved exergy performance [44].

3.1.5. Performance Indicators of PEBs

The performance indicators in designing PEBs are associated to energy, economy, and environmental aspects. PEB’s performance is examined and assessed using copious indicators like net primary energy consumption, net equivalent CO2 emission and net energy costs [75]. Pulselli et al. [76,77] suggested that accounting exergy or energy or emergy could be appropriate to define energy buildings from the energy outlook as they rely more on the fundamental thermodynamic principles. Cao et al. [78] exclusively developed six matching indices based on the extension of two underlying indices; on-site energy fraction (OEF) and on-site energy matching (OEM). These two indicators come with the postfixes of “h”, “c”, and “e” to represent the heating, cooling, and electricity, respectively [78]. Even though these indicators are developed initially for NZEBs, they are also suitable to evaluate PEBs [73]. Dávi et al. [79] investigated various load matching (LM) and grid interaction (GI) indicators to measure the performance of PEBs based on the indicators which were actually developed for NZEBs studies [80]. Harkouss evaluated the performance of energy buildings with three more indicators: Energy Performance Index (EPI), Home Energy Rating System (HERS), and Energy Efficiency Rating (EER) [47]. It should be noted that presently no scheme is specifically made for PEBs in many countries and PEBs are generally following the scheme of ZEBs [81].

3.1.6. Oultine of Energy Supply, Demand and Their Balances in PEBs

From the details mentioned above, it is clear that rather than prioritizing the excess annual renewable energy generation, net-positivity should also be explored in terms of a building’s contribution to the context of the systems [44]. From the balancing perspective, it can be seen that some indicators in PEBs are the same as ZEBs, and a few more indicators are used to define the performance factors such as load matching, grid interaction, vehicle interaction, energy flexibility and embodied energy [73,79,82]. The commonly used economic indicators in PEB are LCOE, IRR, payback period, and NPV [31,83,84]. The generally used environmental indicators are net primary energy consumption and carbon emission [31,85]. Passer et al. [82] used environmental indicators such as cumulative energy demand non-renewable (CED n.ren.), global warming potential (GWP) and ecological scarcity (UBP) over the building lifespan when assessing the effect of future possibilities on building retrofitting approaches towards PEB. In the future, new indicators will be required to evaluate the PEB’s functionality, which includes environmental, social, and health benefits that can be realized, especially at the end-of-use [86]. More systematic indicators are also required to assess the resilience, flexibility and robustness of the positive-energy systems, which are currently either insufficient or discrete for the PEBs. By comparing the indicators on an annual basis give an understanding; nearly zero energy system works as a consumer, positive energy building acts as a generator, and the net-zero energy building performs both as a consumer and a generator.

3.2. Energy Storage

Energy storage is cardinal for the broader adaptation of distributed renewable energy systems such as those integrated with PEBs. Energy storages help PEBs to reduce the cost of maximum demand charge of electricity from the utility grid, make the system demand-responsive, maximize time-of-use, and act as an emergency backup (resilience). The cost of energy storage systems is steadily decreasing, when the cost of lithium-ion batteries has dropped by 80% in the last five years, while the numbers of energy storage installations are increasing rapidly; for instance, the global installed capacity of energy storage is doubled between 2017 and 2018 to 8 GWh [87,88,89].

3.2.1. Different Energy Storage System in PEBs

Energy storage methods in PEBs are classified into active and passive storage systems: an active system uses mechanical and electrical equipment, whereas a passive system does not. There are different flourishing technologies available for active energy storage in PEBs, such as compressed air energy storage, flywheels, flow batteries, metal-air batteries, chemical batteries, superconducting magnetic energy storage, supercapacitors, and hydrogen storage system. The most commonly used energy storage among all these is chemical batteries [31,55,90]. Earlier, pumped hydro energy storage (PHES) and low-temperature aquifers TES were not meant for building energy purposes and were only used for large-scale application such as regional energy storage, but nowadays, it is possible to use them for building energy purposes [91,92]. Concerning the passive energy storage technology, windows, walls, floors are designed to absorb, store, release and distribute energy in winter and reject heat in summer [93]. Kazanci et al. [94] investigated a plus-energy house, and the result implies that thermal mass like PCM reduces energy consumption and maximizes the energy-saving up to 30% for the summer in Madrid. The ground source heat exchanger is used as a heat source and heat sink in their research considering the ground as an energy storage [94].

3.2.2. Sizing of Energy Storage System in PEBs

The optimum sizing of energy storage is vital to improve the performance and increase the economic benefit of PEBs. Dumont et al. [83] investigated the performance and the economic aspects of varying the rated capacity of the battery integrated with a PEB. The result shows that the battery sizing leads to a minimum payback period [83]. On the other hand, an oversized battery has a lower number of cycles, resulting in a longer life span and a higher energy self-consumption of 80% [83]. An empirical correlation is made to evaluate the optimal size of the battery and the lowest payback period based on the annual electricity generation, demand, and feed-in tariff [83]. Based on the power demand profile, supply/demand matching, and flexibility requirement of the system, battery energy storage is optimally designed with a storage power and capacity of 68 kW and 6.92 MWh, respectively [95]. Caro-Ruiz et al. [95] explained that even though it is possible to reach a fully autonomous condition in some cases, the trade-off between system efficiency and flexibility is a hurdle for the implementation.

3.2.3. Standalone PEBs

Many standalone PEBs are successively made with an extensive energy storage system, but the results show that those projects are expensive [96,97]. Lacko et al. [18] theoretically and experimentally investigated a PV and wind turbine assisted hydrogen storage system to cover the electrical need of a standalone building in Slovenia. The result shows that the demand of the house can be entirely satisfied by the standalone PEB, whereas the desirable system capacity is about eight times larger than the peak power demand, resulting in a significant excess generation [18]. A large size seasonal hydrogen storage must be integrated to solve the matching problems [18]. Zhao et al. [98] proposed a standalone PV/wind/adiabatic compressed air energy storage of air tank volume 150 m3 based hybrid energy system, and the annual result shows that the system is positive, and the monthly energy balance between the generation and demand are all matched closely, even for the extreme meteorology conditions. Mehrjerdi et al. [99] examined the issues, including daily-seasonal operation patterns, uncertainty, and cogeneration of various renewable resources and storage systems in a PEB. It is noticed that the hydrogen storage and fuel cell combination can smooth out energy volatility and uncertainty [99]. Adding a reliable backup power generation system such as a biofuel electric generator can help to reduce the size of energy storage by operating at peak demand periods. Mohamed et al. [100] utilized a biomass-based CHP on energy building, which is already a PEB. Biomass, wood pellets, ethanol, or biodiesel can be imported from off-site and utilized on-site to produce electricity; it can avoid over-sizing of the energy storage system.

3.2.4. Utilization of EV’s Battery in PEBs

In the recent several years, many studies were focused on the utilization of electric vehicle batteries for building applications via B2V and V2B technologies [71,84,101]. Alirezaei [102] investigated the role of a vehicle to home technology and assured that it is possible to achieve PEB status by charging and discharging the vehicle battery when there are an excess generation and demand in the building, respectively. Perfetto and Lamacchia [103] studied the feasibility of zero energy hotels and sustainable mobility in the Aegean Sea islands in Greece. The system attained PEB status by meeting its annual demand through its PV generation, and its surplus energy generated hydrogen of 555 m3/year for its sustainable mobility [103]. Erhorn et al. [104] compiled 7250 single second-hand battery cells from a car and successfully utilized it as energy storage of 40 kWh in the Efficiency House Plus in Berlin. This sustainable re-use is possible because car batteries must be replaced when their storage capacity is decreased to 80%, which is suitable for stationary use. [104]. Battery cost influences the lifespan-based techno-economic performance of the interactive building–vehicle system more than the renewable energy cost when considering the battery systems’ frequent replacement due to the cycling ageing The lifecycle-based techno-economic performance of the interactive building–vehicle system is more dependent on the battery cost than on the cost of the renewable systems when considering the battery systems’ frequent replacement due to the cycling ageing [84].

3.2.5. Various Strategies on Energy Storage System in PEBs

Researchers have been investigating various strategies to improve the overall system performance by optimal utilization of existing energy storage. Cao et al. [105] suggested two renewable energy-thermal recharging strategies to manage the excess REe generation. The strategies include (1) Excess renewable energy-hot water recharging: the excess renewable energy is used to heat the hot water storage tank in excess by an electrical heater, and (2) Excess renewable energy-cold water recharging: cool down the cold water tank in excess through an electrically driven chiller [105]. Even though Cao et al. [105] did not intend this system for the PEB application, this would help to handle the surplus renewable energy generation of PEBs effectively when the stress is high in the grid (electrical or thermal). Iqbal et al. [106] extracted the waste heat from a chiller, designed for the ice storage with the generation from 5 kW of PV, used that for the heating of domestic hot water. PEBs share a considerable amount of energy with the utility grid and largely depend on these energy exchanges to maintain a positive annual balance. However, grid hosting capacities are finite, and they can only handle a limited number of such buildings. Large scale deployment of these buildings is a difficult task considering the grid stability problems such as voltage fluctuation and transformer overload [107]; therefore, the grid interaction should be reduced in PEBs. Romero Rodríguez et al. [108] investigated 16 different strategies using the existing 400 L hot water storage tank and 5 kWh electrical battery; the results imply that strategy-5 (in which the heat pump functions whenever needed, but only if the energy cost is lesser than the average of the current day) can reduce around 15% of energy cost used for heating, without modifying the setpoint temperature band, and without forfeiting the thermal comfort noticeably. As a byproduct, the HP consumption is decreased by 9%, the self-consumption is increased by 1%, and the HP is no longer used during peak hours [108].

3.2.6. Outline of Energy Storage System in PEBs

The factors mentioned above indicate the importance and the complicated role of energy storage in PEBs’ design. Even though oversized storage can improve the system performance even with an unoptimized design, it would not be an economical solution. Positive energy balancing can also be achieved even without energy storage by having high interaction with utility grids, but it would not meet the central theme of PEB. PEB should be more robust, reliable, independent, cost-effective, and represent less burden to the utility grid.

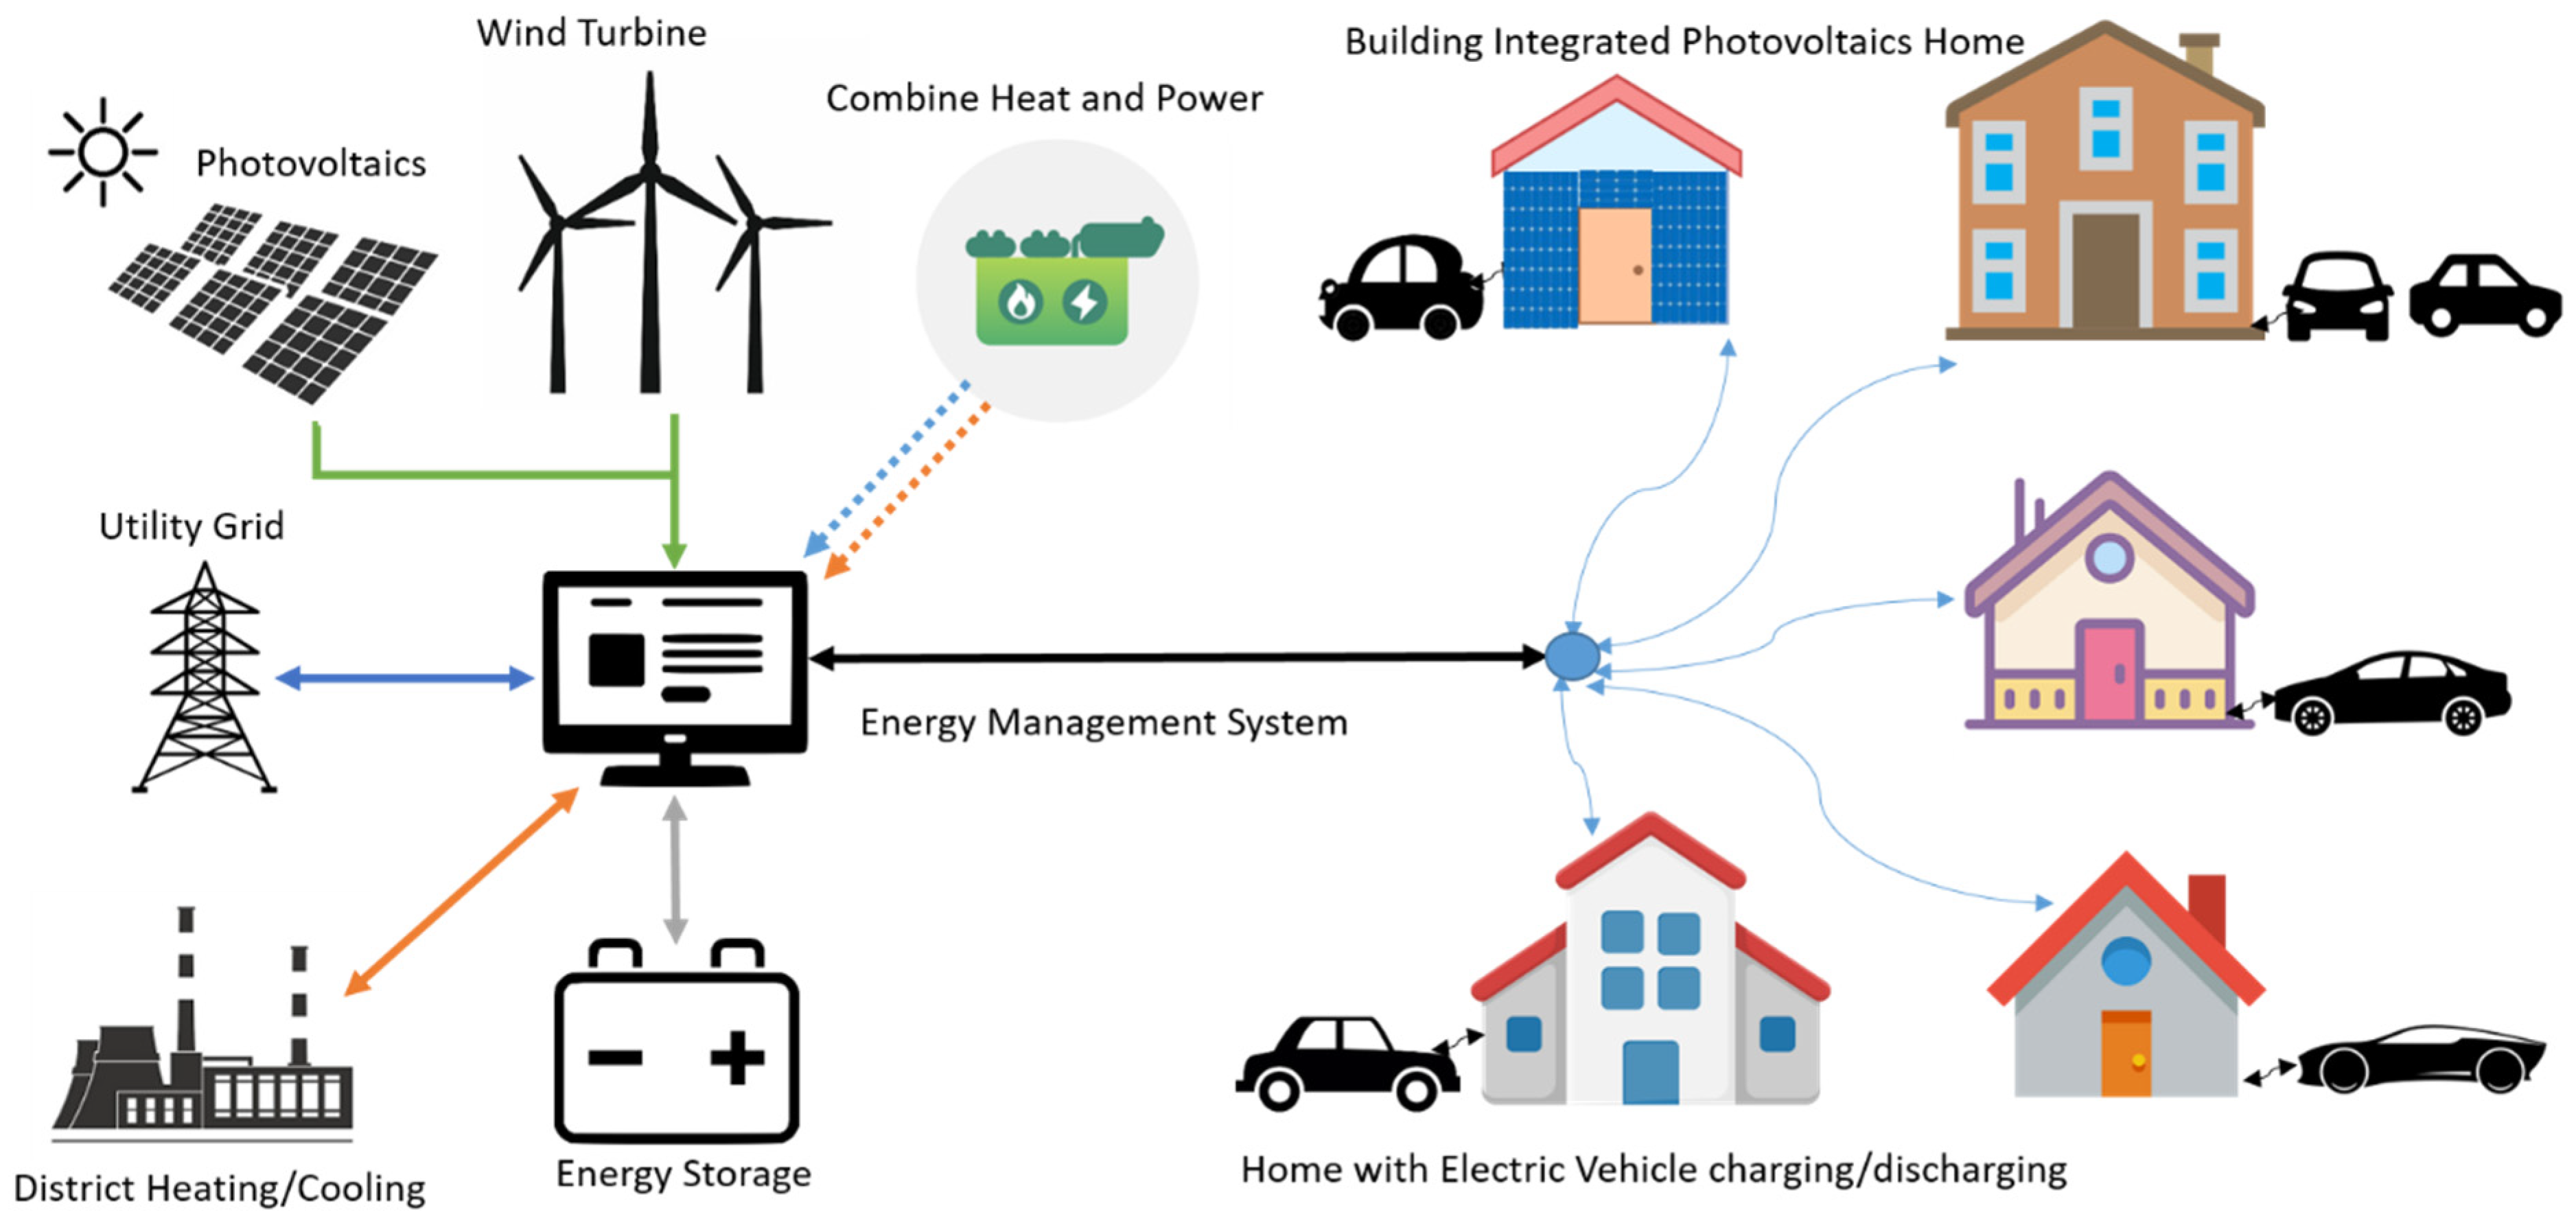
3.3. Smart Energy Management

A PEB is not necessarily a smart building. Some buildings simply generate more electricity than they consume and reach a positive status, but it is not enough to create meaningful outcomes like one that also satisfies other core concepts such as reduced energy consumption and increased energy efficiency. The complex nature of PEB explains its requirement of a smart energy management system to operate, monitor, control, and optimize the system to increase its performance in a systematic approach.
Firstly, the maximization of overall energy performance is essential in PEB. Couty et al. [109] developed a PEB energy management system with an algorithm that capable of deciding between getting the electric energy from the grid or the battery when the system faces deficit generation while considering other factors such as electricity pricing and grid carbon content. Zhou and Cao [84] formulated a EMS for improving techno-economic performance based on the battery’s relative-capacity enhancement, off-peak energy shifting, and vehicle-building interactions, in regards to the dynamic signal from renewable-demand; the result shows that it can improve the NPV of a PEB from −0.177 × $108 US to −1.065 × 10⁷ $US for Hong Kong conditions. Shaterabadi et al. [110] developed a multi-objective EMS for a PEB that included renewable energy, micro-CHP, HP, energy storage systems, ventilation, and heating-cooling-electrical demands. The EMS is formulated as mixed-integer linear programming, and the epsilon constraint method and fuzzy satisfying approach are applied to solve and extract the optimal solution; the results indicate that the total cost and pollution are reduced by approximately 35% and 51% in cost preference and by 29% and 55% in pollution preference respectively [110]. Cole and Fedoruk [44] programmed a controller to charge or discharge the vehicle parked at the building whenever there is an excess generation or demand in a building.
Secondly, some PEBs generally follow smart energy management techniques to reduce energy consumption, increase energy efficiency and improve overall performance. A smart building management system uses devices to connect different cooling, heating, lighting, DHW, equipment, and appliances to a central management application. This system combines the data from building sensors, energy meters, operational equipment, devices, and utility controllers into a single system and then draws a complete view of the building energy system. Energy management application controls and monitors the crucial building energy system to confirm they work efficiently from the installation; the scheme of the smart energy management controller of PEB is illustrated in Figure 5. The advent of the IoT supports PEBs with its extensive communicating-actuating nexus where the devices are profoundly interlinked [111]. It reports and alerts the owner to see devices with high energy use and can spot the area where consumption can be reduced or used more wisely; the circuit energy monitoring system used in the Lincoln Net Positive Farmhouse allows the owners to track their energy consumption and production [51,112]. Sometimes it can operate independently to solve the problem, which was experienced earlier, with machine learning algorithms. Casini [112] introduced an innovative home automation and information system capable of collecting real-time data and information from intelligent sensors and meters, tracking user needs and behavior, and dynamically monitoring and controlling all household equipment via optimized machine learning algorithms or an advanced human interface.
Thirdly, the smart energy management system is programmed and available as a single product in the market for different categories of buildings. Even though the below mentioned controls are made to reduce electricity cost and improve the financial benefit of NZEBs, it is found suitable for PEBs as well. For example, Home Energy Management (HEM) facilitates demand response (DR) programs in a residential application. Demand response control is a potential tool to lessen the electricity bill of energy buildings [113], and it can eradicate the undesirable peaks in the electric grid [34]. HEM can regulate and shift the controllable demand to improve the energy consumption profile via incentive-based dynamic pricing techniques while maintaining comfort [114]. The potentials of Building Energy Management System (BEMS) is studied and documented regarding energy-saving [115] and environmental impact [116,117]. Energy flexibility is a crucial term coined to use the building for demand response [118,119,120]. Zhou and Cao [121] intended to study the energy flexibility of the storage systems of a ZEB with a combination of an electric vehicle, but the results showed that the system is already PEB. The energy flexibility concept is vital when moving from ZEBs to PEBs, to effectively utilize the excess generated energy. In general, energy flexibility and other predictive concepts such as weather predictive, make the energy management system more complicated [122]. However, Kazanci and Olesen [123] mentioned that the control system in PEBs should be designed to avoid backfiring effects that increase the energy consumption of EMS while trying to reduce the energy consumption of the system with an advanced control strategy. In that sense, cost-efficient improvement is required in the smart management system to simplify the energy management and control strategies in a user-friendly interface [112]. It is fundamental, and without this, energy-building concept is a puzzle to the building energy professionals and perplex the end user.

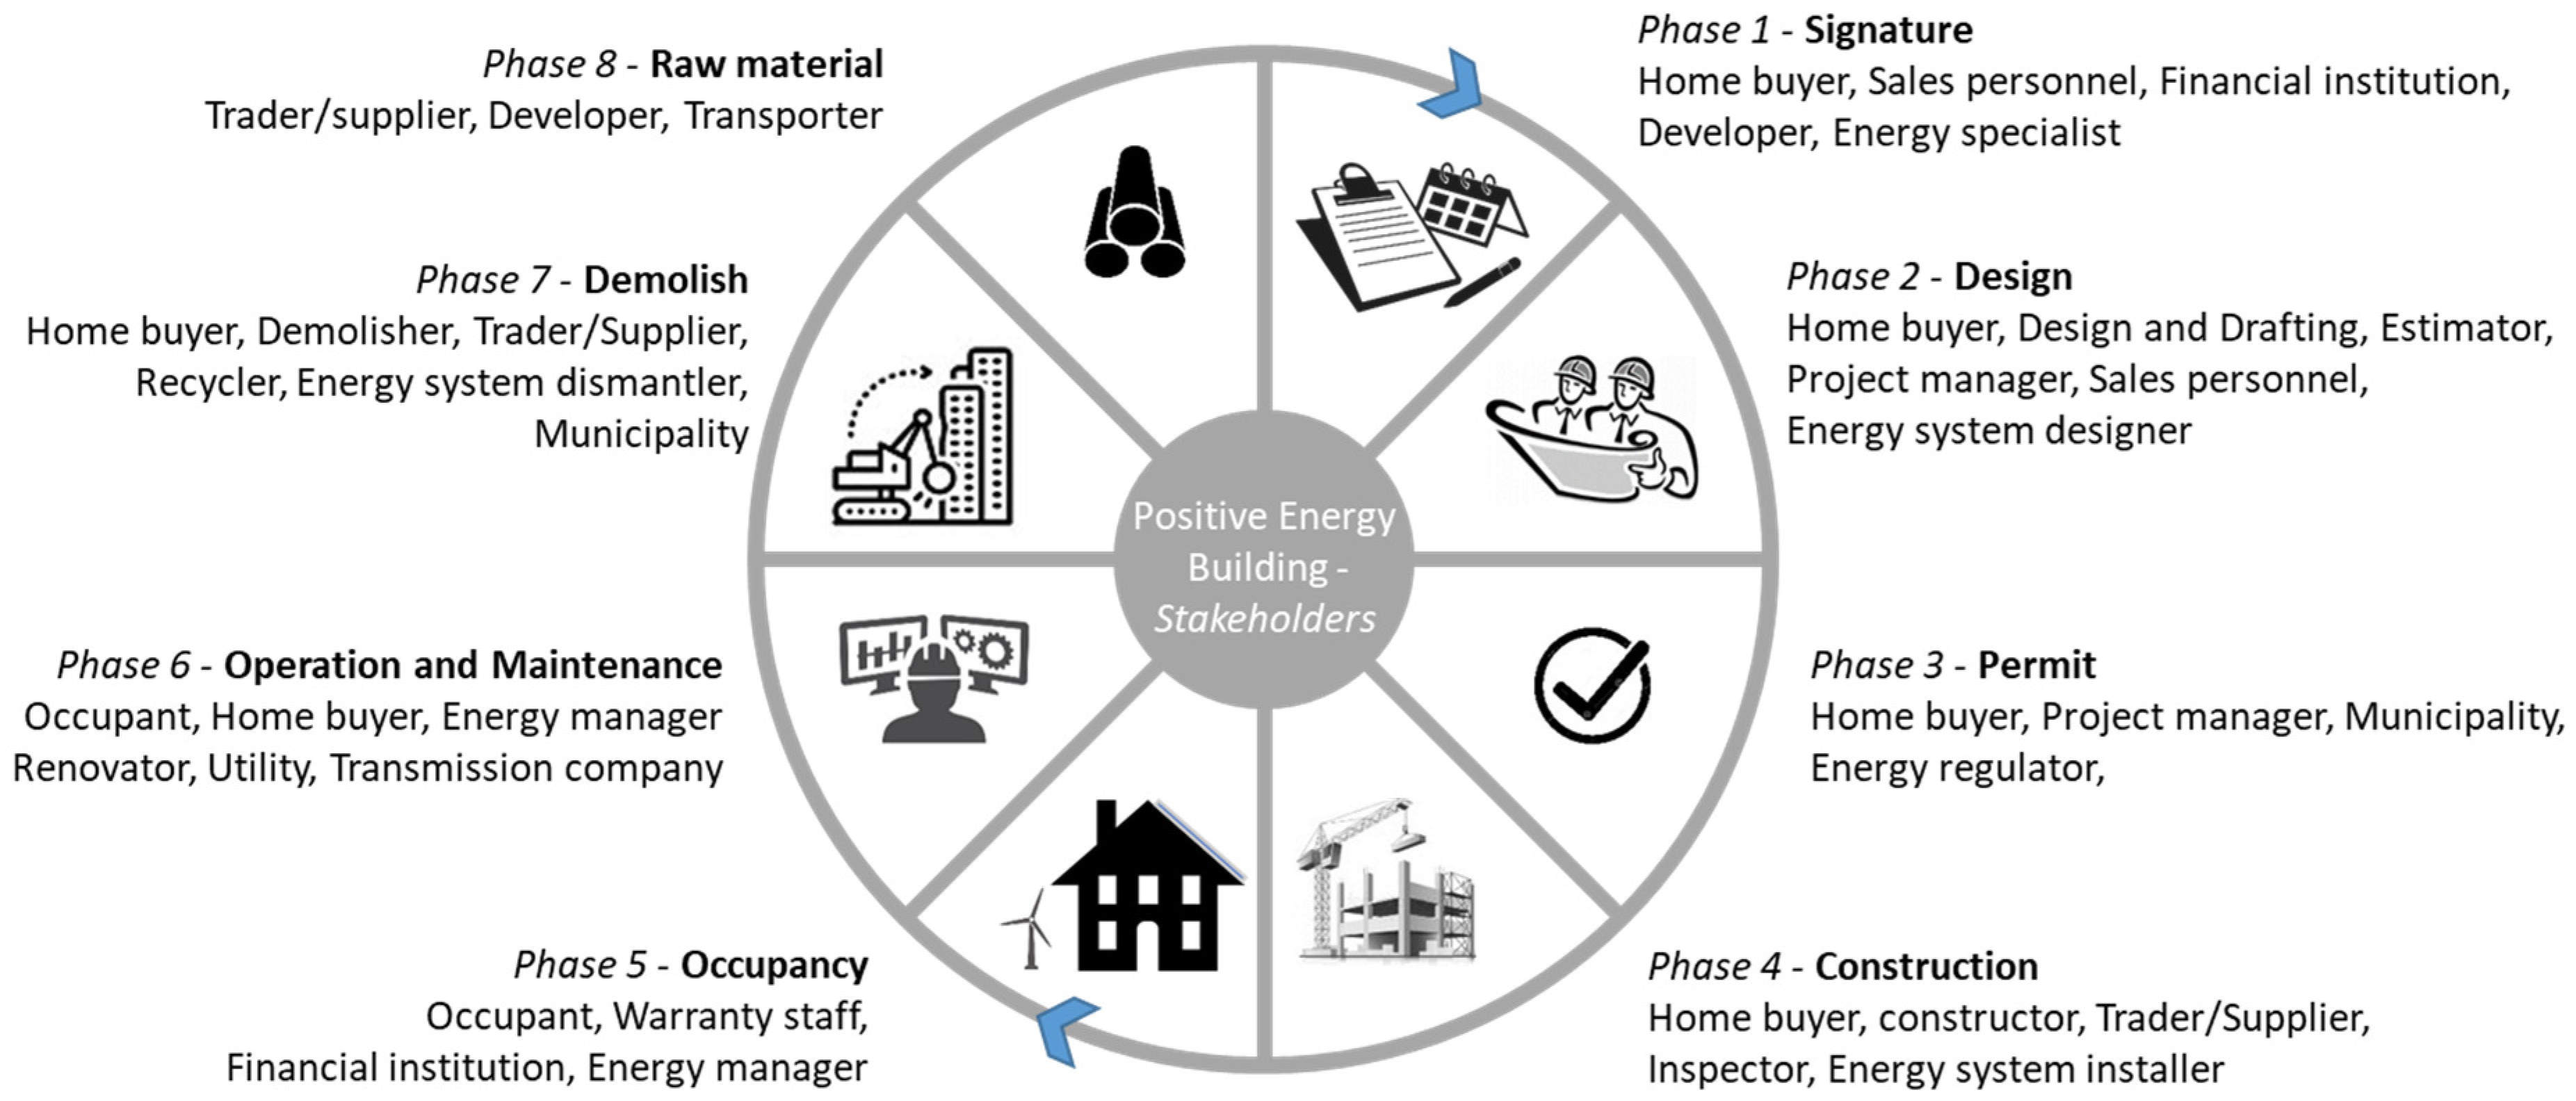
3.4. The Role of Different Stakeholders

The role of stakeholders is key in the energy field. Stakeholders are involved in and influence the PEB’s energy management at different phases of the project. Firstly, every PEB has several stakeholders over its lifetime. Stakeholders are generally categorized into two groups: internal and external [124]. Internal stakeholders directly participate in energy-related issues and get involved in different aspects of the building’s energy performance. External stakeholders are persons who are not involved in the project but are impacted by its decisions and activities in some way. The role of internal stakeholders is categorized according to the different stages during the life cycle of a PEB, such as planning, designing, construction, installation, operation, maintenance, and financing. The major internal stakeholders are Owner, Designer, Contractor, Supplier, Energy manager, and Occupant [125,126]. Since the rules and regulations, including necessary legal requirements, need to be fulfilled for any PEB, the external stakeholders such as energy policymakers, utility companies, and government who act as regulators are also relevant. Meanwhile, practical feedback from internal stakeholders is essential for improving and further implementing the PEB related regulations [127]. Figure 6 details the eight crucial phases of a PEB project, such as the signature, design, permit, construction, occupancy, operation and maintenance, demolish and raw material, with different stakeholders’ engagement; for instance, the stakeholders such as home buyer, sales personnel, financial institution, developer and energy specialist play the critical role in the signature phase of a PEB project [128]. The life cycle of a PEB project mostly follows these eight steps with the mentioned stakeholders, and sometimes it might differ according to the nature of the project. The stakeholder constellations do not represent each stakeholder’s power or particular interests [129]. Moreover, dynamic building energy simulation assists to accurately design the building energy system (building model and its related energy systems) and manage the energy flow [130]. The advanced and most common software tools used for dynamic simulation of renewable energy and building’s performance are EnergyPlus (Philadelphia, PA USA), Design Builder (Stroud, UK), TRNSYS (Madison, WI, USA), Revit-Green Building Studio (San Rafael, CA, USA) and Open Studio (Golden, CO, USA) [131]. The popular international certifications among the PEB stakeholders are Leadership in Energy and Environmental Design (LEED), International Living Future Institute (ILFI) and Building Research Establishment Environmental Assessment Method (BREEAM) [53,131].
Secondly, according to Staller et al. [32], the obstacles for PEB implementation are not only due to its technical nature, and this highlights the multifaceted holistic and sustainable perspectives. Stakeholders’ commitment and their mutual co-operation are imperative for developing and implementing energy-efficient buildings such as PEB [128]. Information integrity is essential and could decline when the information is transmitted between various stages due to the engagement of various stakeholders at different stages in a PEB [133]. Sometimes, information integrity cannot be fully promised even at the same stage. There is much miscommunication between the owners and designers when planning, predicting and designing the energy performance of a building project [134]; in reality, designers cannot entirely foresee the future conditions of PEB [135]. The way a client approaches procurement impacts the entire construction process, including the degree of integration and communication between project members [136].
Thirdly, a considerable portion of PEB-related research is focused on occupants, for example, occupant characteristics/behavior, comfort, energy management and experience/feedback. Wang and Srinivasan [132] mentioned that occupant plays a crucial role in building energy consumption and demonstrated that if a designer fails to analyze occupant factors thoroughly, the expected energy consumption would be unreliable [137]. According to statistics, occupant behavior is responsible for around 80% of the variance in building energy demand [138]. To develop rigorous models of occupant behavior in buildings, researchers and practitioners from all over the world must aggregate their knowledge and resources [137]. On the other hand, end-users (occupants and facility managers) do not always know how to effectively operate and maintain the building energy system due to the lack of proper guidance from the contractors. Niu et al. designed a virtual reality integrated approach to enhance the collaboration between the designers and end-users [138]. A pre-occupancy design framework is developed to aid building planners to gather occupancy data and define design trends that enable occupants to act in the most energy-efficient manner possible [138]. Studies show that stakeholders’ interest, influence and strategies are pivotal in increasing the PEB’s market share [48,112]. Transferring PEB’s information and knowledge to users/owner is salient for PEB sales and sharing prospective energy-saving technologies and designs with the owner is also crucial for enhancing owner interaction [48,49,112]. The design and construction personnel, with a better understanding of the owner’s anticipation, can construct a reliable PEB [48,112]. Even though stakeholders are crucial for the successful implementation of PEB projects, it is noticed that studies on stakeholder analysis in building energy management are limited. Mainly, there is a shortage of structural and well-functional methods for identifying and prioritizing stakeholders in PEB projects.
Fourthly, PEB’s mission is to explore the potential of creating additional value for users/occupants in terms of improved efficiency, occupant well-being, and energy savings beyond the confines of a building. A workshop with the family and residents of other energy plus houses revealed that the people were comfortable with their dwellings and delighted that they were not polluting the environment [104]. They enjoy utilizing e-mobility and have travelled over 8000 km in their car and over 3500 km in their pedelecs [104]. It is difficult to summarize the impacts of PEBs on the utility grid as a single entity, which encompasses multiple stakeholders such as policymakers, power producer and power distributor. Depending upon the regional needs, the stakeholders enclosed in the utility grids should plan the FiT appropriately to lead the system to have an overall positive impact indirectly. While public awareness is growing, political declarations on PEB goals must be translated into legislation and meaningful action as soon as possible [139].

3.5. Challenges and Bottlenecks

Every country has its own barriers, such as technical, societal, and economic barriers, which hinder the rate of implementation of PEBs. The first and foremost barrier is geography and climate; correspondingly, customized design is required for every PEB [47]. Predicted future climate change in the particular locality should be considered for the building with a long lifetime [63,82], which in practice, is not easy. With a lack of objective assessment from an optimized design, the potential and limits of passive strategies are overestimated, and the side-effects such as overheating are ignored [140,141]. The comfort of the building should not be compromised to attain the energy positivity objective; in contrast, some building projects put the well-being of the indoor building environment at risk [142]. The Culture-e project survey explains that many stakeholders pay more attention to the energy aspects of the building, giving less importance to the indoor air quantity and comfort in terms of daylighting level [131]. There is some concern that the buildings we are currently constructing may be susceptible to overheating, even in the existing climate [140]. With the probability of global warming occurring well within the estimated lifetime of buildings, this risk will increase significantly, with possibly dire consequences. There is substantial evidence that modern energy-efficient, well-insulated and airtight houses suffer from overheating that affects the occupants’ health. The previous studies indicate that optimizing a small number of design parameters, such as glazing ratios, external shading devices and thermal mass, can play a substantial role in mitigating overheating risks [55,140,141]. Notably, the risk of overheating is highly reliant on the amount of solar transmission reduced by the external shading mechanism and the glazing to wall ratio on the south façade. Without considering all the issues mentioned above, positivity in energy buildings remain meaningless and vague [127].
Secondly, the methodologies to implement PEBs usually follow a set of thumb rules that are only partially reliable, and these rules are often misused, for instance, calculation-based design with insignificant feedback from stakeholders [127]. Many building energy professionals rely on steady-state simulation tools to design and construct PEBs, with no performance data from real-time projects. Simple stationary or semi-stationary calculation tools are often used to design PEBs, with high confidence in building energy performance without estimating the cumulative uncertainty derived from the uncertainty of every input values; for instance, the weather data used in most of the simulations are outdated or fail to represent that exact location [143]. The dynamic energy simulation software is not exploited to its maximum potential, as some aspects for evaluating buildings’ performance in detailed are considered less critical [131]. It is noticed that poor design, construction, documentation, and energy management leads to lower energy performance than the actual plan. The design and construction part of PEBs are generally deficient in integrating the new energy-related construction material and components [56,141]. Casini [112] insisted that PEB is an expression of the maximum integration between comfort and energy efficiency with high innovation; however, at the same time, it should be respectful to the peculiar characteristics of the local dwelling, such as the control of internal climatic conditions, the privacy and the hospitality. The Restart4 Smart project achieved PEB status while being consistent with the Arab tradition and perfectly responsive to the social demand emerging from the Middle East populations [112].
Thirdly, the PEB business depends on the local industrial infrastructure of systems, products, and the national energy mix. The construction industry does not have enough experience to deal with PEBs. Many building professionals cannot complete a PEB project from design to construction to meet the market demand [127]. Even architects and engineers who are specialists in passive house standards meet serious challenges with PEBs due to the lack of vocational training and capacity building [144]. A survey report of 101 participants, only professionals from the fields of architectural design, environmental design, and building physics in the residential sector, clears that the topic of PEB is still not very widespread among designers, probably as a domain that is highly innovative and therefore in the growing phase [131]. For instance, the cycling ageing of batteries is critical for the techno-economic feasibility assessment of PEBs, whereas ignoring this parameter while checking the feasibility will result in an overestimation of the techno-economic performance [84]. Dabaieh and Johansson [139] said that social and cultural resistance to the relatively high initial cost of change is another significant barrier to the implementation of PEB projects. Kosonen and Keshisaari [145] depicted a different perspective on PEB’s investment; most of the investments that private people make, such as cars, boats and houses, will not pay themselves back. Instead, investments should be carried out, for instance, in order to reach some other private targets to increase the quality of life or the standard of living, either tangible or intangible [145]. Further detailed research is still needed on life cycle assessment and life cycle costing for PEBs [139]. The challenges mentioned above must be successfully addressed as a prerequisite for constructing a prosperous future for PEB technology.

4. The Positive Community Energy System

Buildings have a predominant contribution in the future energy systems because of several policies and targets favorable to accomplish this. However, the energy dynamics of buildings cannot be thoroughly analyzed and consolidated when it is considered as an isolated single energy system. Studies highlight the importance of broadening the boundaries of energy analysis from the building scale. That being considered, it is beneficial to account the buildings with their connected systems as a collective unit at the community level [22]. In line with the changes in the energy system, the research and sustainable energy business are widening its scope even to district scales [32,146]. By considering the role of a building in adding value to the setting and systems in which it is situated, the recent research bringing up the concept of a net-positive energy system called Positive Energy Community [26,44]. Different synergies and benefits can be identified for optimal energy efficiency and energy performance when analyzing PECs. Integrated energy planning has become widespread and inevitable for the urban environment [147]. There is a general agreement that municipalities have to play a significant role in implementing renewable energy systems like PECs and their strategic planning is essential to enable a successful project by acknowledging the interactions and interdependencies between different components within the community [148]. The community-scale initiative can provide enhanced energy security and energy independence [149].

4.1. Energy Supply, Demand, and Their Balances

PEC is seen as a single system with local supply, demand, and local energy management with the distribution/decentralization of the energy grids. The positive energy community explains that community-level energy analysis should account for the whole energy supply chain, such as production, storage, distribution, and end-use [150,151]. Figure 7 depicts a PEC that includes the different sources of renewable energy supply either from on-site or off-site to support various energy demands of the houses encompassed in the community with centralized energy-efficient appliance, energy storage, and energy management system. It also explains that the combined cooling, heating and power can be centralized, and the electric vehicle in the houses can be bi-directionally connected to the central EMS to maximize the utilization of the available resource for achieving maximum benefit.

4.1.1. Renewable Energy Systems in PECs

The contribution of solar and wind energy in PECs are widely noticed, and without these, achieving PEC is sparse. Rafique et al. investigated a small rural community in Faisalabad, Pakistan, to convert it into a smart energy community. The authors attained the PEC status by using a PV installation capacity of 225 kW and exported 6.04 MWh of excess electricity to the grid annually [152]. Rehman et al. [26] parametrically studied the supply side of a positive energy community for Nordic conditions and suggested that investments should be first made in the wind turbine and after that PV to improve the performance of the system. The result also implies that when adding 75 EVs into the available system, the investment is prioritized to PV and then wind to achieve an optimized performance [26]. Selection of different renewables and their ratio is not easy in community design; a fizzy multi-criteria decision-making approach was used in evaluating the technologies to consolidate the conflicting requirements, stakeholders’ priorities, and uncertainties [149]. Ma et al. [153] studied the technical feasibility of PHES supported PEC for an island in Hong Kong and informed that sizing the renewable to match the load can reduce the needed size of the upper reservoir to reach 100% autonomy. In some cases, especially in urban communities with high-rise buildings, higher density, and mixed-use development, off-site renewable energy generation is more economically feasible to use [154]. Kim et al. [155] investigated a town primarily supported by an off-site PV system installed on a sewage treatment plant and achieved 134.5% excess renewable energy generation annually.

4.1.2. Renewable Energy Supporting Systems in PECs

Sustainable energy components such as fuel cells, biogas, and biowaste are extensively used in PECs to increase the stability and reliability of the supply side. UC Davis’s west village community satisfied its demand and became a PEC with 6% excess exports by effectively utilizing its 5.4 MW of centralized PV and a 300 kW biogas fuel cell plant that uses campus agricultural waste [156]. Kim et al. [157] designed a PEC with 900 kW PV system as a major generator and parametrically studied three different cases with a gas-fired boiler, centralized heat pump and hybrid renewable energy system (HRES) with district heating network to improve the performance of the Jincheon eco-friendly energy town in South Korea. Kim et al. [157] achieved an annual positive energy balance of 17% with a utility grid and positive operational cost with HRES. Feldheim energy community is the first self-sufficient community, and it has a different combination of renewable energy generation, which includes a 123 MW wind park, 2.25 MW solar park, a woodchip fired heating plant and a 526 kW biogas plant that uses cattle and pig slurry as well as maize silage [158,159]. Samsoe Island in Denmark is a PEC with significant electricity generation from wind turbines with the support of a district heating plant with the utilization of solar, wood chip, and straw [160]. The district heating plant receives heat from a 2500 m2 solar thermal array and a 900 kWh wood chip fired boiler, and this district heating plant is the first heating plant of its kind based on solar thermal and a wood chip fired boiler [159]. Around 1 MW capacity of PV is installed on Tokelau Island in New Zealand to provide 150% of their present electricity demand, allowing the Tokelauans to ultimately expand their electricity use in the future [161]. In PECs, it is vital to design the overall generation based on the total dynamic energy demand of the community.

4.1.3. Demand Side Management in PECs

Due to load diversity, the total electricity generation and distribution capacity required is less than the sum of individual peak loads, which is natural in a PEC because of its composition of different categories of buildings [154]. The project Energy City Graz-Reininghaus aimed to minimize demand-side losses (transmission and ventilation losses and the prevention of thermal bridges), as well as strategies to maximize passive solar benefits (window ratios and orientations, and the storage capability of building components), in order to achieve its first step of dynamic optimization; the second measure was to introduce energy-efficient domestic appliance [32]. Huang et al. [162] explained that energy sharing within the community could significantly improve the renewable energy self-consumption to reach as high as 77% while maintaining self-sufficiency above 20% in the baseline case. A synergetic interaction of different users and load profiles between the office and shopping complex in the community offers vast potential for energy reduction [32]. Alirezaei et al. [102] utilized EVs for providing electricity to the community during the on-peak period and receiving electricity from the main battery and/or from the grid during the off-peak period; the unique algorithm helped the community to reduce the dependence of the grid by about 68% on average.

4.1.4. Performance Indicators in PECs

Fourthly, the most common way to define a PEC with an annual net energy generation is greater than the annual net energy demand, which means that net energy export is greater than net energy import [163]. Exergy related indicators are extensively suggested and used in many PEC projects [146,164]. Similarly, Kim et al. investigated a PEC based on the annual net energy imported from/exported to the grid and the environment indicators such as primary energy consumption and carbon emissions were also used to support the investigation [19,157]. The OEF and OEM indicators are used to represent the load matching and grid interaction, respectively [26]. It has been noticed that part of the fundamental indicators used to define PEC is similar to those for PEBs, which are listed in Table 3. Like PEB, currently, there is no definitive scale or threshold values to label the positivity standard of PEC. “IDEA project” [165] developed a scale of A to D based on on-site energy ratio (OER) to define the community scale energy system and indicating energy positivity with a plus sign [166,167]. The label A+++, A++, A+, and A denote OER of >150%, >125%, >100%, and =100%, respectively [166,167]. The plus generation concept matches PEC comparatively better than PEB because of the high self-utilization caused by the leveling of a different combination of generations and demands before reaching the grid.

4.2. Energy Storage

The intermittent characteristic of renewable energy prevents the system from reaching the full benefit of PEC without suitable energy storage capacity. The energy storage in a PEC can have multiple configurations; it can be a combination of shared on-site/off-site energy storages and/or shared virtual storages. This section begins with the narration of two commonly followed on-site energy storage design in PECs: the community in which every residential has individual energy storage and the community with centralized energy storages. After that, communities with the advanced community energy storage concept called virtual energy storage networks is described. Lastly, the benefit of designing a community with hybrid and diversified energy storage has been stated.

4.2.1. Decentralized Energy Storage System in PECs

The concept in which the residential in a community mutually share their energy storage before interacting with the grid is called as shared residential energy storage community. Every energy storage usually lies within its residential boundary like the PEB, but the net energy metering denotes the community’s interaction rather than the interaction with the grid. In the Netherlands’ Gridflex Heeten household energy community, 47 households are designed with a 5 kWh battery in each household. The households mutually shared the energy storages to attain collective benefits such as peak shaving, higher self-generation consumption, and lower annual energy costs [169]. When compared to cases without batteries, the community energy system with batteries can reduce the imported energy and increase the self-utilization of onsite energy generation to reach positive energy levels [26]. Jurasz et al. [170] suggested that the batteries role in improving the energy self-sufficiency of the city of Wroclaw, Poland, is small, as potentially storable excess generation from PV is often encountered in summer. It results in oversizing and very low utilization of battery, which makes the storage cost excessive [170]. Good et al. [23] achieved a PEC of 50 flats in the UK, each supported by a gas CHP with a 145 L hot water storage tank. CHP is sized based on peak loads resulting in an average size of 4 kW [23].

4.2.2. Centralized Energy Storage System in PECs

The concept in which all the residential in a community mutually share a single or collective centralized energy storage before interacting with the grid is called as shared local energy storage community. Shared local energy storage is gaining popularity in the energy field, even though utility-scale bulk energy storage is already conventional. Feldheim energy community in Germany has a 10 MWh lithium-ion battery CES since 2015. It is an excellent example of a PEC and met its energy demands locally and exported the surplus generation to the utility grid [158]. Coconut oil-powered generator is used as a backup for a 1.6 MWh lead-acid battery in the Tokelau community [171]. In this community, coconut oil is sometimes used to recharge the massive battery energy storage too [161]. “+ERS PEC” [172] used a 5000 L hot water storage tank as short-term thermal storage and a geothermal ground pile of 573 duplex tubes as long-term thermal storage to reach the annual net positivity of 55.7 MWh/year. In UC Davis’ West Village Community, USA, a 300 kW on-site biogas fuel cell generator using agricultural and dining hall food waste are used for combined heat and power to provide additional power during peak periods and offset any natural gas use [32]. The generation, demand, storage and the positivity magnitude of various PEC projects are clearly mentioned in Table 4.

4.2.3. Virtual Energy Storage Network in PECs

Several virtual energy storage networks are being developed in the energy industries due to the liberalization and restructuring of the energy sector, including the typical commercial examples of SonnenCommunity® in Germany [175], Storenet project in Ireland [176], and the Virtual Power Plant project in Adelaide, Australia [129,177]. The virtual energy storage network is a community of producers, energy storage owners and consumers who can mutually exchange the self-generated renewables directly or indirectly from storage. A robust self-learning software platform connects the members, guarantees real-time optimal energy balance, and reduces responsibility within the community network. The virtual power plant project Soleil Lofts in Utah, USA, includes 600 apartments, a 5.2 MW PV system with 622 individual batteries, for a total of 12.6 MWh expected to achieve the PEC status in 2021 [178]. VPP project [177] makes an average customer with a 5 kW PV system anticipate to save approximately 40% on Tesla Powerwall 2 battery cost and around 20% off their utility bills. For every kWh of shared energy from their Sonnen batteries, the members receive financial compensation well above the grid electricity provider’s compensation, and the community members pay a lot less than the so-called market price [175]. Besides providing service to its members, Tesla’s Energy Plan project [179] in the UK has an ambitious target of helping the grid by feeding green energy during peak times and reducing fossil fuels dependences [180].

4.2.4. Hybrid and Diversified Energy Storage System in PECs

The integration of hybrid and diversified energy storages may improve the overall performances of a PEC if the design and controls are appropriately designed and controlled. Rehman et al. [26] implemented a combination of stationary batteries, EV, warm water storage tank, hot water storage tank, borehole seasonal energy storage to technically and financially improve the system by promoting the self-consumption of generated energy within the community. The proposed design has a centralized solar district heating network integrated with a renewable-based electricity network to meet the heating and electrical demand of a community of 100 houses [26]. When compared to building scale, low cost and ample size energy storage such as PHES and aquifer low thermal storage are feasible and suited best for community scale. Ma et al. [153] indicate that utilizing a small battery bank or supercapacitor to assist the PHES in PEC helps to cover the peak load and improves the power supply reliability without increasing the size of the turbine and upper reservoir. Hachem-Vermette et al. [174] simulated the coupling of BTES 215,000 m3 with STC of 23,880 m2 and converted a high performance neighborhood, which earlier covered 70% of its consumption by energy efficiency measures and photovoltaic generation, to attain a plus energy status, producing around 20% energy more than demand. Kim et al. [157] described that the seasonal thermal energy storage significantly contributes to the future community energy networks. Robledo et al. [168] informed that V2B mode of FCEV in The Green Village project in the Netherlands, can decrease the annual imported electricity from the grid by 71% and help the community achieve net positivity of 29.7 MWh/year. Similarly, the bidirectional interaction of EVs with a group of office buildings helps a community in Naples, Italy, attaining PEC status with 8.9 MWh/year in excess [40].

4.2.5. Outline of Energy Storage System in PECs

This section explains that the energy storage of the community can be designed in various ways by giving priority to their individual building or equal priority to the community. The above-mentioned virtual energy storage can be integrated into the community level system and helps the community to utilize that as giant green energy storage at a low cost. It also shows that PHES, BTES and aquifer thermal energy storage suite the community-scale energy project and make the system robust, reliable, and cost-effective. The advent of new energy vehicles as a movable buffer energy storage through bidirectional energy exchange can improve the system in various dimensions. Overall, the selection, designing, sizing, mixing and controlling of energy storage is crucial to increase the self-utilization of generated renewable energy and achieve grid independence.

4.3. Smart Energy Management

EMS allows for monitoring, analysis, communication, and control of all the systems within the energy chain, which must provide benefits to all the buildings connected with it. The energy sector’s digitalization is accelerated through improvements in ICTs, smart microgrids, energy management controls, and IoT [181]. Existing ICT facilities, including such communication protocols, monitoring, controlling, and sensing systems, can be adapted to exhibit a cost-effective, sustainable, and safer framework [22]. Staller et al. [32] explained the PEC in three steps, each of which complements the other: individual building optimization, development of a dynamic network among several residential building blocks, and bidirectional interaction of residential buildings with the multipurpose building blocks across the street. This section is illustrated according to that by explaining the EMS followed within a residential, next between the residentials and then between the community and the utility grid. It also explains what sort of EMS is used in the virtual energy community and creates energy flexibility in the community.

4.3.1. EMS Followed within a Residential in PECs

Within a single residential part of a PEC, EMS is commonly used for demand side management (DSM), especially for scheduling electrical load and adjusting the peak/non-peak hours. Lopes et al. [163] designed a genetic algorithm based DSM method to control the operation times of all the electrical load to increase the load matching within the individual buildings and obtained a high annual load matching of 46% and supply cover factors of 39%. It is intended for a ZEC, but the result shows that it is already PEC [163]. Wheeler and Segar [156] suggested reducing occupant-owned miscellaneous electrical loads through load control devices is essential. For instance, the bi-level controls assisted LED lighting is used in common area lighting, which reduces 50% of its consumption, which is 1.5% of the total community energy use [156].

4.3.2. EMS between the Residentials in PECs

The buildings’ energy interaction generally follows two different EMS approaches depending upon whether it is a shared residential energy storage community or a shared local energy storage community. The shared local energy storage community has centralized energy generation/demand/storage to share with other buildings. Sokolnikova et al. [182] developed three different control mechanisms on battery storage and HP operation for a community in Siberia, and resulted that the combined use of electrical and thermal storage increases the self-consumption of renewable energy and helped to reach 100% energy autonomy. Unlike shared local energy storage communities, shared residential energy storage communities have the independence to follow their priority. Barone et al. [40] formulated an energy management system to transfer the energy from a renewable energy building to two traditional buildings using three EVs as energy vectors. EVs are charged/discharged based on a trip schedule and SOC of the battery, and made the system reach the energy positivity of 8.6 MWh/year [40]. It is vital to have bi-directional communication between the buildings in the community to effectively follow the EMS on dynamic pricing [183]. Odonkor and Lewis [184] initially designed an adaptive bi-level decision model for a community with a facilitator agent at a group level and a local system at the individual building level. Though resource sharing is the prime motive behind building clusters, individual building autonomy is still encouraged. In view of the overall net-zero objectives, it is essential to allow each building to tailor operational decisions to meet its unique needs [184]. A genetic algorithm and parent decision making have been followed to optimize the community [184]. To make a complete collaboration to improve the community-level performance, Huang et al. develop a robust top-down control method with [185] and without [30] considering the demand prediction uncertainty. It provided many cluster-level benefits like reduced energy consumption, reduced operational costs, and improved friendliness with the energy grid by exchanging the energy and related information [30,186].

4.3.3. EMS between the Community and the Utility Grid in PECs

EMS strategies are commonly evident at the junction of the community and power grid, where they serve as a conduit for one device to access another. The two-way information exchange between the community and the energy grid is vital to consider the impact on the power grid, rather than one-way information flow [38]. As a result of fixed peak and non-peak hour electricity pricing, significant fluctuations of power on the grid can be seen when many communities are connected with the EMS on pricing [187]. Gao and Sun [187] not intended their EMS for PEC, their genetic algorithm based demand response control can limit the building group level peak demand and the related energy consumption to reduce grid dependence. Jia et al. [188] developed a time-of-use grid penalty cost model evaluating grid import/export during on/off-peak periods to achieve flexibility and economy between renewable energy microgrid and the utility grid. On a typical winter day in the UK, the optimum CHP electricity generation regime is further evaluated for neighborhood-2, subject to retail and dynamic pricing, to demonstrate how dynamic pricing can inspire operation more in conjunction with the flexibility target [23]. It explains how the exposure of dynamic prices, which explicitly represent prices in the varying relevant markets, enables CHP activity to be moved as much as possible to high-priced periods [23].

4.3.4. Virtual EMS for PECs

Virtual EMS brings all reporting, tracking, archiving, and research features online, usually only accessible at hard-wired “brick-and-mortar” facilities. The important thing is that anyone who can connect to the internet can now access the functions traditionally only to be found at a central venue, and on any device, via the Virtual EMS. Cao [189] proposed a unique boundary expansion scenario in a project on renting the office building’s owned EVs to the office occupants, and depicted that the bi-directional interaction boundary between the EVs and the office building can be extended to remote parking sites where the EVs are tied to the power grid. The office occupants can drive the car to their home or any other location, but they cannot interact with the EVs other than the office building using B2V/V2B functions [189]. The unique facility of this feature allows for the construction of “virtual” control rooms and operations made up of any number of registered users located anywhere in the community. Distributed Battery Grid Management System (DBGMS) is created for Utah, USA, a virtual community project that brings behind-the-meter swarm control batteries to thousands of homes to connect in a single intelligent network [178]. The DBGMS is utilized for grid decongestion and additional capacity during peak demand periods and ancillary grid services like frequency response, and at the same time, to benefit the customers [178]. Sonnen [175] developed an energy management system using a self-learning algorithm to accurately predict the best time to charge and discharge the battery on a live, ongoing and adaptive basis. For example, if a home uses the most electricity between 7–10 pm, this EMS will ensure the stored renewable energy is reserved for these hours, even though the home has started discharging electricity at 5 pm [190].

4.3.5. EMS for Energy Flexibility in PECs

PEC can provide flexible services in various aspects, including the building’s thermal mass utilization, HVAC system adjustability, EV charging/discharging, and plug-load shifting [117,191,192]. However, presently no insight into how much flexible energy different buildings can deliver to potential energy services in minimizing surplus energy generation, increasing energy system reliability, reducing congestion problems, and improving future energy network efficiency and cost-effectiveness [118]. Good et al. [23] explored the three identified sources of flexibility in a community of 50 apartments located in the north of England and achieved a PEC status by supporting every apartment with a 1.9 kW PV, a 1.9 kW ASHP and a 2 kWh/0.2 kW electrical storage. To avoid overestimation of the overall system’s techno-economic performance, energy flexibility studies should consider the energy storage cycling aging and the degradation rate. Zhou et al. [193] formulated a novel EMS for controlling and regulating the bi-directional interaction of new energy vehicle with the buildings, and it helps the system to achieve PEC status by reaching NPV from −71.8 to 516.4 million HK$, and the average annual net direct energy consumption reduced from 0.25 to −0.34 MWh/m2·a. This EMS can reduce the battery replacement time (BRT) from 2 to 5 for the private cars and from 3 to 5 for the public shuttle buses [193]. IEA EBC Annex 67 enclosed an extensive series of case studies to clarify energy flexibility methodology, operation and control strategies to obtain the maximum benefit within a community [118].

4.3.6. Outline of Smart Energy Management in PECs

Even though it is possible to attain a PEC status without smart energy management, the full benefit of PEC cannot be achieved without it. Rafique et al. [152] followed a simple and straightforward control strategy for an economically feasible community energy system where all the loads and generations are considered in a single pool while the surplus and shortage are exported and imported, respectively. It has been noticed that the EMS mentioned above can optimize and further improve the performance of the system in various ways. Rehman et al. [26] noted that the optimization of the system and control of the PEC system, which encompasses different generations, demands and storages, is essential and also challenging. Since the complexity of a PEC is higher than a PEB, it cannot be adequately controlled and regulated by implementing a smart energy management system only within the building; it must be more intricate to further collaborate with an increasingly complicated system by considering the various point of junction such as building to building interaction and community to utility grid integration. It has been noticed that EMS on energy flexibility can help to extract the hidden potential of PEC to techno economically benefit the various stakeholders. A systematic, interoperable, validated, and advanced ICT technology-enabled EMS, including monitoring, controlling, and optimizing renewable generation/load/grid interaction facility, is much needed to foster PEC [22,194].

4.4. The Role of Different Stakeholders

PEC stakeholders are defined as person/group/institution with concerns about building services part of the community development, who can influence or be influenced by the particular community’s activities/goals/policies. Shifting from building to community-scale results in additional complexity due to the increasing number of stakeholders and interdependencies, which generally serve as deterrents for the concept’s implementation and dissemination [32,195,196]. This section is summarized based on four key PEC aspects by accounting the related stakeholders within them: the first one is community developer who encompasses the planner, designer, constructor, energy manager; the second one is customer, who includes the users and land leasers; the third one is the government which governs the policy and regulation, and the fourth one is utility grid who generally consider themselves as a loser (in terms of losing a bunch of customers). It should be noted that no proper research work about stakeholders of PEC was seen during the review process.

4.4.1. Community Developer’s Role in PECs

Community developers play a significant role and work as part of the community. Among them, some stakeholders like planner, designer and constructor prevail until the completion of the project and others like energy manager, operator, maintainer and investor prevail until the destruction of the project. Information campaign and consultation process should be incorporated into the planning phase of the PEC project and led by a local manager who has a profound commitment for the community development [159]. Together, these processes and leadership create a symbiotic relationship that minimizes tensions and encourages more constructive deliberation of concerns [159]. Stakeholders engaged in community planning, construction, renovation and management must formulate appropriate strategies within their specific geographical setting and operational environment [197]. Third-party construction quality inspections and commissioning of advanced systems are pivotal to check the specification and installation of energy efficiency measures through thorough and consistent verification in realizing the projected savings [156]. The team play of design engineer, who plans and designs the energy system of the community, and the asset manager, who sells and installs the components of the energy system, with the energy manager who plays a central role and serves as the energy manager during the operation and maintenance stage is critical. The optimal coordination among all the stakeholders in PEC is crucial, and there is no simple or straightforward strategy to achieve the PEC. Besides providing quality service to the customers, the community-owned or operating company must guarantee a lower energy bill than the commercial energy companies [158,198].

4.4.2. Customer’s Role in PECs

Active consumer interest promotes a seamless transition to positive energy communities with substantially higher renewable energy adoption. As similar to the zero energy community project, the willingness of consumers to engage in a PEC is determined by external factors (cost, renewable energy models, interaction with peers, and government policies) and internal factors (finance, personal preferences and social beliefs) [196]. Furthermore, by monitoring and managing the building’s energy system, consumers become more aware of the key energy issues and develop consumption consciousness. Such trends are projected not only to impact customers’ behaviour directly but also causes a long-term impact by aggregating awareness about the sustainable world in general [22]. The statistical analyses between the community members and non-members showed that the members have significantly more positive attitudes towards renewable energy than non-members [20]. Moreover, householders should be appreciated to consider themselves as community members and citizens rather than an autonomous user [196]. The conceptual participatory framework for enhancing community engagement in the community wind energy project [21] is noticed as suitable for PEC; planning, decision making and implementation are termed as the significant paces of the community-scale energy project [21]. The community engagement process, such as informing, consulting, involving, collaborating, and empowering, is considered part of stakeholder consultation during decision-making pace [21].

4.4.3. Government’s Role in PECs

The local government has an immense responsibility to cultivate a successful PEC and provide continuous support to build regional sustainable energy infrastructure. Municipalities must cooperate, and policymakers provide improved standards and codes ranging from building to energy equipment and highly efficient public transit. The price for the electricity output from renewable energy should be determined by statute, thereby guaranteeing profits for plant operators on a long-term basis [158]. Even if the local community does not own the renewable generation facility, it should also benefit from a lease or tax payments from the plant’s operator [158]. Financial assistance, in the mode of direct subsidies, incentives and complementary policy initiatives, is essential for success and perceived justice [159]. The sensitivity analysis of a PEC project illustrates that government grants and incentives should be accessible in terms of land acquisition, permits, finances and power purchase agreement [152]. Any green energy initiative introduces capital flow into the locality; therefore, the planning, development, and management of a positive energy community secures and generates employment in local enterprises [158,159].

4.4.4. Outline of Different Stakeholders’ Role in PECs

As many of the recent PEC projects aim to support the utility grid, it is crucial to benefit mutually. From a comprehensive understanding of the community-scale energy system, a well-designed PEC (in terms of low consumption, high energy efficiency, and EMS synergized with utility grid) has a high probability of becoming an economically successful project with less impact on the utility grid [188]. Moreover, depending upon the need of the utility grid on the region, the PEC can be utilized as energy storage for the utility benefit; for instances, sudden demand on the grid can be matched by taking the energy from the PEC or excess generation from the grid can be stored in PEC instead of dumping [177,190]. The role of various stakeholders in positive energy community is summarized in Table 5.

4.5. Challenges and Bottlenecks

PEC is not just about generating excess renewable energy; it should also bring people together and create opportunities for empowered, resilient communities to flourish. This review report explores the reasons behind its limited deployment in addressing PEC challenges based on technological, social, economic and political/regulatory aspects [23,149]. The structure-oriented explanation is divided into four parts to review how broad the PEC challenges are: the first one is about the technical related issues which are not noted in the above chapters, the second one is about societal characteristics learned from past projects, the third one is about economic challenges related to investment and equity, and the final one is about political and regulatory barriers.

4.5.1. Technical Barriers of PECs

The unclear legal definition of PEC and its less popularity among people hinders rapid adoption. Ambiguous definitions sometimes exaggerate and act in favour of businesses. Such projects undermine the positive message and harm the community-scale energy concept’s reputation [199]. The technical barrier of PEC exists in all its associated stages, such as the design, development, deployment, operation, maintenance, and performance assessment [23]. The physical characteristic of the community can limit the penetration of highly suitable technology into it. Rehman et al. [26] emphasized the land constraint behind the selection of small or large turbine that the large land area should be available for choosing the many reliable small wind turbines which has high and reliable performance than a single large turbine. Technologies associated with the hydrogen economy, such as fuel cells, electrolyzers and FCEVs, are currently costly, making adoption difficult [168]. Costs will fall as a result of the mass production of FCEVs, and general acceptance of hydrogen may rise as the advantages of using this technology become more widely recognized [168]. Researchers lack access to necessary energy data, and a dearth of accurate data is a major technical issue [192]. Ala-Juusela et al. developed and evaluated a decision-supporting tool with the key performance indicators of PEC for the long-term planning of community-scale energy solutions, including district heating grid [167]. Much more work must come up to create guidelines and simplify the complexity behind the PECs. Lack of privacy and insufficient data security are also barriers to widespread adoption of the PEC concept, mainly due to its connection to open or untrusted networks and its large-scale deployments [200]. Bae et al. [201] analyzed that many customers are hesitant to share their personal information with the public, so security and privacy concerns should be addressed to increase customer acquisition.

4.5.2. Social Barriers of PECs

Cultural aspects such as historical events and societal characteristics obstruct the development of the PEC too. It creates a situation where even the best-intentioned community project does not always guarantee the benefits to be equally distributed to the customers [202]. Good et al. [200] classified the social barrier on PEC as an organizational barrier related to the social systems and structures of involved commercial parties and behavioral barriers due to the more significant number of decisions involved in utilizing energy. In addition, consumers are unwilling to compromise, and behavioral change is a considerable issue [192]. The findings from Samso PEC, Denmark, [160] depict that certain groups profit more than others from a distributional point of view: farmers benefited notably from improved investment options due to tax reductions and their ability to influence it due to their land ownership [159]. Staller et al. [32] explained that a high level of confidence and mutual trust among the stakeholders is essential for the successful completion of a PEC and reminded an issue of the withdrawal of the supermarket located in the office complex made it more challenging to reach the initial target of becoming PEC. Instead of accessing the community cooling grid as planned in the +ECR project, the supermarket suddenly decided to become more self-reliant by installing ASHP to meet the cooling needs [32]. Although their choice is more expensive in the long run than purchasing cooling energy from the housing company, the sudden withdrawal of a stakeholder highlights that the barriers to implementing a PEC are not solely technical [32]. While a community may share its ownership, single ownership, such as a government entity and university, renders obtaining and retaining PEC status much more effortless [154].

4.5.3. Economic Barriers of PECs

Financial difficulties arise due to the communities’ inability to raise equity and their lack of third-party financing. Currently, there is no such established business model to convert expected regular payments and economic welfare gains into equity [202]. The municipality, building companies and the residents were unable to make the substantial investments required to construct PEC independently. Therefore, additional investments from the government is required; one good example is the Feldheim energy community [158], which tapped the financial support from regional government and EU programmes to build an electricity grid and a heat grid for the community [158]. Despite strong local institutions, financial assistance in the form of direct subsidies, incentives and complementary policy measures are critical for success and perceived justice [159]. Good et al. [200] classified the economic barrier of PEC in terms of market failures such as imperfect competition, imperfect information, incomplete markets, and market barriers such as hidden costs and values of PEC. With the reduction of the PV FiT in 2012, the introduction of a mandatory market-premium scheme in 2014, and the gradual transition from FiT to a tender-based system in 2017, Germany, where citizens played a central role in the development of renewable energy historically, is heading toward greater reliance on market mechanisms [20]. At the expense of smaller developers, it is expected to favour large energy companies [20].

4.5.4. Political/Regulatory Barriers of PECs

Political/regulatory barriers exist due to government policies usually enacted through regulation such as tax code and PEC design standard [200,203]. Castenson [178] informed that many utilities have constraints on how much PV and battery can be installed at home to avoid causing problems for the utility distribution system, resulting in plenty of room for regulatory improvement. Community-level projects usually suffer from policy revisions like changes in tariff plans. It makes the PEC investors more vulnerable because, in this instance, they cannot offset the loss of a PEC project with the profit of another PEC [20]. Apart from the factors that affect the investment in building scale projects, the global trend towards auction systems becomes a significant challenge for community-scale investments. Auctions generally favour more prominent investors and discriminate against smaller investors because the regulators increase the project prerequisite to the degree that only large investors can participate [203]. The prominent barriers of PEC are summarized based on technological, social, economic and political/regulatory perspectives in Table 6.

5. The Summary of the Main Differences between the Positive Building and Community Energy Systems

From the comprehensive analysis stated above, it can be understood that PEC is more techno-economically cost-effective, and its implementation is complex than the PEB system because it is not just limited to the complex integration of buildings. It also includes sectoral integration concepts, considering transportation, commercial buildings, industries, and other community-based infrastructures. Comparison and differentiation of PEB and PEC are complex and will not deliver exact results due to the multitude of variants with these two different scale energy systems. However, the effort has been made to provide the straightforward differences understood from this review process. This section on the major difference between PEB and PEC is defined based on five essential parts: renewable generation, demand reduction, energy storage, energy management, and stakeholders’ perspectives.

5.1. Renewable Energy System between PEB and PEC

Every region has unique renewable energy potential depending on the geography, such as solar/wind/wave/hydro/geothermal and accessibility of biomass resources [47]. Compared with PEB, PEC makes extensive use of fuel cells, biogas, and bio-waste to improve supply-side stability and reliability [157,160]. By efficiently using its 5.4 MW of centralized PV and a 300 kW biogas fuel cell plant that utilizes campus agricultural waste, UC Davis’ west village met its demand and became a PEC with 6% excess exports [156]. When the community level unveils a broader boundary, cost-effective and reliable hybrid renewable energy generation is possible with the added advantage of large-scale generation. Feldheim has a unique mix of renewable energy sources, including a 123 MW wind farm, a 2.25 MW solar farm, a woodchip-fired heating facility, and a 526 MW biogas plant that uses cattle and pig slurry as well as maize silage [158]. Pieces of literature show that off-site renewables are more economically feasible to urban community energy systems [154,155]. Kim et al. [155] suggested a town that attained 134.5% positive energy by off-site PV systems built on the sewage treatment facility, as well as the incorporation of an HRES. Since community-scale uncovers the opportunity for various renewable resources, different hybrid combinations, and extents the economies of scale in all the processes, achieving an efficient, reliable, cost-effective generation is highly possible in PEC compared with PEB. The literature noted that in building scale, the performance indicators are standard and straightforward to compare with other low energy building concepts, such as passive and zero-energy buildings, by following energy use intensity (EUI) [204,205,206,207]. Unlike PEB, comparing PEC with other low energy communities are confusing because of the non-uniformity of the indicators; some projects follow EUI, and others follow net annual energy imported from the grid (MWh/a) [208,209,210,211,212,213,214]. PEBs are quantitatively compared with the traditional buildings, passive buildings, and zero energy buildings in Figure 8. PECs are quantitatively compared with the traditional communities and zero energy communities in Figure 9.

5.2. Demand Reduction between PEB and PEC

Demand-side management is necessary for PEB to stabilize the fluctuating maximum power demand according to its renewable generation and energy storage capacity. According to the building condition, changing the occupant behaviour by postponing and rescheduling their needs is not appreciable and would affect comfort someday. This problem can be unknowingly solved significantly by the nature of PEC when integrating different sorts of demand into a single system (different type of buildings), but it is not valid for the community which only consider the same kind of building, like a residential community. Integrating the load profiles of different buildings results in flat overall energy demand curves [154]. A synergetic collaboration between the community’s office and shopping complex provides enormous energy savings opportunities by integrating various consumers’ load profile [32]. On the other hand, it is well known that the efficiency and cost of the large capacity energy appliance/equipment are high and less, respectively, when compared with the small energy appliance/equipment of the same capacity [152,215]. When considering the possibility of using a highly efficient centralized energy appliance/equipment for the community scale system, the cost and the energy demand of the overall system can be reduced significantly. Kim et al. [155] presents the configuration of PEC by real-scale experimental research and measurements with an eco-friendly energy town constructed in Jincheon, South Korea. It contains hybrid energy systems, including a solar thermal system, seasonal thermal energy storage, three multi-source heat pump systems, a buffer tank, and a district heating and cooling network [155]. The hybrid combination of centralized equipment can be cost-effective and matches the community scale energy system well [155]. In such a case, a building within a community can effectively reach a positivity in annual energy cost compared with a similar building outside the community. However, the result does not suit the building that follows its individual energy appliance/equipment.

5.3. Energy Storage System between PEB and PEC

When it comes to energy, autonomy can be described as an energy system’s ability to operate entirely without relying on external help in the form of energy imports, thanks to its own local energy generation, storage, and distribution systems. Autonomy in PEBs is not cost-effective; it either needs an optimal system capacity about eight times higher than the peak power demand or large size seasonal H2 storage [18]. In PECs, autonomy is possible even with lesser cost by utilizing the cost-effectiveness of large-scale energy storage and hybrid energy storage design concepts such as community energy storage or energy hub [161]. To achieve an annual net positivity of 55.7 MWh/year, “+ ERS PEC” used a 5000 L hot water storage tank as short-term thermal storage and a geothermal field pile of 573 duplex tubes [172]. Hachem-Vermette et al. [174] simulated the pairing of 215,000 m3 BTES with 23,880 m2 STC and transformed a community to produce up to 20% more energy than it consumed. Large-scale energy storage systems, such as PHES or aquifer-based renewable energy systems, are an ideal solution for achieving complete energy autonomy by storing electricity at a minimal cost and with low complexity, which is not commonly practiced in PEB [153]. High energy conversion and energy flexibility in storage are essential to reach positivity at the neighbourhood-level energy system [192]. When a building in a community can access the central community storages or other buildings for its needs, a reliable and cost-effective condition can be reached [216]. All the above condition can reduce the maximum power demand and the overall energy demand of a PEC, make it more independent with a high value of renewable self-consumption and less grid interaction.

5.4. EMS System between PEB and PEC

When it comes to EMS, the critical energy-management strategies such as demand-side management, renewable side management, storage side management, vehicle interaction, energy flexibility and grid interaction should be considered in both PEB and PEC [108,163,189]. However, interaction mode within the community, like the interaction between the buildings, makes the PEC more complex when considered with the corresponding PEB [163]. This makes the PEC consider going for various mode of energy management, whether to consider the concept like shared residential community [184] or shared local community [182]. EMS in a shared residential community generally follows three steps: within the building, between the buildings, integration with the community; whereas it is one step like PEB in a shared residential community [32,184]. It is not easy to compare the EMS between PEB and PEC because of its multitude and no available past work about the comparison of any EMS between these systems; the only conclusion that can be made is the EMS in PEC is complex than PEB.

5.5. Stakeholders’ Perspective between PEB and PEC

Various stakeholders are involved in both PEB and PEC projects, but a few crucial stakeholders are compared in this section. As dweller/user is the owner of the most PEB project, they can decide and implement what to be there in their building according to their priority [51]; in PEC project, the dweller/user cannot influence much since there are not the only dweller/user of the project [162]. Most of the PEB projects are initiated by the owner/user, and they are ready to face the financial challenges within it [48]; in PEC project, the users are not ready to face the financial burden, and it is always handled to the community developer [158]. In PEB, the dweller/user are the ones who monitor, operate and maintain the system [112], but in PEC, the energy manager of the community does these [175]. It is seen that PEC with on/off-site renewable generation is more suitable for urban development since it can accommodate more users and reduce the sprawling development of PEBs [155]. The sparse nature of PEB does not attract the utility company towards making any contract with them, but the PEC sometime does. For instance, Wasatch Group, a Utah-based real estate developer, teamed up with Sonnen, a home energy provider, and Rocky Mountain Power, a utility company, to create Soleil Lofts, a 600 apartment project in Utah, USA [178]. Relationship between the PEB/PEC and utility are generally imposed by the policymakers under the prevailing residential renewable energy policies [189,193]. Zhou and Cao [193] analyzed their system based on existing FiT made for residential renewable energy in Hong Kong. The main differences between PEB and PEC are summarized on some pertinent aspects in Table 7.

6. The Impact of the Smart Energy Grids on the Positive Building and Community Energy Systems

The grid plays a prominent role in the spatial allocation of energy resources, mainly by providing physical infrastructure for the transmission and distribution of energy to reach the energy and climate targets [217,218]. Smart grid supports sustainable energy, creates cost-effective economics, and provides reliable energy supply, with the help of modern communication devices, such as IoT, ICT, to various parts of the typical electricity grid [219]. The energy system must have the following facilities, such as the incorporation of demand response capabilities, smart metering, distribution architecture, and interoperability, to effectively utilize the energy system with the smart grid; because of this, it is believed that the grid is a significant carrier of economic and social development. This section about the impact of the smart energy grid on PEB/PEC is split into four-part based on four key aspects: the first three parts are about the benefit of connecting smart grid in PEB/PEC in terms of the electric grid, other grids and smart metering and the final part is about why PEB/PEC should be grid responsive.

6.1. Impact of Smart Electric Grid in PEBs/PECs

The implementation of the smart grid provides many advantages to future energy systems, like PEBs and PECs, which include enabling high shares of renewables, shifting of peak load, enhanced efficiency, reliability and security of energy distribution, decreased GHGs and carbon intensity, and active participation of consumers [220,221]. Oree and Anatah [14] investigated the feasibility of PEB in tropical climates, Mauritius, using bi-directional connection with an electric grid, considering the grid as unlimited energy storage and that helped it reach excess annual export of 698 kWh. Magrini et al. [130] analyzed a PEB, Italy, that generates 2100 kWh during summer months and emphasized that the surplus generation of 1800 kWh can support four buildings in its region using a bi-directional smart electric grid. Casini et al. [112] examined the possibility of building a PEB in the Middle East region, UAE, and the result implies that the annual surplus generation of 15,621 kWh can support four single-family house connected with the same utility grid. Pumps, fans, compressors, and EVs are frequently powered by a DC power supply with a built-in AC-to-DC converter. The DC/AC conversion on both the supply and demand sides not only consumes much power, and it also makes the system less efficient because of the added complexity; to solve these problems, the energy hub based on DC microgrid is suggested to update the conventional AC distribution systems [162]. The Energy Hub is described as a point of convergence for multiple energy carriers, where respective energy flows can be optimally transferred, conditioned, stored, converted, and distributed in response to demand criteria [192,222]. The DC micro grid-based energy hub is used to exchange PV electricity within the building cluster for thermal/electrical demand, including EVs, and it assisted the community, Sweden, in achieving a positive NPV within its 15-year economic lifespan [162]. The above discussion coveys that the bi-directional smart electric grid exists in most parts of the world, and it acts as primary grid support to many PEBs.

6.2. Impact of Other Smart Energy Grids in PEBs/PECs

The smart grid is not only limited to the electric grid; it is also extended to the heating grid, cooling grid, gas grid, and bio-fuel grid [223]. A PEB with multiple energy grids and its interaction with various supply, demand and storage is illustrated in Figure 5. The energy management system utilizes it on/off-site renewable to cover the building loads, and whenever there is a deficit/surplus energy generation, the EMS decides whether to discharge/charge its energy storage or to import/export to the various utility grids (electricity, heating, cooling and fuel grid) connected to the PEB. EMPA successfully studied a PEB coupled with “ehub” [57]. Lydon et al. [57] designed an ehub for PEBs to transfer the surplus energy between units (buildings) or to the ehub through the internal electrical and thermal grids, which work in both directions. To increase the self-consumption of generated renewables, the excess generation from PV or STC, for example, can be stored in batteries or geothermal and ice storage systems for seasonal storage [57]. Omenatarha community includes 500 residents and a kindergarten for 120 young children suited in twelve hectares and supported by a local energy supplier to supply both electricity and district heat from a predominantly bio-fuelled based CHP plant [167]. Ala-Juusela et al. [167] suggested that a bio-based CHP (producing all the heat and 70% of electricity) and 3000 m2 of on-site PV generation are essential to cover all its demand and reach PEC condition. Hu [25] used a fuel cell system, and in this system, the by-product heat was being cycled back to the campus grid to supply heat to other buildings. The natural gas grid is used to substitute the supply of on-site generated biogas to the 300 kW fuel cell generator in the UC-Davis community [156]. The Feldheim community has its own grids for district heating and power supplies through those the heat and power generated are supplied directly to consumers, and it should be emphasized that the local utility grid did not allow them to access and use their grid [158]. It saved costs and obtained complete independence from the local utility companies [158].

6.3. Impact of Smart Metering in PEBs/PECs

The smart meter is vital for seeing the retail competition model in the electrical power industry. With the bidirectional interface’s help, smart meters record the electricity flow and exchange information. The economic value of a PEC project is influenced substantially by several factors, such as the size of the renewable system, peak/non-peak duration, fuel cost, and maximum power demand, mentioned in the utility grid’s tariff scheme [224]. The nature of the import/export tariff, to which the system is subjected, plays a key role in determining the economic value. Remarkably, the disparity between import and export rates, whether obtained through a retailer or directly from the market, is critical, and the detailed PEC selling/buying price is given in Figure 10 [23]. It shows that the retail price of a PEC is determined by four components: wholesale price, transmission charges, distribution charges and retailer charges. The PEC’s energy buying price generally includes the three components except the retailer charges, but the PEC’s energy selling price only substituted by the wholesale price. Generally, there are three trading methods to represent the distributed generation, such as net metering, feed-in tariff (FiT), and power purchase agreement (PPA) [225]. Under such trading methods, the customer can obtain economic benefits through different electricity service programs, such as single-rate pricing, real-time pricing (RTP), time of use (TOU) and critical peak pricing (CPP), and the risk and potentially rewarding of different programs are mapped quantitatively in Figure 10 [23,201]. It shows that the risk and potential rewarding are low in single-rate pricing and high in real-time pricing. Dumont [74] compared two different tariff plans for a battery supported PEB: the first one results in an average retail tariff of 0.28 €/kWh and a FiT of 0.17 €/kWh; the second one results in no electricity being sold to the grid (only a retail tariff of 0.28 €/kWh). It results that the lowest payback period of 7 years is reached with a low feed-in tariff (no_sell), and it emphasizes the importance of analyzing and choosing the tariff that matches the existing system [74]. Zhou et al. [193] illustrated the techno-economic performance of district building–vehicle systems, and the simulation is based on the new FiT of Hong Kong. According to that, a PEB of less than 10 kW renewable generation capacity can get 5 HKD/kWh of renewable energy generation, and there is no necessity for exporting it back, which indirectly encourages the users to maximize the self-consumption of generated renewable energy [193,224]. Dávi et al. [79] investigated the energy performance of a PEB with a grid-connected PV system in Brazil, and the resultant payback time based on net metering was shorter in Brasília and Belo Horiz due to higher electricity tariffs combined with the high capacity factor.

6.4. Importance of Grid-Responsiveness in PEBs/PECs

The power grid is generally designed to meet the maximum load instead of maximum on-site generation feed-in. When more PEB arise in the future, these cumulated matching problems can increase the possibility of destabilizing the grid voltage and frequency [226]. The energy system should be built to work in tandem with the power grid and not stress the existing utility infrastructure. Buildings should be grid-responsive by timely and effectively contributing to the power balance to improve the utility grid’s stability and optimize the grid-building ecosystem’s overall performance [36,227]. Zhou and Cao [38] designed a grid-responsive control strategy and shifted 96.8% of the utility electricity from the off-peak hours to the peak hours utilizing the available energy storage facility. Li et al. [228] mentioned that more efforts should be made to improve the stability of the grid. Cao et al. [105] studied a grid-responsive PEB using a hybrid utility grid including electric, heating and cooling grid. Cao et al. [105] said that depending on the stress in the energy grids, the excess renewable energy generated in the building can be transformed and exported into the specific energy grid. This simulation study used the district heating system for exporting excess renewable energy generation from the building in Helsinki and the district cooling grid for exporting excess renewable energy generation from the building in Shanghai [105]. The section about the impact of smart energy grid on PEB/PEC is summarized in Table 8, based on the type of grid, whether external or internal (electric, heating, cooling and fuel grid) and the magnitude of annual export, import and net export value to the grid.

7. The Impact of the New Energy Vehicles on the Positive Building and Community Energy Systems

The building and transportation industries account for more than 65% of global primary energy consumption and about 60% of global CO2 emissions, respectively [229]. In Hong Kong, the combined building and transportation sectors account for nearly 80% of carbon emissions [230]. It means that sector coupling between these industries has much potential to benefit. Researchers believe electric vehicles are a propitious choice to reduce the environmental cost of the sector, and it is stated in the framework of the European policies of many member countries [231]. The Electric Vehicles Initiative (EVI) is a multi-government policy forum aimed at speeding up the implementation and adoption of EVs globally. In this operation, the IEA serves as a coordinator to assist the EVI member governments [232]. With 13 member countries and 23 supporting companies and organizations, the EV30@30 [233] initiative aims to accelerate the adoption of new energy vehicles, including battery-electric, plug-in hybrid, and fuel cell vehicle. The IEA and Shanghai International Automobile City (SIAC) have collaborated to create the EVI Global EV Pilot City Programme (EVI-PCP), aiming to make a worldwide forum to promote communications and collaboration among the cities interested in up-taking e-mobility within their jurisdictions [191]. The penetration of new energy vehicle is crucial for dense urban cities, and it can assure zero direct emissions in urban areas, but it should not be forgotten that they are charged from the conventional power grid, which depends mainly on fossil fuels. Nevertheless, a new energy vehicle’s final environmental impact is notably lesser than the conventional IC engine-based vehicles. New energy vehicles, such as electric vehicle and hydrogen vehicle, generally interact with building and grid in four modes: B2V, V2B, G2V and V2G. This section about the investigation of the impact of new energy vehicle is classified into three parts: the first two parts elaborate the interaction of EV with building and grid, respectively, and the third part explains the interaction of hydrogen vehicle with building and grid.

7.1. Interaction between an EV and a Building

The interaction between a building and an EV happens through two modes: one-directional interaction from a building to a vehicle is so-called B2V, and bidirectional interaction between a building and a vehicle (B2V and V2B) is so-called V2B2. EV is utilized to create a balance within the local environment (building or community) to increase the self-consumption of renewable energy produced on-site and use as a residential back-up power supply during periods of a power outage. Enhancing the interaction between a building and an EV does not affect the grid performance; it indirectly benefits the grid by reducing peak demand and eases the overall grid capacity demand for a building/community. Erhorn-Kluttig et al. [104] verified experimentally that the energy generated by the roof and facade integrated PV has been higher than the energy demand of the building service system and the occupant-dependent energy consumption of the building, considering unfavorable climatic conditions. The excess electricity can cover 25% of the annual electricity need of the electric vehicle by B2V function [104]. Huang et al. [162] examined the integration of EVs to achieve a positive cost energy community, and the result denotes that self-consumption of the generated electricity is increased from 79% to 81%. Meanwhile, due to the increased self-consumption, the LCOE of the self-generated electricity is slightly reduced [162]. V2B2 strategy applied to the fundamental nucleus of energy users connected to human activities (House-EV-Office) helps attaining appreciating results from both energy and economic standpoints by decreasing the capital cost of the energy storage [234]. The battery swap options allow reaching a positive cost energy system with a net present value of 19,000 € [234]. Kobashi et al. [235] comparatively studied the PV assisted EV penetration with B2V and V2B functions in Kyoto, Japan, and Shenzhen, China. The study shows that the higher electricity tariff of 0.25 $/kWh in Kyoto gives the possibility to reach a positive NPV of $6900 ± 1600 [235]. Since a positive energy system is projecting the importance of using the available resource to create value for the system and to increase the overall performance of itself (building or community) and also its supporting system (utility grid), it is vital to consider the interaction of the building with its vehicle. B2V, V2B, V2G and G2V functions of fuel cell electric car parked at a building is shown in Figure 11.

7.2. Interaction between an EV and a Grid

In several regions, the increasing trend in renewable energy installed capacity has started to set high requirements on power quality and power balance control; notable power fluctuation happens due to high variation on solar irradiance or wind speed [236]. Moreover, increasing the number of electric vehicles on the road would inevitably increase the stress on power grids and transmission networks. However, the extent of negative impacts on the utility grid can be mitigated by integrating EVs into the grid via smart interaction. When appropriately charged/discharged, electric vehicles can reduce the burden on the local grid and provide services to fill flexibility gaps on a local and system level. The utility/transmission system operator might be willing to purchase energy from customers during peak demand periods and use the electric vehicle’s battery capacity to provide ancillary services, such as balancing and frequency control, including primary frequency regulation and secondary reserve. As a result, V2G is considered to have a higher potential commercial value than V2B in most applications. Alirezaei et al. [102] investigated the V2G concept and said that EV could behave as a controllable load when charging and dispatchable generation or storage when discharging its battery capacity back to the building or grid. EV can facilitate the integration of all distributed renewable generation in the power network [237]. This integration benefits the power grid through harmonics filtering, frequency regulation, and even failure recovery to the power system during a blackout [238,239]. This integration benefits the building owner by providing uninterrupted power support for the home, and EVs acts as back-up energy storage for energy building [240]. Barone et al. [39] proposed and analyzed three different novel energy management systems for buildings with EV as an energy vector. The simulation shows that the building grid reliance and grid electricity consumption are remarkably reduced up to 45% and 77% depending on the proposed scenarios [39]. Rohloff et al. [241] examined and quantified the potential range of increased building energy use from transportation in many scenarios and evaluated its impact on the annual energy balance at building and community level. Rehman et al. [26] explained that higher numbers of EVs on a PEC affect the performance of the system, and this is inevitable to be considered for the design of the energy networks for the future. Adding transportation loads to a building makes it difficult to compare with other PEBs which does not have such load, and there is no precise measure to show the overall benefit [241]. From the literature, it is clear that even though the optimal integration of the new energy vehicle into the building is severe, it can achieve increased performance and economic benefit by effectively utilizing the available storage in it.

7.3. Interaction of HV with a Building and Grid

Hydrogen fuel-based vehicles are another type of new energy vehicle popular among PEB and PEC. In a hydrogen-based energy system, the generated energy can be considered both stationary by storing that in a tank within the building boundary and movable by keeping that in the vehicle’s tank, whereas it is always movable in EV. Like EV, hydrogen fuel-based vehicles can also perform bidirectional interaction with buildings and the utility grid. Lydon et al. [57] supplied electric energy to electric cars’ charging station or converted and stored the excess generation as hydrogen in a mobility project. Robledo et al. [168] analyzed the V2G function under two cases, such as load following and fixed power, and the results imply that transforming the buildings in the microgrid to PEBs is possible in both the cases with the net export of −23 kWh/m2 and −64 kWh/m2, respectively. V2G strategy can decrease the yearly imported energy from the utility grid by around 71% and could be economically profitable for the user if hydrogen cost falls below 8.24 €/kg [168]. Cao [73] compared hydrogen vehicles and EVs by integration with renewable supported building systems. The results illustrate that the HVs hardly meet the annual energy balance because they were not as efficient as the EV systems. The possibility of energy recovery from the vehicle to the building should be considered [73]. In Table 9, the different type of new energy vehicles and their energy flow function in PEBs are summarized with the building and renewable energy details.

8. Future Outlook and Future Work

A key point of innovation to reach positive energy performance is a deep dive towards designing with nature, the laws of physics, and biomimetics [242]. The positive energy projects, like C40 Cities [243], + CityxChange [244], EXCESS [245], Atelier [246] and POCITYF [247], EV30@30 [233] are the stepping stone to reach the objectives of various energy and environmental-related targets such as NDC’s involved in Paris Agreement [10], EU 2030 climate and energy target [248], and WordGBC’s advancing net zero [2]. Global Building Performance Network (GBPN) launched the 1 billion square meter of positive energy buildings campaign in partnership with the Renewable Energy and Energy Efficiency Partnership (REEEP) [249]. The campaign aims to support the immense up-scale of PEBs globally. Such a paradigm shift in the building sector is vital to prevent the predicted climate change impacts and assure affordable energy supply to all. GBPN defined the PEBs in five cases, and it is mentioned in increasing levels of difficulty: Basic Case (nearly Zero Energy Building), Aspirational Case (Net Zero Energy Building), Holistic Case (Positive Energy Building), Ambitious Case (All Energy Positive Building) and Ideal Case (Zero Energy Footprint Building) [249,250]. The definition of the ideal case: Zero Energy Footprint Building is an all-energy positive building that generates more renewable energy than its annual demand while maintaining comfort levels, and the lifetime cumulated excess generation should cover the energy utilized during the building construction. Currently, available technologies are good enough to attain the ideal case stated by GBPN.
From this comprehensive study, it is noticed that the concept, framework, and indicators of positive energy building and community are not yet standardized, and initiative like IEA EBC Annex 83 has been raised to solve it before 2024 [251]. Unlike the NZES, many countries do not have a long-term plan and do not form an institute to govern it. Above all should be rectified to create a strong foundation for positive energy systems. The PEB concept should move beyond the demonstration and scale up to the mainstream implementation. With the increased uptake, PEBs will be techno-economically feasible and more accessible for more stakeholders and the public. Governments must give a bottom-up push to transform the construction and power markets to align the regulatory policies which lead the market by driving the demand and increasing mandatory energy performance with incentives. It has been seen that a few countries already have ambitious goals towards energy positivity to reduce carbon emissions, but unfortunately, things are not going under their planned timelines [252,253,254]. Apart from government bodies, some corporate companies are also interested and have made excellent strides. The company predicts that its entire supply chain will become climate positive by producing more renewable energy than its consumption on or before 2030 [255,256]. The certification and challenges (Living Building Challenges and Living Community Challenges) provided by a non-profit institution like the International Living Future Institute [53] and BREEAM [257] encourage the stakeholders to support PEBs/PECs. It is an indication of an excellent future for Positive Energy Building and Community concepts. Moreover, it motivates researchers to work on energy positivity towards the success of mankind in green terms.
From the literature review, it has been understood that there are some significant shortcomings in the field of positive energy building and community, and those have been stated to direct the researchers to fit the research gaps. Firstly, the PES definition says that the PES should annually generate more renewable energy than its demand. However, the minimum percentage of the excess annual generation is not concretely defined in academia, and this confuses when differentiating the PES from the ZES. Future work is needed to determine the boundary between ZES and PES quantitatively. Secondly, in some cases, it has been seen that there is a necessity to expand the building boundary from the on-site renewable energy generation to the off-site renewable generation to achieve the net positive concept. It raises a question about the boundary of renewable energy generation. Therefore, future work in this field should concretely define whether using off-site renewable energy is allowable or not. Furthermore, the permissible quantity of off-site renewable energy should be denoted in terms of percentage. Thirdly, there is no standardization and quantitative criteria on energy efficiency and final energy demand of the positive energy system; past work vaguely explained that the standard requirement should be higher than the zero-energy standard. Henceforth, researchers should qualitatively and quantitatively describe the critical criteria of PES (for example, EUI) and standardize the requirements. Fourthly, advanced ICT, control strategies and optimization are widely noticed in PES compared to ZES for various energy management, such as demand-side management, storage-side management and grid-side management. However, the minimum requirement of the energy management system in PES is not defined in the existing literature, and it should be addressed in future work. Fifthly, some research informs that PES should add values to the setup in which it is part, but it is not explicitly defined what kind of values. For instance, in the grid interaction perspective, whether the PEB should be autonomous or low grid-interactive or demand responsive or generate economic benefit. Thus, this kind of requirement should be elucidated with magnitude in future work. All the above-stated information explains that a guideline or standardization is needed for the PES concept to differentiate it from ZES.

9. Conclusions

This paper is a state-of-the-art review of positive energy building and community while including the comprehensive investigation on various key aspects, such as energy supply, demand, balance, storage, management system, the role of different stakeholders, challenges and bottlenecks of PEB and PEC. This paper also examined the main differences between the PEBs and PECs. The impacts of the smart energy grids and new energy vehicles on the PEB and PEC are well represented in this paper, and the comprehensive review is summarized below.
(1)
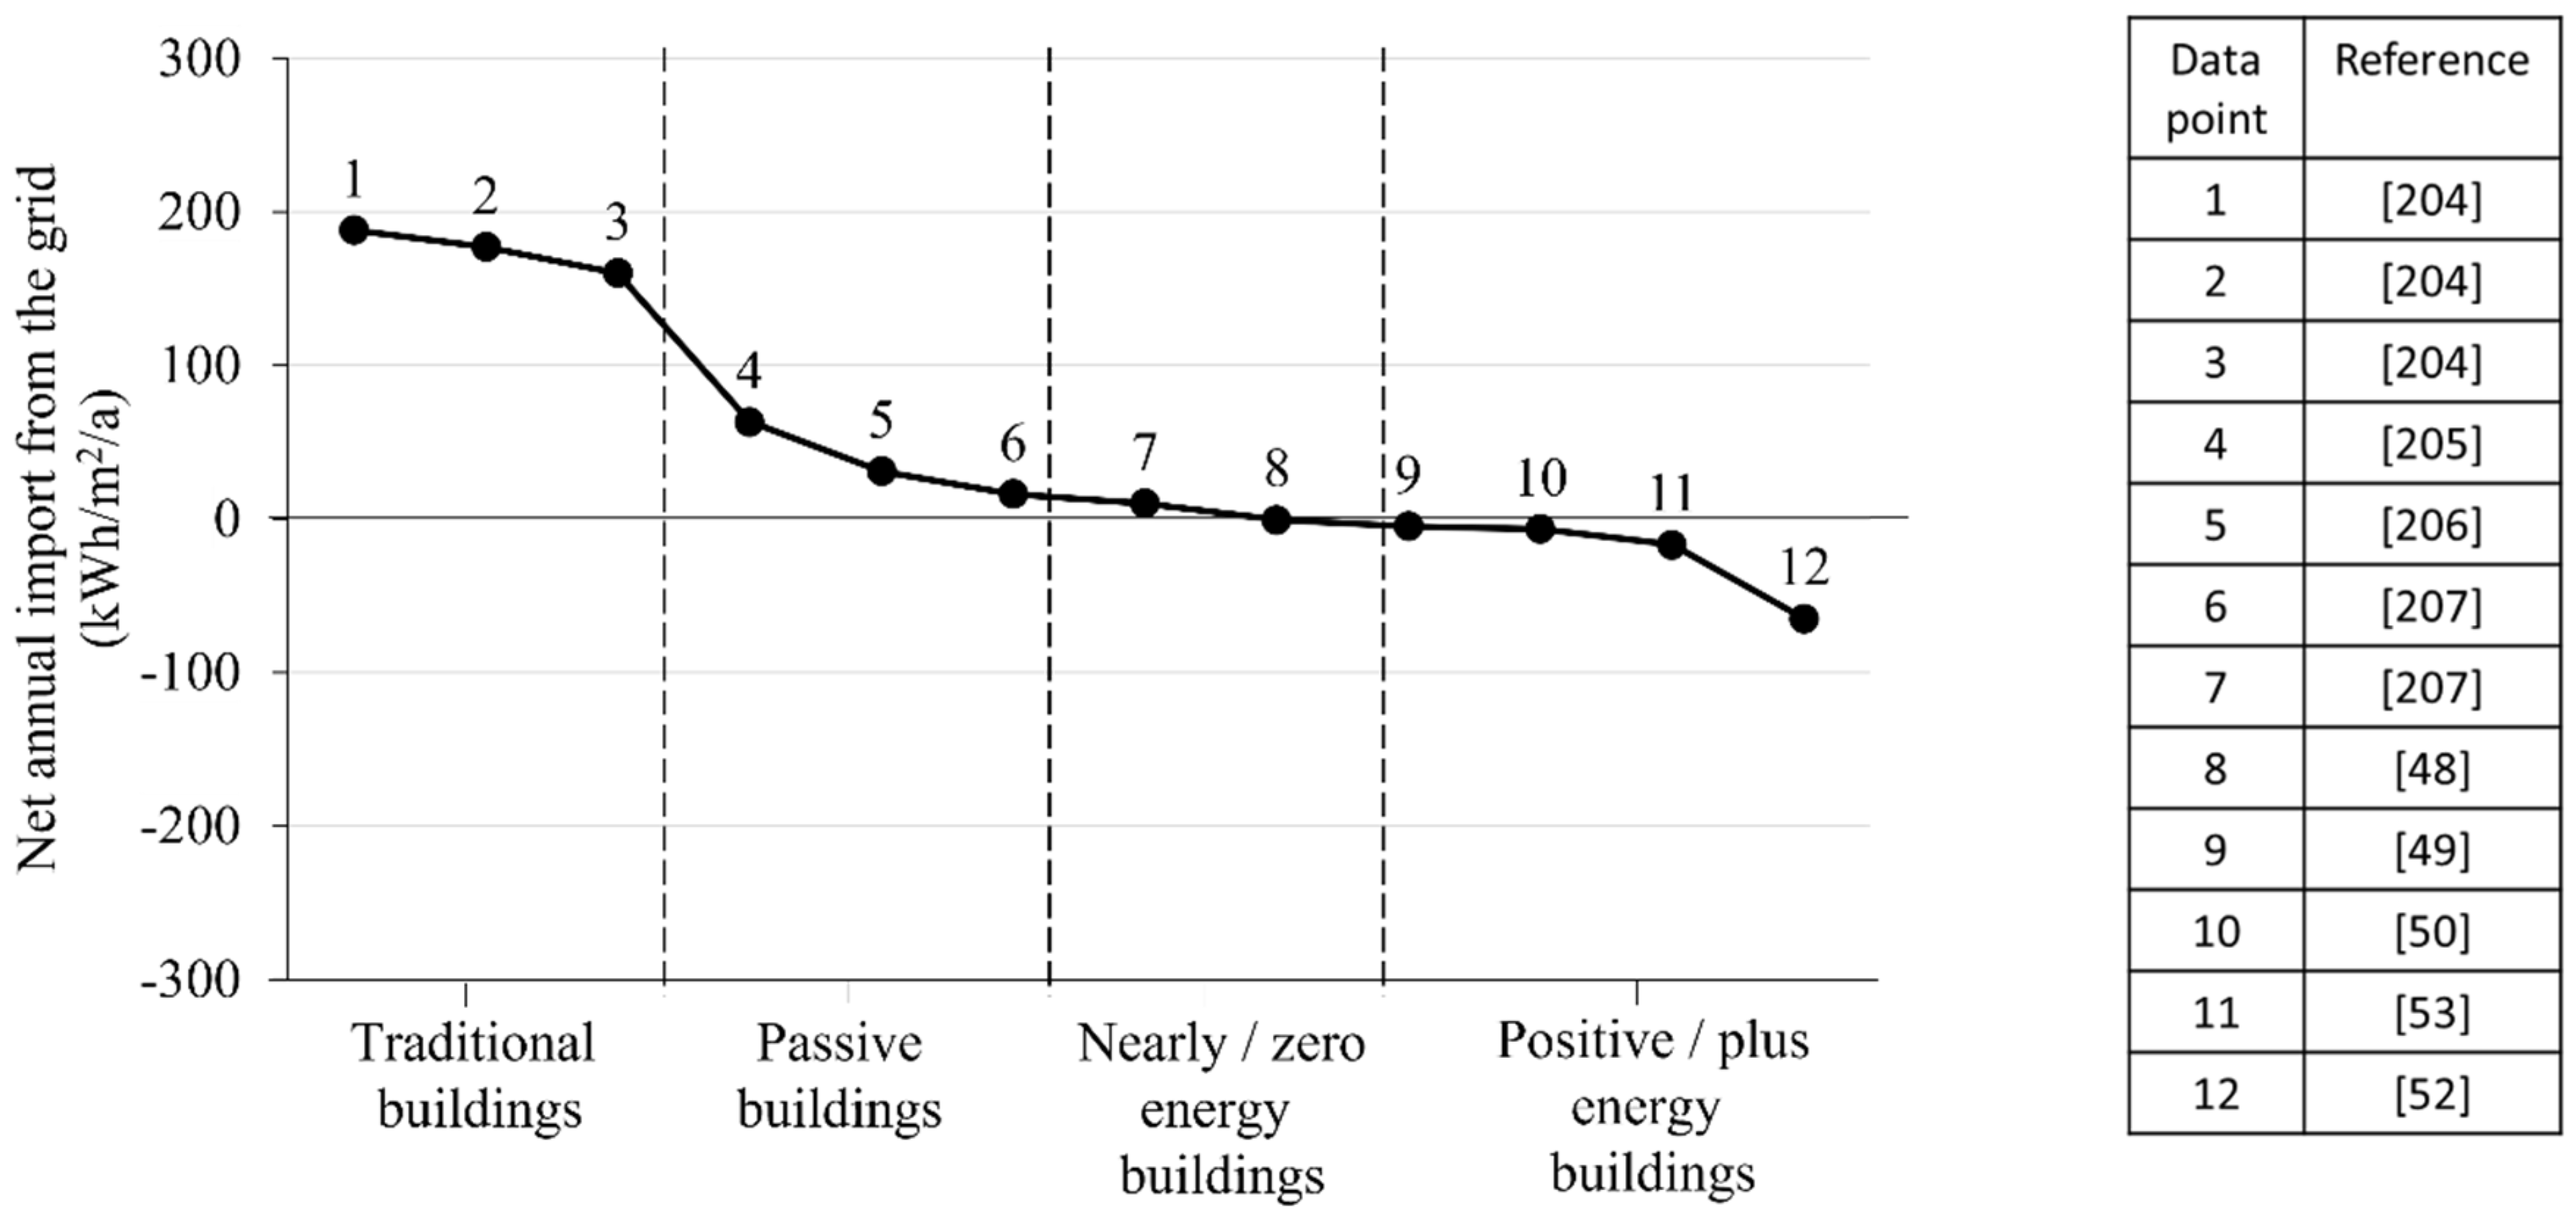
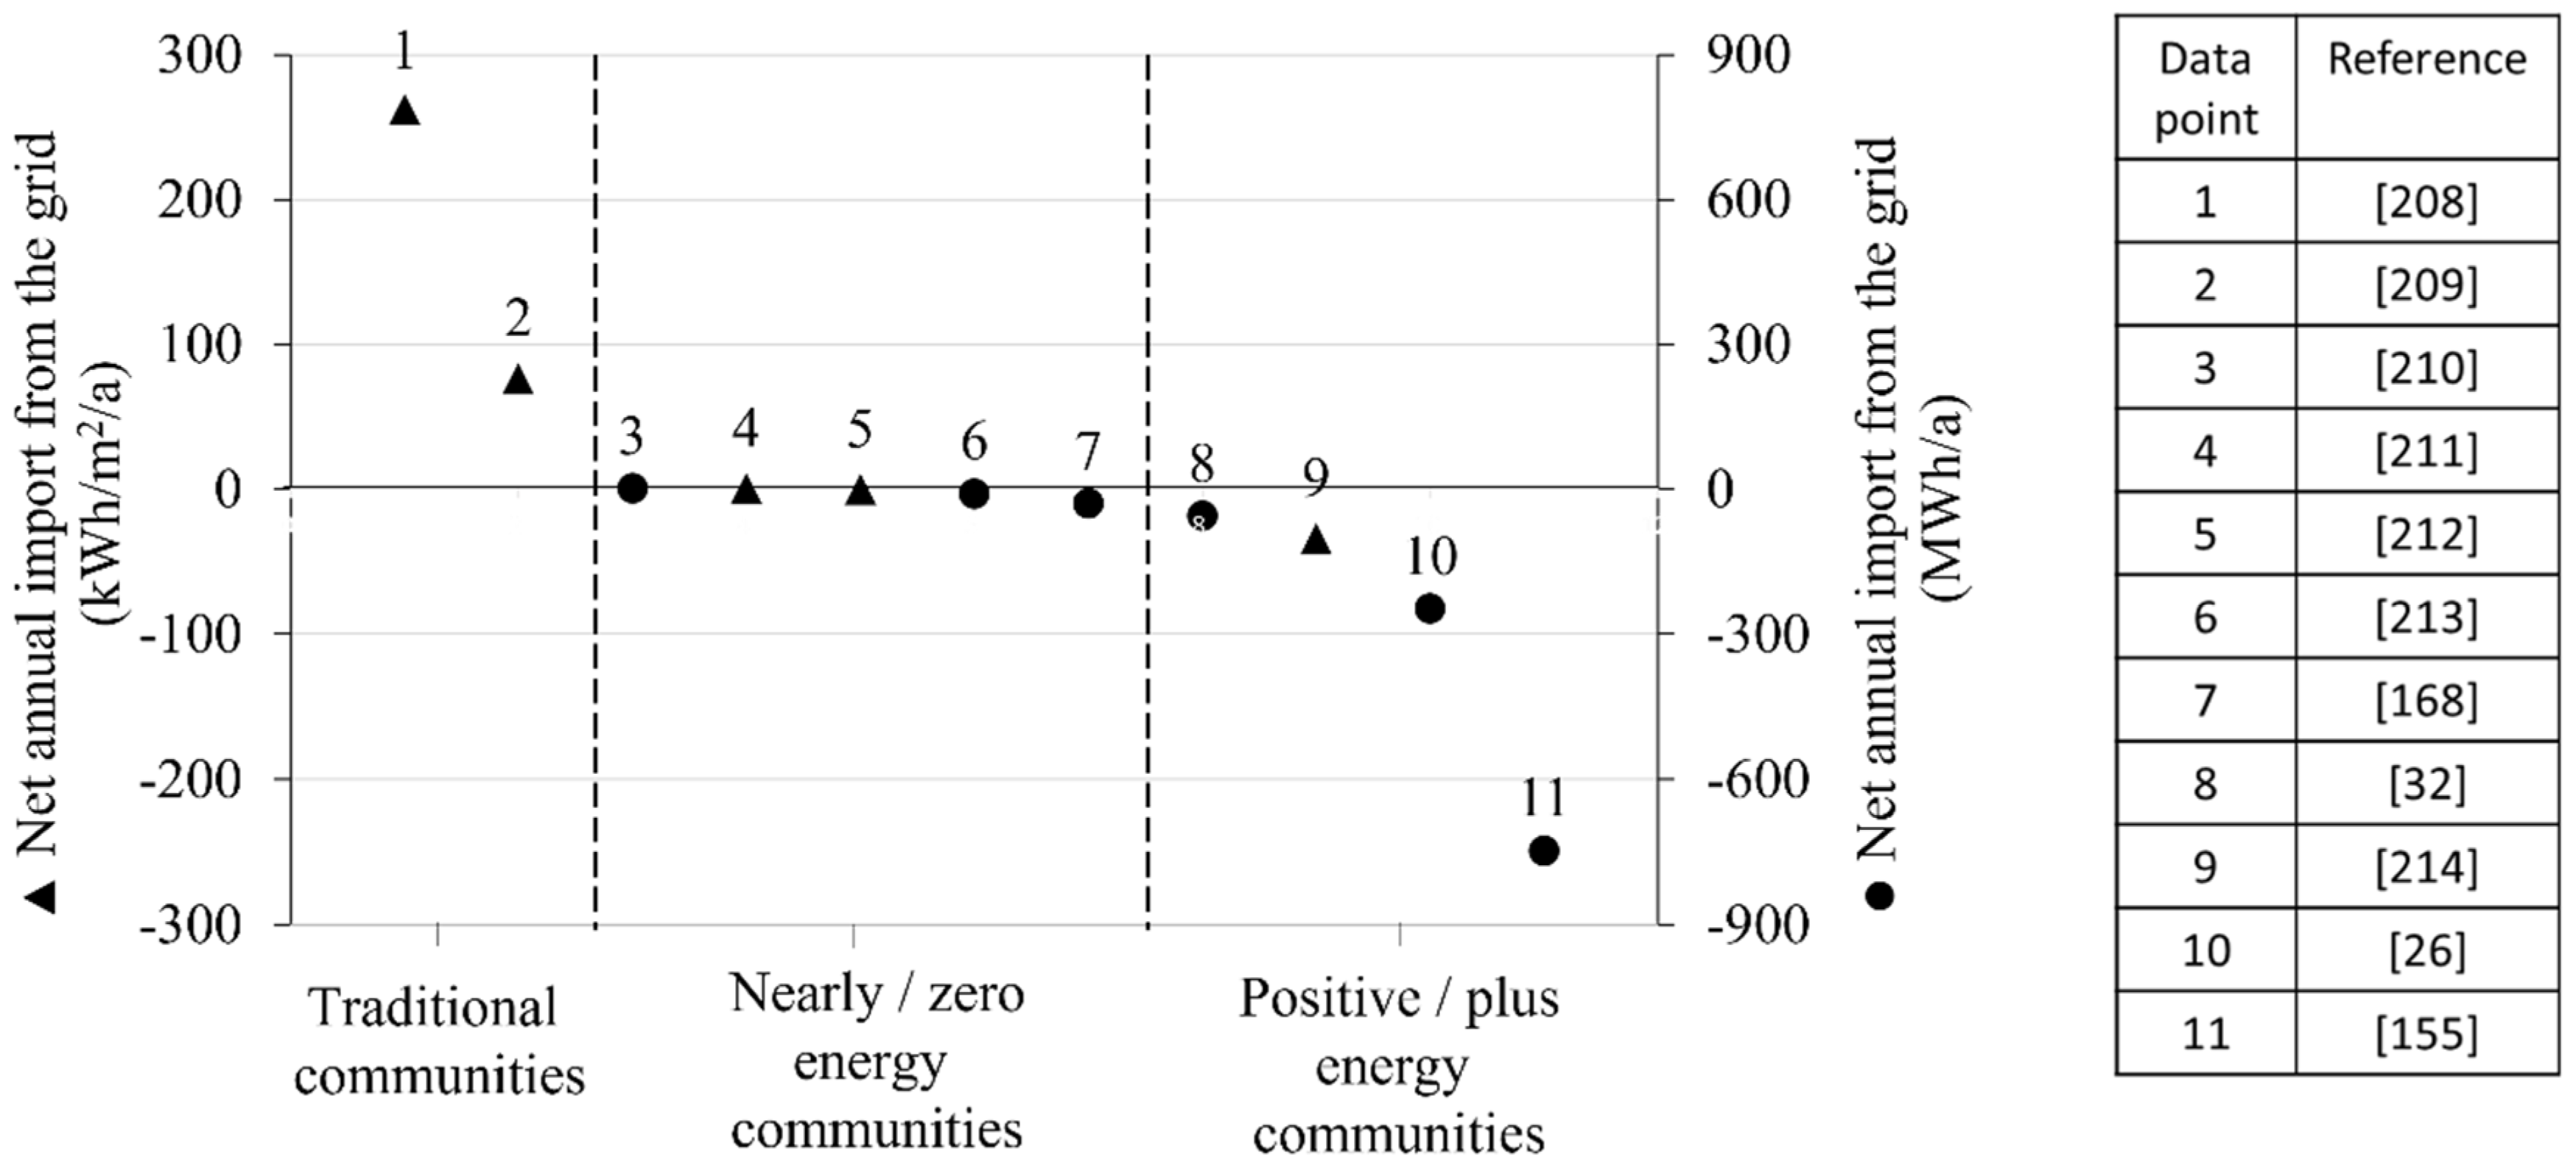
In spite of the fact that positive energy system (PES) approaches encourage low energy consumption and increased energy efficiency like zero energy systems (ZES), it requires excess renewable energy generation on an annual basis. Most of the PESs generate at least 10% more renewable energy than their annual energy demand to tackle the yearly increasing energy consumption and maintain the positive energy status for a few more years without any renovation. Off-site renewable energy generation is visible in both PEB/PEC; comparatively, it is most common in the community-scale energy system. Besides that, PES requires multifunctional design synergies among social, cultural, psychological, environmental, and economic factors in a systematic approach. Even though the primary indicators of PES are derived from ZES, the standard indicators to quantify the factors which add values to the system are still missing, such as energy flexibility and vehicle integration. Supply-side and demand-side management are crucial for PES to maximize the utilization of onsite renewable generation within the system with a higher load matching. The positive energy concept matches PEC comparatively better than PEB because of the levelling combination of different generations and demands available within the system.
(2)
Although it is possible to attain net positivity without energy storage, it would not meet the central theme of PES, such as increased self-utilization of generated electricity and reduced grid interaction. The integration of new energy vehicles and the implementation of energy flexibility concepts are critical when shifting from ZES to PES. Therefore, the selection, sizing, and controlling of energy storage is essential to maximize the benefits of PES techno-economically with accessible resources. The possibility of a cost-effective energy storage system supports the PEC over PEB.
(3)
A holistic energy management system incorporating all the needed functionality is salient to operate, monitor, control, and optimize the system in achieving the intended objectives. It is necessary to consider all the discrete problems and find an integrated solution within the building boundary to realize deep energy savings in PEBs, whereas in PECs, energy-saving measures should be considered together as a community and solved within the defined community boundary. PES should use advanced controls and strategies on EMS, covering all the central parts of the energy system, such as generation, demand, storage, vehicle interaction and grid interaction. Even though some ready-made smart energy management systems are available in the market, especially for smart homes, it is not enough to reap the full benefit of the positive energy concept like a customized energy management system. Community-scale energy systems are usually designed with a customized energy management system.
(4)
Two primary aspects make PEBs different from ZEBs: the excess capital involved to generate excess renewable energy while increasing energy efficiency and reducing energy demand and the influence of excess generation on the utility grid. Depending upon the regional needs, the stakeholders enclosed in the utility grid should appropriately plan the policies and regulations to indirectly handle the system towards the overall positive impact for all the stakeholders. Moreover, the PES opens a host of new technical, behavioral, policy, regulatory, and opportunities that are not currently evident with the ZES.
(5)
PES’s proliferation is hampered by its ambiguous legal definition and less popularity among the general populace; even, it is not well-known among relevant stakeholders because of its high complexity and infancy. According to the findings, the PES is confronted with technological, social, financial, political, and regulatory barriers. Compared to PEB, where the owner/user plays a central role, PEC, where the community developer plays a central role, faces numerous challenges such as decision-making, high capital investment, a lack of a business model, and compliance with policy and regulation. It is noticed that community users are unwilling to compromise and adjust their behavior compared with PEB users.
(6)
Four key differences in technical aspects are noted between PEB and PEC. First, when the community level unveils a broader boundary, cost-effective, reliable and hybrid renewable energy generation is possible with the added benefit of large-scale generation. Second, when compared to building scale appliances/equipment with the same capacity, the performance and cost of community-scale energy appliances/equipment are high and low, respectively. Third, using the cost-effectiveness of large-scale hybrid energy storage frameworks such as community energy storage or energy hub, PEC can achieve autonomy at a lower cost than PEB. Fourthly, comparing the EMS between PEB and PEC is not easy because of their multitude, heterogeneity and lack of past comparative study of any EMS between them; the only conclusion that can be made is the EMS in PEC is complex than PEB.
(7)
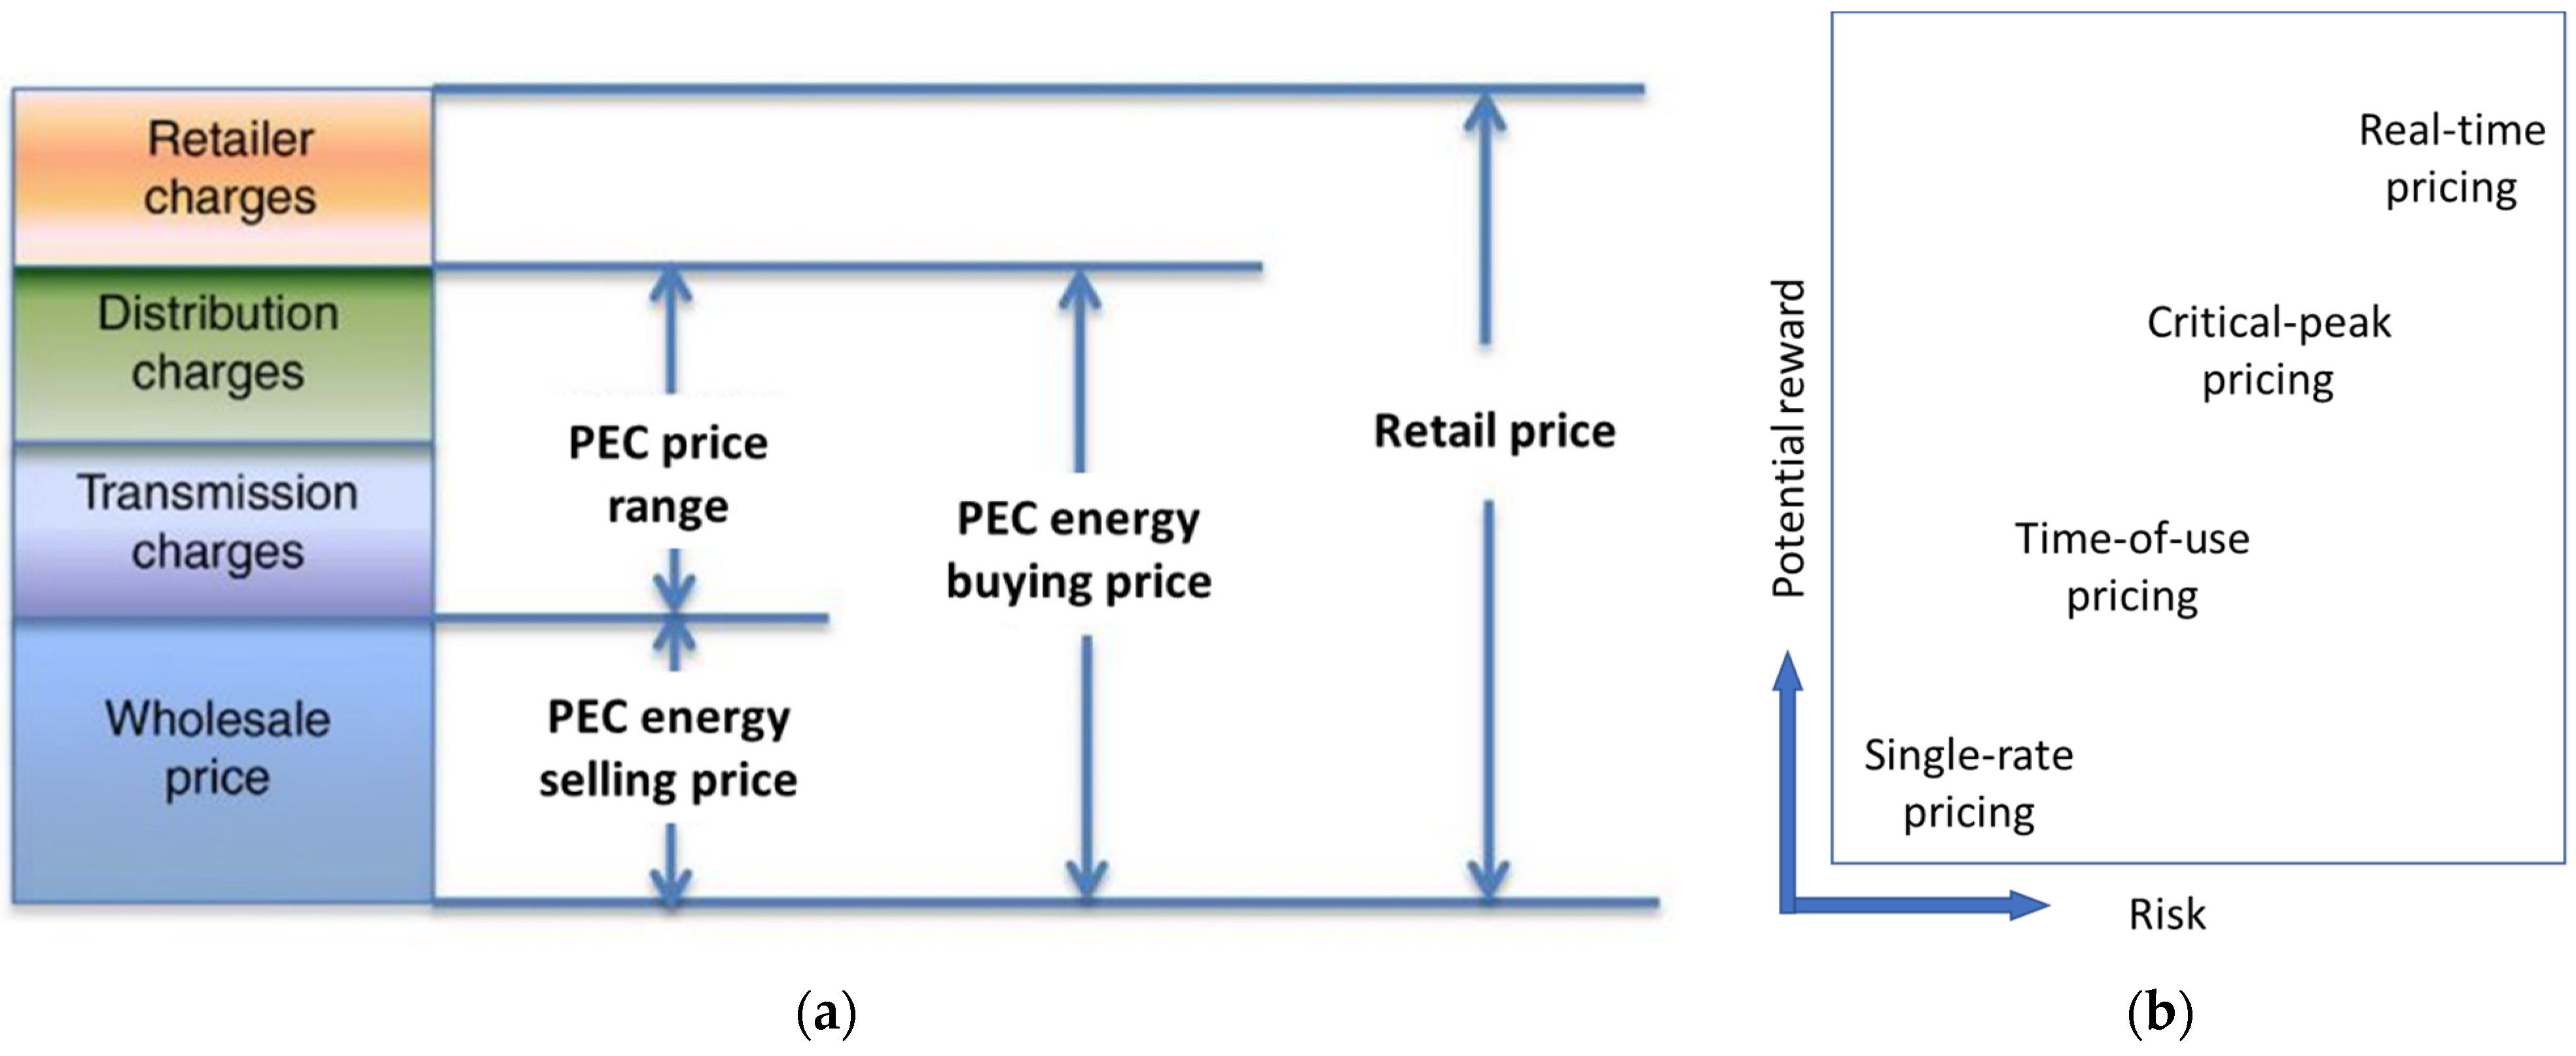
The smart electrical grid is essential and widely noticed in all the PES; the smart multigrid is comparatively widespread in PEC than PEB, and its availability can provide versatility in various aspects to increase the overall performance and earn the economic benefit. The economic value of a PES project is influenced substantially by the nature of the utility grid’s tariff scheme based on several factors, such as the size of the renewable system, peak/non-peak duration, fuel cost, and maximum power demand. The PES should be designed to function in synergy with the utility grid and not feeding addition stress on the existing grid infrastructure. PES should be grid-responsive, contributing to the grid’s power balance timely and effectively to enhance the reliability and optimize the power grid’s overall efficiency.
(8)
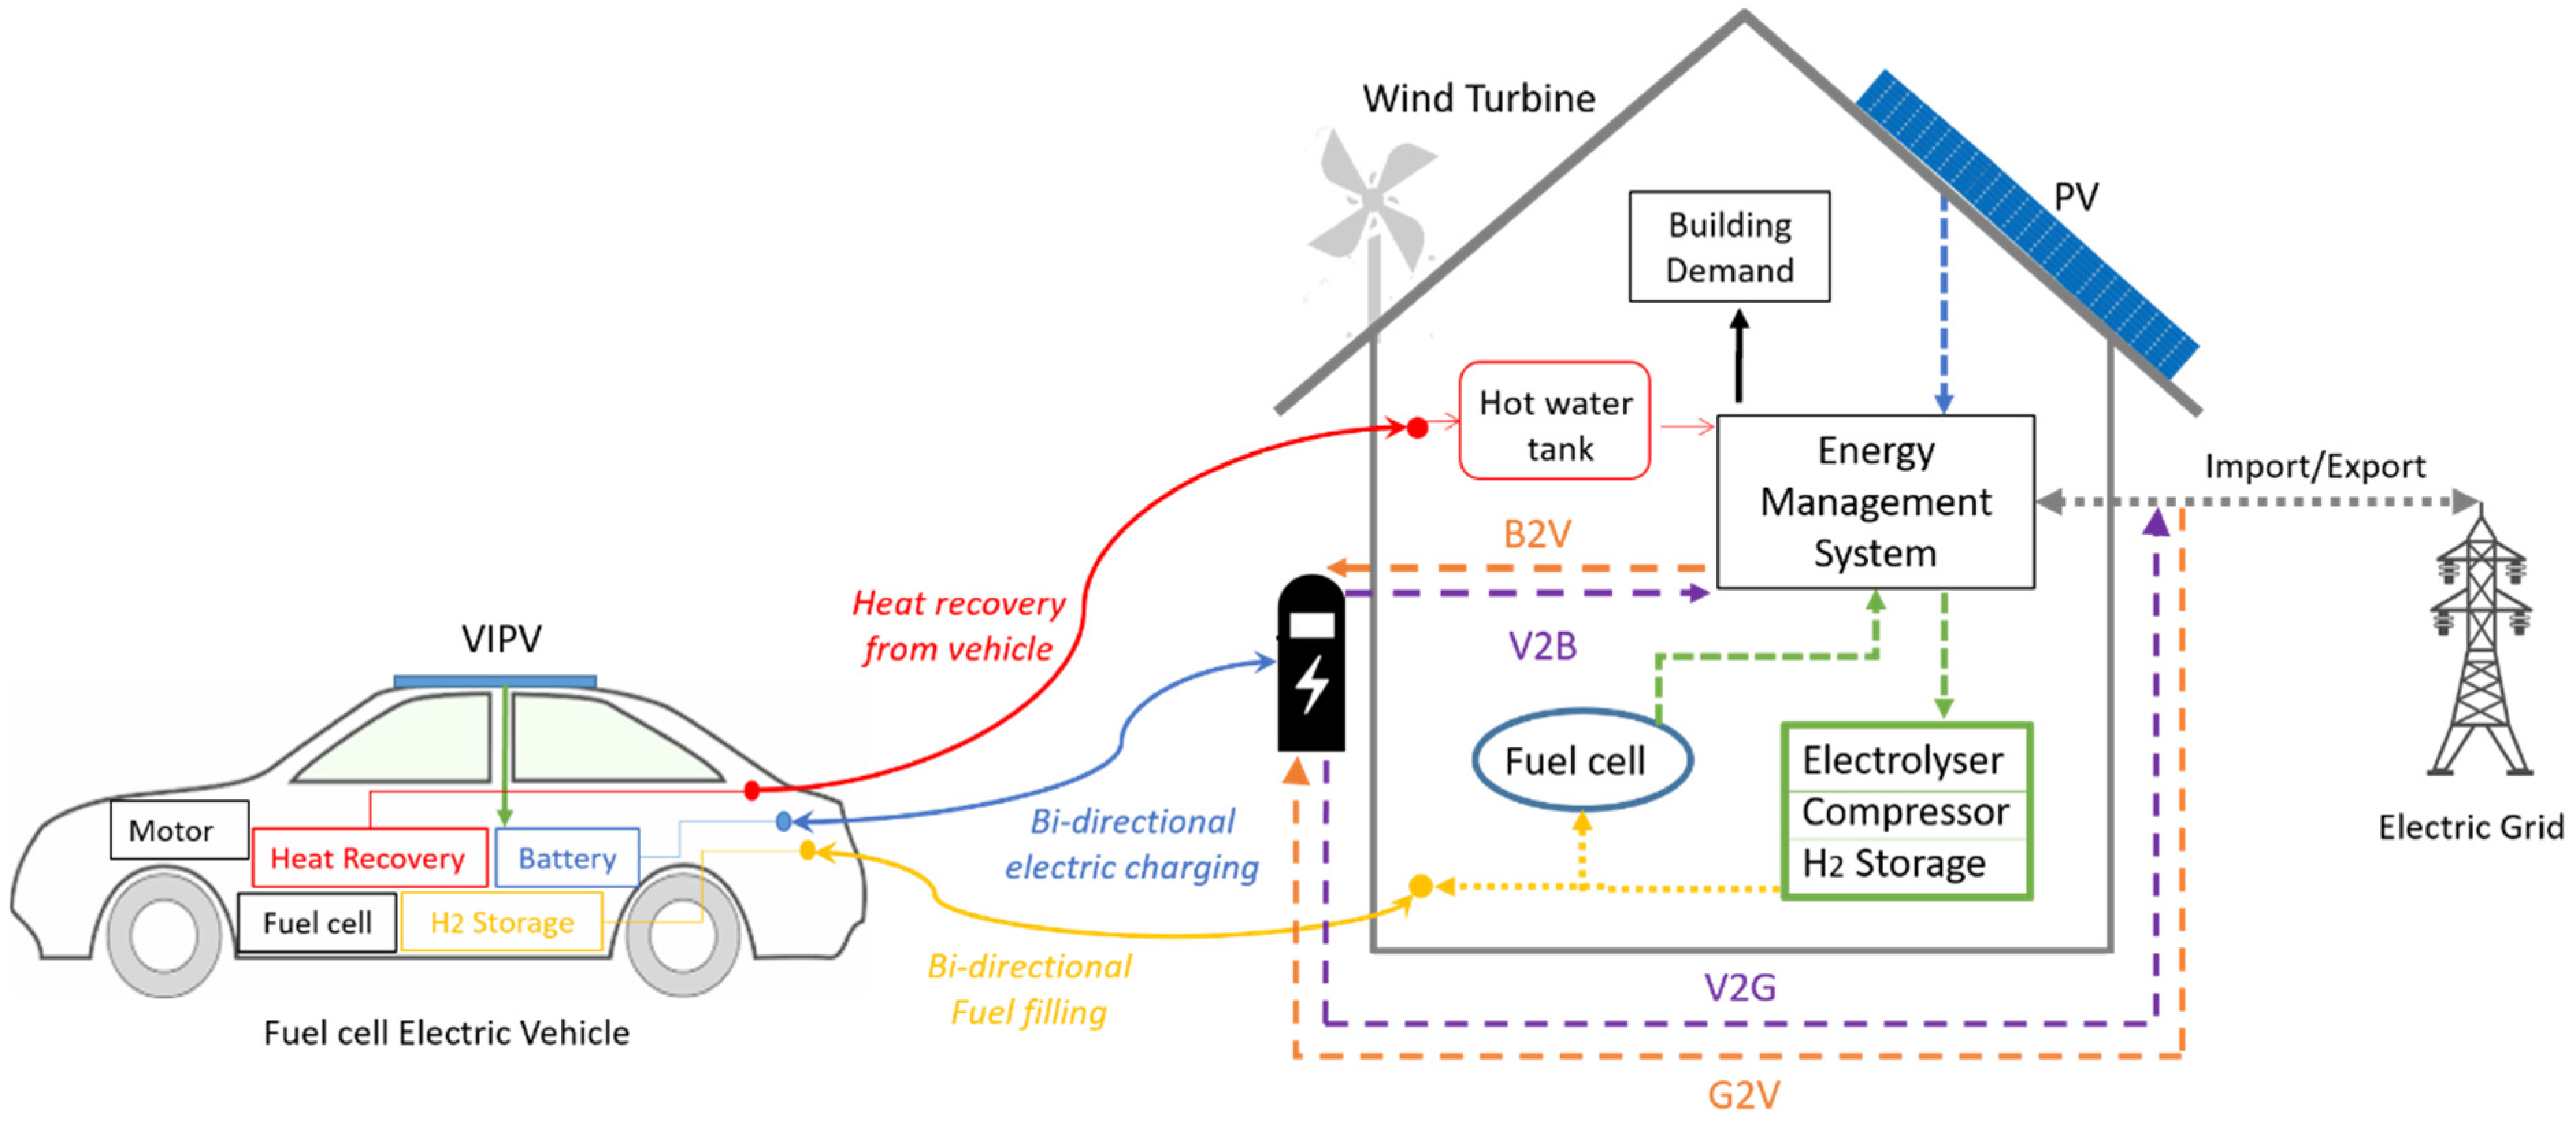
Since the definition of PES emphasizes the importance of using the available resource to create value for the system and to increase the overall performance of itself and its supporting system like utility grid, it is vital to consider the interaction of the building with its vehicle. Creating a balance within the PES, new energy vehicles should be utilized in B2V/V2B mode to increase the self-consumption of renewable energy produced on-site and use as a back-up power supply during periods of a power outage. Enhancing the interaction between a building and a new energy vehicle benefits the grid indirectly by reducing peak demand and easing the overall grid power capacity. The severity of negative impacts on the utility grid caused by the growing number of new energy vehicles on the road can be mitigated by integrating the vehicles into the grid via smart interaction strategies like G2V/V2G. When appropriately charged/discharged, the new energy vehicles can relieve the burden on the local grid and provide stability to it.

Author Contributions

G.M.S.K.: Literature reviews, Methodology, Investigation, Writing—original draft, Writing—review and editing; S.C.: Supervision, Funding acquisition, Project administration, Literature reviews, Methodology, Investigation, Writing—original draft, Writing—review and editing. All authors have read and agreed to the published version of the manuscript.

Funding

This study is supported by HK RGC (Hong Kong Research Grants Council) Research Project 25215618.

Institutional Review Board Statement

Not applicable.

Informed Consent Statement

Not applicable.

Data Availability Statement

Not applicable.

Conflicts of Interest

The authors declare no conflict of interest.

Abbreviations

AHPAnalytic Hierarchy Process
ASHPAir Source Heat Pump
Autonomous PEBStandalone Positive Energy Building
B2VBuilding to Vehicle
BIPVBuilding Integrated Photovoltaics
BPIEBuilding Performance Institute Europe
BRTBattery Replacement Time
BTESBorehole Thermal Energy Storage
CESCommunity Energy Storage
CHPCombined Heat and Power
COPCoefficient Of Performance
CPPCritical Peak Pricing
CED n.ren.Cumulative Energy Demand non-renewable
DBGMSDistributed Battery Grid Management System
DHWDomestic Hot Water
DRDemand Response
DSMDemand Side Management
UBPEcological Scarcity
EEREnergy Efficiency Rating
EMSEnergy Management System
EPBDEnergy Performance of Buildings Directive
EPIEnergy Performance Index
EUIEnergy Use Intensity
EVElectric Vehicle
FiTFeed-in Tariff
FCEVFuel Cell Electric Vehicle
G2VGrid to Vehicle
GBPNGlobal Building Performance Network
GHGGreenhouse Gas
GIGrid Interaction
GWPGlobal Warming Potential
H2Hydrogen
HERSHome Energy Rating System
HEMHome Energy Management
HPHeat Pump
HVHydrogen Vehicle
HVACHeating, Ventilation and Air Conditioning
ICTInformation and Communication Technology
IoTInternet of Things
LCOELevelized Cost of Energy
LMLoad Matching
MILPMixed Integer Linear Programming
MPCModel Predictive Controller
NPVNet Present Value
NZEBNet Zero Energy Building
NZESNet Zero Energy System
OEFOn-site Energy Fraction
OEMOn-site Energy Matching
ORCOrganic Rankine Cycle
PCMPhase Change Material
PEBPositive Energy Building
PCEBPositive Carbon Emission Building
PECPositive Energy Community
PECaPositive Energy Campus
PECBPositive Energy Cost Building
PEDPositive Energy District
PEPPositive Energy Portfolio
PESPositive Energy System
PExBPositive Exergy Building
PHESPumped Hydro Energy Storage
PPAPower Purchase Agreement
PSoEBPositive Source Energy Building
PSiEBPositive Site Energy Building
PVPhotovoltaics
REeRenewable Energy
REEEPRenewable Energy and Energy Efficiency Partnership
RTPReal-Time Pricing
SOCState Of Charge
STCSolar Thermal Collector
TESThermal Energy Storage
TOUTime of Use
V2BVehicle to Building
V2GVehicle to Grid
ZEBZero Energy Building
ZECZero Energy Community
ZESZero Energy System

References

  1. Yüksek, I.; Karadayi, T.T. Energy-Efficient Building Design in the Context of Building Life Cycle. In Energy Efficient Buildings; IntechOpen: London, UK, 2017. [Google Scholar]
  2. UNEP. Towards a Zero-Emission, Efficient, and Resilient Buildings and Construction Sector; International Energy Agency: Paris, France, 2017. [Google Scholar]
  3. Levermore, G. A review of the IPCC Assessment Report Four, Part 1: The IPCC process and greenhouse gas emission trends from buildings worldwide. Build. Serv. Eng. Res. Technol. 2008, 29, 349–361. [Google Scholar] [CrossRef]
  4. Stulz, R.; Tanner, S.; Sigg, R. Chapter 16—Swiss 2000-Watt Society: A Sustainable Energy Vision for the Future. Energy Sustain. Environ. 2011, 477–496. [Google Scholar] [CrossRef]
  5. Ellabban, O.; Abu-Rub, H.; Blaabjerg, F. Renewable energy resources: Current status, future prospects and their enabling technology. Renew. Sustain. Energy Rev. 2014, 39, 748–764. [Google Scholar] [CrossRef]
  6. IEA. Global Energy Review 2021. In Assessing the Effects of Economic Recoveries on Global Energy Demand and CO2 Emissions in 2021; International Energy Agency: Paris, France, 2021. [Google Scholar]
  7. Newcomb, J.; Lacy, V.; Hansen, L.; Bell, M. Distributed Energy Resources: Policy Implications of Decentralization. Electr. J. 2013, 26, 65–87. [Google Scholar] [CrossRef]
  8. UNDP. The Future Is Decentralised Block Chains, Distributed Ledgers, and the Future of Sustainable Development; The United Nations Development Programme: New York, NY, USA, 2017. [Google Scholar]
  9. Goldthau, A. Rethinking the governance of energy infrastructure: Scale, decentralization and polycentrism. Energy Res. Soc. Sci. 2014, 1, 134–140. [Google Scholar] [CrossRef]
  10. UNFCCC. PARIS AGREEMENT; United Nation framework convention on climate change: Paris, France, 2015. [Google Scholar]
  11. EU_2030. 2030 Climate and Energy Policy Framework; EUCO 169/14; European Union: Brussels, Belgium, 2014. [Google Scholar]
  12. EPBD. Directive 2010/31/EU of the European Parliament and of the Council on the Energy Performance of Buildings (Recast); Official Journal of the European Union: Luxembourg, 2010. [Google Scholar]
  13. IEA. Annex83 Positive Energy Districts Factsheet; IEA: Paris, France, 2020. [Google Scholar]
  14. Oree, V.; Anatah, H.K. Investigating the feasibility of positive energy residential buildings in tropical climates. Energy Effic. 2016, 10, 383–404. [Google Scholar] [CrossRef]
  15. Wang, L.; Gwilliam, J.; Jones, P. Case study of zero energy house design in UK. Energy Build. 2009, 41, 1215–1222. [Google Scholar] [CrossRef]
  16. Hernandez, P.; Kenny, P. From net energy to zero energy buildings: Defining life cycle zero energy buildings (LC-ZEB). Energy Build. 2010, 42, 815–821. [Google Scholar] [CrossRef]
  17. Pipkorn, J. Housing Carbon Zero, Carbon Positiv; Your Home—Australia’s guide to environmentally sustainable homes; Commonwealth of Australia, Department of the Environment and Energy: Canberra, Australia, 2013. [Google Scholar]
  18. Lacko, R.; Drobnič, B.; Sekavčnik, M.; Mori, M. Hydrogen energy system with renewables for isolated households: The optimal system design, numerical analysis and experimental evaluation. Energy Build. 2014, 80, 106–113. [Google Scholar] [CrossRef]
  19. Kılkıs, B.; Kılkıs, S.i. New exergy metrics for energy, environment, and economy nexus and optimum design model for nearly-zero exergy airport (nZEXAP) systems. Energy 2017, 140, 1329–1349. [Google Scholar] [CrossRef]
  20. Bauwens, T.; Devine-Wright, P. Positive energies? An empirical study of community energy participation and attitudes to renewable energy. Energy Policy 2018, 118, 612–625. [Google Scholar] [CrossRef]
  21. Jami, A.A.; Walsh, P.R. From consultation to collaboration: A participatory framework for positive community engagement with wind energy projects in Ontario, Canada. Energy Res. Soc. Sci. 2017, 27, 14–24. [Google Scholar] [CrossRef]
  22. Monti, A.; Pesch, D.; Ellis, K.A.; Mancarella, P. Energy Positive Neighborhoods and Smart Energy Districts; Academic Press: Cambridge, MA, USA, 2017; pp. 1–5. [Google Scholar] [CrossRef]
  23. Good, N.; Martínez Ceseña, E.A.; Mancarella, P. Energy Positivity and Flexibility in Districts. In Energy Positive Neighborhoods and Smart Energy Districts (RightsLink Printable License); Academic Press: Cambridge, MA, USA, 2017; pp. 7–30. [Google Scholar] [CrossRef]
  24. Civiero, P.; Pascual, J.; Arcas Abella, J.; Bilbao Figuero, A.; Salom, J. PEDRERA. Positive Energy District Renovation Model for Large Scale Actions. Energies 2021, 14, 2833. [Google Scholar] [CrossRef]
  25. Hu, M. Net-positive Building and Alternative Energy in an Institutional Environment. In Summer Study on Energy Efficiency in Buildings; ACEEE: Pacific Grove, CA, USA, 2016. [Google Scholar]
  26. Ur Rehman, H.; Reda, F.; Paiho, S.; Hasan, A. Towards positive energy communities at high latitudes. Energy Convers. Manag. 2019, 196, 175–195. [Google Scholar] [CrossRef]
  27. Clerici Maestosi, P. Smart Cities and Positive Energy Districts: Urban Perspectives in 2020. Energies 2021, 14, 2351. [Google Scholar] [CrossRef]
  28. Li, X.; Wen, J. Net-zero energy building clusters emulator for energy planning and operation evaluation. Comput. Environ. Urban Syst. 2017, 62, 168–181. [Google Scholar] [CrossRef] [Green Version]
  29. Huang, P.; Sun, Y. A clustering based grouping method of nearly zero energy buildings for performance improvements. Appl. Energy 2019, 235, 43–55. [Google Scholar] [CrossRef]
  30. Sun, Y.; Huang, G.; Xu, X.; Lai, A.C.-K. Building-group-level performance evaluations of net zero energy buildings with non-collaborative controls. Appl. Energy 2018, 212, 565–576. [Google Scholar] [CrossRef]
  31. Marino, C.; Nucara, A.; Panzera, M.F.; Pietrafesa, M. Towards the nearly zero and the plus energy building: Primary energy balances and economic. Therm. Sci. Eng. Prog. 2019, 13, 100400. [Google Scholar] [CrossRef]
  32. Staller, H.; Rainer, E.; Heimrath, R.; Halmdienst, C.; Martín, C.V.; Grabner, M. +ERS—Plus Energy Network Reininghaus Süd: A pilot project towards an energy self-sufficient urban district. Energy Build. 2016, 115, 138–147. [Google Scholar] [CrossRef]
  33. Eriksen, K.E.; Erhorn, H.; Graham, P. Positive Energy Buildings—Wishful Thinking or (Built) Reality. In Positive Energy Buildings; Building Performance Institute Europe (BPIE): Brussels, Belgium, 2014. [Google Scholar]
  34. Cui, B.; Wang, S.; Yan, C.; Xue, X. Evaluation of a fast power demand response strategy using active and passive building cold storages for smart grid applications. Energy Convers. Manag. 2015, 102, 227–238. [Google Scholar] [CrossRef]
  35. Srinivasan, D.; Rajgarhia, S.; Radhakrishnan, B.M.; Sharma, A.; Khincha, H.P. Game-Theory based dynamic pricing strategies for demand side management in smart grids. Energy 2017, 126, 132–143. [Google Scholar] [CrossRef]
  36. Wang, H.; Wang, S.; Tang, R. Development of grid-responsive buildings: Opportunities, challenges, capabilities and applications of HVAC systems in non-residential buildings in providing ancillary services by fast demand responses to smart grids. Appl. Energy 2019, 250, 697–712. [Google Scholar] [CrossRef]
  37. Noori, M.; Zhao, Y.; Onat, N.C.; Gardner, S.; Tatari, O. Light-duty electric vehicles to improve the integrity of the electricity grid through Vehicle-to-Grid technology: Analysis of regional net revenue and emissions savings. Appl. Energy 2016, 168, 146–158. [Google Scholar] [CrossRef]
  38. Zhou, Y.; Cao, S. Energy flexibility investigation of advanced grid-responsive energy control strategies with the static battery and electric vehicles: A case study of a high-rise office building in Hong Kong. Energy Convers. Manag. 2019, 199, 111888. [Google Scholar] [CrossRef]
  39. Barone, G.; Buonomano, A.; Calise, F.; Forzano, C.; Palombo, A. Building to vehicle to building concept toward a novel zero energy paradigm: Modelling and case studies. Renew. Sustain. Energy Rev. 2019, 101, 625–648. [Google Scholar] [CrossRef]
  40. Barone, G.; Buonomano, A.; Forzano, C.; Palombo, A. Increasing self-consumption of renewable energy through the Building to Vehicle to Building approach applied to multiple users connected in a virtual micro-grid. Renew. Energy 2020, 159, 1165–1176. [Google Scholar] [CrossRef]
  41. Habib, S.; Khan, M.M.; Abbas, F.; Tang, H. Assessment of electric vehicles concerning impacts, charging infrastructure with unidirectional and bidirectional chargers, and power flow comparisons. Int. J. Energy Res. 2018, 42, 3416–3441. [Google Scholar] [CrossRef]
  42. Das, H.S.; Rahman, M.M.; Li, S.; Tan, C.W. Electric vehicles standards, charging infrastructure, and impact on grid integration: A technological review. Renew. Sustain. Energy Rev. 2020, 120, 109618. [Google Scholar] [CrossRef]
  43. Liu, C.; Chau, K.T.; Wu, D.; Gao, S. Opportunities and Challenges of Vehicle-to-Home, Vehicle-to-Vehicle, and Vehicle-to-Grid Technologies. Proc. IEEE 2013, 101, 2409–2427. [Google Scholar] [CrossRef] [Green Version]
  44. Cole, R.J.; Fedoruk, L. Shifting from net-zero to net-positive energy buildings. Build. Res. Inf. 2014, 43, 111–120. [Google Scholar] [CrossRef]
  45. Miller, W.; Buys, L. Anatomy of a sub-tropical Positive Energy Home (PEH). Sol. Energy 2012, 86, 231–241. [Google Scholar] [CrossRef] [Green Version]
  46. Kolokotsa, D.; Rovas, D.; Kosmatopoulos, E.; Kalaitzakis, K. A roadmap towards intelligent net zero- and positive-energy buildings. Sol. Energy 2011, 85, 3067–3084. [Google Scholar] [CrossRef]
  47. Harkouss, F.; Fardoun, F.; Biwole, P.H. Optimization approaches and climates investigations in NZEB—A review. Build. Simul. 2018, 11, 923–952. [Google Scholar] [CrossRef]
  48. ILFI. EchoHaven House. Available online: https://living-future.org/lbc/case-studies/echohaven-house/ (accessed on 1 August 2021).
  49. ILFI. Hadera Alfa Kindergarten. Available online: https://living-future.org/lbc/case-studies/lakeline-learning-center-2/ (accessed on 1 August 2021).
  50. ILFI. Zero Energy House-Auckland, New Zealand. Available online: https://living-future.org/lbc/case-studies/zero-energy-house/ (accessed on 1 August 2021).
  51. ILFI. Lincoln Net Positive Farmhouse. Available online: https://living-future.org/lbc/case-studies/lincoln-net-positive-farmhouse/ (accessed on 1 August 2021).
  52. ILFI. Zero Energy Lombardo Welcome Center. Available online: https://living-future.org/lbc/case-studies/zero-energy-lombardo-welcome-center/ (accessed on 1 August 2021).
  53. ILFI. School of Design and Environment 4. Available online: https://living-future.org/lbc/case-studies/school-of-design-and-environment-4/ (accessed on 1 August 2021).
  54. Zomer, C.; Custódio, I.; Goulart, S.; Mantelli, S.; Martins, G.; Campos, R.; Pinto, G.; Rüther, R. Energy balance and performance assessment of PV systems installed at a positive-energy building (PEB) solar energy research centre. Sol. Energy 2020, 212, 258–274. [Google Scholar] [CrossRef]
  55. Rodriguez-Ubinas, E.; Montero, C.; Porteros, M.; Vega, S.; Navarro, I.; Castillo-Cagigal, M.; Matallanas, E.; Gutiérrez, A. Passive design strategies and performance of Net Energy Plus Houses. Energy Build. 2014, 83, 10–22. [Google Scholar] [CrossRef] [Green Version]
  56. Aronova, E.; Vatin, N.; Murgul, V. Design Energy-Plus-House for the Climatic Conditions of Macedonia. Procedia Eng. 2015, 117, 766–774. [Google Scholar] [CrossRef] [Green Version]
  57. Lydon, G.P.; Hofer, J.; Svetozarevic, B.; Nagy, Z.; Schlueter, A. Coupling energy systems with lightweight structures for a net plus energy building. Appl. Energy 2017, 189, 310–326. [Google Scholar] [CrossRef]
  58. Erhorn, H.; Erhorn-Kluttig, H.; Reiß, J. Plus Energy Schools in Germany—Pilot Projects and Key Technologies. Energy Procedia 2015, 78, 3336–3341. [Google Scholar] [CrossRef]
  59. Santamouris, M.; Kolokotsa, D. Passive cooling dissipation techniques for buildings and other structures: The state of the art. Energy Build. 2013, 57, 74–94. [Google Scholar] [CrossRef]
  60. Carrilho da Graça, G.; Linden, P. Ten questions about natural ventilation of non-domestic buildings. Build. Environ. 2016, 107, 263–273. [Google Scholar] [CrossRef] [Green Version]
  61. Lomas, K.J.; Ji, Y. Resilience of naturally ventilated buildings to climate change: Advanced natural ventilation and hospital wards. Energy Build. 2009, 41, 629–653. [Google Scholar] [CrossRef] [Green Version]
  62. Breesch, H.; Bossaer, A.; Janssens, A. Passive cooling in a low-energy office building. Sol. Energy 2005, 79, 682–696. [Google Scholar] [CrossRef]
  63. Pagliano, L.; Carlucci, S.; Causone, F.; Moazami, A.; Cattarin, G. Energy retrofit for a climate resilient child care centre. Energy Build. 2016, 127, 1117–1132. [Google Scholar] [CrossRef]
  64. O’Sullivan, P.D.; Kolokotroni, M. A field study of wind dominant single sided ventilation through a narrow slotted architectural louvre system. Energy Build. 2017, 138, 733–747. [Google Scholar] [CrossRef]
  65. Schulze, T.; Gürlich, D.; Eicker, U. Performance assessment of controlled natural ventilation for air quality control and passive cooling in existing and new office type buildings. Energy Build. 2018, 172, 265–278. [Google Scholar] [CrossRef]
  66. O’ Donovan, A.; Murphy, M.D.; O’Sullivan, P.D. Passive control strategies for cooling a non-residential nearly zero energy office: Simulated comfort resilience now and in the future. Energy Build. 2021, 231, 110607. [Google Scholar] [CrossRef]
  67. Sartori, I.; Napolitano, A.; Voss, S. ; Napolitano, A.; Voss, S. Net zero energy buildings: A consistent definition framework. Energy Build 2012, 48, 220–232. [Google Scholar] [CrossRef] [Green Version]
  68. Mokhtara, C.; Negrou, B.; Settou, N.; Gouareh, A.; Settou, B. Pathways to plus-energy buildings in Algeria: Design optimization method based on GIS and multi-criteria decision-making. Energy Procedia 2019, 162, 9. [Google Scholar] [CrossRef]
  69. Javed, S.; Ørnes, I.R.; Myrup, M.; Dokka, T.H. Design optimization of the borehole system for a plus-Energy kindergarten in Oslo, Norway. Archit. Eng. Des. Manag. 2018, 15, 181–195. [Google Scholar] [CrossRef] [Green Version]
  70. Dinkel, A.; Engelmann, P.; Köhler, B.; Hussain, M. Energy Efficient Builidings as Central Part of Integrated Resource Management in Asian Cities: The Urban Nexus II; 271810 PN: 15.2201.0–001.00; Frauhofer institute for energy systems ISE: Freiburg, Germany, 2017. [Google Scholar]
  71. Zomer, C.; Custódio, I.; Antoniolli, A.; Rüther, R. Performance assessment of partially shaded building-integrated photovoltaic (BIPV) systems in a positive-energy solar energy laboratory building: Architecture perspectives. Sol. Energy 2020, 211, 879–896. [Google Scholar] [CrossRef]
  72. Cao, S.; Klein, K.; Herkel, S.; Sirén, K. Approaches to enhance the energy performance of a zero-energy building integrated with a commercial-scale hydrogen fueled zero-energy vehicle under Finnish and German conditions. Energy Convers. Manag. 2017, 142, 153–175. [Google Scholar] [CrossRef]
  73. Cao, S. Comparison of the energy and environmental impact by integrating a H2 vehicle and an electric vehicle into a zero-energy building. Energy Convers. Manag. 2016, 123, 153–173. [Google Scholar] [CrossRef]
  74. Dumont, O.; Carmo, C.; Fontaine, V.; Randaxhe, F.; Quoilin, S.; Lemort, V.; Elmegaard, B.; Nielsen, M.P. Performance of a reversible heat pump/organic Rankine cycle unit coupled with a passive house to get a positive energy building. J. Build. Perform. Simul. 2016, 11, 19–35. [Google Scholar] [CrossRef]
  75. Tsoutsos, T.; Aloumpi, E.; Gkouskos, Z.; Karagiorgas, M. Design of a solar absorption cooling system in a Greek hospital. Energy Build. 2010, 42, 265–272. [Google Scholar] [CrossRef]
  76. Pulselli, R.M.; Simoncini, E.; Pulselli, F.M.; Bastianoni, S. Emergy analysis of building manufacturing, maintenance and use: Em-building indices to evaluate housing sustainability. Energy Build. 2007, 39, 620–628. [Google Scholar] [CrossRef]
  77. Pulselli, R.M.; Simoncini, E.; Marchettini, N. Energy and emergy based cost–benefit evaluation of building envelopes relative to geographical location and climate. Build. Environ. 2009, 44, 920–928. [Google Scholar] [CrossRef]
  78. Cao, S.; Hasan, A.; Sirén, K. On-site energy matching indices for buildings with energy conversion, storage and hybrid grid connections. Energy Build. 2013, 64, 423–438. [Google Scholar] [CrossRef]
  79. Dávi, G.A.; Caamaño-Martín, E.; Rüther, R.; Solano, J. Energy performance evaluation of a net plus-energy residential building with grid-connected photovoltaic system in Brazil. Energy Build. 2016, 120, 19–29. [Google Scholar] [CrossRef] [Green Version]
  80. Salom, J.; Marszal, A.J.; Widén, J.; Candanedo, J.; Lindberg, K.B. Analysis of load match and grid interaction indicators in net zero energy buildings with simulated and monitored data. Appl. Energy 2014, 136, 119–131. [Google Scholar] [CrossRef]
  81. Burrows, V.K.; Adams, M. Advancing Net Zero—Status Report 2019; WorldGBC: London, UK, 2019. [Google Scholar]
  82. Passer, A.; Ouellet-Plamondon, C.; Kenneally, P.; John, V.; Habert, G. The impact of future scenarios on building refurbishment strategies towards plus energy buildings. Energy Build. 2016, 124, 153–163. [Google Scholar] [CrossRef]
  83. Dumont, O.; Carmo, C.; Georges, E.; Quoilin, S.; Lemort, V. Economic assessment of electric energy storage for load shifting in positive energy building. Int. J. Energy Environ. Eng. 2016, 8, 25–35. [Google Scholar] [CrossRef] [Green Version]
  84. Zhou, Y.; Cao, S. Coordinated multi-criteria framework for cycling aging-based battery storage management strategies for positive building–vehicle system with renewable depreciation: Life-cycle based techno-economic feasibility study. Energy Convers. Manag. 2020, 226, 113473. [Google Scholar] [CrossRef]
  85. Rau, C. Supporting carbon neutrality in urban environments using positive energy buildings. Int. J. Sustain. Dev. Plan. 2017, 12, 580–588. [Google Scholar] [CrossRef]
  86. Attia, S. Towards regenerative and positive impact architecture: A comparison of two net zero energy buildings. Sustain. Cities Soc. 2016, 26, 393–406. [Google Scholar] [CrossRef] [Green Version]
  87. NREL. Declining Renewable Costs Drive Focus on Energy Storage. Available online: https://www.nrel.gov/news/features/2020/declining-renewable-costs-drive-focus-on-energy-storage.html (accessed on 1 August 2021).
  88. IRENA. Electricity Storage and Renewables: Costs and Markets to 2030; International Renewable Energy Agency: Abu Dhabi, United Arab Emirates, 2017. [Google Scholar]
  89. IEA. Tracking Energy Integration; International Energy Agency: Paris, France, 2019. [Google Scholar]
  90. Lu, Y.; Wang, S.; Shan, K. Design optimization and optimal control of grid-connected and standalone nearly/net zero energy buildings. Appl. Energy 2015, 155, 463–477. [Google Scholar] [CrossRef]
  91. Stenzel, P.; Linssen, J. Concept and potential of pumped hydro storage in federal waterways. Appl. Energy 2016, 162, 486–493. [Google Scholar] [CrossRef]
  92. Ferreira, H.L.; Garde, R.; Fulli, G.; Kling, W.; Lopes, J.P. Characterisation of electrical energy storage technologies. Energy 2013, 53, 288–298. [Google Scholar] [CrossRef] [Green Version]
  93. Stritih, U.; Tyagi, V.V.; Stropnik, R.; Paksoy, H.; Haghighat, F.; Joybari, M.M. Integration of passive PCM technologies for net-zero energy buildings. Sustain. Cities Soc. 2018, 41, 286–295. [Google Scholar] [CrossRef]
  94. Kazanci, O.B.; Skrupskelis, M.; Sevela, P.; Pavlov, G.K.; Olesen, B.W. Sustainable heating, cooling and ventilation of a plus-energy house via photovoltaic/thermal panels. Energy Build. 2014, 83, 122–129. [Google Scholar] [CrossRef]
  95. Caro-Ruiz, C.; Lombardi, P.; Richter, M.; Pelzer, A.; Komarnicki, P.; Pavas, A.; Mojica-Nava, E. Coordination of optimal sizing of energy storage systems and production buffer stocks in a net zero energy factory. Appl. Energy 2019, 238, 851–862. [Google Scholar] [CrossRef]
  96. Abdullah, G.F.; Saman, W.; Whaley, D.; Belusko, M. Life cycle Cost of Standalone Solar Photovoltaic System Powering Evaporative Cooler and Heat Pump Water Heater for Australian Remote Homes. Energy Procedia 2016, 91, 681–691. [Google Scholar] [CrossRef] [Green Version]
  97. Shukla, A.K.; Sudhakar, K.; Baredar, P. Design, simulation and economic analysis of standalone roof top solar PV system in India. Sol. Energy 2016, 136, 437–449. [Google Scholar] [CrossRef]
  98. Zhao, P.; Xu, W.; Zhang, S.; Wang, J.; Dai, Y. Technical feasibility assessment of a standalone photovoltaic/wind/adiabatic compressed air energy storage based hybrid energy supply system for rural mobile base station. Energy Convers. Manag. 2020, 206, 112486. [Google Scholar] [CrossRef]
  99. Mehrjerdi, H.; Iqbal, A.; Rakhshani, E.; Torres, J.R. Daily-seasonal operation in net-zero energy building powered by hybrid renewable energies and hydrogen storage systems. Energy Convers. Manag. 2019, 201, 112156. [Google Scholar] [CrossRef]
  100. Mohamed, A.; Hasan, A.; Sirén, K. Fulfillment of net-zero energy building (NZEB) with four metrics in a single family house with different heating alternatives. Appl. Energy 2014, 114, 385–399. [Google Scholar] [CrossRef]
  101. Zhou, Y.; Cao, S.; Hensen, J.L.M.; Lund, P.D. Energy integration and interaction between buildings and vehicles: A state-of-the-art review. Renew. Sustain. Energy Rev. 2019, 114, 109337. [Google Scholar] [CrossRef]
  102. Alirezaei, M.; Noori, M.; Tatari, O. Getting to net zero energy building: Investigating the role of vehicle to home technology. Energy Build. 2016, 130, 465–476. [Google Scholar] [CrossRef]
  103. Perfetto, G.M.; Lamacchia, F.P. Zero Energy Hotels and Sustainable Mobility in the Islands of Aegean Sea (Greece). Int. J. Clean Coal Energy 2016, 5, 23–36. [Google Scholar] [CrossRef] [Green Version]
  104. Erhorn-Kluttig, H.; Erhorn, H.; Reiß, J. Plus energy—A new energy performance standard in Germany for both residential and non-residential buildings. Adv. Build. Energy Res. 2014, 9, 73–88. [Google Scholar] [CrossRef]
  105. Cao, S.; Hasan, A.; Sirén, K. Matching analysis for on-site hybrid renewable energy systems of office buildings with extended indices. Appl. Energy 2014, 113, 230–247. [Google Scholar] [CrossRef]
  106. Iqbal, M.I.; Himmler, R.; Gheewala, S.H. Potential life cycle energy savings through a transition from typical to energy plus households: A case study from Thailand. Energy Build. 2017, 134, 295–305. [Google Scholar] [CrossRef]
  107. Tumminia, G.; Guarino, F.; Longo, S.; Aloisio, D.; Cellura, S.; Sergi, F.; Brunaccini, G.; Antonucci, V.; Ferraro, M. Grid interaction and environmental impact of a net zero energy building. Energy Convers. Manag. 2020, 203, 112228. [Google Scholar] [CrossRef]
  108. Romero Rodríguez, L.; Sánchez Ramos, J.; Álvarez Domínguez, S.; Eicker, U. Contributions of heat pumps to demand response: A case study of a plus-energy dwelling. Appl. Energy 2018, 214, 191–204. [Google Scholar] [CrossRef] [Green Version]
  109. Couty, P.; Lalou, M.J.; Cotture, S.; Saade, V. Positive Energy Building with PV Facade Production and Electrical Storage Designed by a Swiss Team for the U.S Department of Energy Solar Decathlon 2017. Energy Procedia 2017, 122, 916–924. [Google Scholar] [CrossRef]
  110. Shaterabadi, M.; Jirdehi, M.A.; Amiri, N.; Omidi, S. Enhancement the economical and environmental aspects of plus-zero energy buildings integrated with INVELOX turbines. Renew. Energy 2020, 153, 1355–1367. [Google Scholar] [CrossRef]
  111. Gubbi, J.; Buyya, R.; Marusic, S.; Palaniswami, M. Internet of Things (IoT): A vision, architectural elements, and future directions. Future Gener. Comput. Syst. 2013, 29, 1645–1660. [Google Scholar] [CrossRef] [Green Version]
  112. Casini, M. A positive energy building for the Middle East climate: ReStart4Smart Solar House at Solar Decathlon Middle East 2018. Renew. Energy 2020, 159, 1269–1296. [Google Scholar] [CrossRef]
  113. Hong, S.H.; Yu, M.; Huang, X. A real-time demand response algorithm for heterogeneous devices in buildings and homes. Energy 2015, 80, 123–132. [Google Scholar] [CrossRef]
  114. Xue, X.; Wang, S.; Yan, C.; Cui, B. A fast chiller power demand response control strategy for buildings connected to smart grid. Appl. Energy 2015, 137, 77–87. [Google Scholar] [CrossRef]
  115. Lee, D.; Cheng, C.-C. Energy savings by energy management systems: A review. Renew. Sustain. Energy Rev. 2016, 56, 760–777. [Google Scholar] [CrossRef]
  116. Beucker, S.; Bergesen, J.D.; Gibon, T. Building Energy Management Systems: Global Potentials and Environmental Implications of Deployment. J. Ind. Ecol. 2016, 20, 223–233. [Google Scholar] [CrossRef]
  117. Dar, U.I.; Sartori, I.; Georges, L.; Novakovic, V. Advanced control of heat pumps for improved flexibility of Net-ZEB towards the grid. Energy Build. 2014, 69, 74–84. [Google Scholar] [CrossRef]
  118. Jensen, S.Ø.; Marszal-Pomianowska, A.; Lollini, R.; Pasut, W.; Knotzer, A.; Engelmann, P.; Stafford, A.; Reynders, G. IEA EBC Annex 67 Energy Flexible Buildings. Energy Build. 2017, 155, 25–34. [Google Scholar] [CrossRef] [Green Version]
  119. Zhou, Y.; Cao, S. Quantification of energy flexibility of residential net-zero-energy buildings involved with dynamic operations of hybrid energy storages and diversified energy conversion strategies. Sustain. Energy Grids Netw. 2020, 21, 100304. [Google Scholar] [CrossRef]
  120. Zade, M.; You, Z.; Kumaran Nalini, B.; Tzscheutschler, P.; Wagner, U. Quantifying the Flexibility of Electric Vehicles in Germany and California—A Case Study. Energies 2020, 13, 5617. [Google Scholar] [CrossRef]
  121. Zhou, Y.; Cao, S. Investigation of the flexibility of a residential net-zero energy building (NZEB) integrated with an electric vehicle in Hong Kong. Energy Procedia 2019, 158, 2567–2579. [Google Scholar] [CrossRef]
  122. Afram, A.; Janabi-Sharifi, F. Theory and applications of HVAC control systems—A review of model predictive control (MPC). Build. Environ. 2014, 72, 343–355. [Google Scholar] [CrossRef]
  123. Kazanci, O.B.; Olesen, B.W. Sustainable Plus-Energy Houses—Final Report; Technical University of Denmark: Lyngby, Denmark, 2014. [Google Scholar]
  124. Krick, T.; Forstater, M.; Monaghan, P.; Sillanpää, M. The Stakeholder Engagement Manual; United Nations Environment Programme: Paris, France, 2005. [Google Scholar]
  125. Yan, D.; O’Brien, W.; Hong, T.; Feng, X.; Burak Gunay, H.; Tahmasebi, F.; Mahdavi, A. Occupant behavior modeling for building performance simulation: Current state and future challenges. Energy Build. 2015, 107, 264–278. [Google Scholar] [CrossRef] [Green Version]
  126. De Wilde, P. The gap between predicted and measured energy performance of buildings: A framework for investigation. Autom. Constr. 2014, 41, 40–49. [Google Scholar] [CrossRef]
  127. Attia, S.; Eleftheriou, P.; Xeni, F.; Morlot, R.; Ménézo, C.; Kostopoulos, V.; Betsi, M.; Kalaitzoglou, I.; Pagliano, L.; Cellura, M.; et al. Overview and future challenges of nearly zero energy buildings (nZEB) design in Southern Europe. Energy Build. 2017, 155, 439–458. [Google Scholar] [CrossRef]
  128. Li, H.X.; Patel, D.; Al-Hussein, M.; Yu, H.; Gül, M. Stakeholder studies and the social networks of NetZero energy homes (NZEHs). Sustain. Cities Soc. 2018, 38, 9–17. [Google Scholar] [CrossRef]
  129. Alberg Mosgaard, M.; Kerndrup, S.; Riisgaard, H. Stakeholder constellations in energy renovation of a Danish Hotel. J. Clean. Prod. 2016, 135, 836–846. [Google Scholar] [CrossRef]
  130. Magrini, A.; Lentini, G.; Cuman, S.; Bodrato, A.; Marenco, L. From Nearly Zero Energy Buildings (NZEB) to Positive Energy Buildings (PEB): The next challenge—The most recent European trends with some notes on the energy analysis of a forerunner PEB example. Dev. Built Environ. 2020, 3, 100019. [Google Scholar] [CrossRef]
  131. Lollini, R.; Bailo, M. How to Support the Design of Plus Energy Buildings: Survey Results. Available online: https://www.cultural-e.eu/design-pebs-survey-results/ (accessed on 23 February 2021).
  132. Wang, Z.; Srinivasan, R.S. A review of artificial intelligence based building energy use prediction: Contrasting the capabilities of single and ensemble prediction models. Renew. Sustain. Energy Rev. 2017, 75, 796–808. [Google Scholar] [CrossRef]
  133. Bordass, B.; Cohen, R.; Standeven, M.; Leaman, A. Assessing building performance in use 3: Energy performance of the Probe buildings. Build. Res. Inf. 2010, 29, 114–128. [Google Scholar] [CrossRef]
  134. Newsham, G.R.; Mancini, S.; Birt, B.J. Do LEED-certified buildings save energy? Yes, but…. Energy Build. 2009, 41, 897–905. [Google Scholar] [CrossRef]
  135. Korjenic, A.; Bednar, T. Validation and evaluation of total energy use in office buildings: A case study. Autom. Constr. 2012, 23, 64–70. [Google Scholar] [CrossRef]
  136. Clarke, J.; Littlewood, J.; Wilgeroth, P.; Jones, P. Rethinking the Building Envelope: Building Integrated Energy Positive Solutions. In Eco-Architecture VII: Harmonisation between Architecture and Nature; WIT Press: Bilbao, Spain, 2018; pp. 151–161. [Google Scholar]
  137. Hong, T.; D’Oca, S.; Turner, W.J.N.; Taylor-Lange, S.C. An ontology to represent energy-related occupant behavior in buildings. Part I: Introduction to the DNAs framework. Build. Environ. 2015, 92, 764–777. [Google Scholar] [CrossRef] [Green Version]
  138. Niu, S.; Pan, W.; Zhao, Y. A virtual reality integrated design approach to improving occupancy information integrity for closing the building energy performance gap. Sustain. Cities Soc. 2016, 27, 275–286. [Google Scholar] [CrossRef]
  139. Dabaieh, M.; Johansson, E. Building Performance and Post Occupancy Evaluation for an off-grid low carbon and solar PV plus-energy powered building. A case from the Western Desert in Egypt. J. Build. Eng. 2018, 18, 418–428. [Google Scholar] [CrossRef]
  140. McLeod, R.S.; Hopfe, C.J.; Kwan, A. An investigation into future performance and overheating risks in Passivhaus dwellings. Build. Environ. 2013, 70, 189–209. [Google Scholar] [CrossRef] [Green Version]
  141. Tabatabaei Sameni, S.M.; Gaterell, M.; Montazami, A.; Ahmed, A. Overheating investigation in UK social housing flats built to the Passivhaus standard. Build. Environ. 2015, 92, 222–235. [Google Scholar] [CrossRef] [Green Version]
  142. Pagliano, L.; Zangheri, P. Comfort models and cooling of buildings in the Mediterranean zone. Adv. Build. Energy Res. 2010, 4, 167–200. [Google Scholar] [CrossRef]
  143. Tazase, K.; Kawashima, N.; Sato, K. Practice of net Positive Energy House in the Suburb of Tokyo. Energy Procedia 2017, 143, 112–118. [Google Scholar]
  144. Stutterecker, W.; Blümel, E. Energy plus standard in buildings constructed by housing associations? Energy 2012, 48, 56–65. [Google Scholar] [CrossRef]
  145. Kosonen, A.; Keskisaari, A. Zero-energy log house—Future concept for an energy efficient building in the Nordic conditions. Energy Build. 2020, 228, 110449. [Google Scholar] [CrossRef]
  146. Kılkış, Ş. Exergy transition planning for net-zero districts. Energy 2015, 92, 515–531. [Google Scholar] [CrossRef]
  147. Mirakyan, A.; De Guio, R. Integrated energy planning in cities and territories: A review of methods and tools. Renew. Sustain. Energy Rev. 2013, 22, 289–297. [Google Scholar] [CrossRef]
  148. Sperling, K.; Hvelplund, F.; Mathiesen, B.V. Centralisation and decentralisation in strategic municipal energy planning in Denmark. Energy Policy 2011, 39, 1338–1351. [Google Scholar] [CrossRef]
  149. Karunathilake, H.; Hewage, K.; Mérida, W.; Sadiq, R. Renewable energy selection for net-zero energy communities: Life cycle based decision making under uncertainty. Renew. Energy 2019, 130, 558–573. [Google Scholar] [CrossRef]
  150. Kılkış, Ş. Energy system analysis of a pilot net-zero exergy district. Energy Convers. Manag. 2014, 87, 1077–1092. [Google Scholar] [CrossRef]
  151. Ahlers, D.; Driscoll, P.; Wibe, H.; Wyckmans, A. Co-Creation of Positive Energy Blocks. IOP Conf. Ser. Earth Environ. Sci. 2019, 352, 012060. [Google Scholar] [CrossRef]
  152. Rafique, M.M.; Rehman, S.; Alhems, L.M. Developing zero energy and sustainable villages—A case study for communities of the future. Renew. Energy 2018, 127, 565–574. [Google Scholar] [CrossRef]
  153. Ma, T.; Yang, H.; Lu, L.; Peng, J. Technical feasibility study on a standalone hybrid solar-wind system with pumped hydro storage for a remote island in Hong Kong. Renew. Energy 2014, 69, 7–15. [Google Scholar] [CrossRef]
  154. Kallushi, A.; Harris, J.; Miller, J.; Johnston, M.; Ream, A. Think Bigger: Net-Zero Communities. ACEEE Summer Study Energy Effic. Build. 2012, 11, 115–127. [Google Scholar]
  155. Kim, M.-H.; Kim, D.; Heo, J.; Lee, D.-W. Energy performance investigation of net plus energy town: Energy balance of the Jincheon Eco-Friendly energy town. Renew. Energy 2020, 147, 1784–1800. [Google Scholar] [CrossRef]
  156. Wheeler, S.M.; Segar, R.B. Zero Energy Communities: UC Davis’ West Village Community. In Energy Efficiency, Towards the End of Demand Growth; American Council for an Energy Efficienct Economy (ACEEE): Washington, DC, USA, 2013; pp. 305–324. [Google Scholar]
  157. Kim, M.-H.; Kim, D.; Heo, J.; Lee, D.-W. Techno-economic analysis of hybrid renewable energy system with solar district heating for net zero energy community. Energy 2019, 187, 115916. [Google Scholar] [CrossRef]
  158. NEFM. Feldheim Energy Community. Available online: https://nef-feldheim.info/the-energy-self-sufficient-village/?lang=en (accessed on 1 August 2021).
  159. Mundaca, L.; Busch, H.; Schwer, S. ‘Successful’ low-carbon energy transitions at the community level? An energy justice perspective. Appl. Energy 2018, 218, 292–303. [Google Scholar] [CrossRef]
  160. Spear, S. Samso: World’s First 100% Renewable Energy-Powered Island Is a Beacon for Sustainable Communities. Available online: https://www.ecowatch.com/samso-worlds-first-100-renewable-energy-powered-island-is-a-beacon-for-1881905310.html (accessed on 2 August 2021).
  161. Weissbach, U. The Solar Nation of Tokelau: An adventure in documentary making. Pac. J. Rev. 2017, 23, 55–64. [Google Scholar] [CrossRef] [Green Version]
  162. Huang, P.; Lovati, M.; Zhang, X.; Bales, C.; Hallbeck, S.; Becker, A.; Bergqvist, H.; Hedberg, J.; Maturi, L. Transforming a residential building cluster into electricity prosumers in Sweden: Optimal design of a coupled PV-heat pump-thermal storage-electric vehicle system. Appl. Energy 2019, 255, 113864. [Google Scholar] [CrossRef]
  163. Lopes, R.A.; Martins, J.; Aelenei, D.; Lima, C.P. A cooperative net zero energy community to improve load matching. Renew. Energy 2016, 93, 1–13. [Google Scholar] [CrossRef]
  164. Kılkış, B.; Kılkış, Ş. Hydrogen Economy Model for Nearly Net-Zero Cities with Exergy Rationale and Energy-Water Nexus. Energies 2018, 11, 1226. [Google Scholar] [CrossRef] [Green Version]
  165. IDEA. Intelligent Neighbourhood Energy Allocation & Supervision; Teesside University: Tees Valley, UK, 2017. [Google Scholar]
  166. Ala-Juusela, M.; Antila, A.; Brassier, P.; Bäckström, K.; Crosbie, T.; Dawood, M.; Gras, D.; Rouhiainen, J. D3.1 Case Study Scoping; Teesside University: Tees Valley, UK, 2014. [Google Scholar]
  167. Ala-Juusela, M.; Crosbie, T.; Hukkalainen, M. Defining and operationalising the concept of an energy positive neighbourhood. Energy Convers. Manag. 2016, 125, 133–140. [Google Scholar] [CrossRef] [Green Version]
  168. Robledo, C.B.; Oldenbroek, V.; Abbruzzese, F.; van Wijk, A.J.M. Integrating a hydrogen fuel cell electric vehicle with vehicle-to-grid technology, photovoltaic power and a residential building. Appl. Energy 2018, 215, 615–629. [Google Scholar] [CrossRef]
  169. GridFlex. GridFlex Heeten. Available online: https://gridflex.nl/over-gridflex/ (accessed on 1 August 2021).
  170. Jurasz, J.K.; Dąbek, P.B.; Campana, P.E. Can a city reach energy self-sufficiency by means of rooftop photovoltaics? Case study from Poland. J. Clean. Prod. 2020, 245, 118813. [Google Scholar] [CrossRef]
  171. O’Reagan, M. Solar and Battery Microgrid Project to Return Tokelau to 100% Renewables. Available online: https://onestepoffthegrid.com.au/solar-and-battery-microgrid-project-to-return-tokelau-to-100-renewables/ (accessed on 1 August 2021).
  172. AEE. +Ers—Plus Energy Network Reininghaus SÜD. Available online: https://w.aee-intec.at/ers-plus-energy-network-reininghaus-sud-p141 (accessed on 4 March 2021).
  173. Bowen, A. Feldheim: Germany’s Renewable Village. Available online: https://www.dw.com/en/feldheim-germanys-renewable-village/a-18466800 (accessed on 5 March 2021).
  174. Hachem-Vermette, C.; Guarino, F.; Rocca, V.L.; Cellura, M. Towards achieving net-zero energy communities: Investigation of design strategies and seasonal solar collection and storage net-zero. Sol. Energy 2019, 192, 169–185. [Google Scholar] [CrossRef]
  175. Sonnen. What Is the Sonnen Community? Available online: https://sonnengroup.com/sonnencommunity/ (accessed on 4 March 2021).
  176. IERC. Launch of Ierc Storenet Project: Dingle Communities to Test New Energy Storage Batteries in Their Connected Homes. Available online: http://www.ierc.ie/news/launch-ierc-storenet-project/ (accessed on 4 March 2021).
  177. ARENA. Simply Energy Virtual Power Plant (VPP). Available online: https://arena.gov.au/projects/simply-energy-virtual-power-plant-vpp/ (accessed on 4 March 2021).
  178. Castenson, J. Virtual Power Plants And The Future Ubiquity Of Energy Creation. Available online: https://www.forbes.com/sites/jennifercastenson/2020/11/24/virtual-power-plants-and-the-future-ubiquity-of-energy-creation/?sh=41a662361107 (accessed on 3 March 2021).
  179. Tesla. The Tesla Energy Plan—Designed for Homes with Solar and Powerwall. Available online: https://www.tesla.com/en_gb/tesla-energy-plan (accessed on 2 March 2021).
  180. Mayr, F. Clouds, Communities and Virtual Batteries: A Look Behind the Curtain. Available online: https://www.apricum-group.com/clouds-communities-and-virtual-batteries-a-look-behind-the-curtain/ (accessed on 7 March 2021).
  181. Zia, M.F.; Elbouchikhi, E.; Benbouzid, M. Microgrids energy management systems: A critical review on methods, solutions, and prospects. Appl. Energy 2018, 222, 1033–1055. [Google Scholar] [CrossRef]
  182. Sokolnikova, P.; Lombardi, P.; Arendarski, B.; Suslov, K.; Pantaleo, A.M.; Kranhold, M.; Komarnicki, P. Net-zero multi-energy systems for Siberian rural communities: A methodology to size thermal and electric storage units. Renew. Energy 2020, 155, 979–989. [Google Scholar] [CrossRef]
  183. Jafari-Marandi, R.; Hu, M.; Omitaomu, O.A. A distributed decision framework for building clusters with different heterogeneity settings. Appl. Energy 2016, 165, 393–404. [Google Scholar] [CrossRef]
  184. Odonkor, P.; Lewis, K. Adaptive Operation Decisions in Net Zero Building Clusters. In Proceedings of the Volume 2A: 41st Design Automation Conference, Boston, MA, USA, 2 August 2015; The American Society of Mechanical Engineers (ASME): Boston, MA, USA, 2015. [Google Scholar]
  185. Huang, P.; Sun, Y. A robust control of nZEBs for performance optimization at cluster level under demand prediction uncertainty. Renew. Energy 2019, 134, 215–227. [Google Scholar] [CrossRef]
  186. Huang, P.; Wu, H.; Huang, G.; Sun, Y. A top-down control method of nZEBs for performance optimization at nZEB-cluster-level. Energy 2018, 159, 891–904. [Google Scholar] [CrossRef]
  187. Gao, D.-c.; Sun, Y. A GA-based coordinated demand response control for building group level peak demand limiting with benefits to grid power balance. Energy Build. 2016, 110, 31–40. [Google Scholar] [CrossRef]
  188. Liu, J.; Chen, X.; Yang, H.; Shan, K. Hybrid renewable energy applications in zero-energy buildings and communities integrating battery and hydrogen vehicle storage. Appl. Energy 2021, 290, 116733. [Google Scholar] [CrossRef]
  189. Cao, S. The impact of electric vehicles and mobile boundary expansions on the realization of zero-emission office buildings. Appl. Energy 2019, 251, 113347. [Google Scholar] [CrossRef]
  190. Solarray. Sonnen Smart Energy Management. Available online: https://solaray.com.au/sonnen-smart-energy-management/ (accessed on 10 March 2021).
  191. IEA. EVI Global EV Pilot City Programme. Available online: https://www.iea.org/areas-of-work/programmes-and-partnerships/evi-global-ev-pilot-city-programme (accessed on 3 March 2021).
  192. Walker, S.; Labeodan, T.; Maassen, W.; Zeiler, W. A review study of the current research on energy hub for energy positive neighborhoods. Energy Procedia 2017, 122, 727–732. [Google Scholar] [CrossRef]
  193. Zhou, Y.; Cao, S.; Hensen, J.L.M. An energy paradigm transition framework from negative towards positive district energy sharing networks—Battery cycling aging, advanced battery management strategies, flexible vehicles-to-buildings interactions, uncertainty and sensitivity analysis. Appl. Energy 2021, 288, 116606. [Google Scholar] [CrossRef]
  194. Ahlberg, I. Towards an ICT Infrastructure for Energy Positive Neighbourhoods; Report from ELSA Thematic Working Group on ICT for energy efficiency, European commission: Brussels, Belgium, 2009. [Google Scholar]
  195. Amaral, A.R.; Rodrigues, E.; Rodrigues Gaspar, A.; Gomes, Á. Review on performance aspects of nearly zero-energy districts. Sustain. Cities Soc. 2018, 43, 406–420. [Google Scholar] [CrossRef]
  196. Mittala, A.; Krejcib, C.C.; Dorneicha, M.C.; Fickesc, D. An agent-based approach to modeling zero energy communities. Sol. Energy 2019, 191, 193–204. [Google Scholar] [CrossRef]
  197. Mohareb, E.A.; Kennedy, C.A. Scenarios of technology adoption towards low-carbon cities. Energy Policy 2014, 66, 685–693. [Google Scholar] [CrossRef]
  198. Sonnen. It’s Time to Declare Your Independence—Sonnenbatterie. Available online: https://sonnengroup.com/sonnenbatterie/ (accessed on 10 March 2021).
  199. Tenk, F. Community Wind in North Rhine-Westphalia; World Wind Energy Association (WWEA): Bonn, Germany, 2018. [Google Scholar]
  200. Good, N.; Martínez Ceseña, E.A.; Mancarella, P. Barriers, Challenges, and Recommendations Related to Development of Energy Positive Neighborhoods and Smart Energy Districts; Energy Positive Neighborhoods and Smart Energy Districts; Academic Press: Boston, MA, USA, 2017. [Google Scholar]
  201. Bae, M.; Kim, H.; Kim, E.; Chung, A.Y.; Kim, H.; Roh, J.H. Toward electricity retail competition: Survey and case study on technical infrastructure for advanced electricity market system. Appl. Energy 2014, 133, 252–273. [Google Scholar] [CrossRef]
  202. IRENA. Community Energy: Broadening the Ownership of Renewables; International Renewable Energy Agency (IRENA): Abu Dhabi, United Arab Emirates, 2018. [Google Scholar]
  203. REN21. Renewable Energy Tenders And Community [Em]Power[Ment]—Latin America And Caribbean; Renewable Energy Policy Network for the 21st Century: Paris, France, 2017. [Google Scholar]
  204. Belussi, L.; Barozzi, B.; Bellazzi, A.; Danza, L.; Devitofrancesco, A.; Fanciulli, C.; Ghellere, M.; Guazzi, G.; Meroni, I.; Salamone, F.; et al. A review of performance of zero energy buildings and energy efficiency solutions. J. Build. Eng. 2019, 25, 100772. [Google Scholar] [CrossRef]
  205. ZED. Hollis Montessori School. Available online: https://zeroenergy.com/hollis-montessori (accessed on 3 August 2021).
  206. ZED. Passive House Retreat—New England. Available online: https://zeroenergy.com/passive-house-retreat (accessed on 3 August 2021).
  207. Panagiotidou, M.; Fuller, R.J. Progress in ZEBs—A review of definitions, policies and construction activity. Energy Policy 2013, 62, 196–206. [Google Scholar] [CrossRef]
  208. Castaldo, V.L.; Pisello, A.L.; Piselli, C.; Fabiani, C.; Cotana, F.; Santamouris, M. How outdoor microclimate mitigation affects building thermal-energy performance: A new design-stage method for energy saving in residential near-zero energy settlements in Italy. Renew. Energy 2018, 127, 920–935. [Google Scholar] [CrossRef]
  209. Ullah, K.R.; Prodanovic, V.; Pignatta, G.; Deletic, A.; Santamouris, M. Technological advancements towards the net-zero energy communities: A review on 23 case studies around the globe. Sol. Energy 2021, 224, 1107–1126. [Google Scholar] [CrossRef]
  210. Arena, L.; Faakye, O. EcoVillage: A Net Zero Energy Ready Community; National Renewable Energy Lab: Oak Ridge, TN, USA, 2015. [Google Scholar]
  211. Wills, A.D.; Beausoleil-Morrison, I.; Ugursal, V.I. A modelling approach and a case study to answer the question: What does it take to retrofit a community to net-zero energy? J. Build. Eng. 2021, 40, 102296. [Google Scholar] [CrossRef]
  212. Coates, G.J. The sustainable urban district of vauban in freiburg, germany. Int. J. Des. Nat. Ecodynamics 2013, 8, 265–286. [Google Scholar] [CrossRef] [Green Version]
  213. Hachem-Vermette, C.; Cubi, E.; Bergerson, J. Energy performance of a solar mixed-use community. Sustain. Cities Soc. 2016, 27, 145–151. [Google Scholar] [CrossRef]
  214. Heinze, M.; Voss, K. GOAL: ZERO ENERGY BUILDING Exemplary Experience Based on the Solar Estate Solarsiedlung Freiburg am Schlierberg, Germany. J. Green Build. 2009, 4, 93–100. [Google Scholar] [CrossRef] [Green Version]
  215. Kim, M.-H.; Kim, J.-K.; Lee, K.-H.; Baek, N.-C.; Park, D.-Y.; Jeong, J.-W. Performance investigation of an independent dedicated outdoor air system for energy-plus houses. Appl. Therm. Eng. 2019, 146, 306–317. [Google Scholar] [CrossRef]
  216. Van der Stelt, S.; AlSkaif, T.; van Sark, W. Techno-economic analysis of household and community energy storage for residential prosumers with smart appliances. Appl. Energy 2018, 209, 266–276. [Google Scholar] [CrossRef]
  217. Sun, Q.; Ge, X.; Liu, L.; Xu, X.; Zhang, Y.; Niu, R.; Zeng, Y. Review of Smart Grid Comprehensive Assessment Systems. Energy Procedia 2011, 12, 219–229. [Google Scholar] [CrossRef] [Green Version]
  218. Li, F.; Qiao, W.; Sun, H.; Wan, H.; Wang, J.; Xia, Y.; Xu, Z.; Zhang, P. Smart Transmission Grid: Vision and Framework. IEEE Trans. Smart Grid 2010, 1, 168–177. [Google Scholar] [CrossRef]
  219. Zhen, Y.; Li, X.; Zhang, Y.; Zeng, L.; Ou, Q. Transmission Tower Protection System Based on Internet of Things in Smart Grid. In Proceedings of the 7th International Conference on Computer Science & Education, Melbourne, VIC, Australia, 14–17 July 2012; p. 863. [Google Scholar]
  220. Hidayatullah, N.A.; Stojcevski, B.; Kalam, A. Analysis of Distributed Generation Systems, Smart Grid Technologies and Future Motivators Influencing Change in the Electricity Sector. Smart Grid Renew. Energy 2011, 2, 216–229. [Google Scholar] [CrossRef] [Green Version]
  221. Liwen, F.; Huiru, Z.; Sen, G. An Analysis on the Low-carbon Benefits of Smart Grid of China. Phys. Procedia 2012, 24, 328–336. [Google Scholar] [CrossRef] [Green Version]
  222. Shahrabi, E.; Hakimi, S.M.; Hasankhani, A.; Derakhshan, G.; Abdi, B. Developing optimal energy management of energy hub in the presence of stochastic renewable energy resources. Sustain. EnergyGrids Netw. 2021, 26, 100428. [Google Scholar] [CrossRef]
  223. Amir, V.; Jadid, S.; Ehsan, M. Optimal Design of a Multi-Carrier Microgrid (MCMG) Considering Net Zero Emission. Energies 2017, 10, 2109. [Google Scholar] [CrossRef] [Green Version]
  224. CLP. Electricity Tariff in Hong Kong; China Light and Power Co Ltd.: Hong Kong, China, 2019. [Google Scholar]
  225. Kathan, D.; Bennett, S.; Cammarata, C.; Daly, C. Assessment of Demand Response and Advanced Metering; Federal Energy Regulatory Commission: Washington, DC, USA, 2008. [Google Scholar]
  226. Cobben, S.; Gaiddon, B.; Laukamp, H. Impact of Photovoltaic Generation on Power Quality in Urban Areas with High Pv Population; Intelligent Energy Europe, European Commission: Luxembourg, 2008. [Google Scholar]
  227. Taveres-Cachat, E.; Grynning, S.; Thomsen, J.; Selkowitz, S. Responsive building envelope concepts in zero emission neighborhoods and smart cities—A roadmap to implementation. Build. Environ. 2019, 149, 446–457. [Google Scholar] [CrossRef]
  228. Li, D.H.W.; Yang, L.; Lam, J.C. Zero energy buildings and sustainable development implications—A review. Energy 2013, 54, 1–10. [Google Scholar] [CrossRef]
  229. IEA. Energy and Climate Change—World Energy Outlook Special Report; International Energy Agency: Paris, France, 2016. [Google Scholar]
  230. HK_Environment_Bureau. HK Climate Action Plan 2030+; Environment Bureau of Hong Kong: Hong Kong, China, 2017. [Google Scholar]
  231. Niestadt, M.; Bjørnåvold, A. Electric Road Vehicles in the European Union—Trends, Impacts and Policies; European Parliamentary Research Service: Rue Wiertz, Belgium, 2019. [Google Scholar]
  232. IEA. Accelerating the Introduction and Adoption of Electric Vehicles Worldwide. Available online: https://www.iea.org/areas-of-work/programmes-and-partnerships/electric-vehicles-initiative (accessed on 3 March 2021).
  233. EV30@30. EV30@30 Campaign; Clean Energy Ministerial: Copenhagen, Denmark, 2020. [Google Scholar]
  234. Buonomano, A. Building to Vehicle to Building concept: A comprehensive parametric and sensitivity analysis for decision making aims. Appl. Energy 2020, 261, 114077. [Google Scholar] [CrossRef]
  235. Kobashi, T.; Say, K.; Wang, J.; Yarime, M.; Wang, D.; Yoshida, T.; Yamagata, Y. Techno-economic assessment of photovoltaics plus electric vehicles towards household-sector decarbonization in Kyoto and Shenzhen by the year 2030. J. Clean. Prod. 2020, 253, 119933. [Google Scholar] [CrossRef]
  236. Tan, K.M.; Ramachandaramurthy, V.K.; Yong, J.Y. Integration of electric vehicles in smart grid: A review on vehicle to grid technologies and optimization techniques. Renew. Sustain. Energy Rev. 2016, 53, 720–732. [Google Scholar] [CrossRef]
  237. Longo, M.; Foiadelli, F.; Yaïci, W. Electric Vehicles Integrated with Renewable Energy Sources for Sustainable Mobility. In New Trends in Electrical Vehicle Powertrains; IntechOpen: London, UK, 2019. [Google Scholar]
  238. Monteiro, V.; Pinto, J.G.; Exposto, B.; Gonçalves, H.; Ferreira, J.C.; Couto, C.; Afonso, J.L. Assessment of a Battery Charger for Electric Vehicles with Reactive Power Control. In Proceedings of the IECON 2012—38th Annual Conference on IEEE Industrial Electronics Society, Montreal, QC, Canada, 25–28 October 2012. [Google Scholar]
  239. Sekyung, H.; Soohee, H.; Sezaki, K. Development of an Optimal Vehicle-to-Grid Aggregator for Frequency Regulation. IEEE Trans. Smart Grid 2010, 1, 65–72. [Google Scholar] [CrossRef]
  240. Yong, J.Y.; Ramachandaramurthy, V.K.; Tan, K.M.; Mithulananthan, N. A review on the state-of-the-art technologies of electric vehicle, its impacts and prospects. Renew. Sustain. Energy Rev. 2015, 49, 365–385. [Google Scholar] [CrossRef]
  241. Rohloff, A.; Roberts, J.; Goldstein, N. Impacts of Incorporating Electric Vehicle Charging into Zero Net Energy (ZNE) Buildings and Communities; American Council for an Energy Efficient Economy (ACEEE): Pacific Grove, CA, USA, 2010. [Google Scholar]
  242. Liljequist, B. How Net-Zero Impact Buildings Positively Impact the World. Available online: https://www.greenbiz.com/article/how-net-zero-impact-buildings-positively-impact-world (accessed on 1 August 2021).
  243. Tapscott, D.; Bigham, J.; Williams, A. C40 Cities Climate Leadership Group Cities Confronting Climate Change—Lighthouse Case Study; University of Toronto: Toronto, ON, Canada, 2014. [Google Scholar]
  244. +CityxChange. European Union’s Horizon 2020 Research and Innovation Programme; The Norwegian University of Science and Technology: Trondheim, Norway, 2019. [Google Scholar]
  245. EXCESS. FlEXible User-CEntric Energy Positive Houses; European Union: Rue Wiertz, Belgium, 2019. [Google Scholar]
  246. ATELIER. Positive Energy Districts; European Union: Rue Wiertz, Belgium, 2019. [Google Scholar]
  247. POCITYF. Leading the Smart Evolution of Historical Cities; European Union: Rue Wiertz, Belgium, 2018. [Google Scholar]
  248. EU. EU 2030 Climate & Energy Framework; European Union: Rue Wiertz, Belgium, 2018. [Google Scholar]
  249. GBPN. The GBPN and REEEP Launch The “1 Billion Square Meters” Initiative: An Effort To Promote Residential Positive Energy Buildings. Available online: https://www.gbpn.org/project-gbpn-and-reeep-launch-1-billion-square-meters-initiative-effort-promote/ (accessed on 1 August 2021).
  250. GBPN. Defining Positive Energy—A Spectrum Approach. Available online: https://tools.gbpn.org/positive-energy-buildings/overall-performance-values-building-codes (accessed on 1 August 2021).
  251. EBC. IEA EBC ANNEX 83—Positive Energy Districts; EBC Executive Committee Support Services Unit: Espoo, Finland, 2020. [Google Scholar]
  252. Dabas, C. Delays in Offshore Wind Approvals ‘Could See UK Fall behind Targets. Available online: https://www.energylivenews.com/2020/06/17/delays-in-offshore-wind-approvals-could-see-uk-fall-behind-targets/ (accessed on 4 June 2020).
  253. Reuters. Huge Acceleration of Clean Energy Innovation Needed to Meet Net Zero Target: IEA. Available online: https://energy.economictimes.indiatimes.com/news/renewable/huge-acceleration-of-clean-energy-innovation-needed-to-meet-net-zero-target-iea/76743011 (accessed on 28 June 2020).
  254. ETEnergyWorld. India’s Solar Capacity Addition Expected to Come down by 15% to 5.5 GW in FY21: ICRA. Available online: https://energy.economictimes.indiatimes.com/news/renewable/indias-solar-capacity-addition-expected-to-come-down-by-15-to-5-5-gw-in-fy21-icra/76815457 (accessed on 4 July 2020).
  255. IKEA. IKEA Reveals Plans to Go Carbon Positive by 2030. Available online: https://digit.fyi/ikea-reveals-plans-to-go-carbon-positive-by-2030/ (accessed on 1 August 2021).
  256. PV_Magazine. Ikea Invests More in Solar by the Day. Available online: https://www.pv-magazine.com/2020/07/02/ikea-invests-more-in-solar-by-the-day/ (accessed on 4 July 2020).
  257. BREEAM. What is BREEAM? Available online: https://www.breeam.com/ (accessed on 10 March 2021).
Figure 1. Comparison between the number of publications on zero and positive energy buildings by year.
Energies 14 05046 g001
Figure 2. Comparison between the number of publications on zero and positive energy communities by year.
Energies 14 05046 g002
Figure 3. Outline of the review on positive energy building and community.
Energies 14 05046 g003
Figure 4. Brief schematic of the Positive Energy Building Concept. Partially reprinted with the permission from [67].
Energies 14 05046 g004
Figure 5. Smart energy management schema of PEBs. Partially reprinted with the permission from [46].
Energies 14 05046 g005
Figure 6. Role of stakeholders at different phases of PEBs in a life-cycle [127,128,129,132]. Partially reprinted with the permission from [128].
Energies 14 05046 g006
Figure 7. Positive energy community.
Energies 14 05046 g007
Figure 8. Quantitative comparison of PEBs with the traditional buildings, passive buildings, and zero energy buildings.
Energies 14 05046 g008
Figure 9. Quantitative comparison of PECs with the traditional communities and zero energy communities.
Energies 14 05046 g009
Figure 10. (a) PEC selling/buying price, (b) Risk and reward of various pricing scheme in PEC. Partially reprinted with the permission from [23].
Energies 14 05046 g010
Figure 11. B2V, V2B, V2G and G2V functions of fuel cell electric vehicle parked at a building.
Energies 14 05046 g011
Table 1. PEB definitions.
AcronymsMeaningCharacteristicsReferences
PSoEBPositive Source Energy BuildingA building that annually generates more than its demand at its boundary when accounted for the source[14]
PSiEBPositive Site Energy BuildingA building that annually generates more than its demand at its boundary when accounted for the site[15]
PECBPositive Energy Cost BuildingA building that annually earns more from its utility than what it pays[16]
PCEBPositive Carbon Emission BuildingA building that annually saves more carbon emission instead of polluting[17]
Autonomous PEBAutonomous Positive Energy BuildingA building that satisfies all its demands with its generation without a grid connection[18]
PExBPositive Exergy BuildingA building that annually produces a higher grade and quality energy than it consumes[19]
Table 2. Positive Energy Buildings.
NameLocationTypeAreaAnnual DemandAnnual GenerationNetReferences
m2kWhkWhkWh
EchohavenCalgary, CanadaSingle Family Residence2555965 6164+199[48]
Hadera KindergartenHadera, IsraelEducational91514.59119.046 +4455[49]
Lombardo Welcome CenterMillersville, PA, USABusiness1356115.853204.391+88.538[52]
Lincoln Net Positive FarmhouseMassachusetts, USASingle Family Residence39510.17417.151+6977[51]
School of Design and Environment 4SingaporeEducational8588470.750619.345+148.595[53]
Zero Energy HouseAuckland, New ZealandSingle Family Residence13023613217+856[50]
UFSC solar energy laboratoryFlorianopolis, BrazilEducational-79.49183.782+4291[54]
Table 3. Key indicators of the positive energy community.
IndicatorsDefinitionsReference
On-site Energy Ration (OER)To measure the ratio of annual renewable energy generation to the annual energy demand[166,167]
Annual Mismatch Ratio (AMRx)To measure the annual energy imported into the community (by energy type)[166,167]
Maximum Hourly Surplus (MHSx)To determine the annual maximum value for the difference between the hourly local renewable supply and the respective demand (by energy type)[166,167]
Maximum Hourly Deficit (MHDx)To determine the annual maximum value for the difference between the hourly local demand and the respective renewable supply (by energy type)[166,167]
Ratio of Peak hourly demand to Lowest hourly demand (RPLx)To measure that ratio between the highest and lowest value of hourly demand over the month (by energy type)[166,167]
Net direct energy consumption (nDEx)To measure the difference between annual export and import (by energy type).[26,78]
Onsite Energy Fraction (OEFx)To measure the ratio of electrical demand, covered by the local renewable supply (by energy type)[26,78]
Onsite Energy Matching (OEMx)To measure the ratio of local renewable supply consumed within the building system (by energy type)[26,78]
Annual Exergy Consumption (AEXC)To measure the annual exergy consumption of the community[146]
Annual Exergy generation (εon)To measure the annual exergy generation of the community[146,164]
Carnot Factor (CFt)To find the exergy value from the energy [146]
Rational Exergy Management Efficiency To measure the ratio of exergy demand to the exergy supply[146,164]
Annual Exported EnergyTo measure the total annual energy exported to the grid (by energy type)[26]
Annual Imported EnergyTo measure the total annual energy imported from the grid[26]
Life Cycle Cost (LCC)To measure the total cost of an asset over its lifetime, including the capital, maintenance, operation and residual cost[26,156]
Net Present Value(NPV)To measure the difference between the present value of cash inflows and the respective outflows over a period[152]
Simple PaybackTo measure the number of years taken to pay back the investment cost[152,156]
Benefit-Cost ratio (BC)To illustrate the relationship between the relative costs and benefits of a proposed project[152]
Annual GHG emissionTo measure the annual greenhouse gas emission[152]
Annual Primary Energy ConsumptionTo measure the total annual primary energy consumption of the community[168]
Table 4. Generation, demand, and storage of various PEC projects.
PEC ProjectGenerationDemandStorageMagnitude of Energy Positivity, MWh/aReferences
UC Davis’ West Village Community, USA5.4 MW Photovoltaics
300 kW Biogas fuel cell
Solar thermal collector
Single-Family
Multifamily
Commercial
Battery
2nd life lithium-ion battery
Centralized hot water tank
552[156]
Eco-Friendly Energy Town, Jincheon, South KoreaPhotovoltaic
Solar thermal collector
Multi-source Heat Pump
Gas Boiler
University, a public library, a school, a childcare centre, a clinical centre, a management officeHot water tank
Seasonal thermal energy storage
747.9[155,157]
Feldheim energy community, Germany123 MW Wind park
2.25 MW Solar park
Wood chip heating plant
526 kW biogas plant
130 Residents10 MWh lithium-ion CES9000[158,173]
Energy City Graz-Reininghaus, Graz, Austria215 kW geothermal heat pump, 90 m2 solar thermal collector, 603 m2 PhotovoltaicA multifunctional linear building complex, 12 residential multi-family buildings5000 L DHW storage tank55.4[32]
Finland
Simulation study
PV (1–1000 kW)
Wind (3–1500 kW)
A community of 100 housesBattery (0.022–11 MWh)247.5[26]
Pakistan
Simulation study
225 kW PVA village of 150 single-family houses, 1 school, 1 public health centre, 1 prayer hall, and 5 shopsnil6.04[152]
Drake Landing, Canada
Simulation
PV, Solar thermal collectorDetached home, Apartment, school, Office, retail, Supermarketborehole thermal energy storage, Hot water storage tank2317[174]
The Green Village
Netherlands
A house (PV 43.6 m2, BIPV 4.9 kW solar thermal panel 5.4 m2, ASHP 4 kW)
FCEV 100 kW
10 houses, 5 FCEVsFCEV hydrogen storage of 5.6 kg29.8[168]
Naples, Italy
simulation
20 kW BIPV3 Office building
3 EV
EV storage 60 kWh8.6[40]
Table 5. The role of different stakeholders in a positive energy community.
StakeholderThe Role of StakeholdersType of Building and System/Topic of the ResearchMagnitude of Positivity (MWh/a)References
Community DeveloperInformation campaigns, Consultation process, community leadershipCritical analysis on two PECs: Samsø (Denmark) and Feldheim (Germany)-[159]
Community DeveloperTo find proper strategies within the geographical context--[197]
Community DeveloperThird-party construction quality inspectionsSingle-Family
Multifamily
Commercial
552[156]
5.4 MW Photovoltaics
300 kW Biogas fuel cell
Solar thermal collector
Battery
2nd life lithium-ion battery
Centralized hot water tank
Community DeveloperGuarantee a lower energy bill 130 Residents9000[158]
123 MW Wind park
2.25 MW Solar park
Wood chip heating plant
526 kW biogas plant
10 MWh lithium-ion CES
CustomersCustomers are influenced by external and internal factors
Community should think of themselves as a contributor, rather than autonomous
270 householdsPositive energy cost community[196]
Rooftop top PV, Community PV
CustomersCustomers are aware and willing to contribute50 apartments, each supported by a gas CHP with a hot water tank80 kWh/day[22]
CustomersCommunity members are more optimistic than non-membersEmpirical study on community energy members-[20]
CustomersCommunity engagement is important during all decision-making processA participatory framework for positive community engagement from consultation to collaboration.-[21]
GovernmentEnergy price should be decided by statutes to guarantee the long-term benefits130 Residents9000[158]
123 MW Wind park
2.25 MW Solar park
Wood chip heating plant
526 kW biogas plant
10 MWh lithium-ion CES
GovernmentFinancial assistance, direct subsidies, complementary policy initiatives, Generate local employmentCritical analysis on two PECs: Samsø (Denmark) and Feldheim (Germany)-[159]
GovernmentIncentives and grants should be user-friendlyA village of 150 single-family houses, 1 school, 1 public health centre, 1 prayer hall, and 5 shops
225 kW PV
6.04[152]
Utility grid companyPEC should pose less impact on the gridAn educational building, a residential building, and a office buildingPositive energy cost community[188]
Utility grid companyPEC should support the gridResidential rooftop PV, 6 MW of residential energy storage-[177]
Table 6. Challenges and bottlenecks of the positive energy community.
BarriersType of the Building and System/Topic of the ResearchMagnitude of Positivity
(MWh/a)
References
Technical
The technical barrier of PEC exists in all its associated stages50 apartments, each supported by a gas CHP with a hot water tank80 kWh/day[23]
The physical characteristic of the community can limit the penetration of highly suitable technologyPV (1–1000 kW) Wind (3–1500 kW)247.5[26]
A community of 100 houses
Battery (0.022–11 MWh)
Market cost and difficulty in technology acceptanceA house (PV 43.6 m2, BIPV 4.9 kW solar thermal panel 5.4 m2, ASHP 4 kW) FCEV 100 kW29.8[168]
10 houses, 5 FCEVs
FCEV hydrogen storage of 5.6 kg
Lack of accurate data is a leading technical issueEnergy Hub for energy positive neighborhood-[192]
Lack of privacy and insufficient data securityToward electricity retail competition: technical infrastructure for advanced electricity market system-[200,201]
Societal
Organizational barrier50 apartments, each supported by a gas CHP with a hot water tank80 kWh/day[200]
Consumers are unwilling to compromise, and behavioural changeEnergy Hub for energy positive neighborhood-[192]
Certain groups are benefited more than othersCritical analysis on two PECs: Samsø (Denmark) and Feldheim (Germany)-[159,160]
A high level of confidence and mutual trust among the stakeholders is needed215 kW geothermal heat pump, 90 m2 solar thermal collector, 603 m2 Photovoltaic
A multifunctional linear building complex, 12 residential multi-family buildings
5000 L DHW storage tank
55.4[32]
Ownership problem5.4 MW Photovoltaics
300 kW Biogas fuel cell Solar thermal collector
552[154]
Single-Family
Multifamily
Commercial
Battery
2nd life lithium-ion battery
Centralized hot water tank
Economical
Unable to invest substantially130 Residents9000[158]
123 MW Wind park
2.25 MW Solar park
Wood chip heating plant
526 kW biogas plant
10 MWh lithium-ion CES
Financial supports are needed in the form of credits, subsidies, and incentivesCritical analysis on two PECs: Samsø (Denmark) and Feldheim (Germany)-[159]
Market failures such as imperfect information, incomplete markets, imperfect competition, and hidden costs50 apartments, each supported by a gas CHP with a hot water tank80 kWh/day[20,200]
Polical/Regulatory
Government policies usually enacted through regulation such as tax code and PEC design standard50 apartments, each supported by a gas CHP with a hot water tank80 kWh/day[200]
Regulatory issue600 apartments-[178]
Policy revisions like changes in tariff plansEmpirical study on community energy members-[20]
Auction and tender issues favors prominent investorsRenewable energy tenders and community power-[203]
Table 7. Main differences between PEB and PEC.
AspectsKey Difference between PEB and PECReferences
Renewable generationCompared to PEB, PEC uses fuel cells, biogas and bio-waste extensively to improve stability and reliability of supply[156,157,160]
Contrasted to PEB, when the community level reveals a broader boundary, cost-effective and reliable hybrid renewable energy generation with the added benefit of large-scale generation is possible[158]
Off-site renewables are more economically feasible to urban PEC than PEB[154,155]
Demand reductionWhen integrating different types of demand into a single system, the nature of PEC can unknowingly reduce significant amounts of maximum power demand[32,154]
Considering a highly efficient centralized energy appliance for PEC, the overall system cost and energy demand can be significantly reduced compared with PEB[152,215]
The hybrid combination of centralized equipment is cost-effective and well-suited to the community scale energy system than PEB[155]
Energy storageAutonomy is possible in PECs at a lower cost by utilizing the cost-effectiveness of large-scale energy storage and hybrid energy storage design concepts such as community energy storage or energy hub.[153,161,172,174]
High energy conversion and energy flexibility in storage are essential to reach positivity at the community scale[192,216]
Energy managementInteraction mode within PEC, like the interaction between the buildings, makes the PEC more complex when considered with the corresponding PEB[163]
The design of EMS in PEC considers many steps than PEB[32,182,184]
Stakeholders’ perspectivesCompared with PEB, the dweller/user in PEC cannot influence much since there are not the only dweller/user of the project.[51,162]
The users in the PEC project are not willing to face the financial burden, so it is often passed on to the community developer[48,158]
User/owner does the monitoring, operation and maintenance process of a PEB, whereas an energy manager does these in PEC[112,175]
PEC with on-site/off-site renewable energy is better for urban growth because it can handle more users and reduce PEB sprawl[155]
Table 8. Impact of smart energy grid on PEB and PEC.
Type of Interacted Grids (External, Internal; Electric/Heating/Cooling)Type of Buildings and Energy SystemsMagnitude of Grid Interactions (Import: MWh/a
Export: MWh/a)
Magnitude of Positivity
(MWh/a)
References
Electricity grid, District heatingA community of 100 houses330
577.5
247.5[26]
Electricity grid, District heating, District coolingA district of 40.000 house-4600[150]
Electricity grid, Internal heating and cooling gridUniversity, a public library, a school, a childcare centre, a clinical centre, a management office-747.9[155]
Internal electric and heating grid130 Residents-
9000
9000[158,173]
External electric, heating and cooling gridTwo storey office building-
-
5.1[105]
External electrical grid, District heatingSingle apartment-
-
2.9[57]
Internal DC micro gridResidential building cluster (48 apartments)-
-
Positive energy cost community[162]
External electric gridSingle family house-
-
15.6[112]
External electric gridSingle family house-
-
0.7[14]
External electric gridone-storey single family house4.4
6.6
2.2[73]
External electric and thermal grid500 residents, a kindergarten-
-
−8[167]
External electric grid50 Apartments-
-
80 kWh/day[23]
External electric gridA residential building-
-
2.8[83]
External electric gridAn office building and a hotel building-
-
133.6[193]
External electric gridA residential building1.9
4.4
2.4[79]
Table 9. Impact of the new energy vehicles on PEB/PEC, and their energy flow.
Type of BuildingRenewablesMagnitude of the Positivity
(MWh/a)
Type of VehicleFunctionReferences
ElectricH2HybridB2VV2BV2GV2V
Residential building clusterPV (65.5 kW)Positive energy cost communityyesnonoyesnonono[162]
Residential building clusterBIPV (4.9 kW)29.8noyesnoyesnoyesno[168]
Single family housePV 190.8 m2,
Wind 16 kW,
Electrolyzer
5.6noyesnoyesyesnono[73]
3 OfficesBIPV (20 kW)8.6 yesnonoyesyesnono[40,234]
HomePV (7 kW)Positive energy cost buildingyesnonoyesyesnono[235]
Residential building clusterPV (1–1000 kW)
Wind (3–1500 kW)
247.5yesnonoyesnonono[26]
Home and Office buildingBIPV
Solar Thermal collector (30 m2)
Wind (500 kW)
20.2yesnonoyesyesnono[189]
Single family house98 m2 monocrystalline PV, 73 m2 thin film PV1yesnonoyesnonono[104]
Two story residential buildingPV 10 m2, EVPositive energy cost buildingyesnonoyesyesnono[102]
Single family housePV 160 m2,
Wind 12 kW
9.5yesnonoyesyesnono[73]
Publisher’s Note: MDPI stays neutral with regard to jurisdictional claims in published maps and institutional affiliations.

