Article

Could Japonica Rice Be an Alternative Variety for Increased Global Food Security and Climate Change Mitigation?

1
Department of Bio-Industrial Machinery Engineering, Kyungpook National University, Daegu 41566, Korea
2
Upland-Field Machinery Research Centre, Kyungpook National University, Daegu 41566, Korea
3
Smart Agriculture Innovation Center, Kyungpook National University, Daegu 41566, Korea
4
Institutes of Energy and the Environment, The Pennsylvania State University, University Park, PA 16802, USA
5
Division of Plant Biosciences, School of Applied Biosciences, College of Agriculture & Life Science, Kyungpook National University, Daegu 41566, Korea
6
Financial Research Institute of Ministry of Finance of the Russian Federation, 127006 Moscow, Russia
*
Authors to whom correspondence should be addressed.
Foods 2021, 10(8), 1869; https://doi.org/10.3390/foods10081869
Submission received: 25 June 2021 / Revised: 2 August 2021 / Accepted: 10 August 2021 / Published: 12 August 2021

Abstract

:
The growing importance of rice globally over the past three decades is evident in its strategic place in many countries’ food security planning policies. Still, its cultivation emits substantial greenhouse gases (GHGs). The Indica and Japonica sub-species of Oryza sativa L. are mainly grown, with Indica holding the largest market share. The awareness, economics, and acceptability of Japonica rice in a food-insecure Indica rice-consuming population were surveyed. The impact of parboiling on Japonica rice was studied and the factors which most impacted stickiness were investigated through sensory and statistical analyses. A comparison of the growing climate and greenhouse gas emissions of Japonica and Indica rice was carried out by reviewing previous studies. Survey results indicated that non-adhesiveness and pleasant aroma were the most preferred properties. Parboiling treatment altered Japonica rice’s physical and chemical properties, introducing gelatinization of starch and reducing adhesiveness while retaining micronutrient concentrations. Regions with high food insecurity and high consumption of Indica rice were found to have suitable climatic conditions for growing Japonica rice. Adopting the higher-yielding, nutritious Japonica rice whose cultivation emits less GHG in these regions could help strengthen food security while reducing GHGs in global rice cultivation.

1. Introduction

Recent World Bank reports show that half of the world’s poorest people are in just five countries on two continents [1]. These are India and Bangladesh in South Asia, and Nigeria, the Democratic Republic of Congo, and Ethiopia in Sub-Saharan Africa. Rice is a highly consumed staple in three of these countries with reported values as follows: Bangladesh (260 kg/capita and 36.1 Megatonnes); India (103 kg/capita and 104 Megatonnes), Nigeria (46.3 kg/capita 6.60 Megatonnes), Democratic Republic of Congo (29.7 kg/capita and 0.47 Megatonnes), and Ethiopia (4.69 kg/capita and 0.66 Megatonnes) [1,2]. Two of these countries are also among the ten top global importers of rice, with Nigeria at 1.8 Megatonnes spending USD 8.5 billion and Bangladesh at 0.9 Megatonnes spending USD 4.03 billion [3]. In these countries, there are high rates of malnourishment and food insecurity [4].
Food security has been defined in various ways. As reported by the Food and Agriculture Organization (FAO) of the United Nations, the initial focus was on the volume and stability of food supplies. This definition has evolved into “when all people always have physical, social and economic access to enough, safe and nutritious food which meets their dietary needs and food preferences for an active and healthy life” (FAO, 2019) [5]. According to this latest definition, 820 million food-insecure people [6] live in poor countries. However, “hidden hunger” becomes pertinent due to challenges such as inadequate intake of calories to support an individual’s daily activities, insufficient protein to support growth, and deficiencies in mineral and vitamins intake [7]. Serious health outcomes of hidden hunger have been recorded in most developing countries [8,9] and have been predicted to grow exponentially in Africa at a rate of 18% annually [10].
Rice, a monocot cereal customarily grown as an annual plant, is an excellent source of complex carbohydrates. As a staple for more than half of the world’s population, worldwide production has been growing steadily [11] in response to increasing demands over the past three decades. The growing importance of rice globally is evident in the strategic food security planning policies of many countries. While, currently, nine out of every ten people in the world who consume rice are Asian, rice is ranked as the fastest growing staple in Africa. In Latin America and the Caribbean, it is gaining increased acceptance [12].
By 2039, the total land area of rice harvest is projected to increase by 11% to meet the world’s needs [13]. However, rice cultivation is also a major source of greenhouse gas (GHG) emissions, with annual levels in 2017 recorded at 924 Megatonnes of carbon dioxide equivalents (CO2e), ahead of hard coal mining (790 Megatonnes CO2e) [14]. The total land area used to cultivate cereals globally is nearly 7.31 × 10⁸ ha [15]. Rice harvests account for about 23.5% of the total harvested cereal area and 27% of global cereal production and consumption [16].
Rice is cultivated in more than 100 countries [17]. Still, except for a few countries that have attained self-sufficiency, demand currently exceeds production in many, and large quantities of rice are imported to meet needs. As many as 21 of the 39 rice-producing countries in Africa import between 50 and 99% of their rice needs at substantial economic costs [18,19], making it unaffordable for the populace living in poverty. Furthermore, supply chain disruptions caused by occurrences such as conflicts and pandemics drive calls for securing local stores of domestic production of food staples. For example, the World Food Program [20] has warned of risks of widespread famines due to the COVID-19 global disease outbreak caused by the severe acute respiratory syndrome coronavirus 2 (SARS-CoV-2).
Nigeria, Africa’s second most populous country, was reported to be the second largest rice importer in the world [21] and in terms of calories consumed, rice ranked fourth. Although Nigeria was reported as the largest rice producer in West Africa, productivity is relatively low. The major constraint to growing rice in Africa is reliable water availability, as unsteady and low rainfall patterns results in crop vulnerability to drought.
Only two rice species (the African Oryza glaberrima and the Asian Oryza sativa) are reportedly cultivated in the world [22]. These are morphologically similar but differ ecologically. O. glaberrima has the important characteristics of being more disease and pest resistant compared to the Asian O. sativa [22]. Additionally, O. glaberrima is less susceptible to weeds given its broader leaves that shade weeds out. Furthermore, the African variety has a better tolerance for fluctuations in water depth, severe climates, iron toxicity, and infertile soils. A faster maturity rate gives O. glaberrima high potential as an important emergency food [23]. The higher yields of the Asian O. sativa, however, present an advantage over O. glaberrima whose grains are brittle and more challenging to mill. Hybrids of the two main species have been produced to preserve the desirable traits in both. Cultivation of O. glaberrima is predominantly in Sub-Saharan Africa but it is being replaced by O. sativa.
The Asian rice species, Oryza sativa, is the primary type cultivated worldwide and its subspecies, Indica and Japonica, are the most grown. Indica rice, also known as long grain, grows well near the equator with a kernel four to five times longer than its width and it holds over 80% of the global rice market share [24].
Rice quality is primarily assessed based on physical properties such as head rice yield, chalkiness, grain size and shape, grain color, adhesiveness, protein and amylose content, and aroma [25,26,27]. These properties of rice affect its physicochemical and cooking properties and, consequently, desirability among consumers. Amylose content and alkali digestion are widely recognized as important determinants of consumption quality because they reflect the functionality of the rice grain’s starch [28]. Protein content also plays an essential role in determining quality, as does the grain texture and the surface hardness of cooked rice [29].
The parboiling process of harvested paddy improves quality by producing mostly desirable biochemical, physical, and sensory changes according to reports by Oli et al. [30]; Mir and Bosco [31]; Bello et al. [32] and da Fonseca et al. [33]. The gelatinization of starch in the rice occurs during parboiling, resulting in loss of adhesiveness and producing a desirable aroma. Parboiling involves partially boiling the paddy in its husk and consists of three basic steps: soaking, steaming, and drying, as Miah et al. [34] described. During the parboiling process, the first stage of soaking rice in warm water allows the water-soluble nutrients to penetrate the endosperm from the husk. The husk contains 0.05–0.07 mg of riboflavin, 0.09–0.21 mg thiamin, and 1.6–4.2 mg niacin [35,36]. Riboflavin is slightly soluble in water, thiamin is highly soluble, and niacin is poorly soluble in water.
During the cooking process, starch granules in the grain expand, and amylose leaches into the boiling water to form a viscous solution. As the cooked rice cools, the leached amylose chains line up, lock together, and form a gel, resulting in adhesiveness. In theory, the higher the amylose content of rice, the firmer the cooked grain of rice would be. Amylose is also responsible for the way that rice hardens upon cooling. When rice cools to room temperature or lower, retrogradation occurs as the amylose chains and linear parts of amylopectin crystallize by forming hydrogen bridges.
The Indica paddy is usually treated to a parboiling process, resulting in the milled grains being fluffy with separate kernels when cooked. The rice seeds are also processed into other products, including pasta, rice cakes, flour, and animal feed. Japonica rice, commonly referred to as medium and short grain, has kernels two to three times longer than its width and grows mostly in temperate regions. It is commonly found in the Republic of Korea, Japan, the Democratic People’s Republic of Korea, and parts of China, Australia, and the United States of America. The Japonica rice paddy is usually not treated with any process, and the milled grains are moist, adhesive, and bright white in color. The glutinous (adhesiveness) nature of Japonica makes it most ideal for Mediterranean and Asian dishes that require adhesiveness, such as paella, risotto, and sushi.
The objectives of this study were to: (1) determine the awareness, acceptability, and economics of Japonica rice using structured questionnaires in a major parboiled Indica rice-consuming market; (2) analyze the differences in nutritional and physical properties of untreated Japonica, treated Japonica, and treated Indica rice; (3) compare the growing climate and greenhouse gas emissions of Japonica and Indica rice using previous studies; and discuss the implications for food security in food-insecure Indica rice-consuming markets.

2. Materials and Methods

A survey of consumer rice preference was performed, and analyses of the impact of parboiling on the quality of Japonica rice considering consumer preference were carried out. Following Adhikari et al. [37], moisture, temperature, adhesion, and quantity of low molecular sugars were measured to assess adhesiveness. Furthermore, color and nutrient levels in the rice samples were measured using spectrophotometric and wet chemistry methods.

2.1. Survey of Consumer Rice Preferences Using a Structured Questionnaire

A survey was administered to 1057 literate and non-literate randomly selected participants in Nigeria’s six main geographical regions (North-east, North-west, North-central, South-east, South-west, and South-south). A total of 506 literate respondents participated via an online questionnaire and in-person interviews were administered to the 551 non-literate respondents. To determine the participants’ rice preferences when presented with choices, the information gathered through the survey (Appendix B) included the following:
  • knowledge of the rice sub-species and preference of sub-species,
  • length of grain, adhesiveness, aroma, and taste after cooking as well as the cooking time,
  • willingness to purchase healthier rice at a relatively higher cost (USD 1 = NGN 410).
The survey results were summarized using descriptive statistics.

2.2. Analyses of the Impact of Parboiling on the Properties of Japonica Rice

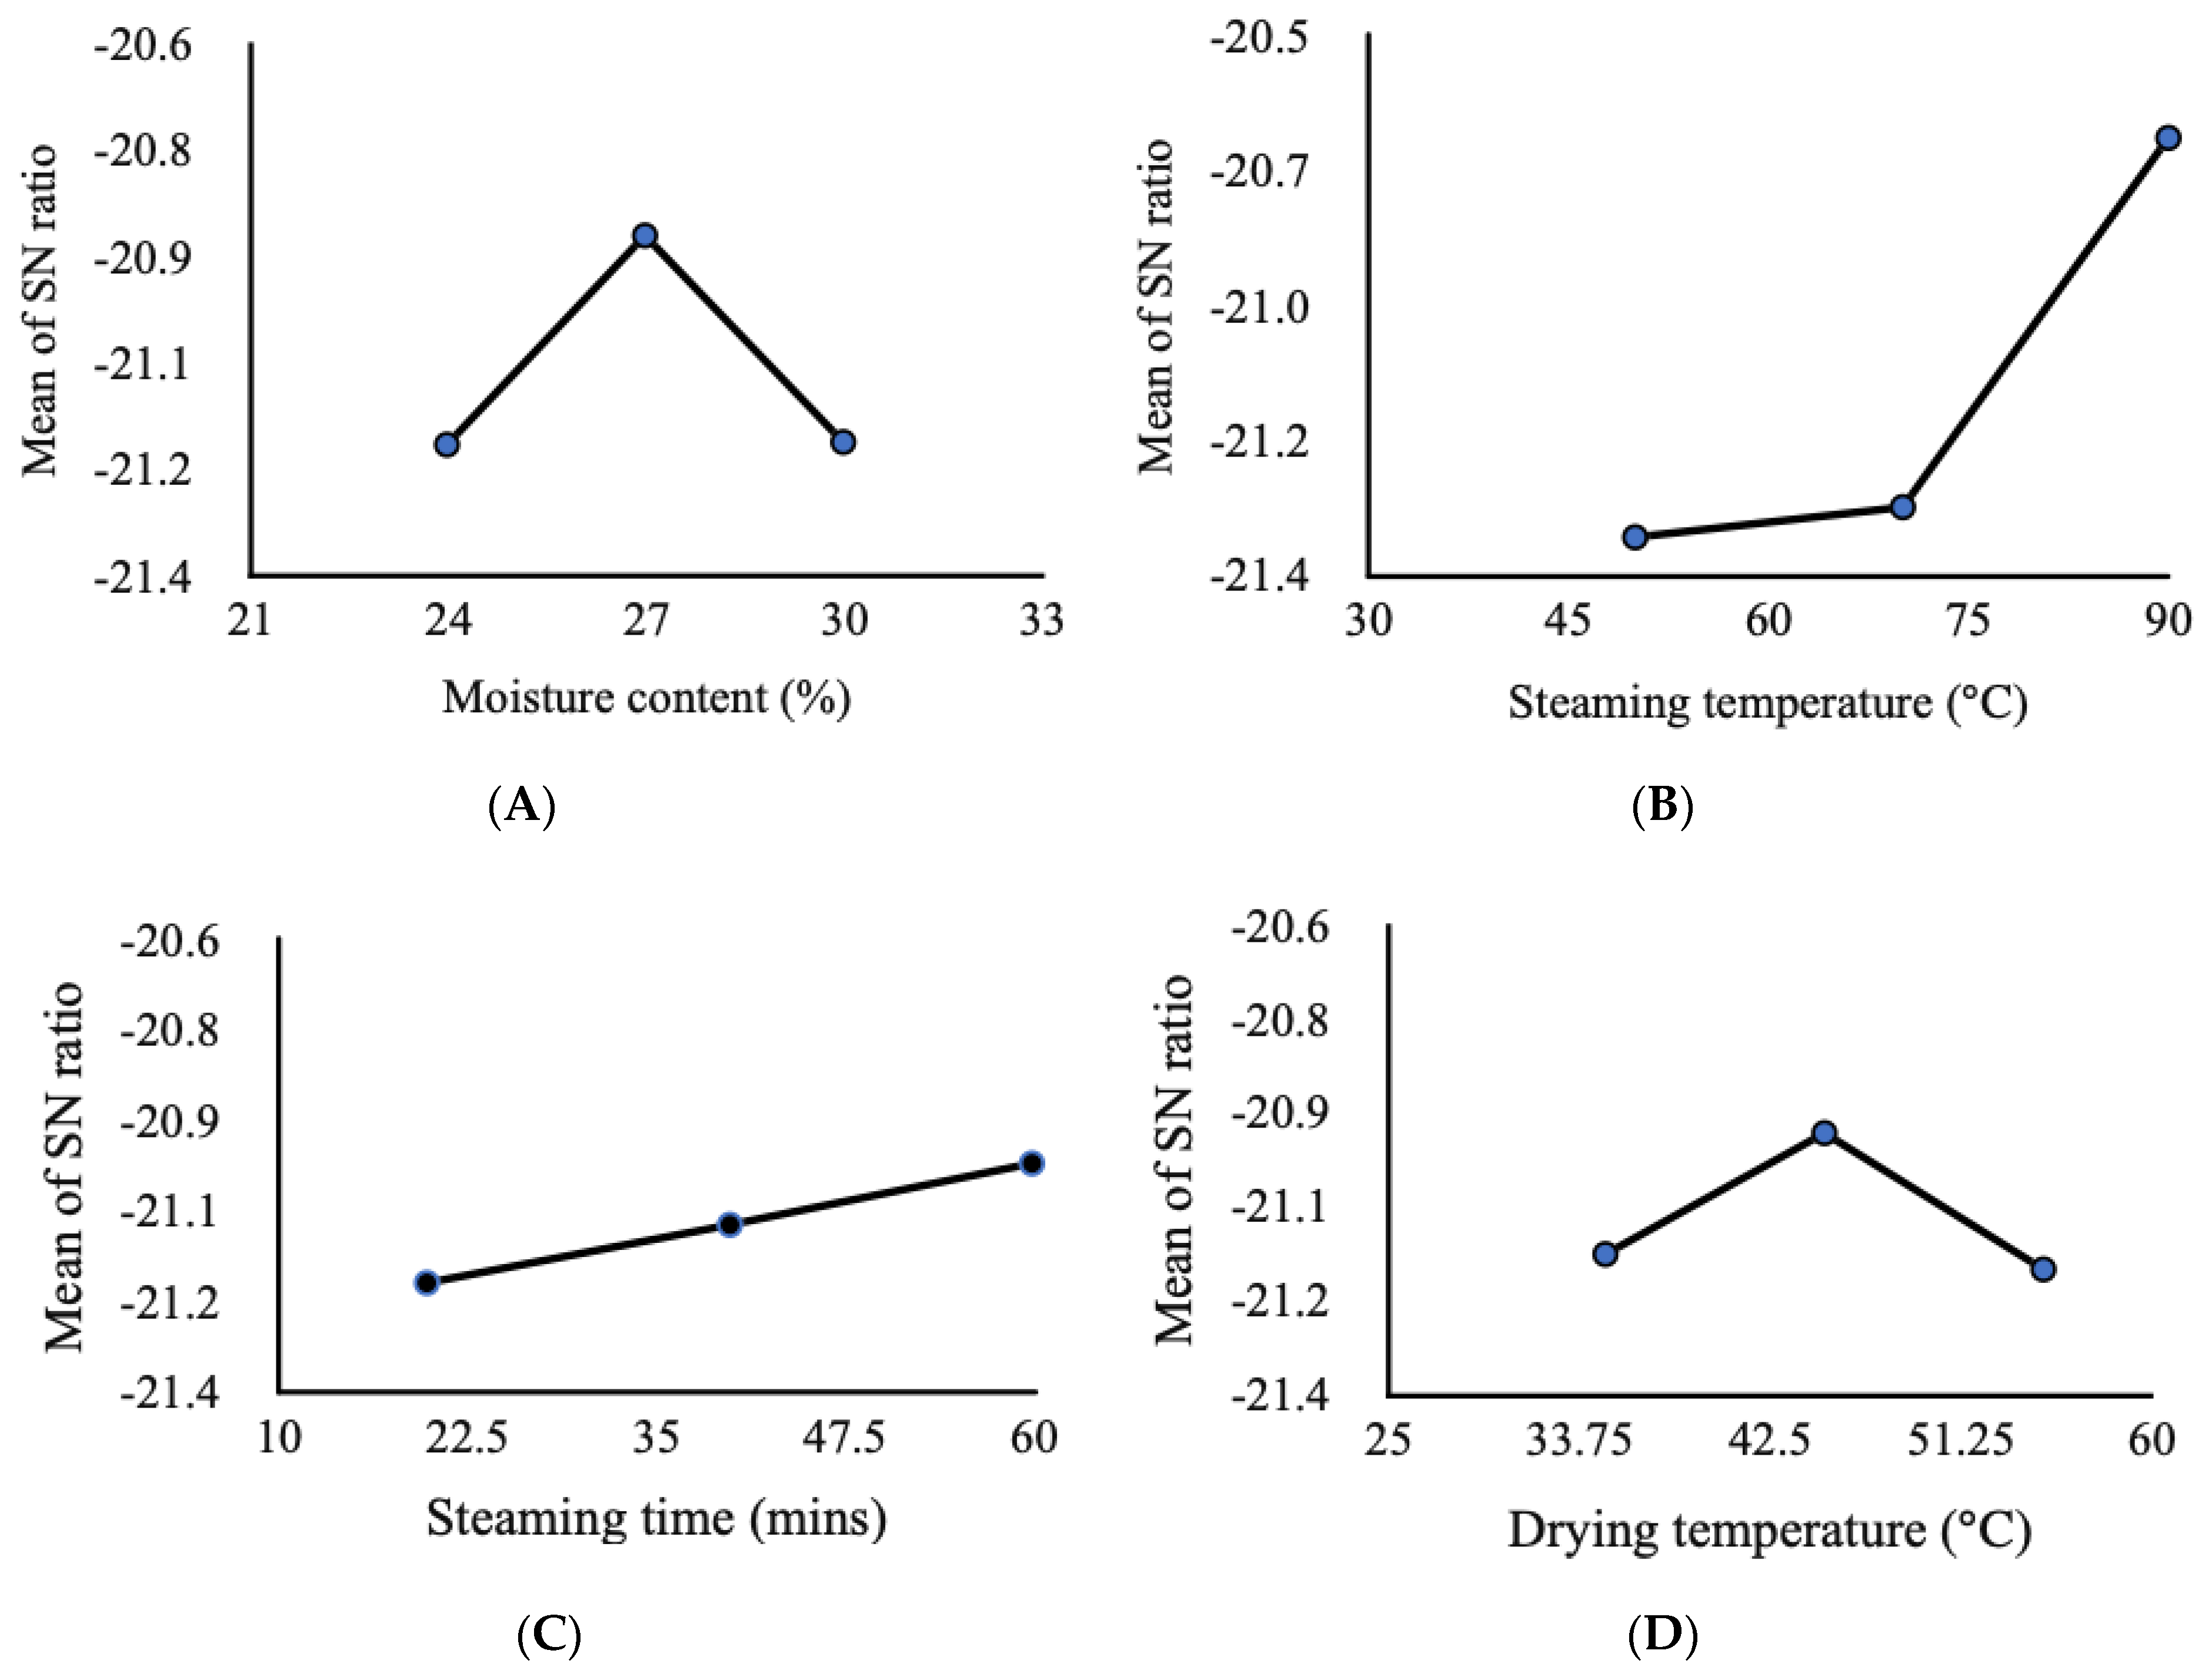
2.2.1. Rice Parboiling Procedure

Samples for this study were collected from a Japonica paddy harvested in Dalseong gun (Republic of Korea). The rice samples were parboiled using hydrothermal and mechanical treatments as described below.
Nine Japonica rice samples weighing 200 g each were soaked in a water bath shaker as described in [38]. Fabricated parboiling equipment [38] was used to treat the samples under the different conditions, given in Table 1. The equipment consisted of a steaming chamber with a perforated aluminum sample holder, a digital control system, a relay switch, pressure gauge, pressure valve, safety valve, and water inlet and outlet points. Heat loss was reduced by insulating the parboiling device with a 10 mm layer of polyurethane foam. The digital control system regulated steam temperature. The pressure was controlled with an installed pressure gauge and safety valves.
Following the hydrothermal treatments, 100 g each of the nine rice samples were dried, and their moisture contents determined. Drying was carried out using a hot air oven (VS-120203N, Vision Scientific, Daejeon, Korea) [39] which was also used in moisture content determination [40], using Equations (1)–(3).
M C w b = M C i M C f M C i × 100
M C d b = M C i M C f M C f × 100
Weight loss during drying:
M C f = M C i × 100 × M C w b 100 M C w b
where M C w b is moisture content on a wet basis, M C d b is moisture content on a dry basis, M C i is initial weight, and M C f are final weight.
The dried Japonica rice samples were milled following the method reported in [39]. Milling equipment included a huller (Model SY-88-TH, Ssang Yong, Yongin-si, Korea), abrasive type rice mill (Model TM05, Satake, Hiroshima-ken, Japan), friction type mill (Model SY-92-TR, Ssang Yong, Yongin-si, Korea), and large and small broke separator (Model SY2000-HRG, Ssang Yong, Yongin-si, Korea). The rice yield after milling was calculated as:
Y m i l l i n g = W m . r i c e W p . r i c e × 100
where Ymilling is milled rice yield, W m . r i c e is milled rice weight, and W p . r i c e is the initial weight of Japonica paddy.
Sorting out of foreign materials and other quality control and quality assurance measures followed the mechanical and hydrothermal treatments. The pre-treatment processes undergone by the rice samples are shown in Figure 1.
During the parboiling treatment, the milled rice yield of Japonica rice was tested following an adaptation of the Taguchi method as previously described by Uyeh et al. [38], using three different settings each for moisture, steaming temperature, drying temperature, and duration of treatment (Table 1).

2.2.2. Analysis of the Differences in Nutritional and Physical Properties of Milled Rice Samples

The differences in nutritional and physical properties of untreated Japonica, treated Japonica, and treated Indica rice were measured and analyzed. The properties measured were adhesiveness, amylose content, alkali digestion, nutrients, and color.
a
Analysis of adhesiveness in milled parboiled and non-parboiled rice samples
To measure the adhesiveness of Japonica and Indica rice, 25 g of milled triplicate samples of parboiled and non-parboiled Japonica and parboiled Indica were transferred into 100 mL beakers and placed in a home type rice cooker (DWX-220K, Morningcom, Seoul, Korea). A 40 mL volume of water was immediately transferred into each beaker of the milled rice samples, and the mixtures were stirred to a uniform consistency and evenly spread. The three beakers of samples were then placed into a rice cooker, and 400 g of water was transferred into the cooker’s pot. A thermometer was inserted into the pot to measure the cooking temperature. Twenty minutes after the temperature reached 100 °C or water vapor formed, the rice cooker was turned off and the set-up was allowed to stand for another 10 min. At this point, the rice was considered “cooked” for human consumption. The beakers were then left to stand upside-down (Figure 2) on a flat, straight, and stable surface for one hour [41]. The rice samples that stuck to the beaker were considered to be sticky.
b
Analysis of amylose content in milled parboiled and non-parboiled rice samples
A component analyzer (AN-820, KETT, Tokyo, Japan) was used to determine the amylose content of the milled parboiled Japonica and Indica rice and raw Japonica rice (control) samples. The analyzer was set to the “short-milled rice” option pre-calibrated by the manufacturers before measurement.
c
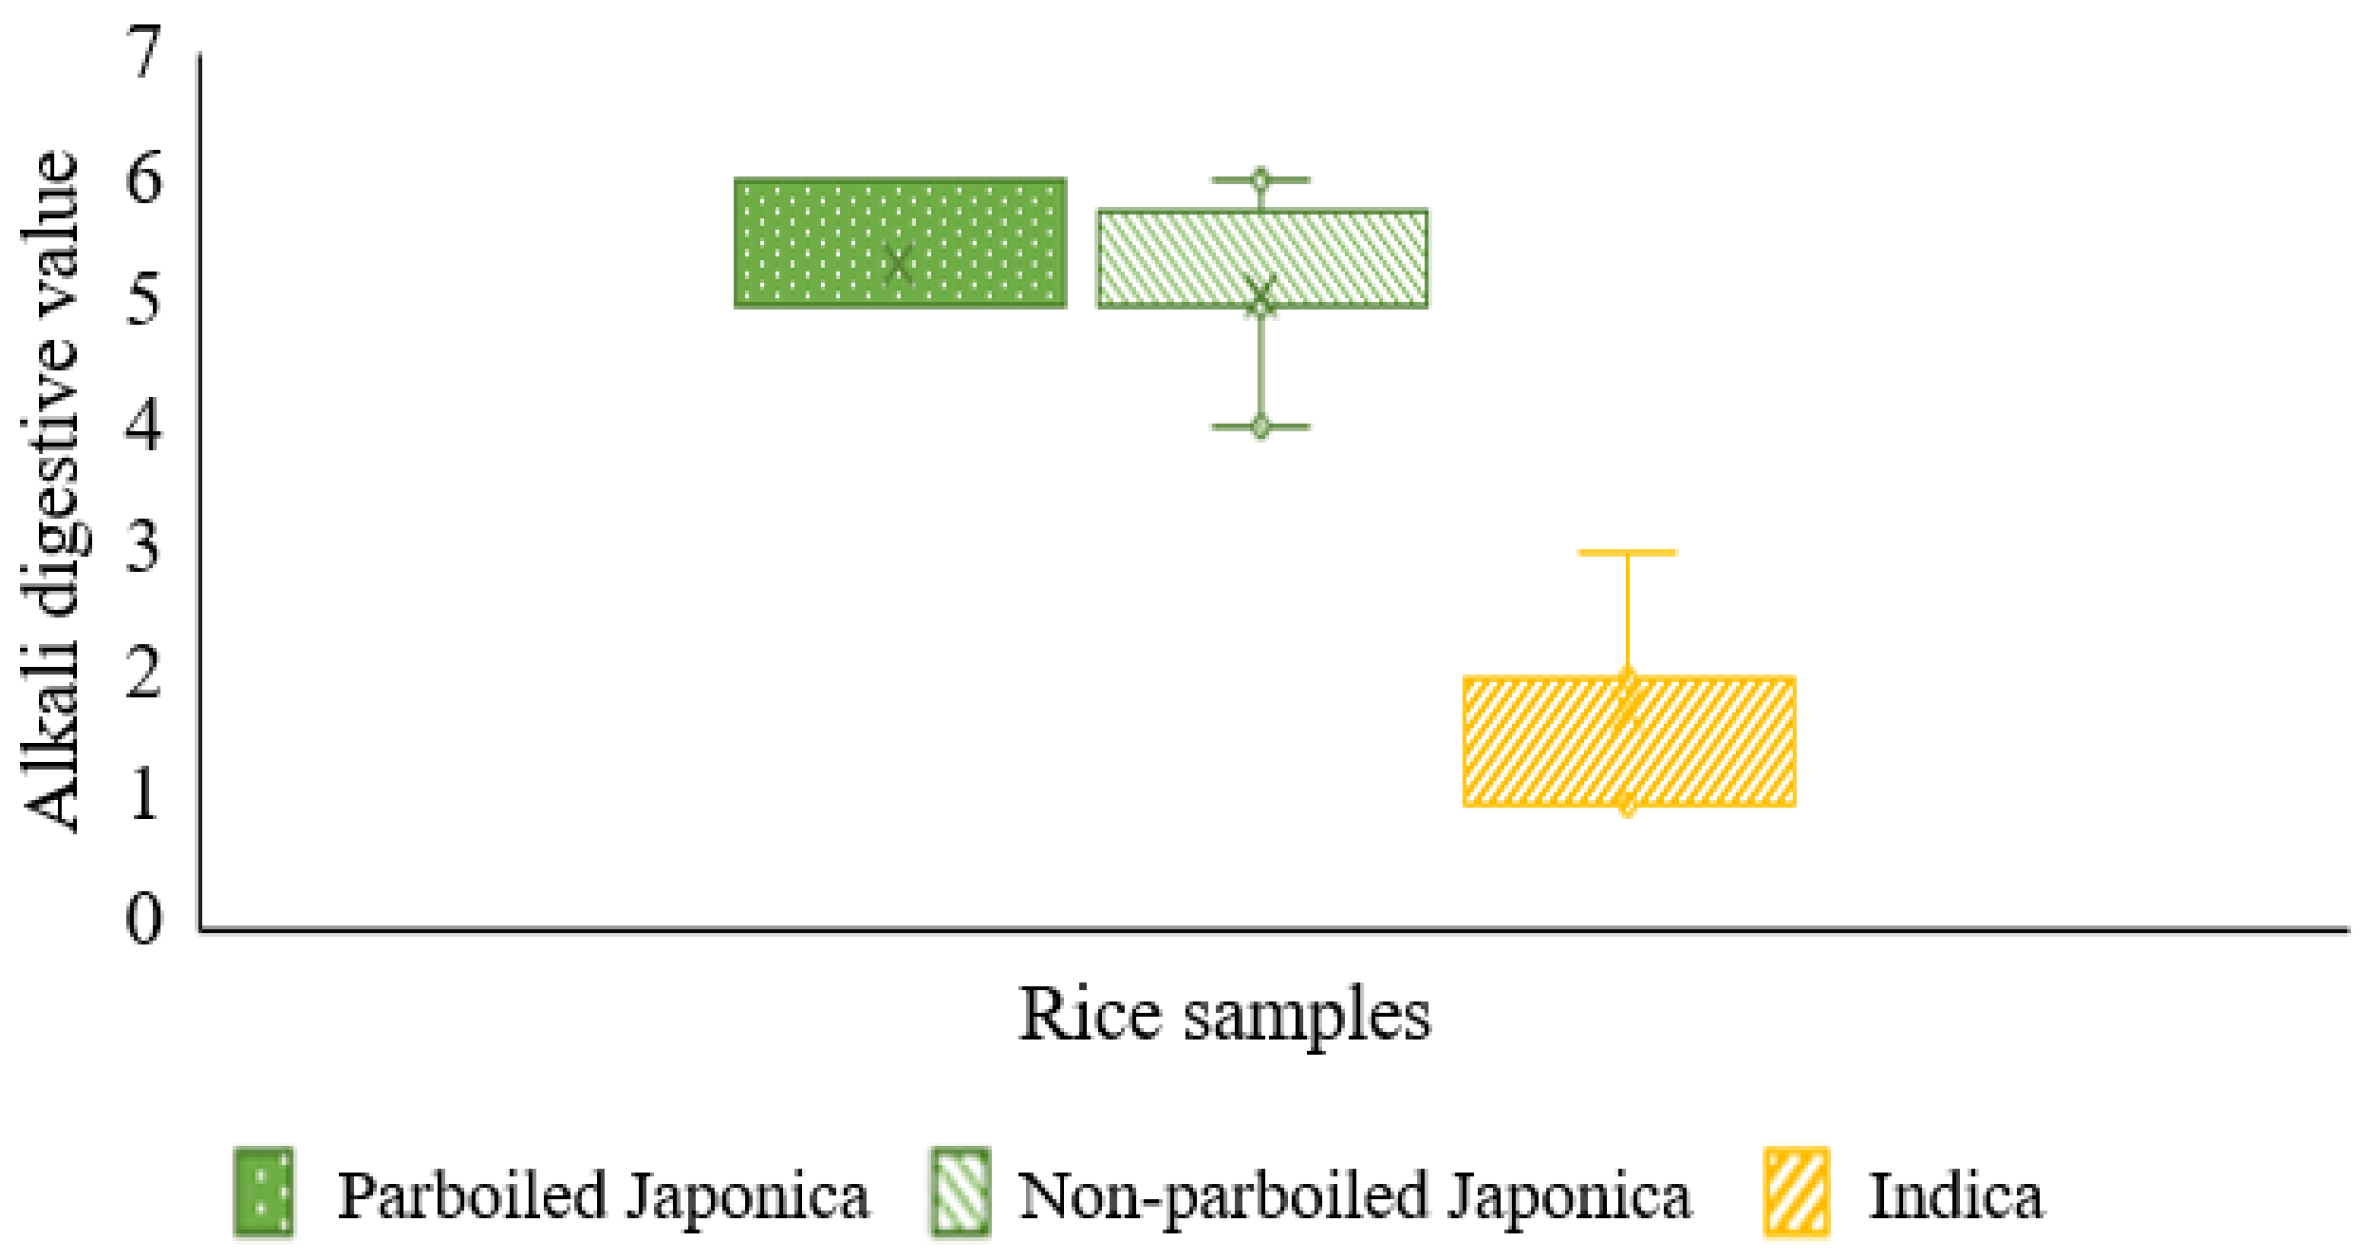
Analysis of alkali digestion in milled parboiled and non-parboiled rice samples
Alkali digestion values of milled rice samples were measured. Twenty-five-gram triplicates of each type of milled rice (Japonica and Indica rice) were placed in Petri dishes (90 × 15 mm diameter) containing 20 mL of 1.4% KOH solution. The grains were allowed to stand at 30 °C for 18 h following Choe and Heu [42]. Alkali digestion was graded from 1 to 7 referencing the seven-point scale of the International Rice Research Institute [43], as shown in Table 2 below.
d
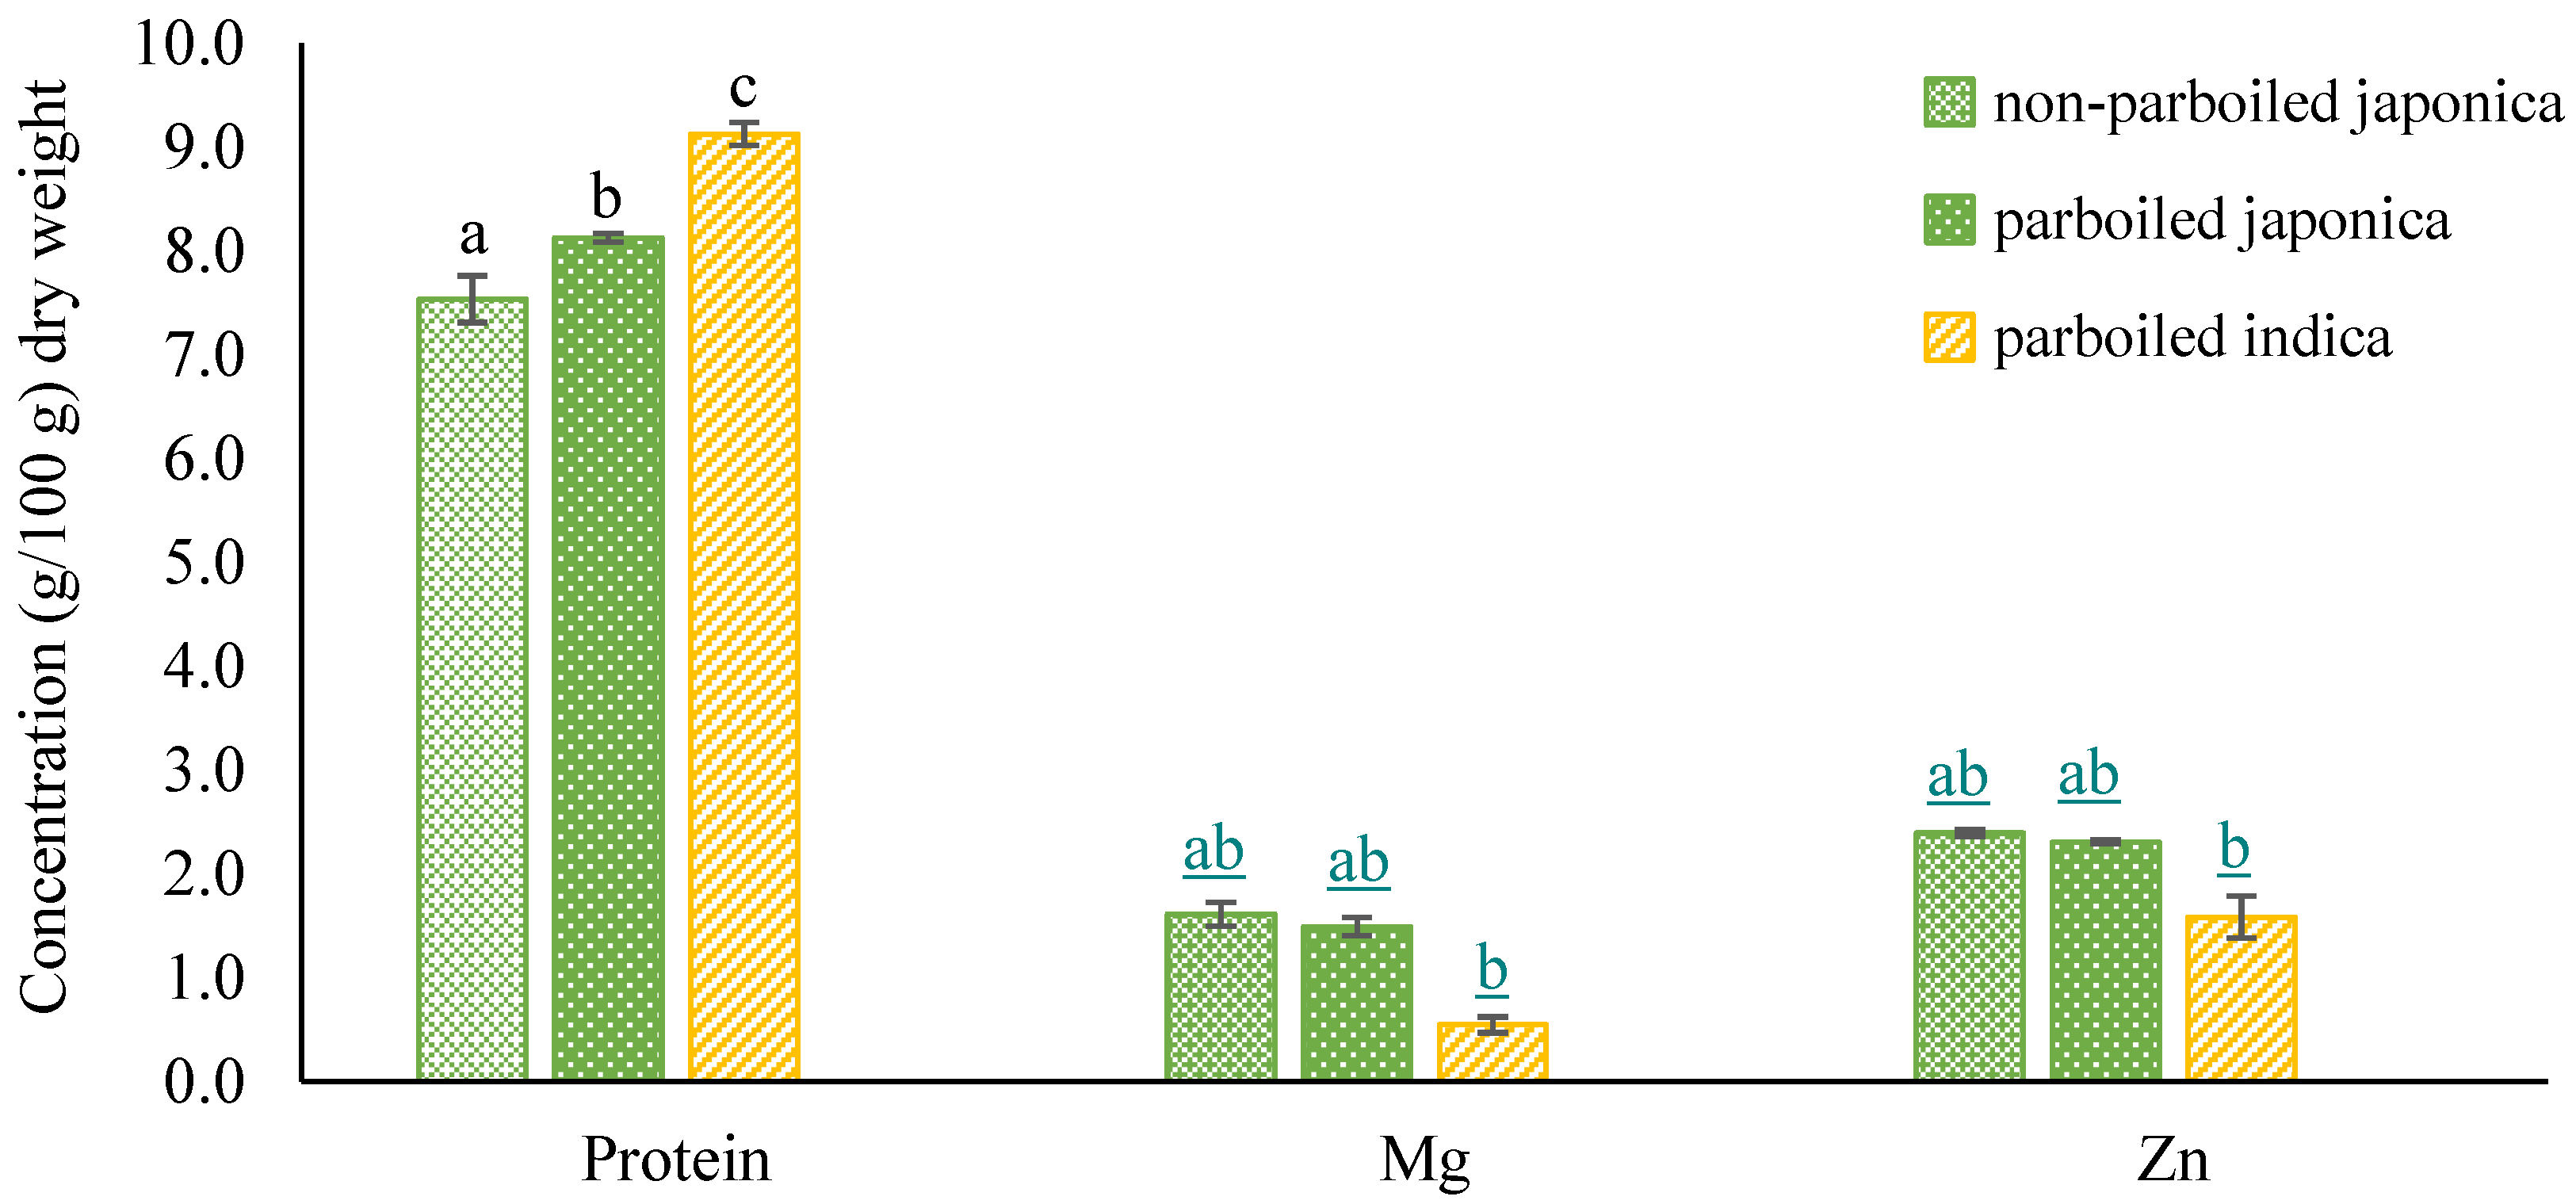
Nutritional analyses of milled parboiled and non-parboiled rice samples
Macronutrient (crude protein, crude fat, crude ash, and carbohydrates) and micronutrient (iron, magnesium, and zinc) contents of the parboiled Japonica rice and Indica rice and untreated Japonica rice were measured on a wet basis using standard methodology as described by the AOAC [44].
e
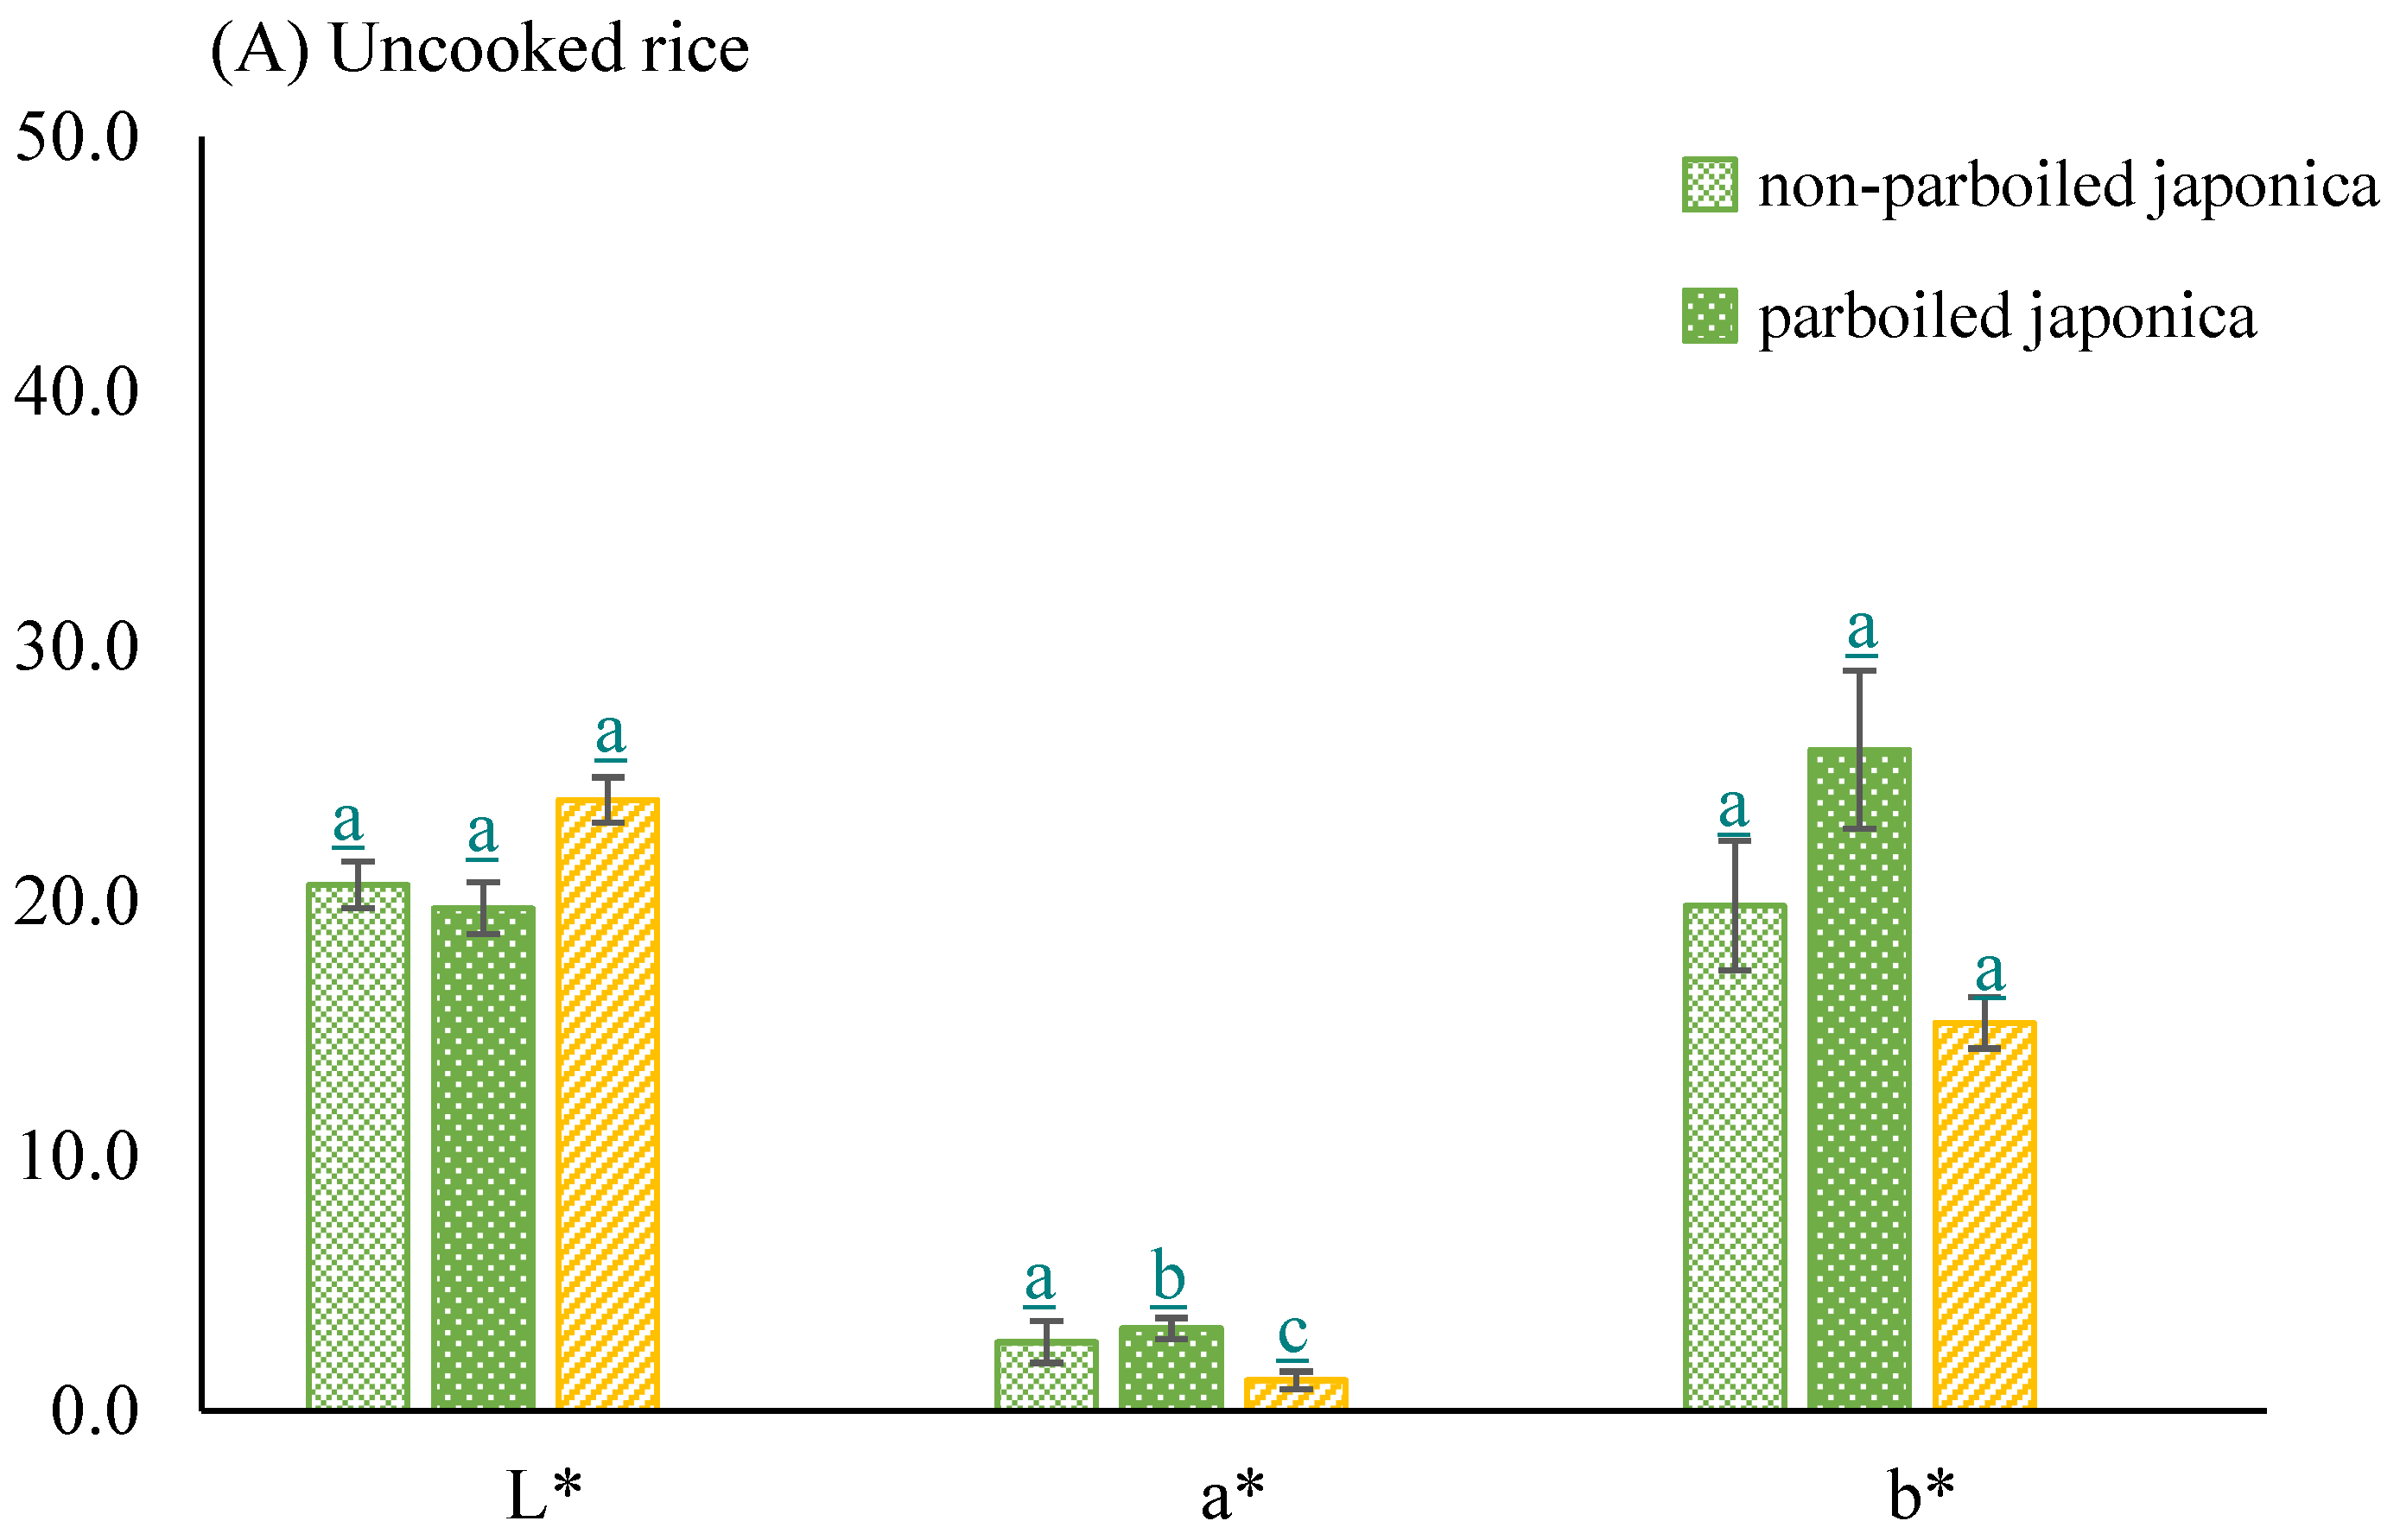
Color measurement of milled parboiled and non-parboiled rice samples
The CIE color scales L*a*b* of cooked and uncooked for Japonica (parboiled and non-parboiled) and rice samples were measured with a reflectance colorimeter (CS-288, Konica Minolta, Tokyo, Japan) and a spectrum resolution of 10 nm. On the CIE color scale, L* indicates the degree of lightness or darkness from perfect black (0) to almost perfect white (100); a* indicates the degree of redness (+) and greenness (−); and b* indicates the degree of yellowness (+) and blueness (−). Calibration of the spectrometer was carried out with a standard white plate of L*a* b*.

2.3. Growing of Japonica Rice and the Environmental Impact

The climatic factors important for Japonica rice cultivation reported in previous studies [45,46,47,48,49] were compared among two countries with the highest global cultivation of this variety (Republic of Korea and Japan) and the three countries with the highest levels of malnutrition globally (India, Bangladesh, and Nigeria). The compared factors were temperature, sunshine, and precipitation. Additionally, data on the impact of cultivating the two major varieties of rice (Indica and Japonica) on the environment were retrieved from published studies, analyzed, and discussed.

2.4. Statistical Analyses

The impacts of moisture content after soaking, steaming temperature, steaming time, and drying temperature on the adhesiveness of Japonica rice were analyzed using the Taguchi orthogonal array in Minitab® Version 14. Using this method, the factors affecting adhesiveness were ranked from 1 to 4, with 1 having the most significant effect and 4, the least, and represented by graphs (Figure A1). Further categorizations were carried out using the signal to noise (S/N) ratio in Equations (5)–(7). The smaller the S/N ratio in Equation (5), the more significant the impact, while the converse was true for Equation (7). For Equation (6), a nominal value was taken as the best indication of a strong impact on adhesiveness.
S/N = −10 × log(Σ(Y2)/n)
where Y is responses for the given factor level combination, and n, the number of responses in the factor level combination.
S/N = −10 × log(s2)
where s is the standard deviation of the responses for all noise factors for the given factor level combination.
S/N = −10 × log(Σ(1/Y2)/n)
where responses for the given factor level combination and number of responses in the factor level combination were Y and n, respectively.
The significant differences (p ≤ 0.05) in measured nutrients among non-parboiled and parboiled Japonica and parboiled Indica rice were assessed using single-factor analysis of variance. Where significant differences were found, mean comparisons were carried out post hoc with Tukey’s honestly significant difference test. The nutrients were protein, fat, carbohydrates, iron (Fe), magnesium (Mg), and zinc (Zn). Ash content was also compared among the rice samples.

3. Results

3.1. Rice Attributes Preferred by Consumers

Survey respondents (n = 1057) lived across the six geopolitical regions of Nigeria and ranged in age from 16 to 61 years, with 44.3% being female and 55.7% male. Their occupations included farming, manufacturing, and service provision. Sixty-eight percent of those surveyed were aware of the different rice varieties, 28% were not, and the remaining 4% were unsure. Respondents showed a varied preference for the rice properties tested; 32.9% were indifferent, 44.9% showed a preference for aroma, and 23.5% strongly preferred rice with aroma (Figure 3A). Generally, a total of 74.4% indicated that the non-adhesive rice was an important preference, with 32.2% indicating that it strongly was (Figure 3B). About 80% of respondents were also willing to pay a moderately higher price for non-adhesive rice (Figure 3C).

3.2. Effects of Parboiling on the Physiochemical Properties of Rice Samples

a
Adhesiveness and amylose content of milled parboiled and non-parboiled rice samples
After one hour of the beakers of cooked rice samples standing upside-down on a flat surface, the contents of the beakers with the parboiled Japonica and Indica rice samples dropped onto the surface (Figure 2). In contrast, the non-parboiled rice sample remained at the bottom of the beaker. Parboiling reduced the adhesiveness of Japonica rice and increased the amylose content at all levels of treatment, as shown in Table 3. The Taguchi orthogonal array results showed that steaming temperature and moisture content after soaking were the factors with the highest impact on the adhesiveness of the parboiled Japonica rice (Figure A1).
b
Alkali digestion in milled parboiled and non-parboiled rice samples
The sample medians were 2, 5, and 5 for Indica (n = 12), parboiled Japonica (n = 12), and non-parboiled Japonica (n = 12), respectively (Figure 4). Both p-values (adjusted and non-adjusted for ties) observed were less than the significance level of 0.05, indicating that the median quality index differed in at least one of the Indica samples, and post hoc tests confirmed this.
c
Nutrient levels observed in milled parboiled and non-parboiled rice samples
The carbohydrate, fat, and ash contents measured in rice samples were comparable in non-parboiled Japonica, parboiled Japonica, and parboiled Indica (Table 4). The concentration of the micronutrient Fe was also similar in the measured rice samples (Table 4). Protein was highest in the parboiled Indica samples and lowest in the non-parboiled Japonica (p ≤ 0.05; Figure 5) at concentrations of 9.1 ± 0.03 g/100 g and 7.5 ± 0.03 g/100 g, respectively. However, magnesium and Zn levels were lowest in the parboiled Indica samples while similar in both Japonica rice samples (p ≤ 0.05; Figure 5). Heinemann et al. [50] reported protein concentrations of 6.85 ± 0.34% and 6.76 ± 0.20% in non-parboiled and parboiled brown rice, respectively, with a moisture content of 12.6 ± 0.54% for non-parboiled and 12.07 ± 0.7% parboiled brown rice.
d
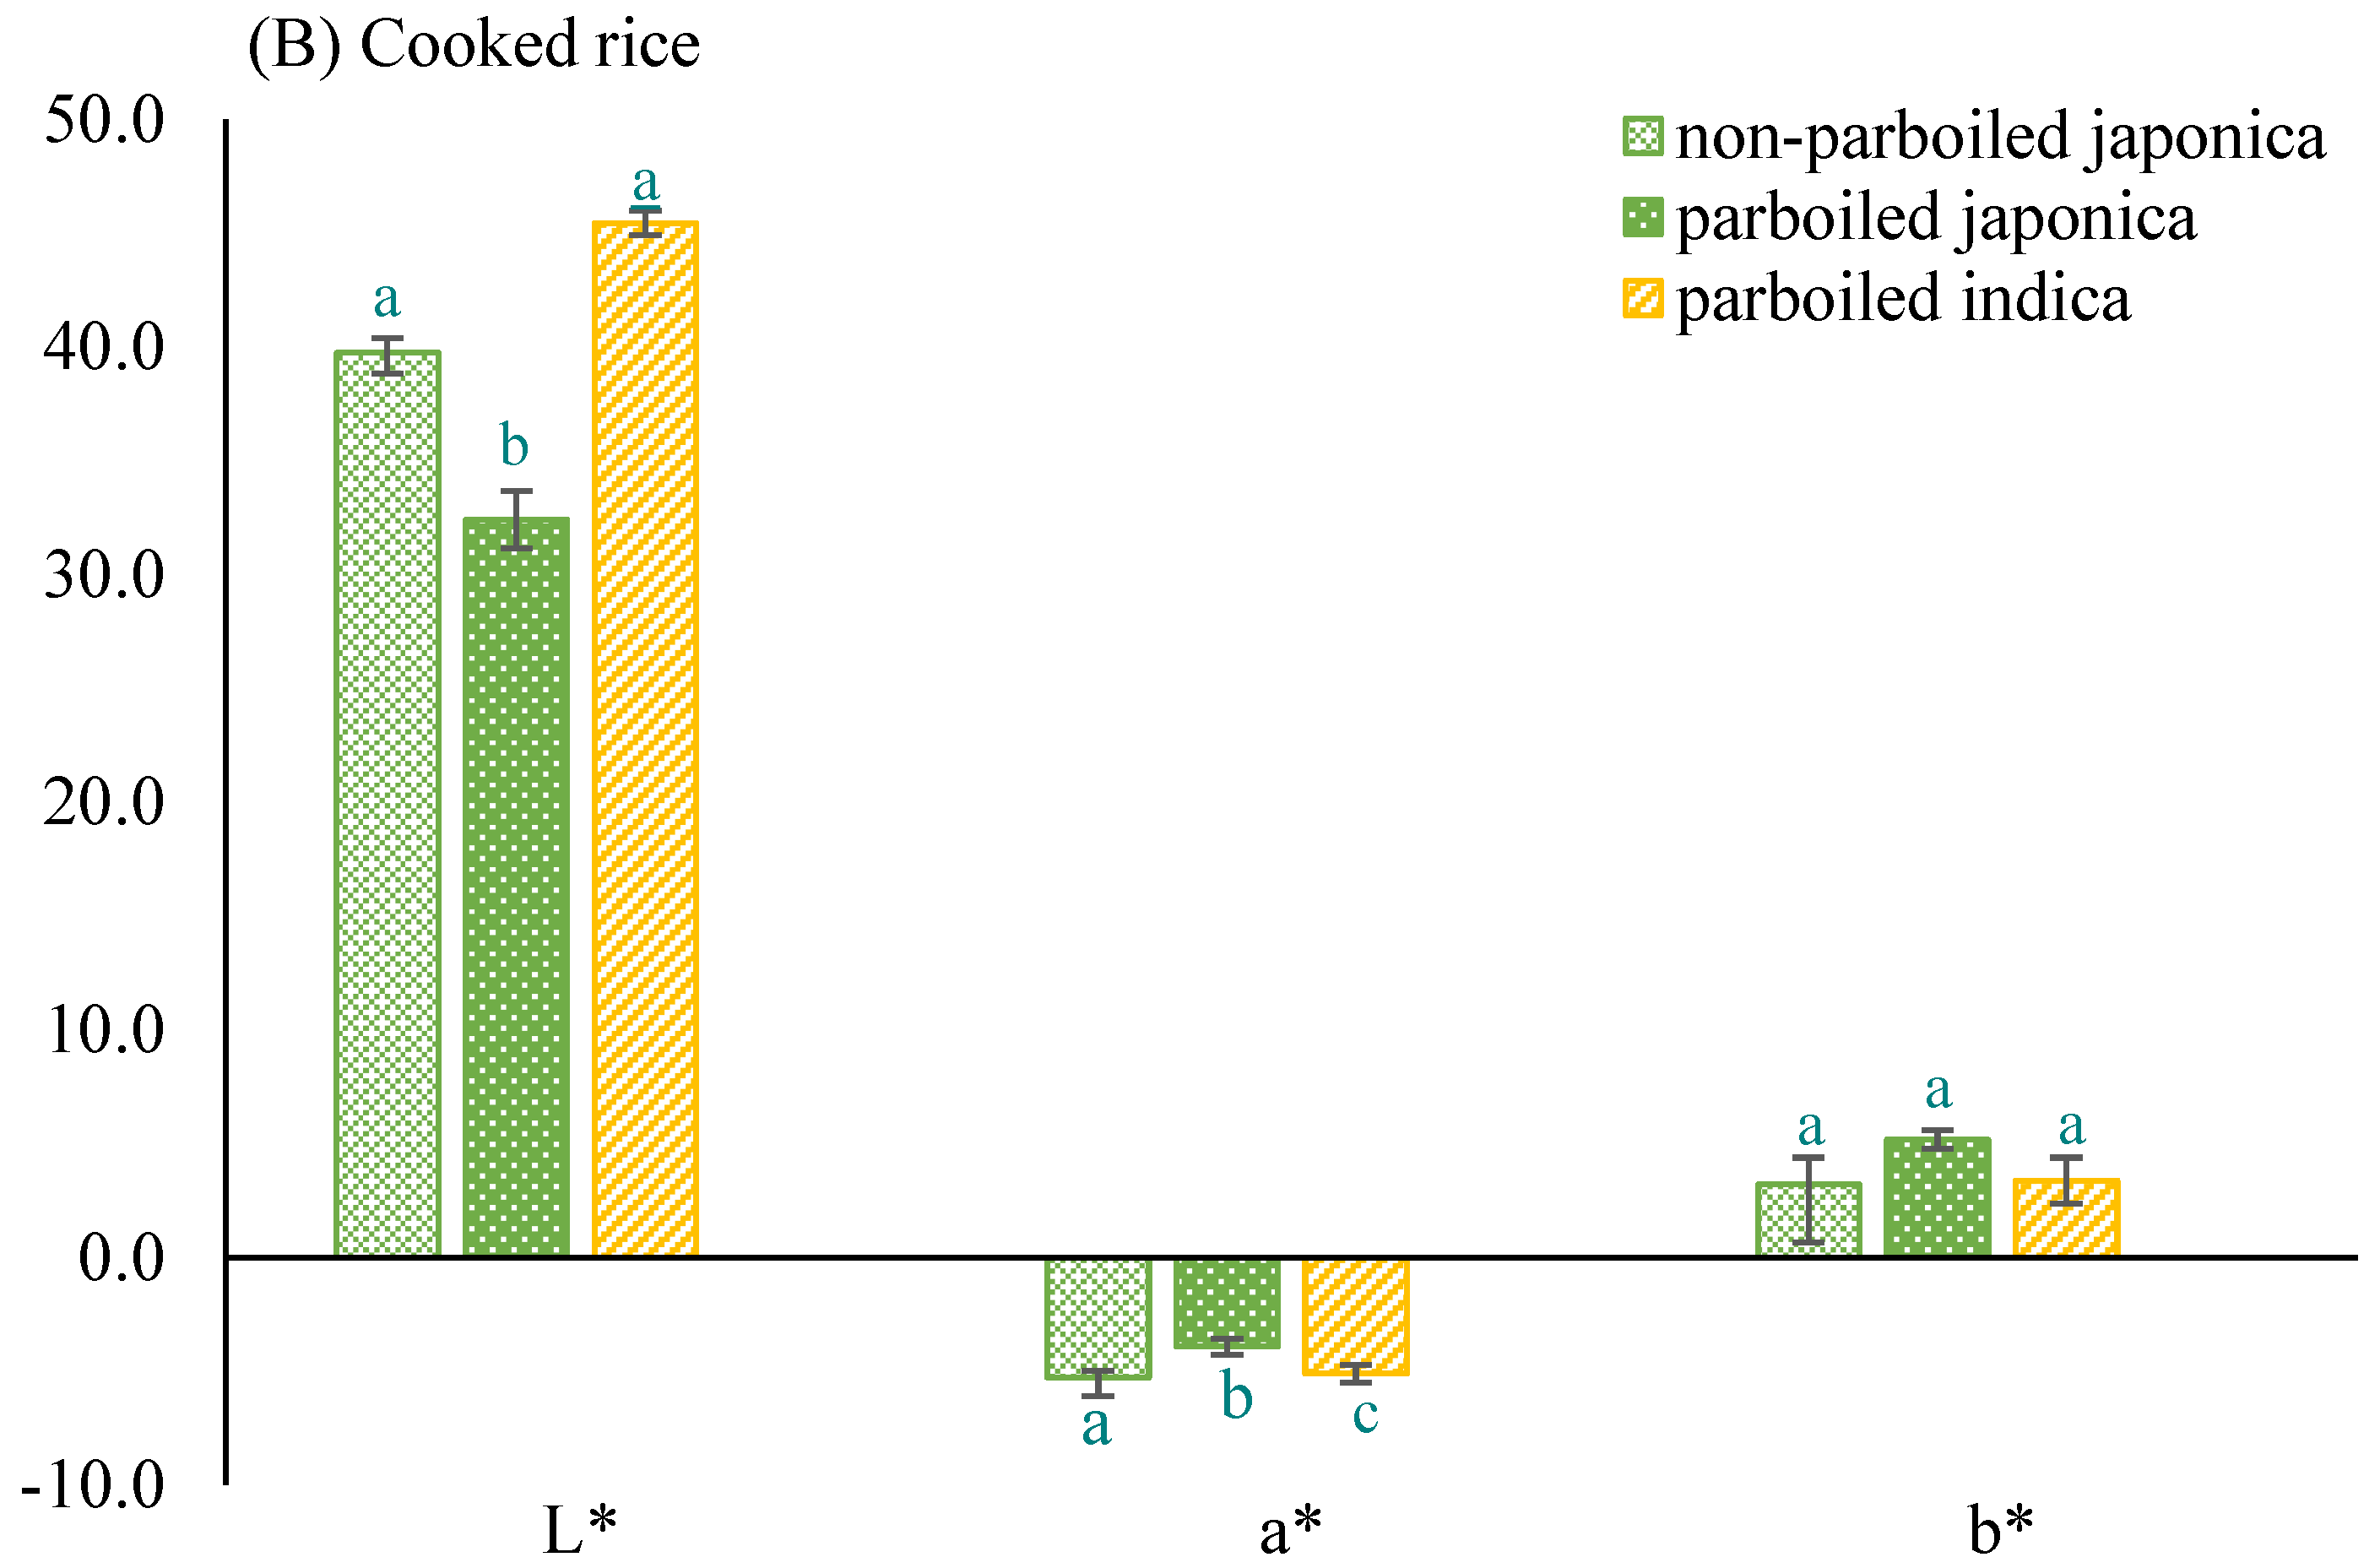
Color of milled parboiled and non-parboiled rice samples
The degrees of whiteness (L) and yellowness (b) were similar among all three uncooked rice sample types. Whiteness values ranged between 18.8 in parboiled Japonica and 24.2 in Indica rice (Figure 6A). The degree of redness was significantly different (p ≤ 0.05) in all three uncooked rice sample types with average values of 1.2 ± 0.35, 2.7 ± 0.82, and 3.22 ± 0.42 for parboiled Indica, non-parboiled Japonica, and parboiled Japonica, respectively. The whiteness increased when samples were cooked with Indica, still scoring the highest at 45.5 ± 0.54, although the differences among all cooked rice types were not statistically significant, p ≤ 0.05 (Figure 6B). Redness changed into greenness in all three samples when cooked, but the differences remained significant (p ≤ 0.05). Redness values recorded were −5.10 ± 0.39, 5.26 ± 0.29, and −3.92 ± 0.34 for parboiled Indica, non-parboiled Japonica, and parboiled Japonica, respectively.

3.3. Growing Conditions of Japonica Rice in Different Rice-Consuming Regions

The climatic factors important for Japonica rice cultivation (temperature, sunshine, and precipitation) which have been reported in previous studies [45,46]. for five countries are presented in Figure 7. The Republic of Korea and Japan are the two countries with the highest global cultivation of Japonica rice. India, Bangladesh, and Nigeria are the three countries with the highest levels of malnutrition globally. Published data on the greenhouse gas impacts of cultivating the two major varieties of rice (Indica and Japonica) were also reviewed and the implications for food-insecure regions are discussed below.

4. Discussion

4.1. Rice Quality Attributes Preferred by Surveyed Consumers and the Effects of Parboiling on Physicochemical Properties

A larger proportion of the Indica rice-consuming population surveyed preferred non-stickiness (non-adhesiveness) and the pleasant aroma of parboiled rice. The survey also showed that the reduced level of adhesiveness and aroma that comes with parboiled rice [50] formed important criteria in determining eating quality. The majority (about 80%) of respondents were willing to pay more for rice that was seen as non-adhesive. The main reasons given by survey respondents for their choices included ease in cooking, taste satisfaction, customs and traditions, and appearance after cooking.
As the parboiling treatment has been demonstrated to alter the physicochemical properties of Japonica rice [50] and optimize rice quality parameters [51,52], the impacts of the parboiling treatment on preferred characteristics were further investigated in Japonica rice.
Amylose content in rice correlates with its adhesiveness and is seen as a very important rice consumption parameter. The Japonica rice variety usually contains low amylose, which is associated with increased adhesiveness. Parboiling increased the amylose content at all level of treatment in this study. Chinnaswamy and Hanna [53] recorded amylose content of 16.1% for non-parboiled Japonica rice (control) and 23.1% for Indica rice. The same study saw elevated rice amylose levels with increasing processing temperature.
Adequate steaming and soaking of rice before parboiling has been shown to eliminate the breakage of rice kernels caused by internal cracks acquired during maturity that are invisible to the naked eye. Soaking enables the void spaces in the hull to be filled with water [54], causing water absorption and subsequent swelling of the starch granules. Furthermore, rapid and uniform water absorption is enabled by soaking [55] and can be controlled with temperature and duration of soaking to achieve the desired moisture content. Similar to soaking, the results of steaming are also dependent on the temperature of the steam and its duration but, in addition, pressure plays a role in the final quality of the steamed paddy [56]. Steaming has also been recorded to greatly impact the final color of the milled rice and the head rice (whole grain) yield because it helps in hardening the rice kernel after soaking [57]. The rice quality from steaming is dependent on the prior soaking process [58]. Improper hydration of the paddy prior to steaming results in a steep moisture gradient from the outer to the inner core layers of the paddy, leading to cracks rather than hardening of the grain [59]. These cracks will result in a substantial loss of head rice. This implies that the two important factors affecting the adhesiveness of the rice also have substantial impacts on the head rice recovery rate.
The average ranks in a Kruskal–Wallis test showed that Indica rice differed the most from the average rank for all observations of alkali digestion and was lower than the overall median. Alkali digestion was inferred to be an influencer of the gelatinization temperature of rice [60].
With the exception of Mg, the chemical components measured in this study were comparable to values reported for other rice varieties [50,51]. In addition to pretreatment, protein and micronutrient concentrations in rice may be attributed to differences in genetic makeup, soil-water nutrient availability, and agronomic conditions during cultivation and harvesting. Conflicting results have been reported by studies of linkages between protein and micronutrient concentrations in rice. In a study of the micronutrient content of 274 milled rice genotypes, Jiang et al. [61] reported significant linkages between rice protein content and the micronutrients Mg and Zn, whereas Yang et al. [62] found no associations in a study of 285 polished rice grain genotypes. In the current study, the Mg and Zn contents were both higher in the Japonica rice samples (Figure 5). This indicated that Japonica rice could be an important source of micronutrients in helping solve hidden hunger.
In terms of visual appeal, rice color is an important measure, as reported in this study’s survey and supported by [63]. White rice was preferred among consumers. The degree of whiteness increased when samples were cooked. Although Indica scored the highest, the differences among all cooked rice types were not statistically significant.

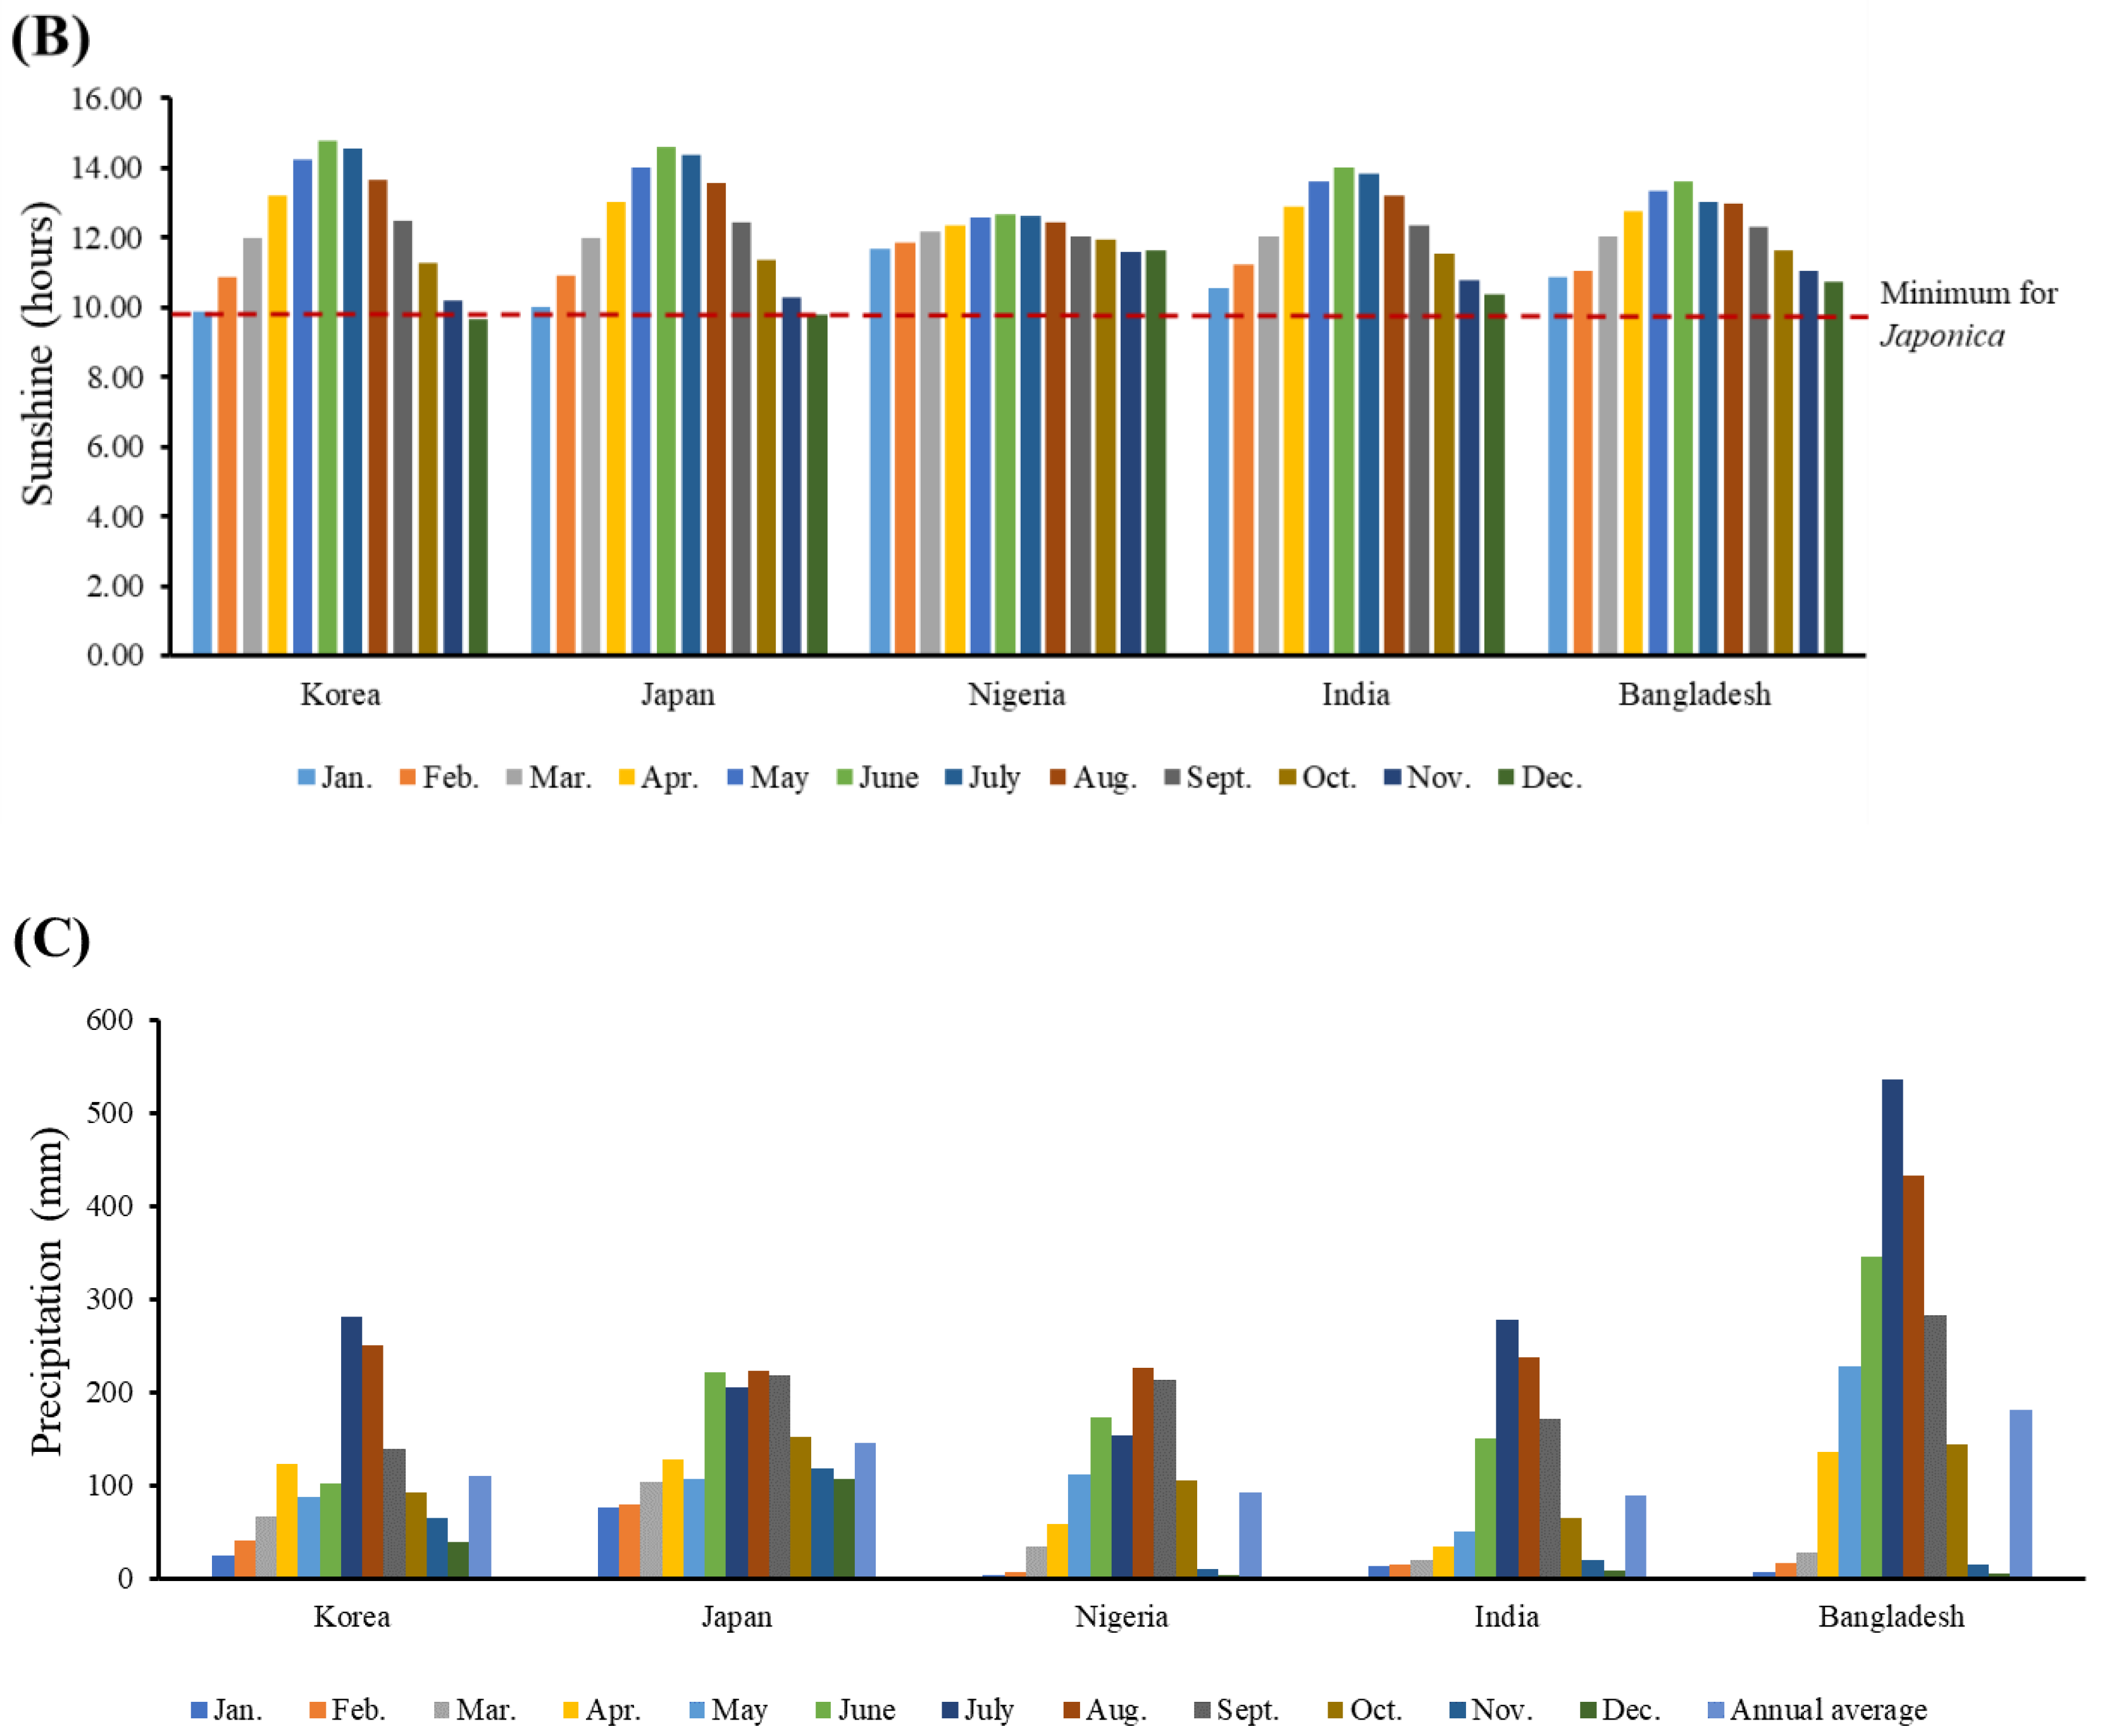
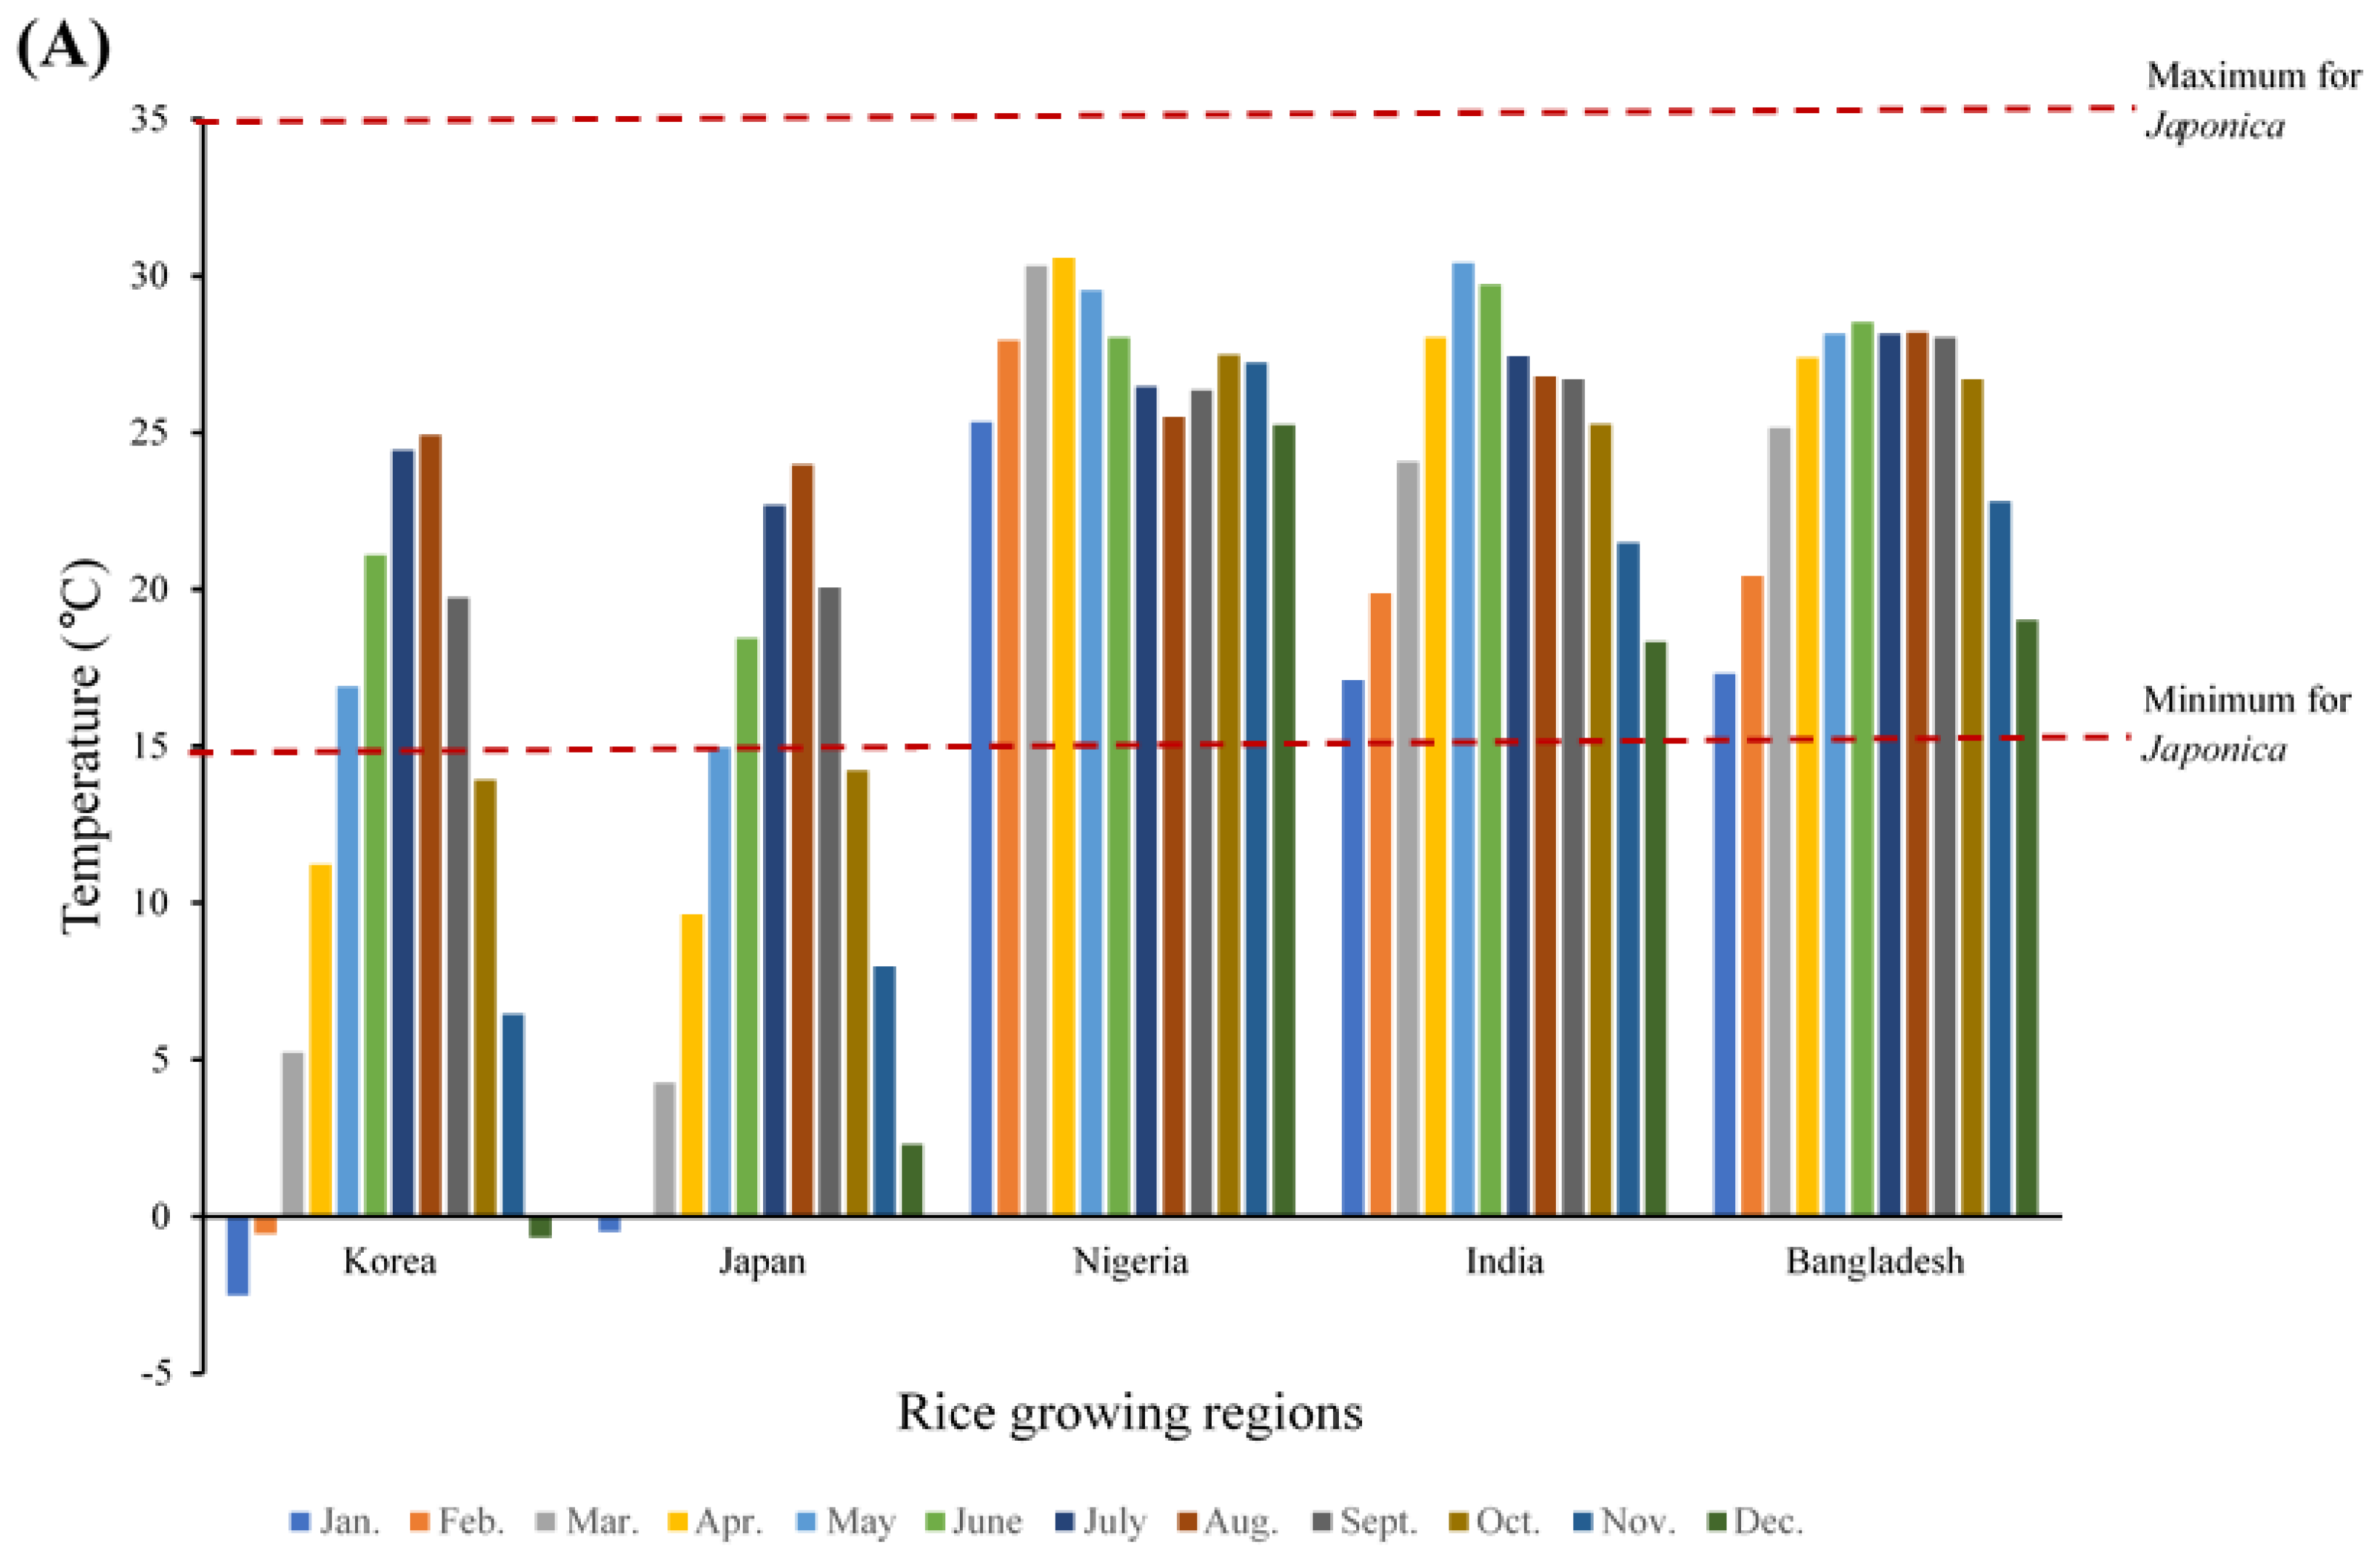
4.2. Growing Conditions Conducive for Japonica Rice in Different Rice-Consuming Regions

Since the domestication of Asian rice, it has been cultivated under diverse agroecological systems to meet different human demands [64,65]. This has resulted in a wide genetic diversity in rice around the world, as shown by molecular tools such as the analysis of restriction fragment length polymorphisms [66], simple sequence repeats [67], and genome-wide single nucleotide polymorphisms [68]. Consequently, many rice varieties with different characteristics have arisen under natural and human selection [69]. Although Japonica and Indica sub-species have been reported to have the same origin [70,71], they have been domesticated under widely different environmental conditions. Rice has evolved into different types, including upland and lowland paddy rice [72], as well as glutinous and non-glutinous rice [73]. Among these, Indica and Japonica rice represent the most important differentiated sub-species. For example, Japonica cultivars are mainly cultivated in temperate environments at high latitudes or altitudes with cool climatic conditions. In contrast, Indica cultivars are usually grown in tropical and sub-tropical regions at low latitudes and altitudes [74].
Indica and Japonica represent two partially isolated gene pools that serve as extremely valuable genetic resources in the improvement of rice varieties [75]. Being adapted to different environments, Indica and Japonica varieties have developed diverse morphological, agronomical, physiological, and molecular characteristics [76] that provide valuable genetic resources for breeding high-yielding rice [76]. Efficient utilization of such resources relies on understanding the genetic differentiation and geographical distribution patterns.
In [77], the relationships between average temperatures (range between 14 °C and 33 °C) at 17 rice cultivating sites with available precipitation and sunlight data and their latitudes (between 2° S to 44.5° N) were analyzed with a general linear model. This was carried out during the rice planting season (April–October) over 30 years (1961–1990). Furthermore, to estimate the relationships between the distribution of Indica, Japonica, and intermediate rice varieties and temperature, the average temperature correlation from nine latitude ranges against the percentage of alleles for every type of rice was analyzed. Results from [76] observed that as the latitude increased, the average temperature during the rice-growing season decreased. The study went on to examine the linkages between temperature and the spatial distribution of the different types of rice (i.e., Indica, Japonica, and intermediate) and found that, up to a point, with increasing temperature (and decreasing latitude), the proportion of Indica rice (in terms of total area cultivated) increased. This increase peaked at around 26 °C (corresponding to 30° N) and thereafter decreased with a further increase in latitudinal temperature, indicating that the distribution of Indica rice was not consistently correlated with the change in temperature. In contrast, Japonica rice varieties from different latitude ranges and their corresponding temperatures showed a negative correlation. This result indicated that Japonica rice, usually grown in temperate regions, is highly sensitive to temperature changes in terms of its geographical distribution across different latitudes.
Japonica rice is prevalently grown under sub-tropical and temperate climatic conditions, but in recent years, new strains have been adapted to tropical conditions and produced in countries such as Thailand and Vietnam. This could imply that the market segmentation into Japonica and Indica rice may become less marked over the longer term, with a larger number of countries able to shift from Indica to Japonica rice varieties or vice versa, as prices change.
Temperature is a major factor for rice cultivation, with its different growth stages varying in requirements. These include temperature for germination as follows: six days at 25 °C and two days at 27 °C to 37 °C. Lower temperatures take longer and the seedlings will not grow when it exceeds 40 °C [77]. At 30–35 °C, the plant height increases, the rate of grain growth is faster, and a shorter grain-filling period occurs [78,79]. In [80], low temperatures were reported to have a significant negative effect on all growth stages of rice of different varieties. In [80], three temperature classes (maximum, minimum, and optimum) for growing Japonica rice varieties were determined using leaf elongation rate. The base temperature (minimum) reported was between 13 °C and 14 °C, the maximum was between 38 °C and 42 °C, and the optimum was between 28 °C and 31 °C in most varieties.
Japonica rice is usually cultivated between May and September in the Republic of Korea and Japan. For five years (2012 to 2016), the temperatures required for rice plant development at different growth stages in the major Japonica rice-cultivating countries were recorded [80]. The Republic of Korea had a mean maximum temperature of 24.9 °C in August and the lowest of 16.9 °C in May (Figure 7A). As May is usually the first month of cultivation, this indicated that the farmers started the planting season in mild temperatures, which is suitable for germination but not necessarily the optimal, as stated above. A similar trend was recorded in Japan, with minimum and maximum mean temperatures ranging from 15.0 °C to 24.0 °C in May and August, respectively (Figure 7A). To achieve better performance, rice cultivation in Korea and Japan generally begins in nurseries with controlled temperatures and seedlings transplanted into fields as the weather warms during the planting season. The high energy costs and associated greenhouse gas contributions would be expected to be higher than in the tropical regions studied where controlled environments are not needed.
The amount of daily sunshine hours in the Republic of South Korea was a minimum of 13.7 h in August and 14.8 h in June, with a similar trend in Japan (Figure 7B). The Republic of South Korea and Japan had average annual precipitation of 109.2 mm and 144.8, respectively, as shown in Figure 7C.
In examining the temperatures in Africa (Figure 7A), the highest mean temperature in Nigeria for a period of five years (2012–2016) was 30.6 °C, and the lowest was 25.5 °C. This fell within the optimal temperature range required for Japonica rice [80]. The lowest and highest mean temperatures between 2012 and 2016 for Bangladesh and India were 17.3 °C and 28.5 °C, and 17.1 °C and 29.7 °C, respectively (Figure 7A). These data show a favorable climate for growing Japonica rice year-round in these countries with the world’s largest populations of resource-poor and malnourished people.
Furthermore, Japonica rice could be cultivated at least twice a year in a four-month cultivation cycle in tropical countries. In [81], it was reported that more sunlight would improve the productivity of the rice. Rice is recorded to need 9–12 h of light daily [81], but no specific amounts have been given for Japonica rice to the authors’ knowledge. Bangladesh, India, and Nigeria had the required amount of daily sunlight for rice growth all year round, as shown in Figure 7B. The only constraint in cultivating Japonica rice year-round in the high rice-consuming countries with vulnerable people might be the availability of water (Figure 7C). This problem could be mitigated by constructing dams and storing water during the peak raining periods for irrigation.

4.3. The Potential Contribution of Japonica Varieties to Greenhouse Gas Reduction

Agriculture had an estimated emission of 5.1 to 6.1 carbon dioxide equivalents per year (Gt CO2-eq/yr) in 2005. This is 10–12% of the global GHG total. Furthermore, about 60% and 50% of N2O and CH4, respectively, of global anthropogenic emissions came from agriculture [82]. Growing rice contributes 25–300 Tg/year, amounting to 10–20% of global methane emissions [83]. In [84,85], South East Asia, where Indica rice is massively cultivated, emitted about 10,000 kg of methane per square kilometer, contributing about 90% of the global total methane emissions from rice cultivation. Methane, a potent greenhouse gas, is produced in enormous quantities by bacteria in waterlogged rice fields through anaerobic decomposition of organic material. Nitrous oxide, a powerful greenhouse gas, is also produced by soil microbes in rice fields, but its impact on global warming has been given lesser attention than CH4 emissions from rice fields. The intensity of N2O emissions is related to nitrogen (N) fertilizer application rates [86].
Worldwide measurements show that there are large temporal variations in CH4 fluxes, and these differ distinctly with soil type and texture and the application of organic matter and mineral fertilizer [87]. The reduction in CO2 with H2, fatty acids, or alcohols as hydrogen donors, and the transmethylation of acetic acid or methanol by methane-producing bacteria, are the major pathways of CH4 production in flooded soils. In paddy fields, the kinetics of the reduction processes are strongly affected by the composition and texture of soil and its content of inorganic electron acceptors [88].
There are three main processes of CH4 release into the atmosphere from rice fields: diffusion loss of CH4 across the water surface (least significant), as bubbles (ebullition) from paddy soils (important during land clearing and especially if the soil texture is not clayey), and CH4 transport through rice plants. Plant transport of methane is the most critical loss mechanism, with more than 90% of total CH4 emitted during the cropping season being released by diffusive or lacunae transport through the aerenchyma system of the rice plants [89,90]. Rice plants develop an intercellular gas space system, the aerenchyma, which provides roots submerged in inundated soils with oxygen (O2). This gas space system also enables the transport of other gases, including CH4, N2O, and carbon dioxide (CO2), from the soil/sediment to the atmosphere. Consequently, the variation among rice varieties with different growth and developmental progress could result in differences in total GHG emissions among rice varieties [91].
The increasing demand for rice in the future has raised concerns about increasing GHG emissions [92,93]. Considering the importance of rice as a staple food crop which provides more calories to the global population than any other single crop, the cultivation of more climate-friendly varieties would help mitigate the impacts of greenhouse warming that might be associated with increased production.
In [89], substantial differences were observed in the impacts of rice variety type on greenhouse gas emissions, rice yield, and global warming potential (GWP). The CH4 and N2O emissions were 6356 and 267 kg CO2e/ha for Indica rice varieties and 4845 and 295 kg CO2e/ha for Japonica rice varieties, respectively. A statistically significant higher yield-scaled GWP occurred in Indica rice varieties (1101.72 kg CO2e/ha) than Japonica rice varieties (711.38 kg CO2e/ha), indicating that the Japonica rice varieties released less GHGs with higher yields. The inverse relationship between rice yield increases and GHG emission reductions will aid cropping technique innovation for rice production in achieving higher yield while lowering emissions.

5. Conclusions

Parboiling retained the micronutrient profile of the treated Japonica rice, indicating that it could be a potential solution to hidden hunger in rice-consuming countries. Adhesiveness was also reduced in treated Japonica rice, thereby providing a quality that most survey respondents found to be desirable. The increasing human population is expected to increase rice demand worldwide. With higher yields, the cultivation of Japonica rice varieties will likely have lower GHG emissions compared to Indica. With Japonica rice being more affected by temperature than geography, parts of Africa, India, and Bangladesh would have conducive weather for growing it. The adoption of the more nutritious higher-yielding Japonica rice has the potential to help strengthen global food security and reduce hidden hunger, particularly in the world’s five most impoverished countries, while also reducing the GHG emissions of global rice cultivation.

Author Contributions

D.D.U.: Conceptualization, Methodology, Software, Investigation, Formal analysis, Data Curation, Visualization, and Writing—original draft. S.A.-H.: Methodology, Software, Data Analysis, Visualization, and Writing. T.P., Y.H.: Investigation, Validation, Resources, Writing—review and editing, Project administration, Supervision, and Funding acquisition. K.-M.K., A.M., and S.W.: Methodology, Investigation, and Data Curation. All authors have read and agreed to the published version of the manuscript.

Funding

This work was supported by Korea Institute of Planning and Evaluation for Technology in Food, Agriculture and Forestry (IPET) through Agriculture, Food and Rural Affairs Convergence Technologies Program for Educating Creative Global Leader, funded by Ministry of Agriculture, Food and Rural Affairs (MAFRA), Project Nos. (320001-4) and (716001-7), Republic of Korea.

Data Availability Statement

The data presented in this study are available in the article.

Conflicts of Interest

The authors declare no conflict of interest.

Appendix A

Figure A1. Main effects plot (data means) for SN ratios showing factors with the most impact on adhesiveness of Japonica rice: (A) moisture content, (B) steaming temperature, (C) steaming time, (D) drying temperature.
Foods 10 01869 g0a1

Appendix B

  • (Survey Questionnaire)
Personal Data
  • Age:
  • Gender:
  • Occupation:
  • Country of residence:
  • State of residence:
Survey questions
1.
Do you know there are varieties of rice? Yes/No/Not sure
a.
If yes, what type(s):
b.
Which of the above type do you prefer?
2.
The length of rice is important to me.
(a) Strongly Agree (b) Agree (c) Neither Agree nor Disagree (d) Disagree (e) Strongly Disagree
3.
Why is the length of rice important to you?
4.
Adhesiveness (stickiness) of rice is important to me.
(a) Strongly Agree (b) Agree (c) Neither Agree nor Disagree (d) Disagree (e) Strongly Disagree
5.
Why is the adhesiveness of rice important to you?
6.
Why is the adhesiveness of rice not important to you?
7.
The aroma of rice is important to me.
(a) Very Important (b) Important (c) Neither Important nor Unimportant (d) Unimportant (e) Very Unimportant
8.
The price of rice is important in your decision for selecting the brand of rice to buy.
(a) Very Important (b) Important (c) Neither Important nor Unimportant (d) Unimportant (e) Very Unimportant
9.
What do you look out for when selecting rice? (Multiple selections is applicable)
(a) Rice brand (b) Length of the grain (c) Adhesiveness after cooking (d) Aroma (e) Price (f) Others (please list)
10.
What is the maximum you could pay extra per 10kg bag of rice if you knew it was healthier?
(a) Less than ₦1000 (b) ₦1000–2000 (c) ₦3000–4000 (d) More than ₦5000
11.
Which source of rice do you prefer?
(a) Foreign (b) Local (c) Any
12.
Why do you prefer your option in question 11 above?

References

  1. Katayama, R.; Wadhwa, D. Half of the World’s Poor Live in Just 5 Countries. Available online: https://blogs.worldbank.org/opendata/half-world-s-poor-live-just-5-countries (accessed on 1 August 2021).
  2. Index Mondi. Milled Rice Domestic Consumption by Country in 1000 MT—Country Rankings. 2021. Available online: https://www.indexmundi.com/agriculture/?commodity=milled-rice&graph=domestic-consumption (accessed on 1 August 2021).
  3. FAOSTAT. Countries by Commodity. Available online: http://www.fao.org/faostat/en/#rankings/countries_by_commodity_imports (accessed on 1 August 2021).
  4. World Bank. Nutrition Country Profiles. Available online: https://www.worldbank.org/en/topic/health/publication/nutrition-country-profiles (accessed on 1 August 2021).
  5. FAO. The State of Food Security and Nutrition in the World 2019. Available online: http://www.fao.org/3/ca5162en/ca5162en.pdf (accessed on 1 August 2021).
  6. FAO. The State of Food Security and Nutrition in the World 2021. Available online: http://www.fao.org/state-of-food-security-nutrition (accessed on 1 August 2021).
  7. Von Grebmer, K.; Bernstein, J.; Prasai, N.; Yin, S.; Yohannes, Y.; Towey, O.; Sonntag, A.; Neubauer, L.; de Waal, A. The Concept of the Global Hunger Index; IFPRI: Washington, DC, USA, 2015; pp. 6–11. [Google Scholar]
  8. Bhutta, Z.A. Micronutrient needs of malnourished children. Curr. Opin. Clin. Nutr. Metab. Care 2008, 11, 309–314. [Google Scholar] [CrossRef]
  9. Fraser, D.R. Vitamin D-deficiency in Asia. J. Steroid Biochem. Mol. Biol. 2004, 89, 491–495. [Google Scholar] [CrossRef]
  10. Chadha, M.; Oluoch, M. Home-based vegetable gardens and other strategies to overcome micronutrient malnutrition in developing countries. Food Nutr. Agric. 2003, 32, 17–23. [Google Scholar]
  11. Chauhan, B.S.; Jabran, K.; Mahajan, G. Rice Production Worldwide; Springer: Berlin/Heidelberg, Germany, 2017; Volume 247. [Google Scholar]
  12. OECD. OECD-FAO Agricultural Outlook 2019–2028; OECD: Paris, France, 2019.
  13. Kubo, M.; Purevdorj, M. The future of rice production and consumption. J. Food Distrib. Res. 2004, 35, 128–142. [Google Scholar]
  14. Olivier, J.G.; Schure, K.; Peters, J. Trends in Global CO2 and Total Greenhouse Gas Emissions; PBL Netherlands Environmental Assessment Agency: The Hague, The Netherlands, 2017. [Google Scholar]
  15. World Bank. Land under Cereal Production. Available online: https://data.worldbank.org/indicator/AG.LND.CREL.HA (accessed on 1 August 2021).
  16. Statista. Available online: https://www.statista.com/topics/1443/rice/ (accessed on 1 August 2021).
  17. Singh, M.; Upadhyaya, H.D. Genetic and Genomic Resources for Grain Cereals Improvement; Academic Press: Cambridge, MA, USA; Elsevier: Amsterdam, The Netherlands, 2015. [Google Scholar]
  18. Seck, P.A.; Tollens, E.; Wopereis, M.C.; Diagne, A.; Bamba, I. Rising trends and variability of rice prices: Threats and opportunities for sub-Saharan Africa. Food Policy 2010, 35, 403–411. [Google Scholar] [CrossRef]
  19. Lançon, F.; Benz, H.D. Rice Imports in West Africa: Trade Regime and Food Policy Formulation; Flançon and H.David-Benz: Montpellier, France, 2007. [Google Scholar]
  20. United Nations. Coronavirus: World Risks ‘Biblical’ Famines Due to Pandemic. Available online: https://www.bbc.com/news/world-52373888 (accessed on 1 August 2021).
  21. Cadoni, P.; Angelucci, F. Analysis of incentives and disincentives for Rice in Nigeria. Gates Open Res. 2019, 3, 643. [Google Scholar]
  22. Linares, O.F. African rice (Oryza glaberrima): History and future potential. Proc. Natl. Acad. Sci. USA 2002, 99, 16360–16365. [Google Scholar] [CrossRef] [PubMed] [Green Version]
  23. NRC. Lost Crops of Africa: Volume I: Grains; National Academies Press: Cambridge, MA, USA, 1996. [Google Scholar]
  24. OECD-FAO. Cereals. In Agricultural Outlook; OECD: Paris, France, 2018; pp. 109–125. Available online: http://www.fao.org/3/i9166e/i9166e_Chapter3_Cereals.pdf (accessed on 1 August 2021).
  25. Champagne, E.T.; Bett-Garber, K.L.; Fitzgerald, M.A.; Grimm, C.C.; Lea, J.; Ohtsubo, K.i.; Jongdee, S.; Xie, L.; Bassinello, P.Z.; Resurreccion, A. Important sensory properties differentiating premium rice varieties. Rice 2010, 3, 270–281. [Google Scholar] [CrossRef] [Green Version]
  26. Yanjie, X.; Yining, Y.; Shuhong, O.; Xiaoliang, D.; Hui, S.; Shukun, J.; Shichen, S.; Jinsong, B. Factors affecting sensory quality of cooked japonica rice. Rice Sci. 2018, 25, 330–339. [Google Scholar] [CrossRef]
  27. Odenigbo, A.M.; Ngadi, M.; Ejebe, C.; Woin, N.; Ndindeng, S.A. Physicochemical, cooking characteristics and textural properties of TOX 3145 milled rice. J. Food Res. 2014, 3, 82. [Google Scholar] [CrossRef] [Green Version]
  28. Chemutai, L.; Musyoki, M.; Kioko, W.; Mwenda, N.; Muriira, K.; Piero, N. Physicochemical characterization of selected Rice (Oryza Sativa L.) genotypes based on gel consistency and alkali digestion. Anal. Biochem. 2016, 5, 285. [Google Scholar] [CrossRef] [Green Version]
  29. Okadome, H. Application of instrument-based multiple texture measurement of cooked milled-rice grains to rice quality evaluation. Jpn. Agric. Res. Q. JARQ 2005, 39, 261–268. [Google Scholar] [CrossRef] [Green Version]
  30. Oli, P.; Ward, R.; Adhikari, B.; Torley, P. Parboiled rice: Understanding from a materials science approach. J. Food Eng. 2014, 124, 173–183. [Google Scholar] [CrossRef]
  31. Mir, S.A.; Bosco, S.J.D. Effect of soaking temperature on physical and functional properties of parboiled rice cultivars grown in temperate region of India. Food Nutr. Sci. 2013, 4, 282. [Google Scholar] [CrossRef] [Green Version]
  32. Bello, M.; Baeza, R.; Tolaba, M. Quality characteristics of milled and cooked rice affected by hydrothermal treatment. J. Food Eng. 2006, 72, 124–133. [Google Scholar] [CrossRef]
  33. da Fonseca, F.A.; Soares Júnior, M.S.; Caliari, M.; Bassinello, P.Z.; da Costa Eifert, E.; Garcia, D.M. Changes occurring during the parboiling of upland rice and in the maceration water at different temperatures and soaking times. Int. J. Food Sci. Technol. 2011, 46, 1912–1920. [Google Scholar] [CrossRef]
  34. Miah, M.K.; Haque, A.; Douglass, M.P.; Clarke, B. Parboiling of rice. Part II: Effect of hot soaking time on the degree of starch gelatinization. Int. J. Food Sci. Technol. 2002, 37, 539–545. [Google Scholar] [CrossRef]
  35. Juliano, B.O. The rice grain and its gross composition. In Rice: Chemistry and Technology; American Association of Cereal Chemists: St. Paul, MN, USA, 1985. [Google Scholar]
  36. Pedersen, B.; Eggum, B. The influence of milling on the nutritive value of flour from cereal grains. 4. Rice. Plant Foods Hum. Nutr. 1983, 33, 267–278. [Google Scholar] [CrossRef]
  37. Adhikari, B.; Howes, T.; Bhandari, B.; Truong, V. Stickiness in foods: A review of mechanisms and test methods. Int. J. Food Prop. 2001, 4, 1–33. [Google Scholar] [CrossRef]
  38. Uyeh, D.D.; Woo, S.M.; Hong, D.H.; Ha, Y.S. Optimization of parboiling conditions for enhanced Japonica rice milling. Emir. J. Food Agric. 2016, 28, 764–771. [Google Scholar] [CrossRef] [Green Version]
  39. Ha, Y.; Park, K.; Kim, H.; Hong, D.; Nah, K.; Seo, S. Milled rice recovery rate of paddy with various moisture contents. J. Korean Soc. Agric. Mach. 2002, 27, 125–132. [Google Scholar]
  40. Tang, J.; Sokhansanj, S. Determination of moisture content of whole kernel lentil by oven method. Trans. ASAE 1991, 34, 255–0256. [Google Scholar] [CrossRef]
  41. Sonsanguan, N.; Sirisomboon, P. Determination of stickiness characteristic of cooked rice samples in rice industry. In Proceedings of the 14th TSAE National Conference and the 6th TSAE International Conference, Hua Hin, Thailand, 1–4 April 2013; pp. 151–153. [Google Scholar]
  42. Choe, Z.R.; Heu, M.H. Optimum conditions for alkali digestibility test in rice. J. Korean Crop. Soc. 1975, 19, 7–13. [Google Scholar]
  43. IRRI. Standard Evaluation System for Rice; IRRI: Los Baños, Philippines, 1996. [Google Scholar]
  44. AOAC. Official Methods of Analysis, 21st ed.; AOAC: Rockville, MD, USA, 2019. [Google Scholar]
  45. Cordero-Lara, K.I. Temperate japonica rice (Oryza sativa L.) breeding: History, present and future challenges. Chil. J. Agric. Res. 2020, 80, 303–314. [Google Scholar] [CrossRef]
  46. Dhanushka Perera, J. Analysis of the Variability of Cardinal Temperatures in Rice; UM2: 2011. Available online: https://agritrop.cirad.fr/570279/1/document_570279.pdf (accessed on 1 April 2021).
  47. Hu, Y.-J.; Pei, W.; Zhang, H.-C.; Dai, Q.-G.; Huo, Z.-Y.; Ke, X.; Hui, G.; Wei, H.-Y.; Guo, B.-W.; Cui, P.-Y. Comparison of agronomic performance between inter-sub-specific hybrid and inbred japonica rice under different mechanical transplanting methods. J. Integr. Agric. 2018, 17, 806–816. [Google Scholar] [CrossRef] [Green Version]
  48. Huang, Y.; Gao, L.; Jin, Z.; Chen, H. Simulating the optimal growing season of rice in the Yangtze River Valley and its adjacent area, China. Agric. For. Meteorol. 1998, 91, 251–262. [Google Scholar] [CrossRef]
  49. Ueno, K.; Miyoshi, K. Difference of optimum germination temperature of seeds of intact and dehusked japonica rice during seed development. Euphytica 2005, 143, 271–275. [Google Scholar] [CrossRef]
  50. Heinemann, R.J.B.; Fagundes, P.d.L.; Pinto, E.A.; Penteado, M.d.V.C.; Lanfer-Marquez, U. Comparative study of nutrient composition of commercial brown, parboiled and milled rice from Brazil. J. Food Compos. Anal. 2005, 18, 287–296. [Google Scholar] [CrossRef]
  51. Adu-Kwarteng, E.; Ellis, W.O.; Oduro, I.; Manful, J.T. Rice grain quality: A comparison of local varieties with new varieties under study in Ghana. Food Control 2003, 14, 507–514. [Google Scholar] [CrossRef]
  52. Islam, M.R.; Roy, P.; Shimizu, N.; Kimura, T. Effect of Processing Conditions on Physical Properties of Parboiled Rice. Food Sci. Technol. Res. 2002, 8, 106–112. [Google Scholar] [CrossRef] [Green Version]
  53. Chinnaswamy, R.; Hanna, M.A. Expansion, Color and Shear Strength Properties of Com Starches Extrusion-Cooked with Urea and Salts. Starch Stärke 1988, 40, 186–190. [Google Scholar] [CrossRef]
  54. Ali, N.; Pandya, A.C. Basic concept of parboiling of paddy. J. Agric. Eng. Res. 1974, 19, 111–115. [Google Scholar] [CrossRef]
  55. Wimberly, J.E.; International Rice Research, I. Technical Handbook for the Paddy Rice Postharvest Industry in Developing Countries; International Rice Research Institute: Los Baños, Philippines, 1983. [Google Scholar]
  56. Gariboldi, F.; Food and Agriculture Organization of the United. Rice Parboiling; Food and Agriculture Organization of the United Nations: Rome, Italy, 1984. [Google Scholar]
  57. Adhikaritanayake, T.B.; Noomhorm, A. Effect of continuous steaming on parboiled rice quality. J. Food Eng. 1998, 36, 135–143. [Google Scholar] [CrossRef]
  58. Sareepuang, K.; Siriamornpun, S.; Wiset, L.; Meeso, N. Effect of soaking temperature on physical, chemical and cooking properties of parboiled fragrant rice. World J. Agric. Sci. 2008, 4, 409–415. [Google Scholar]
  59. Graham-Acquaah, S.; Manful, J.T.; Ndindeng, S.A.; Tchatcha, D.A. Effects of Soaking and Steaming Regimes on the Quality of Artisanal Parboiled Rice. J. Food Process. Preserv. 2015, 39, 2286–2296. [Google Scholar] [CrossRef]
  60. Fan, C.; Yu, X.; Xing, Y.; Xu, C.; Luo, L.; Zhang, Q. The main effects, epistatic effects and environmental interactions of QTLs on the cooking and eating quality of rice in a doubled-haploid line population. Theor. Appl. Genet. 2005, 110, 1445–1452. [Google Scholar] [CrossRef] [PubMed]
  61. Jiang, S.L.; Wu, J.G.; Feng, Y.; Yang, X.E.; Shi, C.H. Correlation Analysis of Mineral Element Contents and Quality Traits in Milled Rice (Oryza stavia L.). J. Agric. Food Chem. 2007, 55, 9608–9613. [Google Scholar] [CrossRef] [PubMed]
  62. Yang, W.; Peng, S.; Dionisio-Sese, M.L.; Laza, R.C.; Visperas, R.M. Grain filling duration, a crucial determinant of genotypic variation of grain yield in field-grown tropical irrigated rice. Field Crop. Res. 2008, 105, 221–227. [Google Scholar] [CrossRef]
  63. Vaughan, D.A.; Lu, B.-R.; Tomooka, N. The evolving story of rice evolution. Plant Sci. 2008, 174, 394–408. [Google Scholar] [CrossRef]
  64. Zhang, Q.; Maroof, M.S.; Lu, T.Y.; Shen, B. Genetic diversity and differentiation of indica and japonica rice detected by RFLP analysis. Theor. Appl. Genet. 1992, 83, 495–499. [Google Scholar] [CrossRef] [PubMed]
  65. Lu, B.-R.; Zheng, K.; Qian, H.; Zhuang, J. Genetic differentiation of wild relatives of rice as assessed by RFLP analysis. Theor. Appl. Genet. 2002, 106, 101–106. [Google Scholar] [CrossRef] [PubMed]
  66. Zhao, K.; Wright, M.; Kimball, J.; Eizenga, G.; McClung, A.; Kovach, M.; Tyagi, W.; Ali, M.L.; Tung, C.-W.; Reynolds, A. Genomic diversity and introgression in O. sativa reveal the impact of domestication and breeding on the rice genome. PLoS ONE 2010, 5, e10780. [Google Scholar] [CrossRef] [PubMed] [Green Version]
  67. Vaughan, D.; Balazs, E.; Heslop-Harrison, J. From crop domestication to super-domestication. Ann. Bot. 2007, 100, 893–901. [Google Scholar] [CrossRef] [PubMed]
  68. Khush, G.S. Origin, dispersal, cultivation and variation of rice. Plant Mol. Biol. 1997, 35, 25–34. [Google Scholar] [CrossRef]
  69. Huang, X.; Kurata, N.; Wang, Z.-X.; Wang, A.; Zhao, Q.; Zhao, Y.; Liu, K.; Lu, H.; Li, W.; Guo, Y. A map of rice genome variation reveals the origin of cultivated rice. Nature 2012, 490, 497. [Google Scholar] [CrossRef] [Green Version]
  70. Yu, L.-X.; Nguyen, H.T. Genetic variation detected with RAPD markers among upland and lowland rice cultivars (Oryza sativa L.). Theor. Appl. Genet. 1994, 87, 668–672. [Google Scholar] [CrossRef] [PubMed]
  71. Olsen, K.M.; Caicedo, A.L.; Polato, N.; McClung, A.; McCouch, S.; Purugganan, M.D. Selection under domestication: Evidence for a sweep in the rice waxy genomic region. Genetics 2006, 173, 975–983. [Google Scholar] [CrossRef] [PubMed] [Green Version]
  72. Xiong, Z.; Zhang, S.; Wang, Y.; Ford-Lloyd, B.V.; Tu, M.; Jin, X.; Wu, Y.; Yan, H.; Yang, X.; Liu, P. Differentiation and distribution of indica and japonica rice varieties along the altitude gradients in Yunnan Province of China as revealed by InDel molecular markers. Genet. Resour. Crop. Evol. 2010, 57, 891–902. [Google Scholar] [CrossRef]
  73. Lu, B.-R.; Cai, X.; Xin, J. Efficient indica and japonica rice identification based on the InDel molecular method: Its implication in rice breeding and evolutionary research. Prog. Nat. Sci. 2009, 19, 1241–1252. [Google Scholar] [CrossRef]
  74. Morishima, H.; Oka, H.-I. Phylogenetic differentiation of cultivated rice, XXII. Numerical evaluation of the indica-japonica differentiation. Jpn. J. Breed. 1981, 31, 402–413. [Google Scholar] [CrossRef] [Green Version]
  75. Peng, S.; Laza, R.C.; Visperas, R.M.; Khush, G.S.; Virk, P.; Zhu, D. Rice: Progress in breaking the yield ceiling. In Proceedings of the 4th International Crop Science Congress, Brisbane, Australia, 26 September–1 October 2004. [Google Scholar]
  76. Xiong, Z.; Zhang, S.; Ford-Lloyd, B.; Jin, X.; Wu, Y.; Yan, H.; Liu, P.; Yang, X.; Lu, B.-R. Latitudinal distribution and differentiation of rice germplasm: Its implications in breeding. Crop Sci. 2011, 51, 1050–1058. [Google Scholar] [CrossRef] [Green Version]
  77. Dubey, A.; Verma, S.; Goswami, S.; Devedee, A. Effect of Temperature on Different Growth Stages and Physiological Process of Rice crop—A Review. Bull. Environ. Pharmacol. Life Sci. 2018, 7, 129–136. [Google Scholar]
  78. Kondo, M.; Okamura, T. Growth response of rice plant to water temperature. Agric. Hortic. 1931, 6, 517–530. [Google Scholar]
  79. Osada, A.; Sasiprapa, V.; Rahong, M.; Dhammanuvong, S.; Chakrabndhu, H. Abnormal occurrence of empty grains of indica rice plants in the dry, hot season in Thailand. Jpn. J. Crop. Sci. 1973, 42, 103–109. [Google Scholar] [CrossRef] [Green Version]
  80. Ghadirnezhad, R.; Fallah, A. Temperature Effect on Yield and Yield Components of Different Rice Cultivars in Flowering Stage. Int. J. Agron. 2014, 2014, 846707. [Google Scholar] [CrossRef]
  81. Ikeda, K. Photoperiodic flower induction in rice plants as influenced by light intensity and quality. JARQ. Jpn. Agric. Res. Q. 1985, 18, 164–170. [Google Scholar]
  82. Smith, P.; Martino, D.; Cai, Z.; Gwary, D.; Janzen, H.; Kumar, P.; McCarl, B.; Ogle, S.; O’Mara, F.; Rice, C.; et al. Agriculture. In Climate Change 2007: Mitigation. Contribution of Working Group III to the Fourth Assessment Report of the Intergovernmental Panel on Climate Change; Metz, B., Davidson, O.R., Bosch, P.R., Dave, R., Meyer, L.A., Eds.; Cambridge University Press: Cambridge, UK; New York, NY, USA, 2007; Available online: https://www.ipcc.ch/site/assets/uploads/2018/02/ar4-wg3-chapter8-1.pdf (accessed on 1 August 2021).
  83. Geetha Thanuja, K.; Karthikeyan, S. Exploring bio-mitigation strategies to reduce carbon footprint in wetland paddy system. Bioresour. Technol. Rep. 2020, 12, 100557. [Google Scholar] [CrossRef]
  84. Epule, E.T.; Peng, C.; Mafany, N.M. Methane emissions from paddy rice fields: Strategies towards achieving a win-win sustainability scenario between rice production and methane emission reduction. J. Sustain. Dev. 2011, 4, 188. [Google Scholar] [CrossRef]
  85. Yan, X.; Akiyama, H.; Yagi, K.; Akimoto, H. Global estimations of the inventory and mitigation potential of methane emissions from rice cultivation conducted using the 2006 Intergovernmental Panel on Climate Change Guidelines. Glob. Biogeochem. Cycles 2009, 23. [Google Scholar] [CrossRef]
  86. Zou, J.; Huang, Y.; Zheng, X.; Wang, Y. Quantifying direct N2O emissions in paddy fields during rice growing season in mainland China: Dependence on water regime. Atmos. Environ. 2007, 41, 8030–8042. [Google Scholar] [CrossRef]
  87. Neue, H.-U.; Sass, R.L. Trace gas emissions from rice fields. In Global Atmospheric-Biospheric Chemistry; Springer: Berlin/Heidelberg, Germany, 1994; pp. 119–147. [Google Scholar]
  88. Conrad, R. Control of methane production in terrestrial ecosystems. In Exchange of Trace Gases between Terrestrial Ecosystems and the Atmosphere; Andreae, M.O., Schimel, D.S., Eds.; Wiley Chichester: Chichester, UK, 1989; pp. 39–58. [Google Scholar]
  89. Seiler, W.; Holzapfel-Pschorn, A.; Conrad, R.; Scharffe, D. Methane emission from rice paddies. J. Atmos. Chem. 1983, 1, 241–268. [Google Scholar] [CrossRef]
  90. Schütz, H.; Seiler, W.; Conrad, R. Processes involved in formation and emission of methane in rice paddies. Biogeochemistry 1989, 7, 33–53. [Google Scholar] [CrossRef]
  91. Zheng, H.; Huang, H.; Yao, L.; Liu, J.; He, H.; Tang, J. Impacts of rice varieties and management on yield-scaled greenhouse gas emissions from rice fields in China: A meta-analysis. Biogeosci. Discuss. 2013, 10, 19045–19069. [Google Scholar]
  92. van Beek, C.L.; Meerburg, B.G.; Schils, R.L.; Verhagen, J.; Kuikman, P.J. Feeding the world’s increasing population while limiting climate change impacts: Linking N2O and CH4 emissions from agriculture to population growth. Environ. Sci. Policy 2010, 13, 89–96. [Google Scholar] [CrossRef]
  93. Van Groenigen, K.J.; Van Kessel, C.; Hungate, B.A. Increased greenhouse-gas intensity of rice production under future atmospheric conditions. Nat. Clim. Chang. 2013, 3, 288. [Google Scholar] [CrossRef]
Figure 1. Process flow for parboiling and milling Japonica rice.
Foods 10 01869 g001
Figure 2. Beakers of cooked rice samples placed in inverted positions to investigate adhesion; (A) non-parboiled Japonica rice; (B) parboiled Japonica rice; and (C) Indica rice.
Foods 10 01869 g002
Figure 3. Survey respondents’ preference for rice based on (A) aroma, (B) adhesiveness, and (C) costs in Nigeria (West Africa) per 50 kg of rice (USD 1 = NGN 410).
Foods 10 01869 g003
Figure 4. Kruskal–Wallis test for alkali digestion value of parboiled and non-parboiled Japonica rice and Indica rice.
Foods 10 01869 g004
Figure 5. Bar graphs showing mean protein and micronutrient (Mg and Zn, mg/100 g) concentrations in non-parboiled Japonica (n = 3), parboiled Japonica (n = 3), and Indica (n = 3) rice samples. Error bars show standard deviations. Mean concentrations with different letters are significantly different (p ≤ 0.05).
Foods 10 01869 g005
Figure 6. Bar graphs showing mean CIE L*a* b* in (A) cooked and (B) uncooked non-parboiled Japonica (n = 5), parboiled Japonica (n = 5), and Indica (n = 5) rice samples. Error bars show standard deviations. Means with different letters are significantly different (p ≤ 0.05).
Foods 10 01869 g006aFoods 10 01869 g006b
Figure 7. Major factors for growing Japonica rice: (A) mean temperature, (B) sunshine, and (C) precipitation [45,46].
Foods 10 01869 g007aFoods 10 01869 g007b
Table 1. Conditions for parboiling Japonica rice.
Exp. No.Moisture Content after Soaking (% Wet Basis)Steaming Temperature (°C)Steaming Duration (min)Drying Temperature (°C)
124502035
224704045
324906055
427702055
527904035
627506045
730902045
830504055
930706035
Table 2. Alkali digestion value seven-point scale.
Degree of DigestionAlkali
Digestion
Classification
Alkali Digestion Value
Grain not affectedLow1
Grain swollenLow2
Grain swollen, collar incomplete and narrowLow3
Grain swollen, collar complete and wideIntermediate4
Grain split or segmented, collar complete and wideIntermediate5
Grain dispersed, merging with collarHigh6
Grain completely dispersed and intermingledHigh7
Table 3. Amylose content of parboiled and milled Japonica rice.
Treatment123456789
Amylose (%)17.9318.3319.0318.5319.4318.2019.3718.3718.87
S/N Value25.0725.2625.5925.3625.7725.2025.7425.2825.51
Table 4. Mean and standard deviation (SD) of chemical constituents measured on a dry weight basis in Japonica and Indica rice samples.
ConstituentUnitsNon-Parboiled Japonica (n = 3)Parboiled Japonica (n = 3)Parboiled Indica (n = 3)Reported Values in Literature (Range)
Mean (SD)Mean (SD)Mean (SD)
Crude Proteing/100 g7.5 (0.23)8.1 (0.11)9.1 (0.03)5.71–6.71 a;
7.21–8.53 b
Crude Fatg/100 g0.4 (0.23)0.4 (0.23)0.5 (0.28)0.31–0.47 a
Ashg/100 g0.5 (0.24)0.5 (0.26)0.5 (0.19)0.49–0.60 a
Carbohydratesg/100 g91.6 (0.28)90.9 (0.54)89.9 (0.44)
Femg/100 g0.8 (0.18)0.9 (0.23)1.0 (0.13)0.12–0.78 a
Mgmg/100 g1.6 (0.04)1.5 (0.09)0.5 (0.02)
Znmg/100 g2.4 (0.11)2.3 (0.08)1.6 (0.20)0.84–1.46 a
(a) Kwarteng et al. [51] and (b) Heinemann et al. [50].
Publisher’s Note: MDPI stays neutral with regard to jurisdictional claims in published maps and institutional affiliations.

