
A Meta-Level Framework for Evaluating Resilience in Net-Zero Carbon Power Systems with Extreme Weather Events in the United States


Abstract
:1. Introduction
2. Decarbonization in Energy Systems: Technology and Policy Conditions
3. The U.S. Power System and Resilience Oversight
- Reliability
- Loss of Load Expectation (LOLE) calculates the amount of capacity that needs to be installed to meet the desired reliability target;
- Loss of Load Probability (LOLP) measures the probability that a system’s load will exceed the generation and firm power contracts available to meet that load;
- N-1 indicates a system is able to withstand at all times an unexpected failure or outage of a single system component (i.e., a single contingency situation) such as the failure of a transformer or a lightning strike that causes a transmission line outage.
- System Average Interruption Duration Index (SAIDI) is the system-wide total number of minutes per year of sustained outage per customer served;
- System Average Interruption Frequency Index (SAIFI) measures how often the system-wide average customer was interrupted in the reporting year;
- Customer Average Interruption Duration Index (CAIDI) tracks the total duration of an interruption for the average customer during a given time period;
- Momentary Average Interruption Frequency Index (MAIFI) is the number of momentary outages per customer system-wide per year;
- Average Service Availability Index (ASAI), or the service reliability index, is the ratio of the total number of customer hours that service was available during a given time period to the total customer hours demanded.
- Interruption Costs compare the cost of kilowatts (kW) during business as usual versus when kWs are not delivered;
- Total Resources Costs value proposed utility investment in energy efficiency;
- System Hardening Costs represent the costs for strengthening a system with redundancies, additional layers, or alternative configurations;
- Social Costs assess customer benefits and related community benefits, such as ecological impacts, jobs, and/or health effects.
4. Key Contemporary Approaches for Evaluating Resilience
- Interruption costs—typically contrast the cost of kilowatts (kW) during standard use versus an outlier event when kWs cannot be delivered. These may be represented as estimates of cost per interruption event, per average kW, and per unserved kWh, as well as the total cost of sustained electric power interruptions. Real value is difficult to calculate in advance and is unlikely to represent all the benefits [13];
- Social cost—could substitute for the total resource costs indicated above by including customer benefits [13] and related community benefits. Used in some regulatory proceedings, this indicator may entail dimensions like ecological impacts, jobs, and/or health effects that are quantified yet have inherently qualitative aspects. Since social cost may be seen by some as outside the scope of utility responsibility, it is not used universally and may be reflected in related analysis, such as environmental impact assessments. Importantly, locationally based priorities can vary, so a utility with different regional service areas may have distinctly different social costs, even if the total resource costs are the same;
- Costs of system hardening—represent the costs for strengthening a system with redundancies, additional layers, or alternative configurations. Power systems may employ measures that: put electric distribution systems underground; place switchyards above floodplains; utilize gravity-fed rather than pumped potable water supplies; provide freeze protection for natural gas supply systems; etc.
5. Meta-Level Framework for Analysis and Decision-Making
- ○
- Tier C defines the initial order and foundation, based on a qualitative review of best practices, plus expert and stakeholder elicitation, as appropriate;
- ○
- Tier B incorporates the knowledge gained from Tier C into assumptions and refined options for quantitative analysis;
- ○
- Tier A represents fuller integrated analysis with more specialized focus on local considerations;
- ○
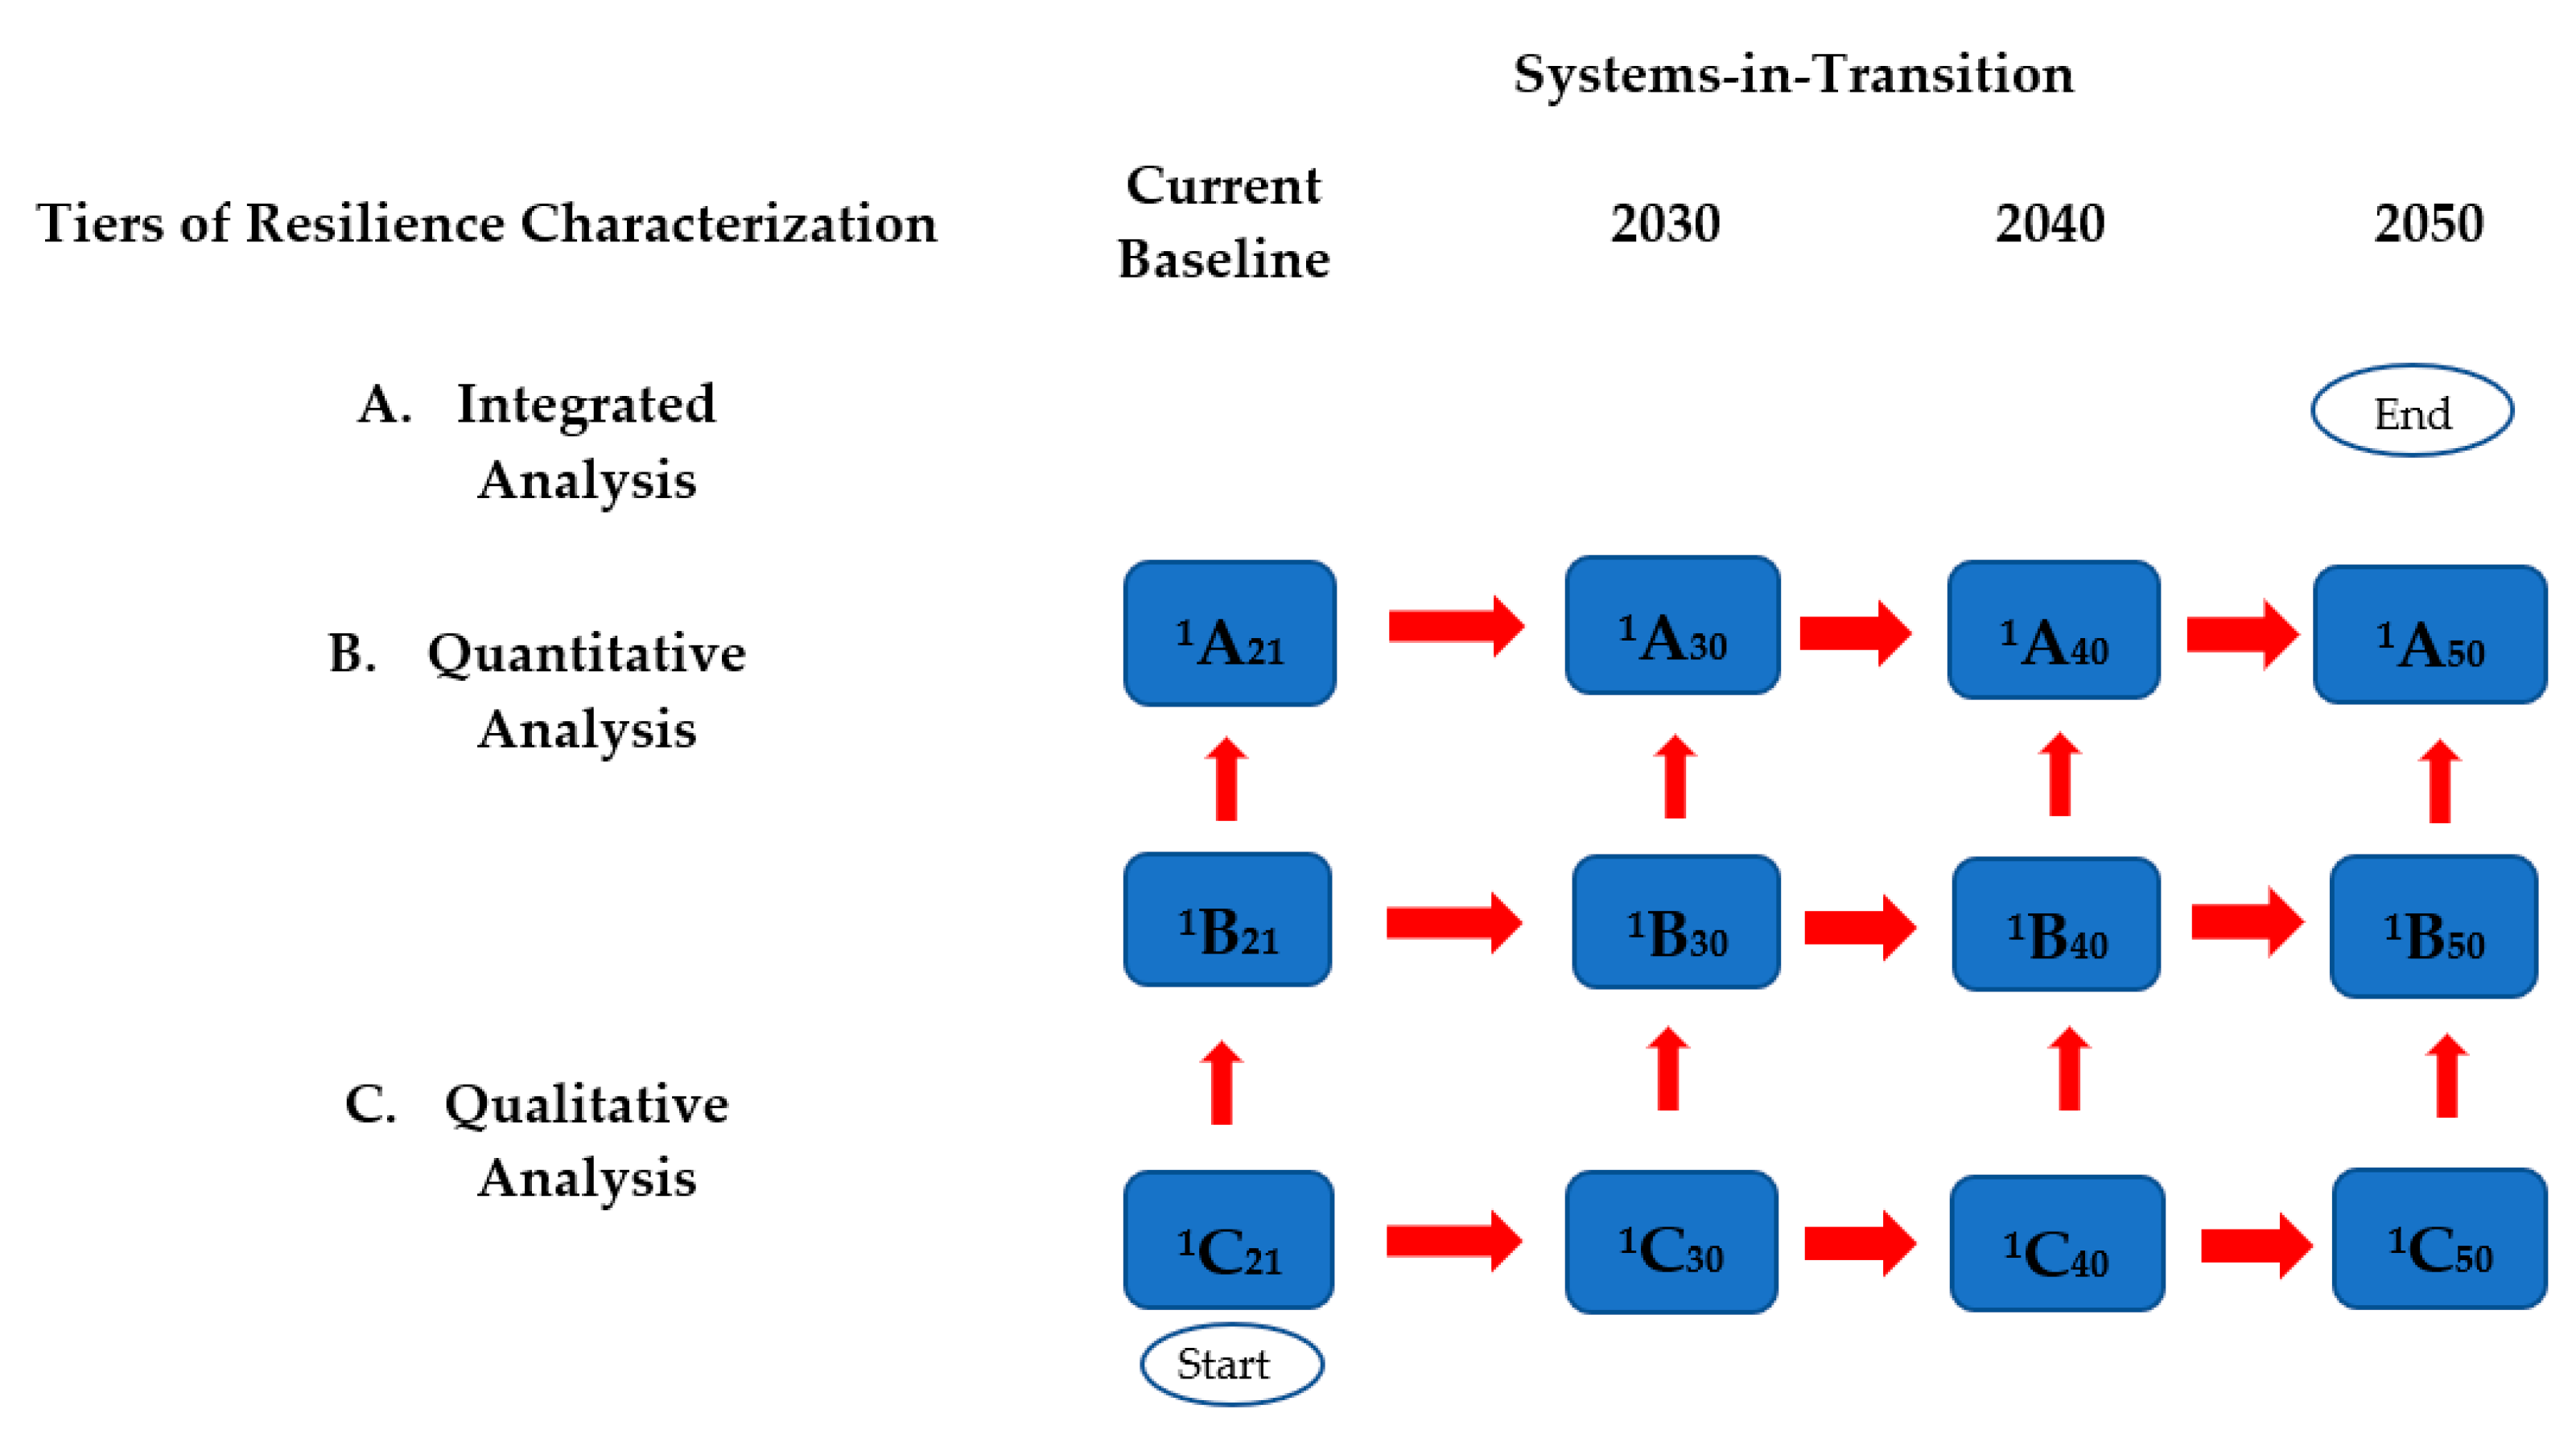
- “Superscript” Z parameter is employed to describe resiliency dimensions;
- ○
- “Subscript” Y denotes the time step (year) that the hypothetical system is deployed (e.g., C30 is for 2030, C40 is for 2040, C50 is for 2050).
- ○
- (C) Qualitative Analysis—This tier is generally the starting point in the analysis and includes a review of standards and practices accounting for current and anticipated regulations, industry-community standards, and expert input from relevant fields (e.g., low carbon energy technologies, energy system dependencies, economic, social/institutional, ecology, etc.). It is based on general social and market conditions for a region and defines low-high importance plus sensitivity to resilience, etc.
- ○
- (B) Quantitative—The second tier entails quantitative analysis including modeling of non-location specific profile markets. Profile markets exhibit the “market attributes” characteristic of markets and energy systems behaviors in transition. They help to define deployment boundary conditions, differentiate the importance of energy system attributes, and can reflect the needs of underrepresented markets that are economically and/or socially marginalized. Study of the profile markets offers lessons and provides a basis for energy system deployment in various markets, domestic and foreign. Scenarios of primary interest are refined based on iterative analysis.
- ○
- (A) Integrated Analysis—The third tier, covering integrated analysis, includes more nuanced and increasingly specialized assessments of a specific location that incorporate and build on results from Tiers C and B. It includes advanced quantitative, qualitative, and geospatial assessments that mutually inform. The synthesis of multiple methods is completed in other domains [66,67,68]. If done well, it allows for the strengths of the different methods to complement and/or amplify the value of the process and findings. Scenarios of primary interest are refined, here, based on iterative analysis.
5.1. Step-by-Step Review of the Framework
- ○
- The starting point, 1C21, is based on prevailing practices with the current technologies in the energy mix with technical, economic, social, ecological, and infrastructural assessments to provide a full baseline producing 1–5C21;
- ○
- The next step, 1–5C21 → 1C30, continues with best practices/expert assessment/general geospatial profiling to evaluate resilience with an emergent low carbon energy system in 2030. It may for a variety of reasons only initially cover technical and economic dimensions producing 1–2C30;
- ○
- The following step, 1–2C30 → 1B30, adds quantitative analysis of a profile market considering scenarios up to 2030;
- ○
- The next step 1B30 → 1B40 continues the quantitative analysis up to 2040;
- ○
- The fourth step 1B40 → 1–5A50, develops into an integrated analysis (including both quantitative, qualitative, and geospatial elements) of a proposed system’s resilience in a specific region and market in 2050. It covers technical, economic, social, ecological, and infrastructural assessments in Tier A to provide a full profile.
- Technical Resilience—The technical resilience of an energy system focuses on the potential disruption to the hardware and software plus energy/power inputs and outputs. In the case of a power system example, this accounts for factors including generation, transmission, and distribution by supplementing traditionally static system performance measures to factor behaviors under changing contexts. It simulates complex interactions incorporating additional resilience dimensions detailed below. This would principally be evaluated in quantitative and geospatial assessments of Tiers A and B and factor for conditions like weatherization;
- Economic Recovery Resilience—The economic recovery resilience of an energy system focuses on the potential disruption to the area economy and its capacity to recover. This may be measured in terms of the impacts on varied sectoral areas of production, supply, demand, and delivery as well as employment and post-disruption recovery efforts. It defines the minimum level of recovery investments required to restore production and delivery levels so that total economic impacts are deemed acceptable over a stipulated post-disruption duration [70]. This would be primarily evaluated in Tiers A, B, and C across all methods;
- Social and Institutional Resilience—The social and institutional resilience of the energy system focuses on the disruption to society, its capacity and social ecosystem, as well as its ability to mobilize to recover from a shock. This encompasses people, plus organizations, rules, and resources. It accounts for regulated versus deregulated markets. Readiness and adaptive capacity are key, including the community’s ability to learn, problem-solve, self-organize, and govern with institutions that can partner and adjust. This would be primarily evaluated in Tiers A and C and would generally be qualitative in form;
- Ecological Resilience—The ecological or environmental resilience of an energy system centers on the natural system and its ability to recover to a former or new steady state. The concept of adaptive capacity that is indicated with social and institutional resilience would apply here as well. This may encompass water, air/emissions, land/soil, forests/agriculture/biodiversity, etc. This area of focus would be primarily evaluated in Tiers A, B, and C with all methods;
- Infrastructural Resilience—The infrastructural resilience of an energy system refers to the built environment that goes beyond what is covered by technical resilience. In the case of a power-system resilience study, this would encompass other critical infrastructure such as communications and transportation systems as well as gasoline fueling stations—all of which typically require power to function. This would be primarily evaluated in Tiers A, B, and C across all methods.
5.2. Scenarios
5.3. Examples of Extreme Weather-Power Outage Events
5.3.1. Winter Storms: Texas (ERCOT) in 2021 and 2011
…the massive amount of generator failures that were experienced raises the question whether it would have been helpful to increase reserve levels going into the event. This action would have brought more units online earlier, might have prevented some of the freezing problems the generators experienced, and could have exposed operational problems in time to implement corrections before the units were needed to meet customer demand.[78]
5.3.2. Hurricane Maria: Puerto Rico in 2017
5.3.3. Heatwave/Wildfire: California in 2020
6. Limits and Advantages of the Framework
7. Discussion and Conclusions
- Role of resilience in relation to reliability;
- Standardized logic for communicating the depth of knowledge in terms of analytical rigor and dimensions of time and place (location specific);
- Gaps in understanding a system’s resilience;
- Critical assets within the context of their broader systems including the people and capabilities to carry out the core functions;
- Sensitivities of variables to system behavior;
- Dimensionality and interplay between technical, economic, social/institutional, ecological, and infrastructural resilience;
- Resilience qualities of low carbon technologies and the necessary balancing measures to maintain the stability with increasing shares;
- Early-stage strategies (e.g., scaling technologies) and their impact on achieving long-term objectives should be factored;
- Value of flexible energy technologies in the energy mix;
- Conditions under which analysis should be updated to address design basis changes, shifts in decision-making, jurisdiction, and operational control.
- Utilities communicating with regulators and insurance companies (and vice versa) about the current resilience posture and the risks and opportunities moving forward to 2050 as they decarbonize their energy systems;
- National energy analysts creating the analytical basis for informed decision-making based on a comprehensive understanding of the impacts over a range of mitigation options for location-specific energy systems;
- Researchers evaluating profile markets to understand and design resilient systems.
Author Contributions
Funding
Acknowledgments
Conflicts of Interest
Appendix A

| Resilience | Reliability | |
|---|---|---|
| NERC | Infrastructure resilience is the ability to reduce the magnitude and/or duration of disruptive events [106]. | Reliability consists of two concepts:
|
| NARUC | Resilience “addresses high-impact events” that “can be geographically and temporally widespread” [109]. | Reliability is about preventing disruptions that are “more common, local, and smaller” [109]. |
| DOE | “The ability of a power system and its components to withstand and adapt to disruptions and rapidly recover from them” [37]. | “… maintaining the delivery of electric power when there is routine uncertainty in operating conditions” [37]. |
| FERC | See IEEE. | |
| IEEE | “The ability to withstand and reduce the magnitude and/or duration of disruptive events, which includes the capability to anticipate, absorb, adapt to, and/or rapidly recover from such an event” [110]. | This is the probability a system will perform its intended functions without failure, within design parameters, under specific operating conditions, and for a specific period of time [111]. |
| Broader Definitions |
|
References
- National Academies of Sciences, Engineering, and Medicine. The Future of Electric Power in the United States; The National Academies Press: Washington, DC, USA, 2021. [Google Scholar] [CrossRef]
- IEEE Power & Energy Society Industry Technical Support Leadership Committee Task Force. Resilience Framework, Methods, Metrics for the Electricity Sector; PES-TR83; IEEE Power & Energy Society: Piscataway, NJ, USA, 2020; Available online: https://www.naesco.org/data/industryreports/DOE-IEEE_Resilience%20Paper_10-30-2020%20for%20publication.pdf (accessed on 3 January 2021).
- Quadrennial Energy Review (QER) Task Force. Transforming the Nation’s Electricity System: The Second Installment of the QER; QER 1.2; USA Department of Energy: Washington, DC, USA, 2017. Available online: https://www.energy.gov/sites/prod/files/2017/02/f34/Quadrennial%20Energy%20Review--Second%20Installment%20%28Full%20Report%29.pdf (accessed on 30 November 2020).
- National Academies of Sciences, Engineering, and Medicine. Enhancing the Resilience of the Nation’s Electricity System; The National Academies Press: Washington, DC, USA, 2017. [Google Scholar] [CrossRef]
- USA Global Change Research Program. Fourth National Climate Assessment, Impacts, Risks, and Adaptation in the United States: Vol. II; USA Government Publishing Office: Washington, DC, USA, 2018. [Google Scholar]
- NOAA National Centers for Environmental Information. USA Billion-Dollar Weather and Climate Disasters: Overview. Available online: https://www.ncdc.noaa.gov/billions/ (accessed on 21 February 2021).
- Almasy, S.; Holcombe, M.; Yan, H. Winter Weather has Millions Trying to Stay Warm and Vaccine Providers Worrying about Shipping Delays. CNN, updated 16 February 2021. Available online: https://www.cnn.com/2021/02/16/weather/winter-storms-weather-tuesday/index.html (accessed on 18 February 2021).
- Office of Nuclear Energy. Department of Energy Report Explores USA Advanced Small Modular Reactors to Boost Grid Resiliency; USA Department of Energy: Washington, DC, USA, 2018. Available online: https://www.energy.gov/ne/articles/department-energy-report-explores-us-advanced-small-modular-reactors-boost-grid (accessed on 5 January 2021).
- USA Government Accountability Office. Electricity Grid Resilience: Climate Change Is Expected to Have Far-Reaching Effects and DOE and FERC Should Take Actions; GAO-21-346; USA Government Accountability Office: Washington, DC, USA, 2021. Available online: https://www.gao.gov/assets/gao-21-346.pdf (accessed on 12 March 2021).
- USA Government Accountability Office. Critical Infrastructure Protection: Protecting the Electric Grid from Geomagnetic Disturbance; GAO-19-98; USA Government Accountability Office: Washington, DC, USA, 2018. Available online: https://www.gao.gov/assets/gao-19-98.pdf (accessed on 5 December 2020).
- USA Government Accountability Office. Actions Needed to Address Significant Cybersecurity Risks Facing the Electric Grid; GAO 19-332; USA Government Accountability Office: Washington, DC, USA, 2019. Available online: https://www.gao.gov/assets/gao-19-332.pdf (accessed on 5 December 2020).
- Cyber-Physical Systems Public Working Group. Framework for Cyber-Physical Systems: Volume 2, Working Group Reports; NIST Special Publications 1500-202; National Institute of Standards and Technology: Gaithersburg, MD, USA, 2017. [Google Scholar] [CrossRef]
- Trabish, H. As Extreme Weather Spurs Billions in Utility Resilience Spending, Regulators Struggle to Value Investments. Utility Dive, 25 April 2020. Available online: https://www.utilitydive.com/news/as-extreme-weather-spurs-billions-in-utility-resilience-spending-regulator/576404(accessed on 27 December 2020).
- BNEF. Energy Transition Investment Hit $500 Billion in 2020—For First Time. Bloomberg NEF, 19 January 2021. Available online: https://about.bnef.com/blog/energy-transition-investment-hit-500-billion-in-2020-for-first-time(accessed on 30 January 2021).
- National Academies of Sciences, Engineering, and Medicine. Accelerating Decarbonization in the United States; The National Academies Press: Washington, DC, USA, 2021; Available online: https://www.nationalacademies.org/our-work/accelerating-decarbonization-in-the-united-states-technology-policy-and-societal-dimensions (accessed on 4 February 2021).
- Larson, E.; Greig, C.; Jenkins, J.; Mayfield, E.; Pascale, A.; Zhang, C.; Drossman, J.; Williams, R.; Pacala, S.; Socolow, R.; et al. Net-Zero America: Potential Pathways, Infrastructure, and Impacts; Interim Report; Princeton University: Princeton, NJ, USA; Available online: https://environmenthalfcentury.princeton.edu/sites/g/files/toruqf331/files/2020-12/Princeton_NZA_Interim_Report_15_Dec_2020_FINAL.pdf (accessed on 15 December 2020).
- Goldman School of Public Policy. 2035: The Report; University of California Berkeley: Berkeley, CA, USA, 2020; Available online: http://www.2035report.com/wp-content/uploads/2020/06/2035-Report.pdf?hsCtaTracking=8a85e9ea-4ed3-4ec0-b4c6-906934306ddb%7Cc68c2ac2-1db0-4d1c-82a1-65ef4daaf6c1 (accessed on 5 December 2020).
- Walton, R. Transmission, Local Resources, Market Improvements Key to Decarbonization: CAISO and NYISO Chiefs. Utility Dive, 10 December 2020. Available online: https://www.utilitydive.com/news/transmission-local-resources-market-improvements-key-to-decarbonization/591946(accessed on 10 December 2020).
- Mai, T.; Jadun, P.; Logan, J.; McMillan, C.; Muratori, M.; Steinberg, D.; Vimmerstedt, L.; Jones, R.; Haley, B.; Nelson, B. Electrification Futures Study: Scenarios of Electric Technology Adoption and Power Consumption for the United States; NREL/TP6A20-71500; National Renewable Energy Laboratory: Golden, CO, USA, 2018. [Google Scholar]
- MacDonald, A.; Clack, C.; Alexander, A.; Dunbar, A.; Wilczak, J.; Xie, Y. Future Cost-Competitive Electricity Systems and Their Impact on US CO2 Emissions. Nat. Clim. Chang. 2016, 6, 526–531. [Google Scholar] [CrossRef]
- Jayadev, G.; Leibowicz, B.; Kutanoglu, E. USA Electricity Infrastructure of the Future: Generation and Transmission Pathways Through 2050. Appl. Energy 2020, 260, 114267. [Google Scholar] [CrossRef]
- International Energy Agency. Projected Costs of Generating Electricity 2020; IEA: Paris, France, 2020; Available online: https://www.iea.org/reports/projected-costs-of-generating-electricity-2020 (accessed on 10 December 2020).
- Lazard. LCOE, Version 14.0, Storage Version 6.0. Available online: https://www.lazard.com/media/451419/lazards-levelized-cost-of-energy-version-140.pdf (accessed on 30 October 2020).
- Walton, R. Electric vehicle models expected to triple in 4 years as declining battery costs boost adoption. Utility Dive, 14 December 2020. Available online: https://www.utilitydive.com/news/electric-vehicle-models-expected-to-triple-in-4-years-as-declining-battery/592061(accessed on 14 December 2020).
- The White House. President Biden Sets 2030 Greenhouse Gas Pollution Reduction Target Aimed at Creating Good-Paying Union Jobs and Securing USA Leadership on Clean Energy Technologies. The White House, 22 April 2021. Available online: https://www.whitehouse.gov/briefing-room/statements-releases/2021/04/22/fact-sheet-president-biden-sets-2030-greenhouse-gas-pollution-reduction-target-aimed-at-creating-good-paying-union-jobs-and-securing-u-s-leadership-on-clean-energy-technologies(accessed on 22 April 2021).
- The White House. The American Jobs Plan. The White House, 31 March 2021. Available online: https://www.whitehouse.gov/briefing-room/statements-releases/2021/03/31/fact-sheet-the-american-jobs-plan/(accessed on 30 May 2021).
- The White House. Executive Order on Tackling the Climate Crisis at Home and Abroad. The White House, 27 January 2021. Available online: https://www.whitehouse.gov/briefing-room/presidential-actions/2021/01/27/executive-order-on-tackling-the-climate-crisis-at-home-and-abroad(accessed on 30 January 2021).
- Nuclear Energy Institute. Zero Emission Credits Page. Available online: https://www.nei.org/resources/reports-briefs/zero-emission-credits (accessed on 20 May 2021).
- Shields, L. State Renewable Portfolio Standards and Goals; National Conference of State Legislatures: Washington, DC, USA, 2021; Available online: https://www.ncsl.org/research/energy/renewable-portfolio-standards.aspx (accessed on 7 April 2021).
- Spector, J. 5 Major U.S. Utilities That Haven’t Promised to Fully Decarbonize. Green Tech Media, 17 September 2020. Available online: https://www.greentechmedia.com/articles/read/the-biggest-utilities-that-arent-promising-to-decarbonize(accessed on 17 September 2020).
- Morey, M.; Gorski, A. As USA Coal-Fired Capacity and Utilization Decline, Operators Consider Seasonal Operation; USA Energy Information Administration: Washington, DC, USA, 2020. Available online: https://www.eia.gov/todayinenergy/detail.php?id=44976 (accessed on 1 September 2020).
- Ray, S. Nuclear and Coal Will Account for Majority of USA Generating Capacity Retirements in 2021; USA Energy Information Administration: Washington, DC, USA, 2021. Available online: https://www.eia.gov/todayinenergy/detail.php?id=46436 (accessed on 12 January 2021).
- Duquiatan, A. Average age of US power plant fleet flat for 4th-straight year in 2018. S&P Global, 16 January 2019. Available online: https://www.spglobal.com/marketintelligence/en/news-insights/trending/gfjqeFt8GTPYNK4WX57z9g2(accessed on 20 January 2021).
- Eyocko, S. Utilities Need to Harden the Grid as They Green it. Consumers Aren’t Ready for the Cost. Utility Dive, 26 February 2021. Available online: https://www.utilitydive.com/news/utilities-need-to-harden-the-grid-as-they-green-it-consumers-arent-ready/595719(accessed on 26 February 2021).
- Lindblom, C. The Science of “Muddling Through". Public Adm. Rev. 1959, 19, 79–88. [Google Scholar] [CrossRef]
- North American Electric Reliability Corporation Home Page. Available online: https://www.nerc.com/Pages/default.aspx (accessed on 2 January 2021).
- Anderson, D.; Kintner-Meyer, M.; Porro, G.; Shah, M. Grid Modernization Lab Consortium, Grid Modernization: Metrics Analysis, 2.1; PNNL 26541; Pacific Northwest National Laboratory: Richland, WA, USA, 2017. [Google Scholar] [CrossRef]
- Congressional Research Service. Electric Reliability and Power System Resilience; CRS IN10895; Congressional Research Service: Washington, DC, USA, 2018. [Google Scholar]
- Walton, R. Rising Renewables Penetration is a Threat to Grid Reliability in Some Regions, NERC Concludes. Utility Dive, 18 December 2020. Available online: https://www.utilitydive.com/news/rising-renewables-penetration-is-a-threat-to-grid-reliability-in-some-regio/592356(accessed on 29 December 2020).
- Southern California Edison Reimagining the Grid Page. Available online: https://www.edison.com/home/our-perspective/reimagining-the-grid.html (accessed on 18 May 12021).
- IEEE/NERC Task Force on Short-Circuit and System Performance Impact of Inverter Based Generation. Impact of Inverter Based Generation on Bulk Power System Dynamics and Short-Circuit Performance; PES-TR68; IEEE Power & Energy Society: Piscataway, NJ, USA, 2018. [Google Scholar]
- Miligan, M. Methods to Model and Calculate Capacity Contributions of Variable Generation for Resource Adequacy Planning (IVGTF1-2); NREL/PR-5500-51485; National Renewable Energy Laboratory: Golden, CO, USA, 2011; Available online: https://digital.library.unt.edu/ark:/67531/metadc840287/ (accessed on 10 December 2020).
- Vermont System Planning Committee Grid Planning Page. Available online: https://www.vermontspc.com/grid-planning (accessed on 21cFebruary 2021).
- Transmission and Distribution Committee of IEEE Power & Energy Society. IEEE Guide for Electric Power Distribution Reliability Indices; IEE Std. 1366-2012; IEEE Standards Association: Piscataway, NJ, USA, 2012; Available online: https://ieeexplore.ieee.org/stamp/stamp.jsp?arnumber=6329910 (accessed on 10 January 2021).
- National Association of Regulatory Utility Commissioners Reliability Page. Available online: https://www.naruc.org/servingthepublicinterest/about/reliability/#:~:text=Reliability%20Indices&text=This%20index%20measures%20the%20total,during%20a%20given%20time%20period.&text=Once%20an%20outage%20occurs%2C%20the,interruption%20duration%20index%20(CAIDI) (accessed on 20 May 2021).
- California Public Utility Commission Reliability Standards Page. Available online: https://www.cpuc.ca.gov/General.aspx?id=4965 (accessed on 21 February 2021).
- National Action Plan for Energy Efficiency. Understanding Cost-Effectiveness of Energy Efficiency Programs: Best Practices, Technical Methods, and Emerging Issues for Policy-Makers. Energy and Environmental Economics, Inc. and Regulatory Assistance Project. 2008. Available online: http://www.epa.gov/eeactionplan (accessed on 10 January 2021).
- Cybersecurity and Infrastructure Security Agency, Energy Sector, n.d. Available online: https://www.cisa.gov/energy-sector (accessed on 7 July 2021).
- Nuclear Regulatory Commission Post-Fukushima Safety Enhancements Page. Available online: https://www.nrc.gov/reactors/operating/ops-experience/post-fukushima-safety-enhancements.html (accessed on 27 December 2020).
- USA Government Accountability Office. Organizational Transformation: A Framework for Assessing and Improving Enterprise Architecture Management 2.0; GAO 10-846G; USA Government Accountability Office: Washington DC, USA, 2010. Available online: https://www.gao.gov/products/gao-10-846g (accessed on 10 December 2020).
- USA Department of Treasury. Chief Information Officer Council, Treasury Enterprise Architecture Framework, version 1; USA Department of Treasury: Washington, DC, USA, 2000. [Google Scholar]
- Bellini, E.; Marrone, S.; Marulli, F. Cyber Resilience Meta-Modelling: The Railway Communication Case Study. Electronics 2021, 10, 583. [Google Scholar] [CrossRef]
- Cui, C.; Wu, T.; Hu, M.; Weir, J.; Li, X. Short-term Building Energy Model Recommendation System: A Meta-learning Approach. Appl. Energy 2016, 172, 251–263. [Google Scholar] [CrossRef] [Green Version]
- Feng, Q.; Zhao, X.; Fan, D.; Cai, B.; Liu, Y.; Ren, Y. Resilience Design Method Based on Meta-Structure: A Case Study of [sic] Offshore Wind Farm. Reliab. Eng. Syst. Saf. 2019, 186, 232–244. [Google Scholar] [CrossRef]
- Lu, Y.; Xu, J. Low Carbon Reconstruction: A Meta-Synthesis Approach for the Sustainable Development of a Post-Disaster Community. Syst. Res. Behav. Sci. 2016, 33, 173–187. [Google Scholar] [CrossRef]
- Ostrom, E. A General Framework for Analyzing Sustainability of Socio-Ecological Systems. Science 2009, 325, 419–422. [Google Scholar] [CrossRef] [PubMed]
- Röben, F.; Schäfers, H.; Meißner, A.; de Haan, J. Smart Balancing of Electrical Power in Germany: Fuzzy Logic Model to Simulate Market Response. Energies 2021, 14, 2309. [Google Scholar] [CrossRef]
- Vasantharaj, S.; Indragandhi, V.; Subramaniyaswamy, V.; Teekaraman, Y.; Kuppusamy, R.; Nikolovski, S. Efficient Control of DC Microgrid with Hybrid PV—Fuel Cell and Energy Storage Systems. Energies 2021, 14, 3234. [Google Scholar] [CrossRef]
- Muślewski, L.; Pajak, M.; Klaudiusz, M.; Landowski, B. An Expert System for Optimizing the Operation of a Technical System. J. Qual. Maint. Eng. 2020. [Google Scholar] [CrossRef]
- Muślewski, L.; Knopik, L.; Landowski, B.; Polishchuk, O. Analysis of Assessment Criteria for Selected Systems of Transport Means Operation. In Proceedings of the MATEC Web Conference/17th International Conference Diagnostics of Machines and Vehicles, Methodology and Vibroacoustics, Bydgoszcz, Poland, 25–26 September 2018; Volume 182. [Google Scholar] [CrossRef] [Green Version]
- Nate, S.; Bilan, Y.; Kurylo, M.; Lyashenko, O.; Napieralski, P.; Kharlamova, G. Mineral Policy within the Framework of Limited Critical Resources and a Green Energy Transition. Energies 2021, 14, 2688. [Google Scholar] [CrossRef]
- Pajak, M. Fuzzy System of Power Units Maintenance Schedules Generation. J. Intell. Fuzzy Syst. 2015, 28, 1577–1589. [Google Scholar] [CrossRef]
- Pajak, M. Fuzzy Identification of a Threat of the Inability State Occurrence. J. Intell. Fuzzy Syst. 2018, 35, 3593–3604. [Google Scholar] [CrossRef]
- Resilient Design Institute, the Resilient Design Principles Page. Available online: https://www.resilientdesign.org/the-resilient-design-principles (accessed on 20 May 2021).
- Pimblott, S.; Kennedy, J.A. Scale for Measuring Materials Development for Nuclear Energy Systems; INL/LTD 18-45283; Idaho National Laboratory: Idaho Falls, ID, USA, 2018. [Google Scholar]
- Robertson, S.A. Longitudinal Quantitative-Qualitative Systems Approach to the Study of Transitions toward a Low Carbon Society. J. Clean. Prod. 2016, 128, 221–233. [Google Scholar] [CrossRef]
- Sultan, U.; Zhang, Y.; Farooq, M.; Imran, M.; Khan, A.A.; Zhuge, W.; Khan, T.A.; Yousaf, M.H.; Ali, Q. Qualitative Assessment and Global Mapping of Supercritical CO2 Power Cycle Technology. Sustain. Energy Tech Assess. 2021, 43, 100978. [Google Scholar]
- Veerashekar, K.; Askan, H.; Luther, M. Qualitative and Quantitative Transient Stability Assessment of Stand-Alone Hybrid Microgrids in a Cluster Environment. Energies 2020, 13, 1286. [Google Scholar] [CrossRef] [Green Version]
- Chaudry, M.; Ekins, P.; Ramachandran, K.; Shakoor, A.; Skea, J.; Strbac, G.; Wang, X.; Whitaker, J. Building a Resilient UK Energy System, Research Report; UK Energy Research Centre: London, UK, 2011. [Google Scholar]
- He, P.; Ng, T.; Sub, B. Energy-Economic Recovery Resilience with Input-Output Linear Programming Models. Energy Econ. 2017, 68, 177–191. [Google Scholar] [CrossRef]
- Nuclear Regulatory Commission (NRC). Backgrounder on NRC Response to Lessons Learned from Fukushima, 17 September 2018. Available online: https://www.nrc.gov/reading-rm/doc-collections/fact-sheets/japan-events.html (accessed on 28 December 2020).
- Mulcahy, S. Many Texans have Died because of the Winter Storm. Just How Many Won’t be Known for Weeks or Months. Texas Tribune, 19 February 2021. Available online: https://www.texastribune.org/2021/02/19/texas-power-outage-winter-storm-deaths(accessed on 19 February 2021).
- Texas Dept. of State Health Services. Winter Storm-Related Deaths (Related to the February Storm). Available online: https://dshs.texas.gov/news/updates.shtm#wn (accessed on 20 April 2021).
- Electric Reliability Council of Texas. Preliminary Report on Causes of Generator Outages and Derates for Operating Days Feb 14–19, 2021 Extreme Cold Weather Event, Public Utility Commission of Texas, 6 April 2021. Available online: http://www.ercot.com/content/wcm/lists/226521/51878_ERCOT_Letter_re_Preliminary_Report_on_Outage_Causes.pdf (accessed on 6 April 2021).
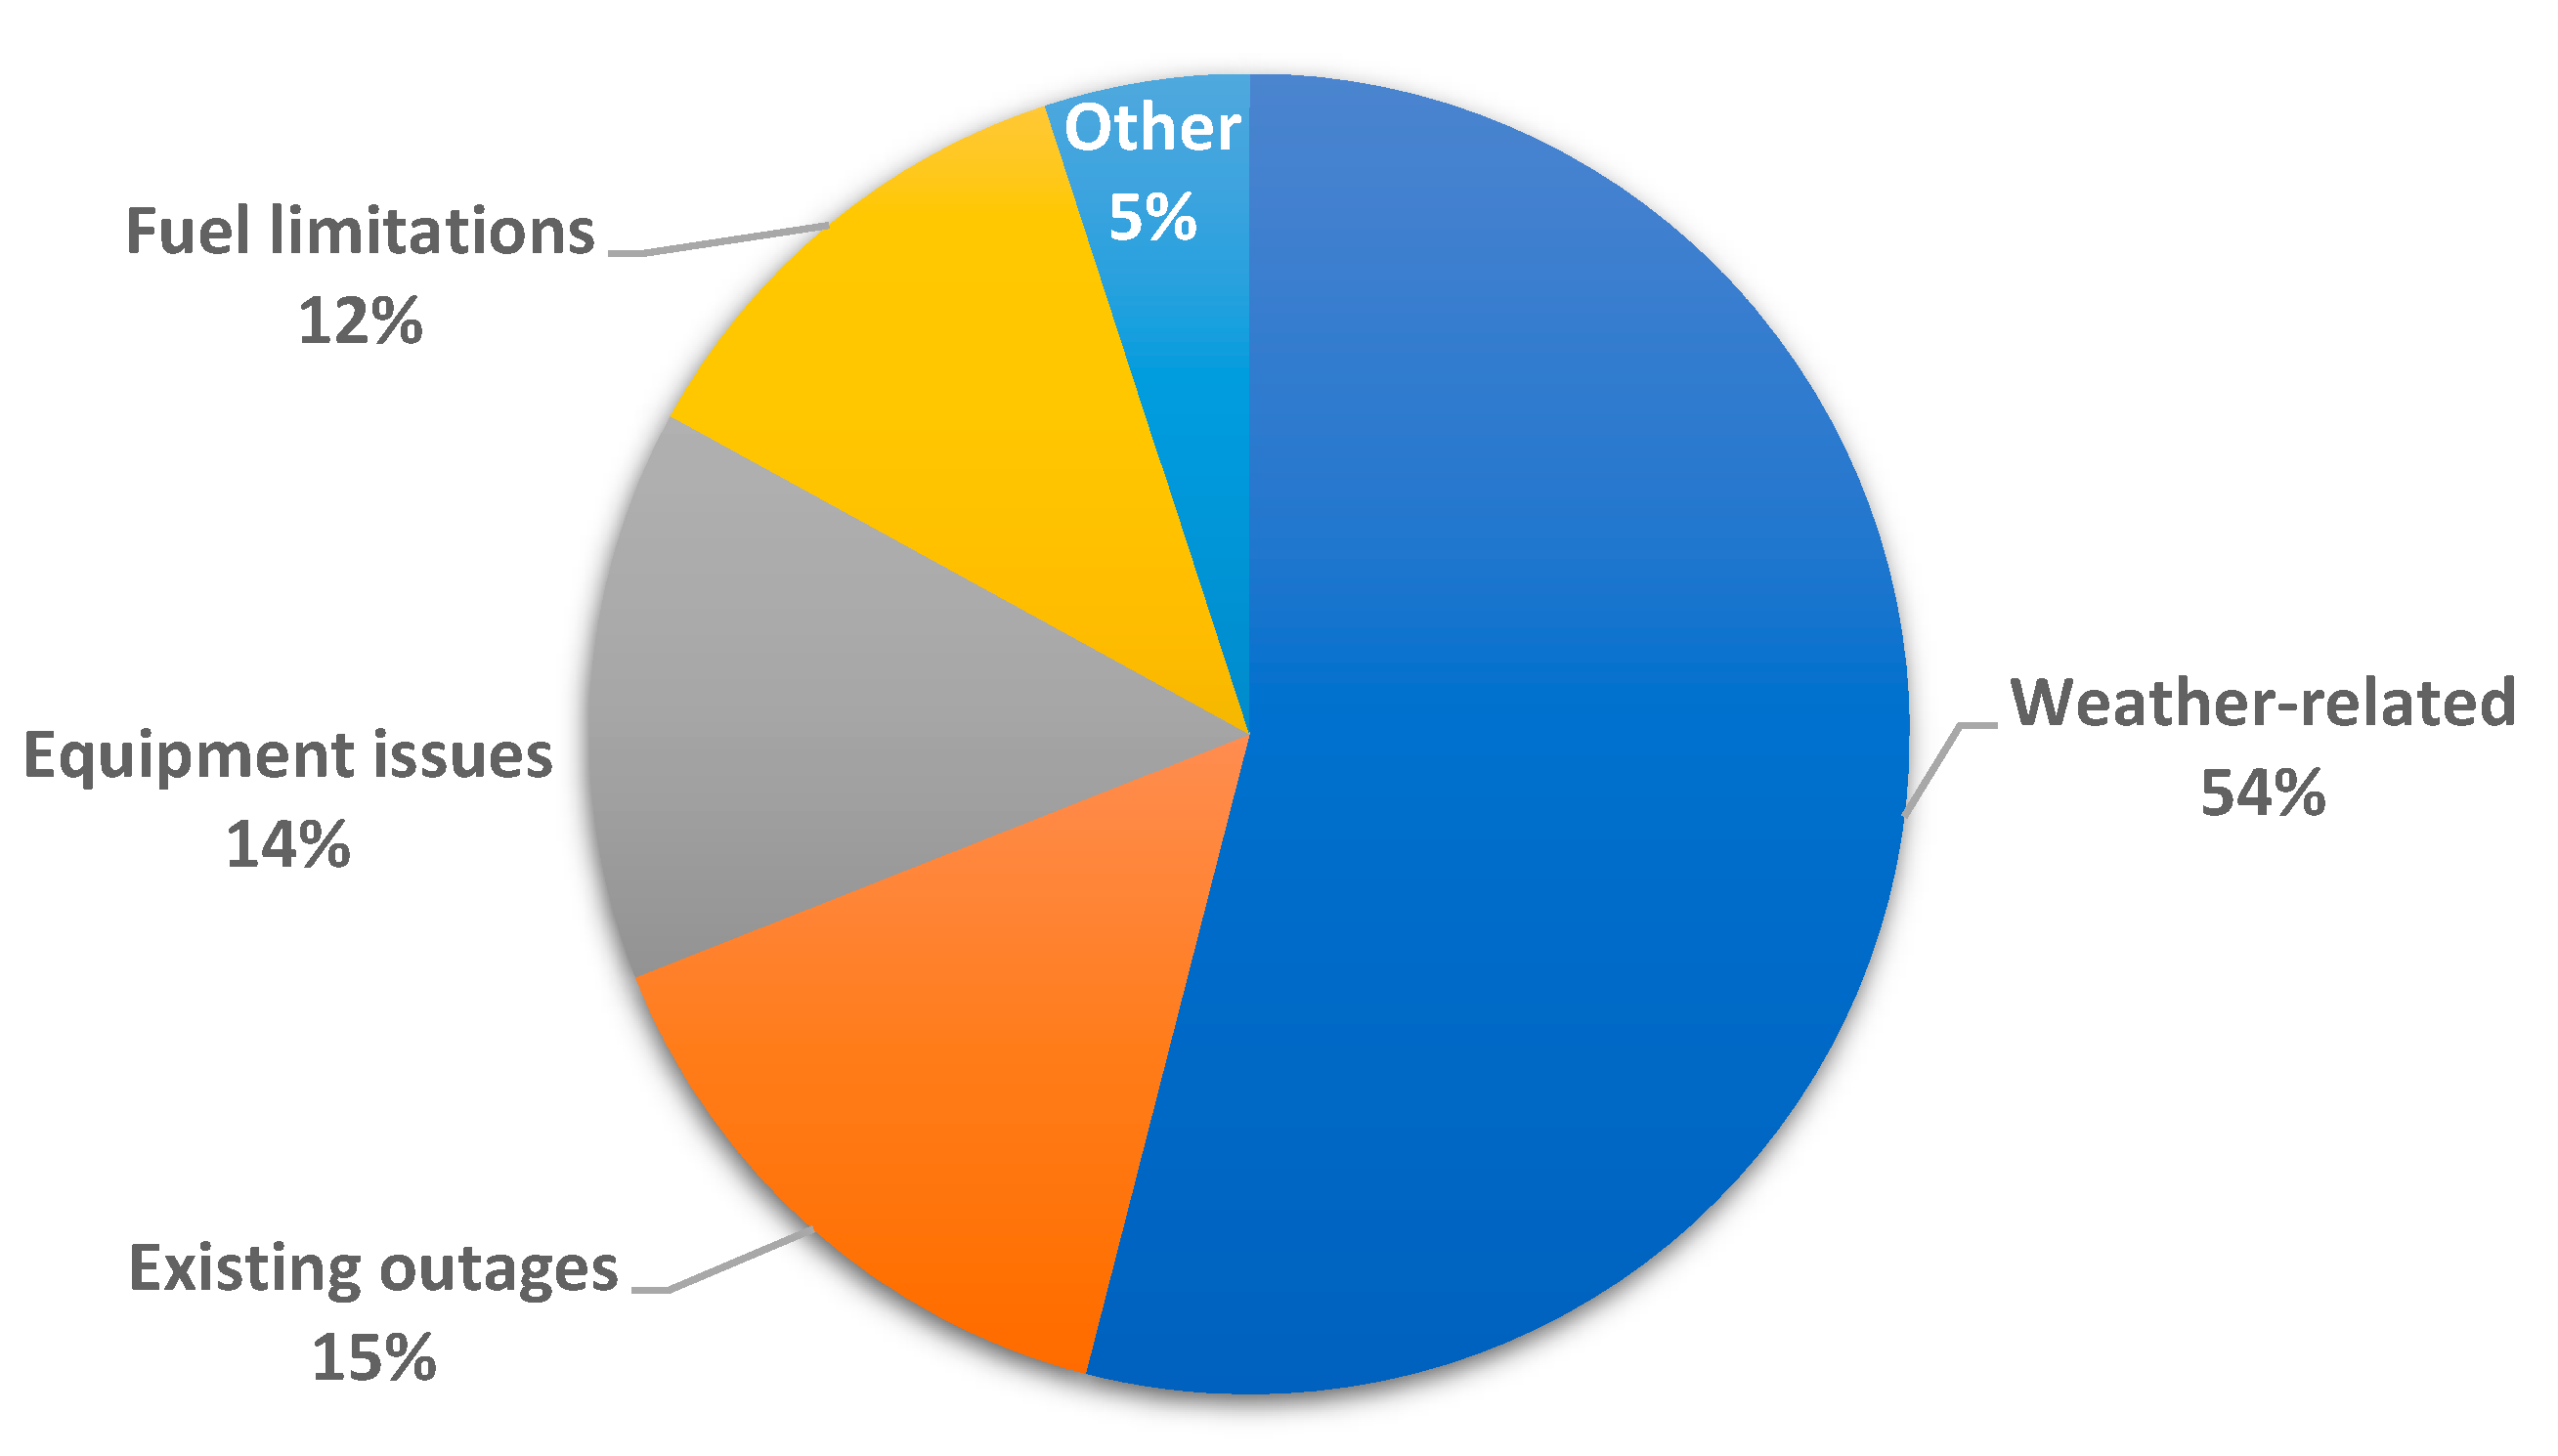
- Morehouse, C. Weather-related Outages Primary Cause of Texas Blackouts, New ERCOT P., Data Finds. Utility Dive, 7 April 2021. Available online: https://www.utilitydive.com/news/weather-related-outages-primary-cause-of-texas-blackouts-new-ercot-data-fi/597928(accessed on 7 April 2021).
- Pechman, C.; Nethercutt, E. Regulatory Questions Engendered by the Texas Energy Crisis of 2021; National Regulatory Research Institute: Washington, DC, USA, 2021; Available online: https://pubs.naruc.org/pub/2AF1F2F3-155D-0A36-3107-99FCBC9A701C (accessed on 30 May 2021).
- Cramton, P. Lessons from the 2021 Texas Electricity Crisis. Utility Dive, 23 March 2021. Available online: https://www.utilitydive.com/news/lessons-from-the-2021-texas-electricity-crisis/596998(accessed on 23 March 2021).
- Staffs of the Federal Energy Regulatory Commission and the North American Electric Reliability Corporation. Report on the Outages and Curtailments during the SW Cold Weather Event of February 1–5, 2011. North American Electric Reliability Corporation, 27 July 2011. Available online: https://www.nerc.com/pa/rrm/ea/February%202011%20Southwest%20Cold%20Weather%20Event/SW_Cold_Weather_Event_Final.pdf(accessed on 27 July 2011).
- Maize, K. Texas and the Capacity Market Debate. PowerMag, 1 February 2014. Available online: https://www.powermag.com/texas-and-the-capacity-market-debate(accessed on 5 January 2021).
- Electric Reliability Council of Texas. Report on Existing and Potential Electric System’s Constraints and Needs, December 2020. Available online: http://www.ercot.com/content/wcm/key_documents_lists/89026/2020_Report_on_Existing_and_Potential_Electric_System_Constraints_and_Needs.pdf (accessed on 30 May 2021).
- Electric Reliability Council of Texas. Grid Resilience Working Group Scope Document, April 2016. Available online: http://www.ercot.com/content/wcm/key_documents_lists/95758/Grid_Resilience_Working_Group__GRWG__Scope_Document__Final_04.19.16_.pdf (accessed on 30 May 2021).
- Electric Reliability Council of Texas. GRWG Topic List from 1st Meeting, May 3, 2016; Meeting Agendas, April 26, 2016; July 11, 2016; October 20, 2016. Available online: http://www.ercot.com/committee/grwg (accessed on 30 May 2021).
- National Academies of Sciences, Engineering, and Medicine. Strengthening Post-Hurricane Supply Chain Resilience. 2020. Available online: https://www.nationalacademies.org/our-work/building-adaptable-and-resilient-supply-chains-after-hurricanes-harvey-irma-and-maria (accessed on 30 May 2021).
- Houser, T.; Marsters, P. The World’s Second Largest Blackout, Rhodium Group. Rhodium Group, 12 April 2018. Available online: https://rhg.com/research/puerto-rico-hurricane-maria-worlds-second-largest-blackout(accessed on 30 May 2021).
- EIA, Puerto Rico Page. Available online: https://www.eia.gov/state/notes-sources.php?sid=RQ (accessed on 1 February 2021).
- PREPA, Integrated Resource Plan. Available online: https://aeepr.com/es-pr/QuienesSomos/Paginas/ley57/Plan-Integrado-de-Recursos.aspx (accessed on 1 May 2021).
- Puerto Rico Energy Bureau, Integrated Resource Plan. Available online: http://energia.pr.gov/en/integrated-resource-plan/ (accessed on 1 May 2021).
- The Nuclear Alternative Project. Preliminary Feasibility Study for Small Modular Reactors and Microreactors for Puerto Rico; Report No. 20-0001; The Nuclear Alternative Project. 2020. Available online: https://c70e8cf9-e47c-4b0a-9da6-222b08a3b87d.usrfiles.com/ugd/c70e8c_d2dc61982a514e439799e8ccbbe577e6.pdf (accessed on 5 December 2020).
- Puerto Rico Energy Public Policy Act 17, Signed into Law May 2019. Available online: http://www.mcvpr.com/newsroom-publications-Energy-Public-Policy-Law (accessed on 13 July 2021).
- Reyes, J.; Ingersoll, D. NuScale Power Plant Resilience Studies; American Nuclear Society Conference: Philadelphia, PA, USA, 2018. [Google Scholar]
- WECC, August 2020 Heatwave Event Analysis Report, 19 March 2021. Available online: https://www.wecc.org/Reliability/August%202020%20Heatwave%20Event%20Report.pdf (accessed on 19 March 2021).
- California Independent System Operator (CAISO); California Public Utility Commission (CA PUC); California Energy Commission. Root Cause Analysis, Mid-August 2020 Extreme Heat Wave, Report; CAISO: Folsom, CA, USA, 2021. [Google Scholar]
- Nguyen, D. Power Back to California after Brief Rolling Blackouts. Washington Post, 15 August 2020. [Google Scholar]
- Robb, J. Reliability, Resiliency and Affordability of Electric Service in the United States Amid the Changing Energy Mix and Extreme Weather Events; Testimony before the Committee in Energy and Natural Resources; United State Senate: Washington, DC, USA, 2021. [Google Scholar]
- NERC. Summer Reliability Assessment. 2021. Available online: https://www.nerc.com/pa/RAPA/ra/Reliability%20Assessments%20DL/NERC%20SRA%202021.pdf (accessed on 30 May 2021).
- USA Department of Energy, Office of Electricity, Western Interconnection, n.d. Available online: https://www.energy.gov/oe/services/electricity-policy-coordination-and-implementation/transmission-planning/recovery-act-0 (accessed on 15 June 2021).
- NERC. Summer Reliability Assessment, June 2019. Available online: https://www.nerc.com/pa/RAPA/ra/Reliability%20Assessments%20DL/NERC_SRA_2019.pdf (accessed on 30 May 2021).
- NERC. Summer Reliability Assessment. 2020. Available online: https://www.nerc.com/pa/RAPA/ra/Reliability%20Assessments%20DL/NERC_SRA_2020.pdf (accessed on 30 May 2021).
- La Fleur, C. What’s Ailing California’s Electric System? Comments, Columbia University, 2 September 2020. Available online: https://news.climate.columbia.edu/2020/09/02/whats-ailing-californias-electric-system/ (accessed on 2 September 2020).
- CAL Fire, Top 20 Most Destructive California Wildfires. Available online: https://www.fire.ca.gov/media/t1rdhizr/top20_destruction.pdf (accessed on 28 April 2021).
- CAL Fire, Top 20 Most Deadly California Wildfires. Available online: https://www.fire.ca.gov/media/lbfd0m2f/top20_deadliest.pdf (accessed on 28 April 2021).
- Trabish, H. Record Wildfire Threats Mean California Must Pick When and Where to Fight, Utilities, Analysts, CalFire Agree. Utility Dive. Available online: https://www.utilitydive.com/news/record-wildfire-threats-mean-california-must-pick-when-and-where-to-fight/599405/ (accessed on 30 May 2021).
- California Public Utilities Commission Emergency Reliability Rulemaking R.20-11-003, 25 March 2021. 2021. Available online: https://docs.cpuc.ca.gov/publisheddocs/published/g000/m373/k745/373745051.pdf (accessed on 13 July 2021).
- CAISO Summer Loads and Resources Assessment, May 2021. Available online: http://www.caiso.com/Documents/2021-Summer-Loads-and-Resources-Assessment.pdf (accessed on 30 May 2021).
- California Energy Commission, n.d. SB100 Joint Agency Report. Available online: https://www.energy.ca.gov/sb100 (accessed on 15 June 2021).
- Severe Impact Resilience Task Force. Severe Impact Resilience: Considerations and Recommendations; North American Electric Reliability Corporation: Atlanta, GA, USA, 2012; Available online: https://www.ourenergypolicy.org/wp-content/uploads/2012/05/SIRTF_Final_May_9_2012-Board_Accepted.pdf (accessed on 30 May 2021).
- NERC. Glossary of Terms Used in NERC Reliability Standards. updated 2 April 2021. Available online: https://www.nerc.com/files/Glossary_of_Terms.pdf (accessed on 30 May 2021).
- NERC. Definition of “Adequate Level of Reliability”; North American Electric Reliability Corporation: Princeton, NJ, USA, 2007; Available online: https://www.nerc.com/docs/pc/Definition-of-ALR-approved-at-Dec-07-OC-PC-mtgs.pdf (accessed on 30 May 2021).
- Rickerson, W.; Gillis, J.; Bulkeley, M. The Value of Resilience for Distributed Energy Resources: An Overview of Current Analytical Practices; Converge Strategies: Washington, DC, USA, 2019; Available online: https://pubs.naruc.org/pub/531AD059-9CC0-BAF6-127B-99BCB5F02198 (accessed on 30 May 2021).
- IEEE PES Industry Technical Support Task Force. The Definition and Quantification of Resilience; PES-TR65; IEEE Power & Energy Society: Piscataway, NJ, USA, 2018; Available online: https://grouper.ieee.org/groups/transformers/subcommittees/distr/C57.167/F18-Definition&QuantificationOfResilience.pdf (accessed on 30 May 2021).
- Institute of Electrical and Electronics Engineers. The Authoritative Dictionary of IEEE Standard Terms, 7th ed.; IEEE: Piscataway, NJ, USA, 2000. [Google Scholar] [CrossRef]
- Intergovernmental Panel on Climate Change; Annex I: Glossary in Global Warming of 1.5 °C. Available online: https://www.ipcc.ch/sr15/chapter/glossary (accessed on 30 May 2021).
- National Academies. Disaster Resilience: A National Imperative; The National Academies Press: Washington, DC, USA, 2012. [Google Scholar] [CrossRef]
- International Energy Agency. Making the Energy Sector More Resilient to Climate Change; IEA: Paris, France, 2015; Available online: https://www.iea.org/reports/making-the-energy-sector-more-resilient-to-climate-change (accessed on 30 May 2021).
| Intrinsic Measures | Open Cycle Turbines | Wind/Solar | Nuclear Large Plants | Nuclear SMRs |
|---|---|---|---|---|
| Maintenance Requirements | Moderate | Low | High | Moderate |
| Island-Mode Operation | High | High | Low | High |
| Geographic Dispersion | Moderate | High | Low | Moderate |
| Modular Structure | Moderate | High | Low | High |
| Real-Time Responsiveness | High | Low | Low | Moderate |
| Ramping Capabilities | High | Low | Low | Moderate |
| Capacity Factors and Duration | Moderate | Low | High | High |
| Need for Refueling with Regular Use | High | Low | Low | Moderate |
| Indicators | 2011 | 2021 |
|---|---|---|
| Generators offline | 193 | 356 |
| Duration of outage | 7.5 h | 70+ h |
| Lowest frequency | 59.58 Hz | 59.3 Hz |
| Maximum load shed | 4000 MW | 20,000 MW |
| Generation unavailable | 14,702 MW | 51,173 MW |
| Customers offline | 1,000,000+ | 4,500,000+ |
| Studies | Resilience Parameter(s) | Research Highlights |
|---|---|---|
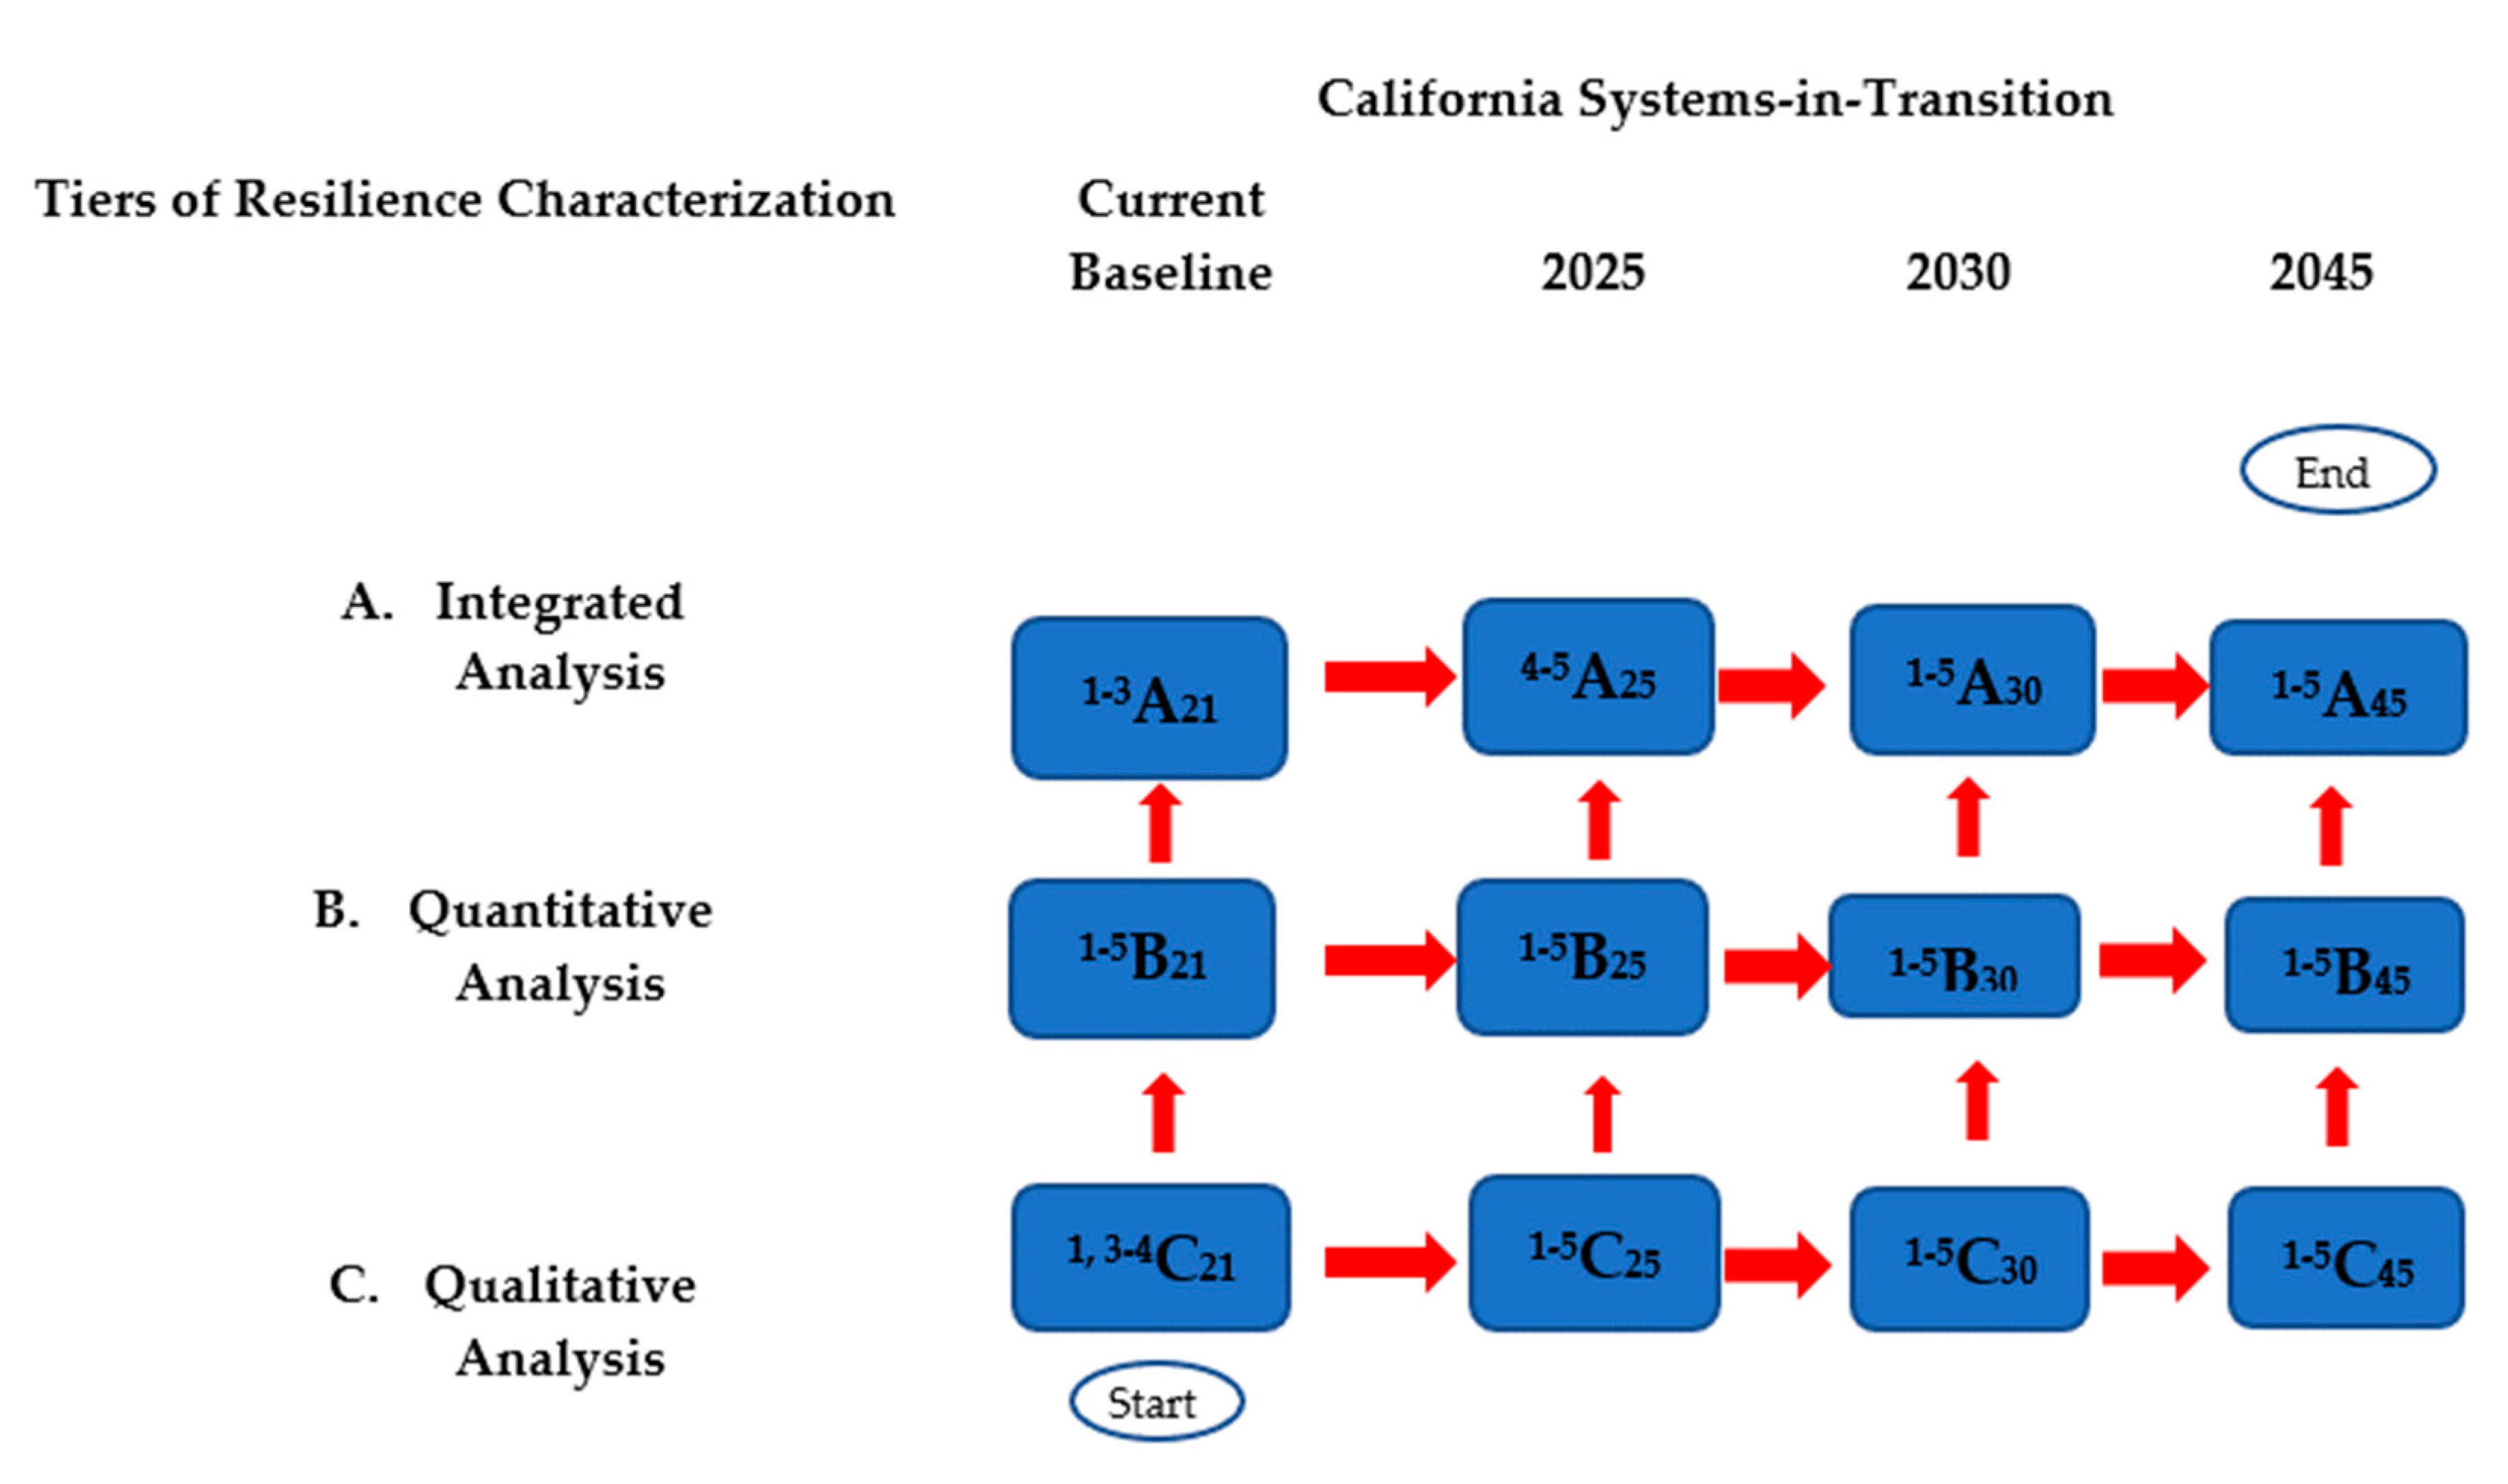
| Generator readiness | 1C21 | Qualitative and mechanistic understanding of resilience behavior and weatherization readiness as a function of ranked sensitivity and duration of generator outages |
| Regional priorities and constraints | 3–4C21 | Qualitative assessment of local preferences, ecological stewardship objectives and market capabilities |
| Cascading Failures | 1–5B21 → 1–3A21 | Integrated modeling of the effect of the power grid’s structural failure |
| Environmental Analysis (air quality) | 4A25 | Resiliency impacts to air/emissions associated with long-term changes to ambient temperatures by region |
| Critical Infrastructure (communications) | 5A25 | Integrated assessment of location and sensitivity levels of communication outages relative to stress points |
Publisher’s Note: MDPI stays neutral with regard to jurisdictional claims in published maps and institutional affiliations. |
© 2021 by the authors. Licensee MDPI, Basel, Switzerland. This article is an open access article distributed under the terms and conditions of the Creative Commons Attribution (CC BY) license (https://creativecommons.org/licenses/by/4.0/).
Share and Cite
Araújo, K.; Shropshire, D. A Meta-Level Framework for Evaluating Resilience in Net-Zero Carbon Power Systems with Extreme Weather Events in the United States. Energies 2021, 14, 4243. https://doi.org/10.3390/en14144243
Araújo K, Shropshire D. A Meta-Level Framework for Evaluating Resilience in Net-Zero Carbon Power Systems with Extreme Weather Events in the United States. Energies. 2021; 14(14):4243. https://doi.org/10.3390/en14144243
Chicago/Turabian StyleAraújo, Kathleen, and David Shropshire. 2021. "A Meta-Level Framework for Evaluating Resilience in Net-Zero Carbon Power Systems with Extreme Weather Events in the United States" Energies 14, no. 14: 4243. https://doi.org/10.3390/en14144243
APA StyleAraújo, K., & Shropshire, D. (2021). A Meta-Level Framework for Evaluating Resilience in Net-Zero Carbon Power Systems with Extreme Weather Events in the United States. Energies, 14(14), 4243. https://doi.org/10.3390/en14144243