Abstract
This study was conducted to develop and validate an instrument called sustainable performance (SP) in the banking sector. A mixed research design was used to understand the nature of SP techniques used by managers and employees from the banking sector. A qualitative approach was first employed to assess the types of SP techniques used through a set of interviews conducted with 11 bank managers. This was followed by a quantitative method to develop and validate an SP scale for use in the banking sector. Items for the assessment of SP were developed with a dataset comprising 415 people, and statistical analyses supported both the validity and reliability of this measurement instrument. This instrument consists of 39 items designed as a 5-point Likert scale. The study is restricted to the investigation that was conducted in certain banks operating in North Cyprus. The implications of the study suggest that managers and researchers could use SP to improve the firm performance of their organizations. This study makes a strong contribution by filling a gap in the literature. It focuses on assessing the SP performance of banks to understand their level of competitiveness.
1. Introduction
Banks’ effective and efficient activities are among fundamental issues for both the banking sector and national economies. The performance management of banks is an important topic of discussion in terms of its integration with the environment, and its ability to enable banks to take the necessary position against risk and competition conditions. In this study, the sustainability perspective was used as a mediator, while the connection between banking sector and firm performance was established. In fact, banks should gain a competitive advantage that is sustainable in accordance with the strategic targets of the geography in which they provide services. The absence of an up-to-date tool to measure bank performance in terms of sustainability is a neglected issue for banks’ competitive strategies. The main research question of our study originated from these conceptions, and we aim to develop an evaluation instrument in accordance with the views of participants in order to determine the sustainable-performance elements for banks to increase their service capacities and ensure their continued existence.
This article begins with a brief introduction. Then, approaches to performance measurement are given. The connections of measurement methods with studies in the literature are discussed, and gaps in the literature are shown. We also aim to resolve deficiencies in the literature because qualitative and quantitative research was not conducted together in previous studies.
2. Literature Review
In the literature, subjective (nonfinancial) and objective (financial) measurement methods are frequently used for performance management. Financial factors related to the performance of banks are the subject of many studies in the literature [1,2,3]. Since analyzing the financial factors for performance alone is not sufficient, in the recent literature, objective and subjective elements were also investigated together [4,5,6,7]. Mbama et al. [6], in their study conducted in the United Kingdom on the basis of the perceptions of managers, found important evidence indicating that the digital-banking experience is affected by perceived value, digital-banking innovation, service customization and speed, functional quality, employee–customer engagement, perceived risk, perceived usability, service quality, and brand trust. Al-Hawari [4] concluded that customer retention has a mediator effect on the effect of automated service quality on financial performance. Talavera et al. [5] found that age diversity within boards was negatively associated with bank profitability in banks in China, while directors’ views about risk, prudence, and wealth influencing intragroup conflicts in the decision-making process.
In practice, in addition to the possibility that objective criteria contained in firms’ financial statements may be incorrect, firms may lack appropriate objective criteria. In this context, the literature mentions that difficulties experienced in accessing objective data in order to evaluate organizational performance make it necessary to rely on subjective data [8]. Since subjective performance is measured by perception, it is determined according to the sector and the time period to which it refers. In this context, bank performance should be determined according to intangible and financial criteria. Additionally, while financial issues are considered to be traditional criteria, subjective performance criteria appear as a result of global competition conditions. In other words, in order for the competitive advantage of companies to be sustainable today, the performance of the company should be evaluated both with financial and nonfinancial factors.
Examinations of subject approaches include that of Choi, Poon, and Davis [9], who concluded that knowledge management strategies have synergistic effects on organizational performance in Korean companies. Hoque [10] investigated the performance improvement of manufacturing organizations in New Zealand under conditions of environmental uncertainty. Analysis concluded that performance should be a diminishing function of the mismatch between an organization’s atmosphere and the use of different combinations. Quick and Sayar [11] found that compliance management systems have a positive effect on the perceptions and decisions of bank directors.
Many academic studies in the banking sector seem to contain nonfinancial elements. A survey conducted with employees of private-sector banks in the Thanjavur district in India found a partial positive effect of career planning and development on employee satisfaction, and this situation keeps other factors constant [12]. In a survey study investigating the effects of leadership, compensation, work environment, and training on the performance of bank employees in Manado, work environment and compensation had a significant and positive effect on employee performance. On the other hand, while leadership and training had a positive effect, there was no significant effect on employee performance [13]. A positive and significant relationship between the remuneration and performance of employees in the banking agent was found in Kenya [14]. Ismail [15] found a strong relationship between the type of bank ownership and the quality of risk-based audit procedures. In their work, Wulandari and Subagio [16] conducted qualitative research using the phenomenological approach in Indonesia. The study was aimed at defining and understanding the customer decision-making process, and findings revealed the quality-of-service differences between conventional and Islamic banking. Cavus, Mohammed, and Yakubu [17] examined the reasons for the nonusage of mobile-banking apps by customers in the banking sector of Nigeria by using artificial-intelligence-based methods and structural equation modeling. The most important reasons for this situation were determined to be inadequate digital laws, facilitating conditions, trust, and risk. They reported that the study outcomes could be used for sustainability by the government and pecuniary institutions through improved growth and ensuring secured services. The studies of Murillo, Lobet, and Fuentes [18] concluded that the bank-specific characteristics of commercial-bank customers in the United States are important determinants of transactional website adoption decisions, and that banks adopt online-banking services earlier in markets where their competitors adopt such technologies. Nonfinancial factors are considered in performance measurement by shareholders, customers, employees, and institutions for the sustainability of performance.
In studies specific to Northern Cyprus, profitability [19,20,21], crisis-performance [22], sector-development [23], sector-profitability [24], and performance-analysis [25] issues were discussed, and performance studies were conducted in banks with objective elements. Studies examining subjective factors in Northern Cyprus focused on online-banking usage [26], online-banking risk [27], customer satisfaction [28], bank-employee performance [29], the recruitment process at the bank [30], and how employees perceive corporate performance [31]. The reason why banks are underperforming is discussed under the headings of the efficiency of the treasury departments of banks [32], sector efficiency [33], and sector profitability [20]. These studies stated that measures for poor performance should be increased. However, in terms of improving the performance of banks, the determination of subjective and sustainable characteristics compared to competitors is largely ignored in the literature. In this study, qualifications that bank organizations must possess in order to efficiently provide performance and carry out their activities are qualitatively investigated. It also defines the main themes of sustainable-performance elements, determined according to competitors. Then, sustainable-performance elements are determined according to the results of quantitative analysis, and ranked according to their importance levels. In addition, it contributes to the literature on the banking sector on sustainable performance.
The conducted qualitative interview using the research questions was prepared on the basis of findings of a literature review, and formed the basis for the development of a measurement tool that includes sustainable-performance features consisting of six themes. This study aims to prioritize sustainable-performance elements and provide evidence for strategies that need to be developed in terms of competitive advantage. In order to achieve this goal, the general structure of the study was maintained according to the approach of DeVellis [34].
3. Materials and Methods
The research was conducted with a mixed research design in order to ensure that the validity and reliability of the study were high. This method consists of two stages of successive research processes, minimizing the respective weaknesses of qualitative and quantitative approaches, and it uses multiple data-collection methods [35].
In the qualitative phase of the study, the inductive method and phenomenological approach were applied. A social constructivist interpretive framework was used as the emphasis was placed on subjectivity in the phenomenological study. A snowball sampling procedure was employed for the qualitative phase. The qualitative sample consisted of 6 male and 5 female participants with 15 to 30 years of industry experience. Seven were undergraduates and four were postgraduates. Two were on the board of directors, 1 was a general manager, 2 were internal systems managers, and 6 were senior executives. The demographic characteristics of participants reflected different opinions, and thus gave rise to a complex phenomenon. The data-collection instrument was a one-to-one semistructured interview. According to the topics to be answered, the interview guide was systematically arranged and structured. The researchers attempted to obtains the answers of the participants to the following questions.
- What do the sustainable-performance elements mean?
- Which functions need to be focused on to achieve better sustainable performance than that of competitors?
- How are the activities are conducted in your organization?
The focus of the quantitative phase is cross-sectional. In the quantitative phase, convenience sampling, one of the nonprobability sampling methods, was used. With the convenience-sampling method, speed and practicality are gained, differences in the perceptions of respondents are determined, and cost advantage is provided. In addition, the validity and reliability of the developed scale are ensured, and it can be used where the research is conducted.
Assumptions: The professional experience and level of knowledge of the participants were sufficient. They were knowledgeable about SP elements, they gave equivalent and sincere answers to the questions, the validity and reliability of research data were sufficient, and the data were correctly and robustly obtained and analyzed.
Limitations: By its nature, the qualitative-research method has a limited number of samples, and quantitative data are limited to the banks in Northern Cyprus. The field of study is limited to SP elements, and validity is limited to the instruments (reliability of the answers given in the questions, which were prepared on the basis of the literature and the answers of participants) used in the study.
Instrument Development and Data Collection
Following Devellis’ [34] criteria, a tool was built based on qualitative research, as follows:
- Determine exactly what you want to measure.
- Make a pool of items.
- Decide on the measurement format.
- Experts should review the original item pool.
- Validation elements should be considered.
- Apply items to a scale of development.
- Evaluating the items: the main point of scale development.
- Scale length should be optimized.
Due to the nature of qualitative research, the respondents were limited to the interview guide prepared by the researcher. The average time for the interviews was 30–40 min. Interviewee opinions were analyzed and divided into categories. The findings were analyzed and descriptively discussed. It is important for the same data set to show similarity by different coders, so that this does not reflect the individual effect of the researcher [36]. These six components are as follows:
Theme 1: Internal control includes all internal controls that manage risk, protect corporate-asset data, and control employee or workplace corruption. With a proper understanding of internal controls, management can design an internal-control system that supports a positive business environment. Although it is not possible to prevent all losses from occurring with a well-designed internal-control system, opportunities to significantly reduce the risk of loss and identify the responsible party increase.
Theme 2: The client element is the focal point of strategies and policies aimed at realizing all banking activities. The achievement of determined targets, durability, and continuity of earnings is possible by improving customer relations.
Theme 3: The prestige element is formed by the combination of the most important factors that the organization wins against its competitors. It contains all the necessary qualifications on prestige and reputation in banking.
Theme 4: The macroelement includes elements that provide integration with the external banking environment. It is important that island societies closely follow developments through these channels. Otherwise, closed societies become increasingly detached from global developments and have difficulties in accepting innovations.
Theme 5: If the policy element is not correctly set up, the policies cause low-quality loans and damage the bank, while health policies ensure that the performance of the bank is healthy.
Theme 6: For the human-resource element, activities aimed at increasing the professional competence of employees should be further developed. Otherwise, low efficiency, inefficiency, and ineptitude arise.
The qualitative stage in which categories of measurement are determined conceptually and logically provides the scope validity of the scale. The questionnaire draft was shared with top-level bank managers and academicians, and their opinions were sought on the evaluation of the items. When the qualitative phase was connected to the quantitative phase, interface-point data were combined, and a questionnaire was prepared. The adopted quantitative approach consisted of a survey. The scale form was prepared with answers ranging from very much below competitor (1) to very much above competitor (5). According to Büyüköztürk, Çakmak, Akgün, Karadeniz, and Demirel [37], if the neutral-point option is included in the answer scale, the probability of responding by choosing the neutral point option increases even if the respondent does not tend to answer the asked question in a certain direction. The scope validity of the scale was quantitatively provided in a statistical manner. After conducting the pilot study (56 surveys), the questionnaire draft was completed. Subsequently, a survey was initiated to collect data from bank employees in Northern Cyprus. The profile of the respondents participating in the quantitative research is presented in Table 1.

Table 1.
Profile of respondents.
4. Results
A series of statistical tests were performed by using statistical packets. Factor analysis was performed using the principal-component analysis (PCA) and varimax (kappa = 4) methods, the latter of which is the most widely used factor-extraction method in the social sciences [38]. On the basis of data from 56 surveys collected in Northern Cyprus, the dimension of sustainable performance was revealed. In the pilot study analysis, the Kaiser–Mayer–Olkin (KMO) test value was found to be 0.732, which is greater than the threshold of 0.50 recommended in the literature [38]. Therefore, these items sufficiently contributed to the current scale. According to the BTS results, the chi-squared value (x2 = 2351.452) was statistically significant (p = 0.000 < 0.001). On the basis of all these values, the data structure was suitable for factor analysis. EFA was performed on the collected data from 315 participants during the scale development process to determine the number of items. Accordingly, as the KMO measure of sampling adequacy (KMO = 0.944) value approached 1, the dataset was considered to be highly efficient in measuring the phenomenon in question [38]. The result of BTS chi-squared (x2 = 9978.254) was statistically significant (p = 000 < 0.001), indicating that the scale was effective in measuring the subdimensions of the phenomenon.
In the period of March–December 2019, the number of personnel working in the sector increased from 3140 to 3193 [39]. If the population size is in the range of 3000–4000, a sample size of 364 is sufficient when the confidence level is 95% at a 5% precision level [40]. EFA was performed with 415 people to establish a strong factor structure, and validate the initial EFA results. The KMO value for this dataset was 0.947 and, since it was over 0.90, it was interpreted as perfect [21]. According to the BTS results, chi-squared (x2 = 12,778.716) was statistically significant (p < 001). The percentage of cumulative variance explained by the number of factors to be preferred was also considered [41]. These factors explain 15.36%, 27.54%, 39.30%, 50.80%, 60.52%, and 68.982% of the cumulative variance, respectively (Table 2). The contribution of these six factors to the variance is 68.98%. Therefore, it was appropriate to set the number of factors as 6 according to the scree plot. The percentage of cumulative variance explained by the number of factors to be preferred was also considered. When the two criteria were evaluated together, the appropriate number of factors was decided, as shown in Figure 1. According to the EFA result, the standardized-loading values of 39 items varied between 0.550 and 0.855 (Table 3). The variables below the first EFA and repeating EFA factors were considered to be quite good (0.50) and above as absolute value [38]. Extraction values were between 0.580 and 0.818 (Table 4). The extraction values of the items in preliminary EFA and repeating EFA were greater than 0.50 for all 39 items [38]. This showed the quality of communality. With the anti-image option, the adequacy of 39 items in the scale to be included in the scale was examined (Table 4). This value provides a condition of greater than 0.50 for each item [42]. The scale explains approximately 68.98% of the variance, and all scale items had high factor loadings, indicating that the construct validity was sufficient.
Table 2.
Factor-analysis result of the scale (415 participants).
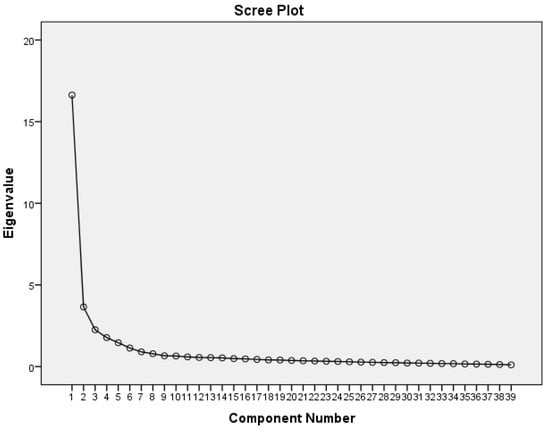
Figure 1.
Scree plot of exploratory-factor analysis (415 participants).
Table 3.
Instrument reliability and validity.
Table 4.
Factor-analysis results (415 participants).
Considering the Cronbach’s alpha coefficients in Table 3 in the reliability analysis performed with the sustainable-performance factor, the general reliability of the scale was calculated to be 0.963. Cronbach’s alpha coefficients for all subitems were between 0.875 and 0.934, so it could be used safely in the formation of scientific judgments with high validity and reliability [42].
CFA was conducted as statistical analysis to support the factor structure obtained from EFA with a dataset of 415 people. In this way, it was tested whether the six-factor model obtained from EFA was compatible with the data [43]. Modification indices make suggestions to strengthen the fit of the model to the data. When the MI values of covariances were examined when CFA was applied, there was an MI value of 137.006 between the e4 and e6 error terms, an MI value of 83.927 between the e17 and e19 error terms, an MI value of 74.491 between the e28 and e29 error terms, an MI value of 69.498 between the e2 and e4 error terms, and an MI value of 52.556 between the e3 and e5 error terms. There was an MI value of 49.749 between the e1 and e8 error terms. There was a very high MI value between error terms under the same implicit structure. In order to improve the model, a double-headed arrow was placed between these error terms, and the model was analyzed. In the figure below, the relationships between the hidden and observable variables were drawn for the test of the six-factor structure expressed in the study.
The statistics regarding the model fit coefficients have been examined. Fit values were found to be x2/df = 2.632; RMR = 0.050; PGFI = 0.716; IFI = 0.911; TLI = 0.903; CFI = 0.911; PNFI = 0.794; PCFI = 0.837; RMSEA = 0.630 (Table 5). It is seen that the model is statistically significant [41,43,44,45]. An examination of the correlation values in Table 6 shows that the correlations between internal control and client (r = 0.436), internal control and macro (r = 0.384), internal control and policy (r = 0.424), and policy and macro (r = 0.48) were considered to be low-level positive correlations. The relationships between prestige and human resource (r = 0.790), client and prestige (0.786), and client and human resource (r = 0.763) are considered to be high positive correlations. Among other factors, there were moderate relationships since the correlation coefficients were slightly lower than 0.50 (Figure 2).
Table 5.
Findings of confirmatory-factor analysis.
Table 6.
Correlation matrix of sustainable-performance dimensions.
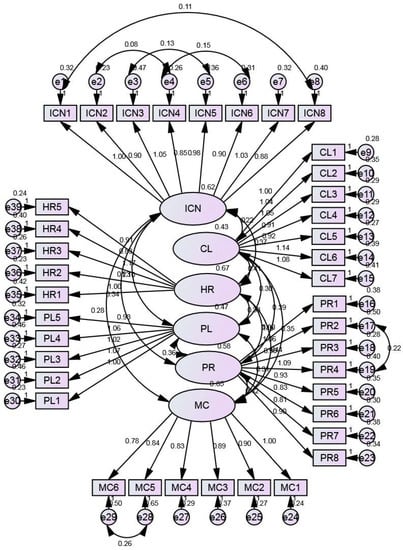
Figure 2.
Model of relationship between sustainable-performance dimensions and subsequent factors. Note: internal control (ICN); client (CL); prestige (PR); macro (MC); policy (PL); human resource (HR).
Analysis of the ranking of sustainability performance’s subdimensions indicated that the average score (inter control) was rated as very much above a competitor with a mean of 4.00, followed by client, prestige, macro, policy, and human resources.
The Mann–Whitney U test was conducted to determine whether the perceptions regarding sustainable performance significantly differed by gender [38]. According to the results of the Mann–Whitney U test, internal control, policy, and human resources did not significantly differ according to gender, but client (U = 14,418.000; p = 0.000) prestige (U = 15,603.000; p = 0.010), and macro (U = 14,708.500; p = 0.001) showed significant differences (Figure 3).
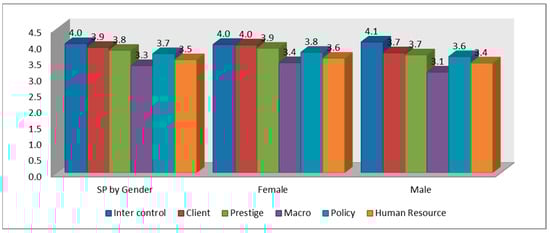
Figure 3.
Sustainable performance: comparison by gender.
The Kruskal–Wallis test was used to determine whether employees’ perceptions towards sustainable performance significantly differed according to position in the organization [38]. According to the results of the Kruskal–Wallis test, client, prestige, and policy did not significantly differ according to position in the organization, but macro (k-w = 22.002; p = 0.000), internal control (k-w = 12.338; p = 0.015), and human resources (k-w = 12.468; p = 0.014) significantly differed (Figure 4).
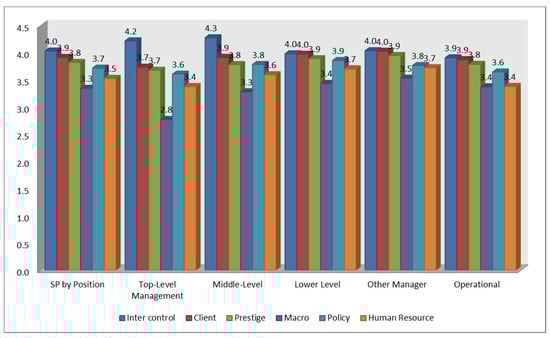
Figure 4.
Sustainable performance: comparison by position in the organization.
5. Discussion, Limitations, and Recommendations
For the purpose of this research, SP elements, which are important in the Northern Cyprus financial sector and the country’s economy, were investigated in order for banks to take a relative position to their competitors and efficiently carry out their activities. The findings of the qualitative study were based on quantitative-research results gained from interviews with field experts. The questionnaire was finalized through the application of a pilot study. To determine the number of factors, EFA was performed with a dataset of 315 in the first phase. In the second phase, in order to establish a strong factor structure and validate the results of the preliminary EFA, EFA was performed again by adding a 100-person dataset to the 315-person dataset used in the first phase. According to the results of 415 person EFA, 68.982% of the original variance explaining the dimensions of SP was factorized into 39 items and 6 subdimensions. KMO values greater than 0.50 indicated that the items sufficiently contributed to the scale. Extraction values were higher than 0.58 in all 39 items. Lastly, the factor structure of the 415-person dataset was supported by CFA, and evidence was provided for construct validity. The CMIN/DF value, in other words, the x2/df statistic, was found to be 2.632. Since this value had a value between 2 and 3, it was a good-fit criterion [44]. Generally, statistics regarding the fit goodness of the model were examined. The RMR statistic showed a perfect fit criterion by taking the value of 0.05 [41]. The PGFI statistic was greater than 0.50 and was a good-fit criterion, taking the value of 0.716 [45]. IFI, TLI, and CFI compliance statistics were good-fit criteria by taking values greater than 0.90 [41,43]. PNFI statistic showed a good-fit criterion with a value of 0.794, greater than 0.50 [45]. The PCFI statistic also showed a good-fit criterion with a value of 0.837, which is greater than 0.50 [45]. The RMSEA statistic showed a good-fit criterion with a value of 0.063, which is greater than 0.50 [44]. When the fit coefficients obtained as a result of confirmatory-factor analysis were examined, the model was compatible.
The sustainable-performance six-point Likert scale was developed according to the obtained results from this study, and is a valid and reliable measurement tool that can be used in the banking sector. The average scores given to each SP element were evaluated between groups according to both gender and position in the organization. The average score of the client for women (mean = 4) was higher than the average score of men (mean = 3.7). The average score of prestige for women (mean = 3.9) was higher than the average score of men (mean = 3.7). Nevertheless, the average macroscore for women (mean = 3.4) was higher than the average score of men (mean = 3.1). The average score of intercontrol for top- (mean = 4.2) and middle-level (mean = 4.3) managers was higher than the average score of other managers and employees. However, the average scores of macro for lower-level managers (mean= 3.4), other managers (mean = 3.5), and operational employees (mean = 3.4) were higher than those of top- (mean = 2.8) and middle-level (mean = 3.3) managers. The average scores of human resources for top- and operational-level managers were lower than the average score of middle levels. Empirical results revealed that bank managers and employees in Northern Cyprus had the highest average scores with regard to internal-control elements with an average of 4.0, followed by client and prestige elements, with an average of 3.9 and 3.8. However, the macroelement had the lowest average, with an average of 3.3 in the 6 subdimensions. Legal, regional, political, and sociocultural factors, and technological infrastructure item scores in Northern Cyprus banks, which are among macroelements, are at low levels. Policy and human-resource elements had averages of 3.7 and 3.5, respectively. SP elements of Northern Cyprus banks need to be improved in terms of sustainability and efficiency. The dimensions of SP are an emerging instrument. New ideas and practices need to be developed for the management practices of banks. Thus, companies can obtain new information about organizational management and performance, which can be integrated into a management framework with the SP application.
The current research also has some limitations. This study was only conducted in the northern part of Cyprus. Therefore, a study can be conducted across the island of Cyprus to determine the relationship between SP elements by adding variables that are thought to affect performance. The identified characteristics in SPs can be further tested in other economies and industries. While the research was being conducted, the global COVID-19 pandemic was ongoing, which was another limitation. In this context, digital change in banking is continually gaining momentum. In the recent literature, with the emergence of private digital currencies in the finance sector, the current status of a Central Bank-Backed Digital Currency (CBDC) is being investigated [46,47]. There are contrasting trends between the advocates and critics of the establishment of a CBDC [48]. If a CBDC is implemented, a number of risks are addressed systemwide [49]. In addition, there are those who argue that a properly designed central-bank digital currency does not threaten financial stability [50]. There is uncertainty as to whether the competitive structure in the banking sector is growing stronger or weakening and shrinking. There is uncertainty regarding how rapid developments in areas such as artificial intelligence, blockchain technology, collaborative ecosystems, cryptocurrency, demographics, and customer experience could affect the future of banking. Future researchers can investigate the relationship among digital transformation, distributed ledger technology themes, and SP elements, or they can add a new conceptual dimension that includes these and similar themes to the SP scale. Collaborations and strategies can be supported in which academia (university, research institutes), banks (institutions for financial services), and private-sector institutions or organizations (SME, small and medium enterprises) come together.
6. Conclusions
In this study, using the mixed method approach, qualitative data were collected through an extensive literature review and interviews. The study was inspired by the fact that, despite the large number of studies on subjective performance, these studies were disconnected from each other, and there is no generally accepted comprehensive scale. Most of the research has focused on one or more business-performance types. However, in order to achieve high performance, organizations must create synergies by mobilizing their performance as a whole. The fact that SP elements are included under the same factor structures in analytical results is proof of this. The high value of most items means that institutions in the banking sector are engaged in all aspects of SP. When 415 datasets were evaluated, the findings were very reliable. According to the results of all analyses, all 39 items had high validity and reliability. The measured conceptual dimensions were consistent with the theoretical content. The 39-item questionnaire measured SP phenomena as a 6-point Likert scale.
The results of this innovative research provide information about the main variables for sustainable performance. This information can be used to enhance the positive behavior of human resources and to support sustainable performance in Northern Cyprus banks. This causes the functions of human resources to have a positive effect on SP. For these reasons, a suitable environment should be developed in Northern Cyprus banks that could stimulate human-resource management procedures, SP, and organizational behaviors.
In terms of practical and managerial implications, the main findings show that the human-resource management functions of Northern Cyprus banks could be beneficial if strengthened, and improved in terms of subjective performance and organizational behaviors. This is because human-resource management functions can improve the function of the working personnel in the organization and ultimately lead to the improvement of the level of SP.
Author Contributions
Conceptualization, F.K.; methodology, F.K.; software, F.K.; validation, F.K., E.G. and D.K.; formal analysis, F.K.; investigation, E.G.; resources, F.K.; data curation, F.K. and E.G.; writing-original draft preparation, F.K.; writing-review and editing, F.K. and D.K.; visualization, D.K.; supervision, E.G.; project administration, F.K., E.G. and D.K. All authors have read and agreed to the published version of the manuscript.
Funding
This research received no external funding.
Institutional Review Board Statement
The study was conducted according to the research guidelines approved by the Ethics Committee Review Board of the Near East University of North Cyprus.
Informed Consent Statement
Informed consent was obtained from all subjects involved in the study.
Data Availability Statement
Not applicable.
Acknowledgments
The authors thank field experts and respondents for their responses and referees for the comments that improved this paper.
Conflicts of Interest
The authors declare no conflict of interest.
References
- Fukuyama, H.; Matousek, R. Modelling bank performance: A network DEA approach. Eur. J. Oper. Res. 2017, 259, 721–732. [Google Scholar] [CrossRef]
- Lopez, J.A.; Rose, A.K.; Spiegel, M.M. Why Have Negative Nominal Interest Rates Had Such a Small Effect on Bank Performance? Cross Country Evidence. Eur. Econ. Rev. 2020, 124, 103402. [Google Scholar] [CrossRef]
- Sharma, S.; Anand, A. Income diversification and bank performance: Evidence from BRICS nations. Int. J. Prod. Perform. Manag. 2018, 67, 1625–1639. [Google Scholar] [CrossRef]
- Al-Hawari, M. The effect of automated service quality on bank financial performance and the mediating role of customer retention. J. Financ. Serv. Mark. 2006, 10, 228–243. [Google Scholar] [CrossRef]
- Talavera, O.; Yin, S.; Zhang, M. Age diversity, directors’ personal values, and bank performance. Int. Rev. Financ. Anal. 2018, 55, 60–79. [Google Scholar] [CrossRef]
- Mbama, C.I.; Ezepue, P.; Alboul, L.; Beer, M. Digital banking, customer experience and financial performance. J. Res. Interact. Mark. 2018, 12, 432–451. [Google Scholar] [CrossRef]
- Owusu, A. Business intelligence systems and bank performance in Ghana: The balanced scorecard approach. Cogent Bus. Manag. 2017, 4, 1–22. [Google Scholar] [CrossRef]
- Matsuno, K.; Mentzer, J.T.; Ozsomer, A. The Effects of Entrepreneurial Proclivity and Market Orientation on Business Performance. J. Mark. 2002, 66, 18–32. [Google Scholar] [CrossRef]
- Choi, B.; Poon, S.K.; Davis, J.G. Effects of knowledge management strategy on organizational performance: A complementarity theory-based approach. Omega 2008, 36, 235–251. [Google Scholar] [CrossRef]
- Hoque, Z. Linking environmental uncertainty to non-financial performance measures and performance: A research note. Br. Account. Rev. 2005, 37, 471–481. [Google Scholar] [CrossRef]
- Quick, R.; Sayar, S. The impact of assurance on compliance management systems on bank directors’ decisions. Int. J. Audit. 2021, 25, 3–23. [Google Scholar] [CrossRef]
- Kumar, V.S.; Manonmani, A. Conceptual Model Fit for Career Planning and Development of Employees with Special Reference to Private Sector Banks by Using Structural Equation Model. Am. J. Ind. Bus. Manag. 2018, 8, 1972–1990. [Google Scholar] [CrossRef][Green Version]
- Laksmana, D.A.; Lapian, S.J.; Tumewu, F. The Effect of Compensation, Leadership, Work Environment, and Training on Employee Performance of Bank Syariah Mandiri Manado. J. EMBA 2015, 3, 522–532. [Google Scholar] [CrossRef]
- Munyua, C.K.; Rukangu, S.; Ibuathu, C.N. Influence of remuneration on performance of banking agent workers in Meru County, Kenya. Int. J. Econ. Commer. Manag. 2015, 3, 702–714. Available online: http://repository.must.ac.ke/handle/123456789/217 (accessed on 5 June 2021).
- Ismail, T. Internal auditors’ perception about their role in risk management audit in Egyptian banking sector. Int. J. Econ. Account. 2012, 3, 196. [Google Scholar] [CrossRef]
- Wulandari, D.; Subagio, A. Consumer Decision Making in Conventional Banks and Islamic Bank based on Quality of Service Perception. Procedia Soc. Behav. Sci. 2015, 211, 471–475. [Google Scholar] [CrossRef][Green Version]
- Cavus, N.; Mohammed, Y.B.; Yakubu, M.N. An Artificial Intelligence-Based Model for Prediction of Parameters Affecting Sustainable Growth of Mobile Banking Apps. Sustainability 2021, 13, 6206. [Google Scholar] [CrossRef]
- Hernández-Murillo, R.; Llobet, G.; Fuentes, R. Strategic online banking adoption. J. Bank. Financ. 2010, 34, 1650–1663. [Google Scholar] [CrossRef]
- Bektaş, E. Test of market structure and profitability in liberalizing the deposit market: The case of North Cyprus. Probl. Perspect. Manag. 2006, 4, 62–67. Available online: https://www.businessperspectives.org/index.php/journals/problems-and-perspectives-in-management/issue-10/test-of-market-structure-and-profitability-in-liberalizing-the-deposit-market-the-case-of-north-cyprus (accessed on 6 June 2021).
- Kutlay, K.; Safakli, O.V. The Relationship between Bank Profitability and Micro Variables with Particular Emphasis on Bank Type: The Case of Northern Cyprus. Int. J. Acad. Res. Account. Financ. Manag. Sci. 2018, 8, 26–40. [Google Scholar] [CrossRef]
- Kutlay, K. Factors affecting bank profitability in Northern Cyprus: An empirical investigation. In Proceedings of the 2nd Interna-tional Conference on Scientific Cooperation for the Future in the Economics and Administrative Sciences, Thessaloniki, Greece, 6–8 September 2017; pp. 231–237. Available online: https://d1wqtxts1xzle7.cloudfront.net/54540244/riba.pdf?1506425021=&response-content-disposition=inline%3B+filename%3DConfer-ence_Paper_Din_Iktisat_Iliskisi_Ri.pdf&Expires=1623000096&Signature=Uyi8tVaKw4MWD666aUCqomPR33jtho6PYzdamXzGZve5PV1sLl-ORRSKkvWudYia8LYP-TCIL-3r4jHi~njPuGtXoO3mZMVZ09IR1F16qMVLKVEVA0fMtOHp8YMxvPVsznDw6cAirrTPWqOrOfifKhrFWiovNaNChWSLe6ZcmpyP1P4bKRzwZbpCTPGrcXrJWUOuEfRBWQzzY38ewrs0FcL9hRYU0cIE-sCPMd2Oo7EAixdVRs4AIQbc0E0GWgb6VrtTRW6ZguSGShUGPZ5HIQRHgwy6jk6elIWjk1S3JEMn2SH9F0oNPFfveAQ9mNkrU2AqqBDMma16Yb5s-V-fsnQ__&Key-Pair-Id=APKAJLOHF5GGSLRBV4ZA#page=238 (accessed on 6 June 2021).
- Şafaklı, O.V.; Altuner, T. Comparative Outlook on the Pre and Post Crisis Periods for The Banking Sector of Turkish Republic of Northern Cyprus (TRNC). J. Yaşar Univ. 2009, 4, 2573–2610. Available online: https://dergipark.org.tr/tr/pub/jyasar/issue/19128/202978 (accessed on 6 June 2021).
- Şafaklı, O.V. Problems and Measures for the Turkish Cypriot Financial Sector with particular emphasis on Banking Sector. Int. J. Bus. Mgt. Econ. Res. 2010, 1, 85–97. Available online: http://www.ijbmer.com/vol1issue1.php (accessed on 5 June 2021).
- Nwobodo, J.C. Internet Banking in Terms of Profitability: The Case of Northern Cyprus Banks. Master’s Thesis, Institute of Graduate Studies and Research, Eastern Mediterranean University, Gazimağusa, North Cyprus, 2011. [Google Scholar]
- Altay, O.A.; Olkan, L.A. Performance Analysis of Commercial Banks in TRNC During the Period of 2009–2013. EUL J. Soc. Sci. 2015, 6, 59–75. Available online: https://dergipark.org.tr/en/pub/euljss/issue/22801/243397 (accessed on 6 June 2021).
- AlHassany, H.; Faisal, F. Factors influencing the internet banking adoption decision in North Cyprus: An evidence from the partial least square approach of the structural equation modeling. Financ. Innov. 2018, 4, 29. [Google Scholar] [CrossRef]
- Serener, B. Barriers to the use of internet banking among Nigerian and Zimbabwean students in Northern Cyprus. J. Manag. Econ. Res. 2018, 16, 347–357. [Google Scholar] [CrossRef][Green Version]
- Huseynova, G. Customer Satisfaction in Banking Sector: The Case of North Cyprus. Master’s Thesis, Institute of Graduate Studies and Research, Eastern Mediterranean University, Gazimağusa, North Cyprus, 2018. [Google Scholar]
- Kutlay, K.; Safakli, O.V. The Impact of Training and Development Programs on the Banking Personnel. Rev. Cercet. Interv. Sociala 2019, 65, 292–305. [Google Scholar] [CrossRef]
- Avcılar, U.; Umarbeyli, Ş. The relation between recruitment process scores and probation process performance: A research of banks at North Cyprus, ICOAEF’18 IV. In Proceedings of the International Conference on Applied Economics and Finance & Extended with Social Sciences, Kuşadası, Turkey, 28–30 November 2018; pp. 1086–1107. Available online: http://www.icoaef.com/wp-content/uploads/2018/08/05.01.ICOAEF-final-TAM-MET%C4%B0N.pdf (accessed on 5 June 2021).
- Kirikkaleli, D.; Yaylali, P.; Safakli, O.V. The Perception and Culture of Operational Risk in the Banking Sector: Evidence from Northern Cyprus. SAGE Open 2020, 10, 1–16. [Google Scholar] [CrossRef]
- Kalmaz, D.B.; Temel, M. Evaluation of the Significance of the Treasury Departments on Profitability of Banks in TRNC. J. Soc. Sci. Mus Alparslan Univ. 2018, 6, 207–218. Available online: https://dergipark.org.tr/en/pub/anemon/issue/36488/268586 (accessed on 6 June 2021).
- Şafaklı, O.; Özdeşler, H. KKTC Ekonomisinin Genel Analizi. (General Analysis of the TRNC Economy). Doğuş Univ. J. 2002, 3, 151–171. Available online: http://journal.dogus.edu.tr/index.php/duj/article/view/208/226 (accessed on 6 June 2021).
- De Vellis, R.F. Scale Development Theory and Applications; Totan, T.T., Ed.; Nobel: Ankara, Turkey, 2017; pp. 73–114. [Google Scholar]
- Creswell, J.W.; Clark, V.L.P. Designing and Conducting Mixed Methods Research; Dede, Y., Demir, S.B.T., Eds.; Anı: Ankara, Turkey, 2014; pp. 27–279. [Google Scholar]
- Fidan, T.; Öztürk, İ. Perspectives and Expectations of Union Member and Non-Union Member Teachers on Teacher Unions. J. Educ. Sci. Res. 2015, 5, 191–220. Available online: https://dergipark.org.tr/tr/pub/ebader/issue/44709/555516 (accessed on 6 June 2021). [CrossRef]
- Büyüköztürk, Ş.; Çakmak, E.K.; Akgün, Ö.E.; Karadeniz, Ş.; Demirel, F. Eğitimde Bilimsel Araştırma Yöntemleri [Scientific Research Methods in Education]; Pagem: Ankara, Turkey, 2019; pp. 142–145. [Google Scholar]
- Kalaycı, Ş. SPSS Uygulmalı Çok Değişkenli İstatistik Teknikleri [SPSS Applied Multivariate Statistics Techniques]; Asil: An-kara, Turkey, 2010; pp. 99–331. [Google Scholar]
- CBTRNC. Quarterly Bulletin of Central Bank of the TRNC (2020-I-II-III). Available online: http://www.kktcmerkezbankasi.org/sites/default/files/yayinlar/bulten/2020%20Q1-Q2-Q3%20Bulletin.pdf (accessed on 6 June 2021).
- Israel, G.D. Determining Sample Size. IFAS Extension, University of FloridaFact Sheet PEOD-6. 1–5 November 1992. Available online: https://scholar.google.co.uk/scholar?hl=tr&as_sdt=0%2C5&q=Israel%2C+G.+D.+Determining+Sample+Size.+IFAS+Extension%2C+University+of+Florida%2C++Fact+Sheet+PEOD-6%2C+1992%2C+November%2C+1-5&btnG= (accessed on 5 June 2021).
- Çokluk, Ö.; Şekercioğlu, G.; Büyüköztürk, Ş. Sosyal Bilimler İçin Çok Değişkenli İstatistik SPSS ve LISREL Uygulamaları [Multivariate Statistics for Social Sciences SPSS and LISREL Applications]; Pagem: Ankara, Turkey, 2016; pp. 271–272. [Google Scholar]
- Özdamar, K. Ölçek ve Test Geliştirme Yapısal Eşitlik Modellemesi [Scale and Test Development Structural Equation Model-ing]; Nisan: Eskişehir, Turkey, 2016; pp. 111–160. [Google Scholar]
- Meydan, C.H.; Şeşen, H. Yapısal Eşitlik Modellemesi Amos Uygulaması [Structural Equation Modeling Amos Applications]; Detay: Ankara, Turkey, 2015; pp. 31–41. [Google Scholar]
- Schreiber, J.; Nora, A.; Stage, F.K.; Barlow, E.A.; King, J. Reporting Structural Equation Modeling and Confirmatory Factor Analysis Results: A Review. J. Educ. Res. 2006, 99, 323–338. [Google Scholar] [CrossRef]
- Eke, E. Structural Equation Modeling and Application on Brand Equity. Master’s Thesis, Uludağ University, Social Sciences Institution, Bursa, Turkey, 2019. Available online: https://tez.yok.gov.tr/UlusalTezMerkezi/tezSorguSonucYeni.jsp (accessed on 5 June 2021).
- Gnatenko, I. Potential Implications of the Introduction of CBDC for the Conduct of Monetary Policy and the Preservation of Financial and Monetary Stability: A Case Study of the Central Bank of Sweden. Master’s Thesis, KTH, School of Industrial Engineering and Management (ITM), Stockholm, Sweden, 2020. Available online: https://www.diva-portal.org/smash/record.jsf?pid=diva2%3A1500415&dswid=8023 (accessed on 1 July 2021).
- Alonso, S.N.; Jorge-Vazquez, J.; Forradellas, R.R. Central Banks Digital Currency: Detection of Optimal Countries for the Implementation of a CBDC and the Implication for Payment Industry Open Innovation. J. Open Innov. Technol. Mark. Complex. 2021, 7, 72. [Google Scholar] [CrossRef]
- Alonso, S.L.N.; Fernández, M.; Ángel, E.; Bas, D.S.; Kaczmarek, J. Reasons Fostering or Discouraging the Implementation of Central Bank-Backed Digital Currency: A Review. Economies 2020, 8, 41. [Google Scholar] [CrossRef]
- Kumhof, M.; Noone, C. Central Bank Digital Currencies—Design Principles and Balance Sheet Implications; Working Paper No. 725; Bank of England: London, UK, 2018; Available online: http://dx.doi.org/10.2139/ssrn.3180713 (accessed on 1 July 2021).
- Andolfatto, D. Assessing the Impact of Central Bank Digital Currency on Private Banks. Econ. J. 2021, 131, 525–540. [Google Scholar] [CrossRef]
Publisher’s Note: MDPI stays neutral with regard to jurisdictional claims in published maps and institutional affiliations. |
© 2021 by the authors. Licensee MDPI, Basel, Switzerland. This article is an open access article distributed under the terms and conditions of the Creative Commons Attribution (CC BY) license (https://creativecommons.org/licenses/by/4.0/).