
Micro, Small, and Medium Enterprises’ Business Vulnerability Cluster in Indonesia: An Analysis Using Optimized Fuzzy Geodemographic Clustering

 ,
,  ,
, 
 and
and 
Abstract
:1. Introduction
2. Materials and Methods
2.1. The National Socioeconomic Survey (SUSENAS)
2.2. The National Labour Force Survey (SAKERNAS)
2.3. Nature-Inspired Spatial Clustering: The Naspaclust Package
3. Methodology
3.1. Data and Algorithms
3.2. Flower Pollination Algorithm
3.3. Research Workflow
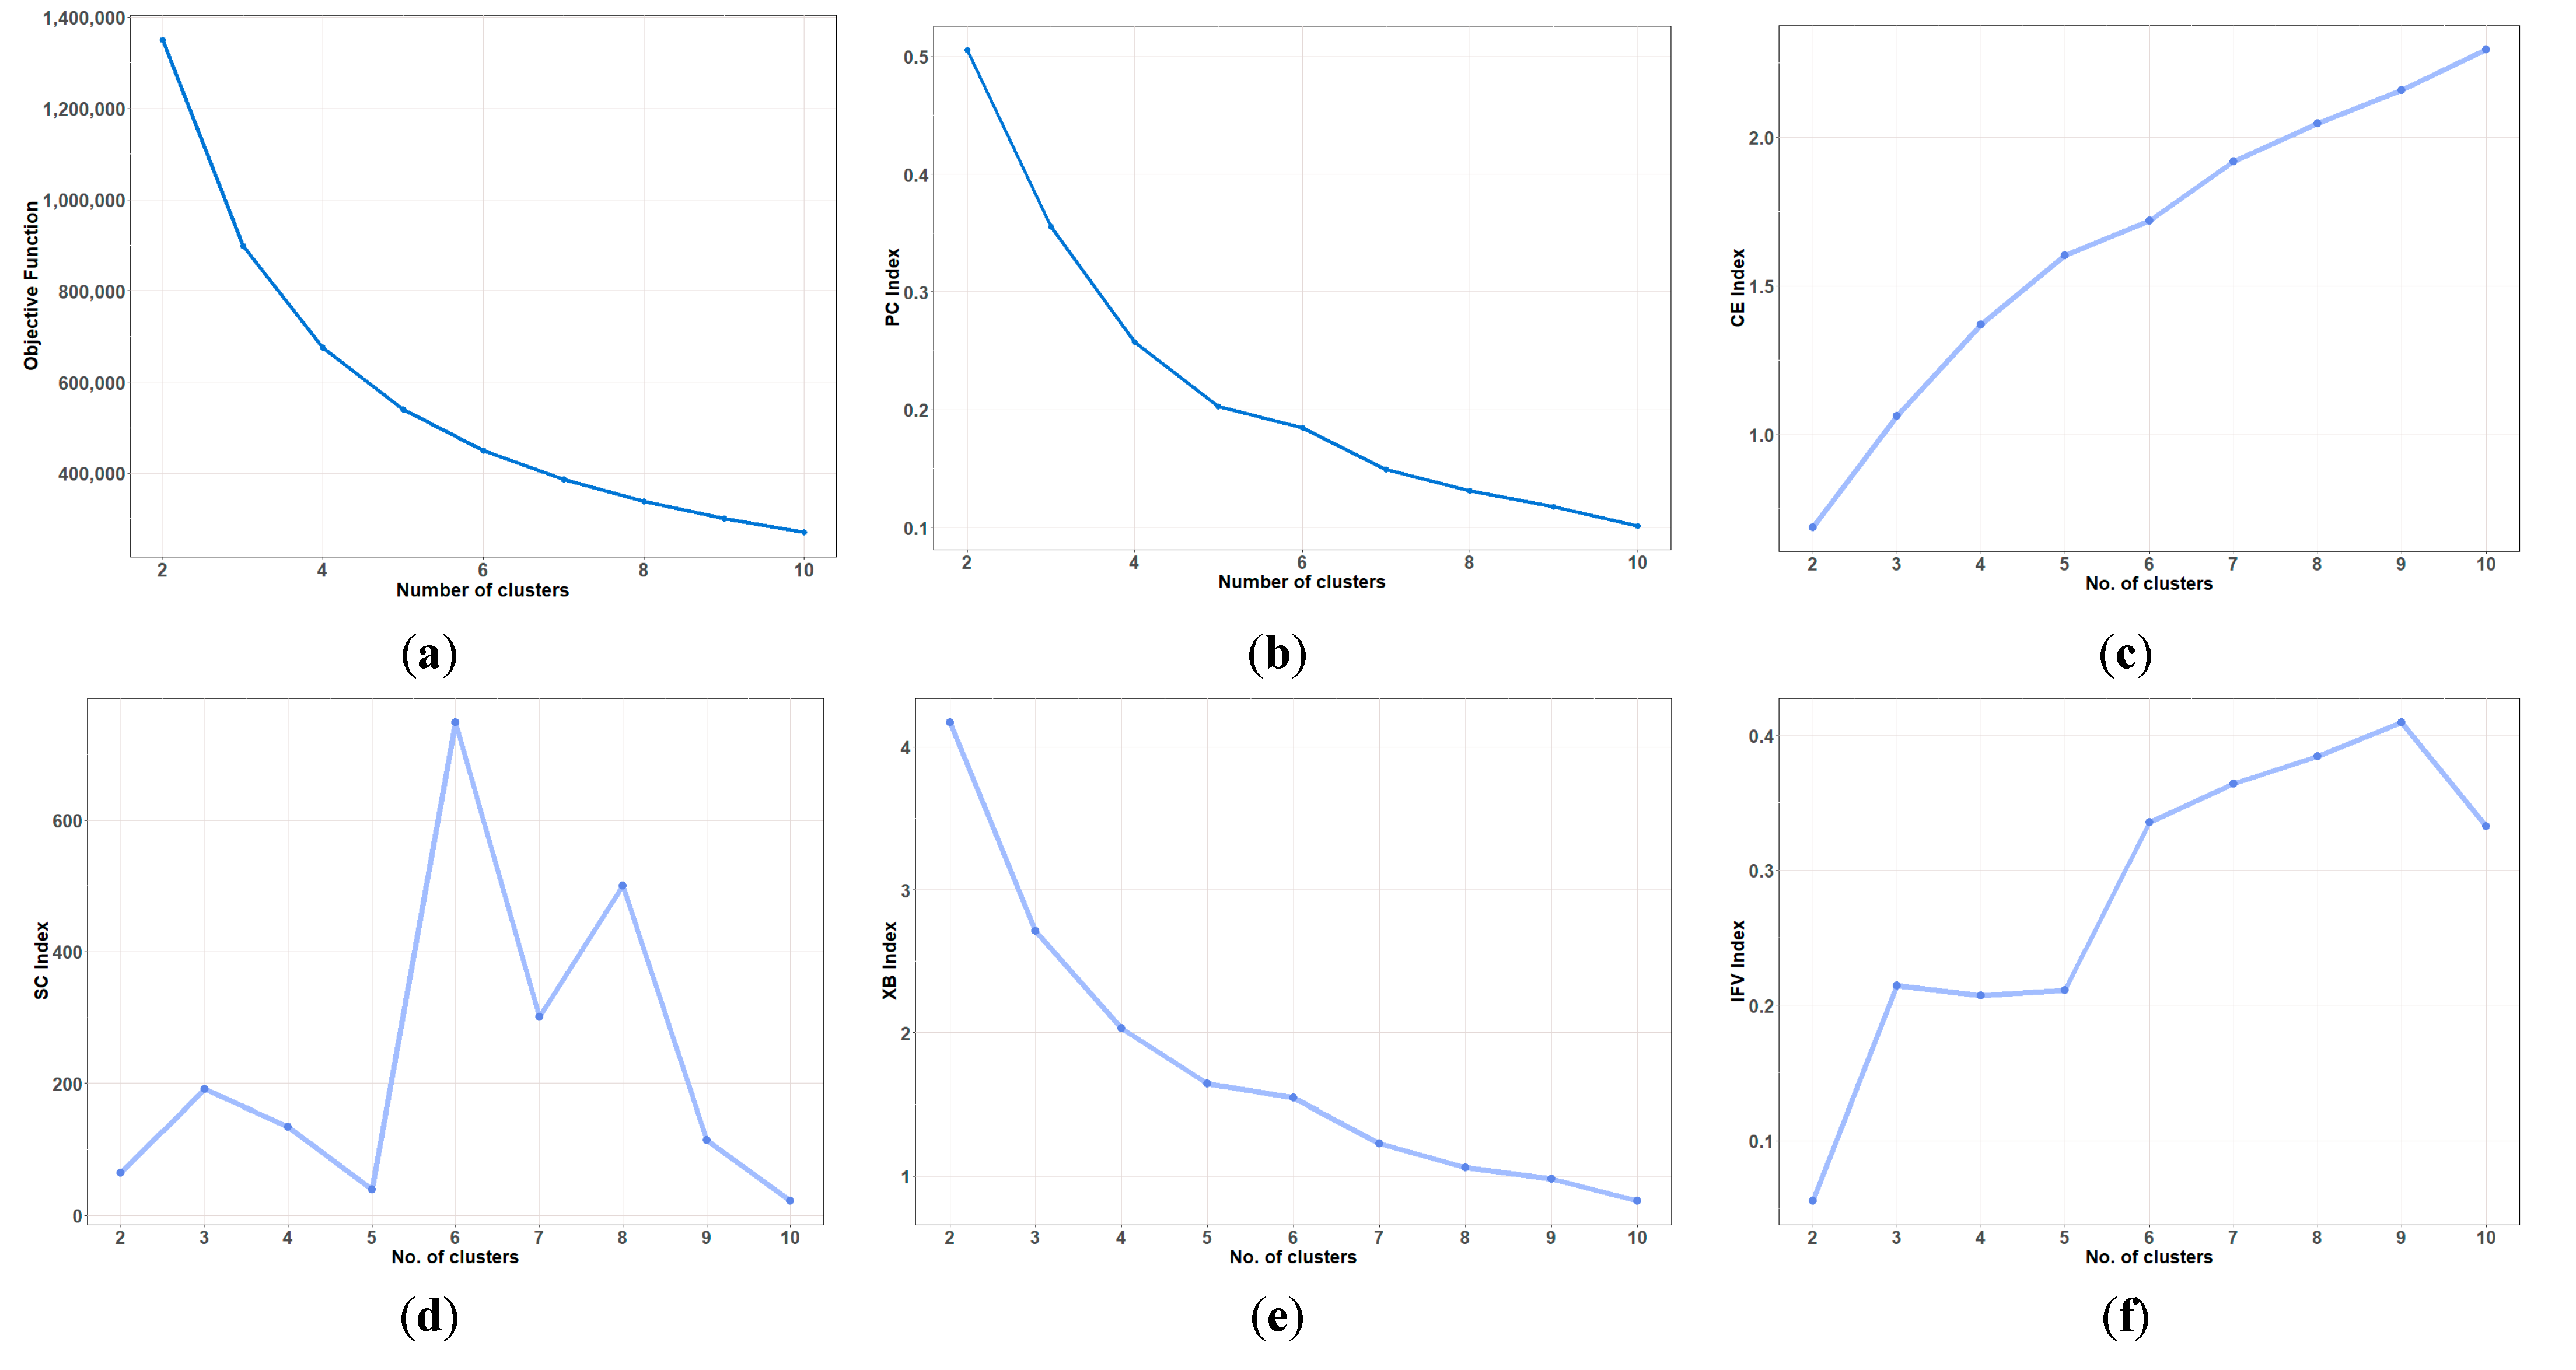
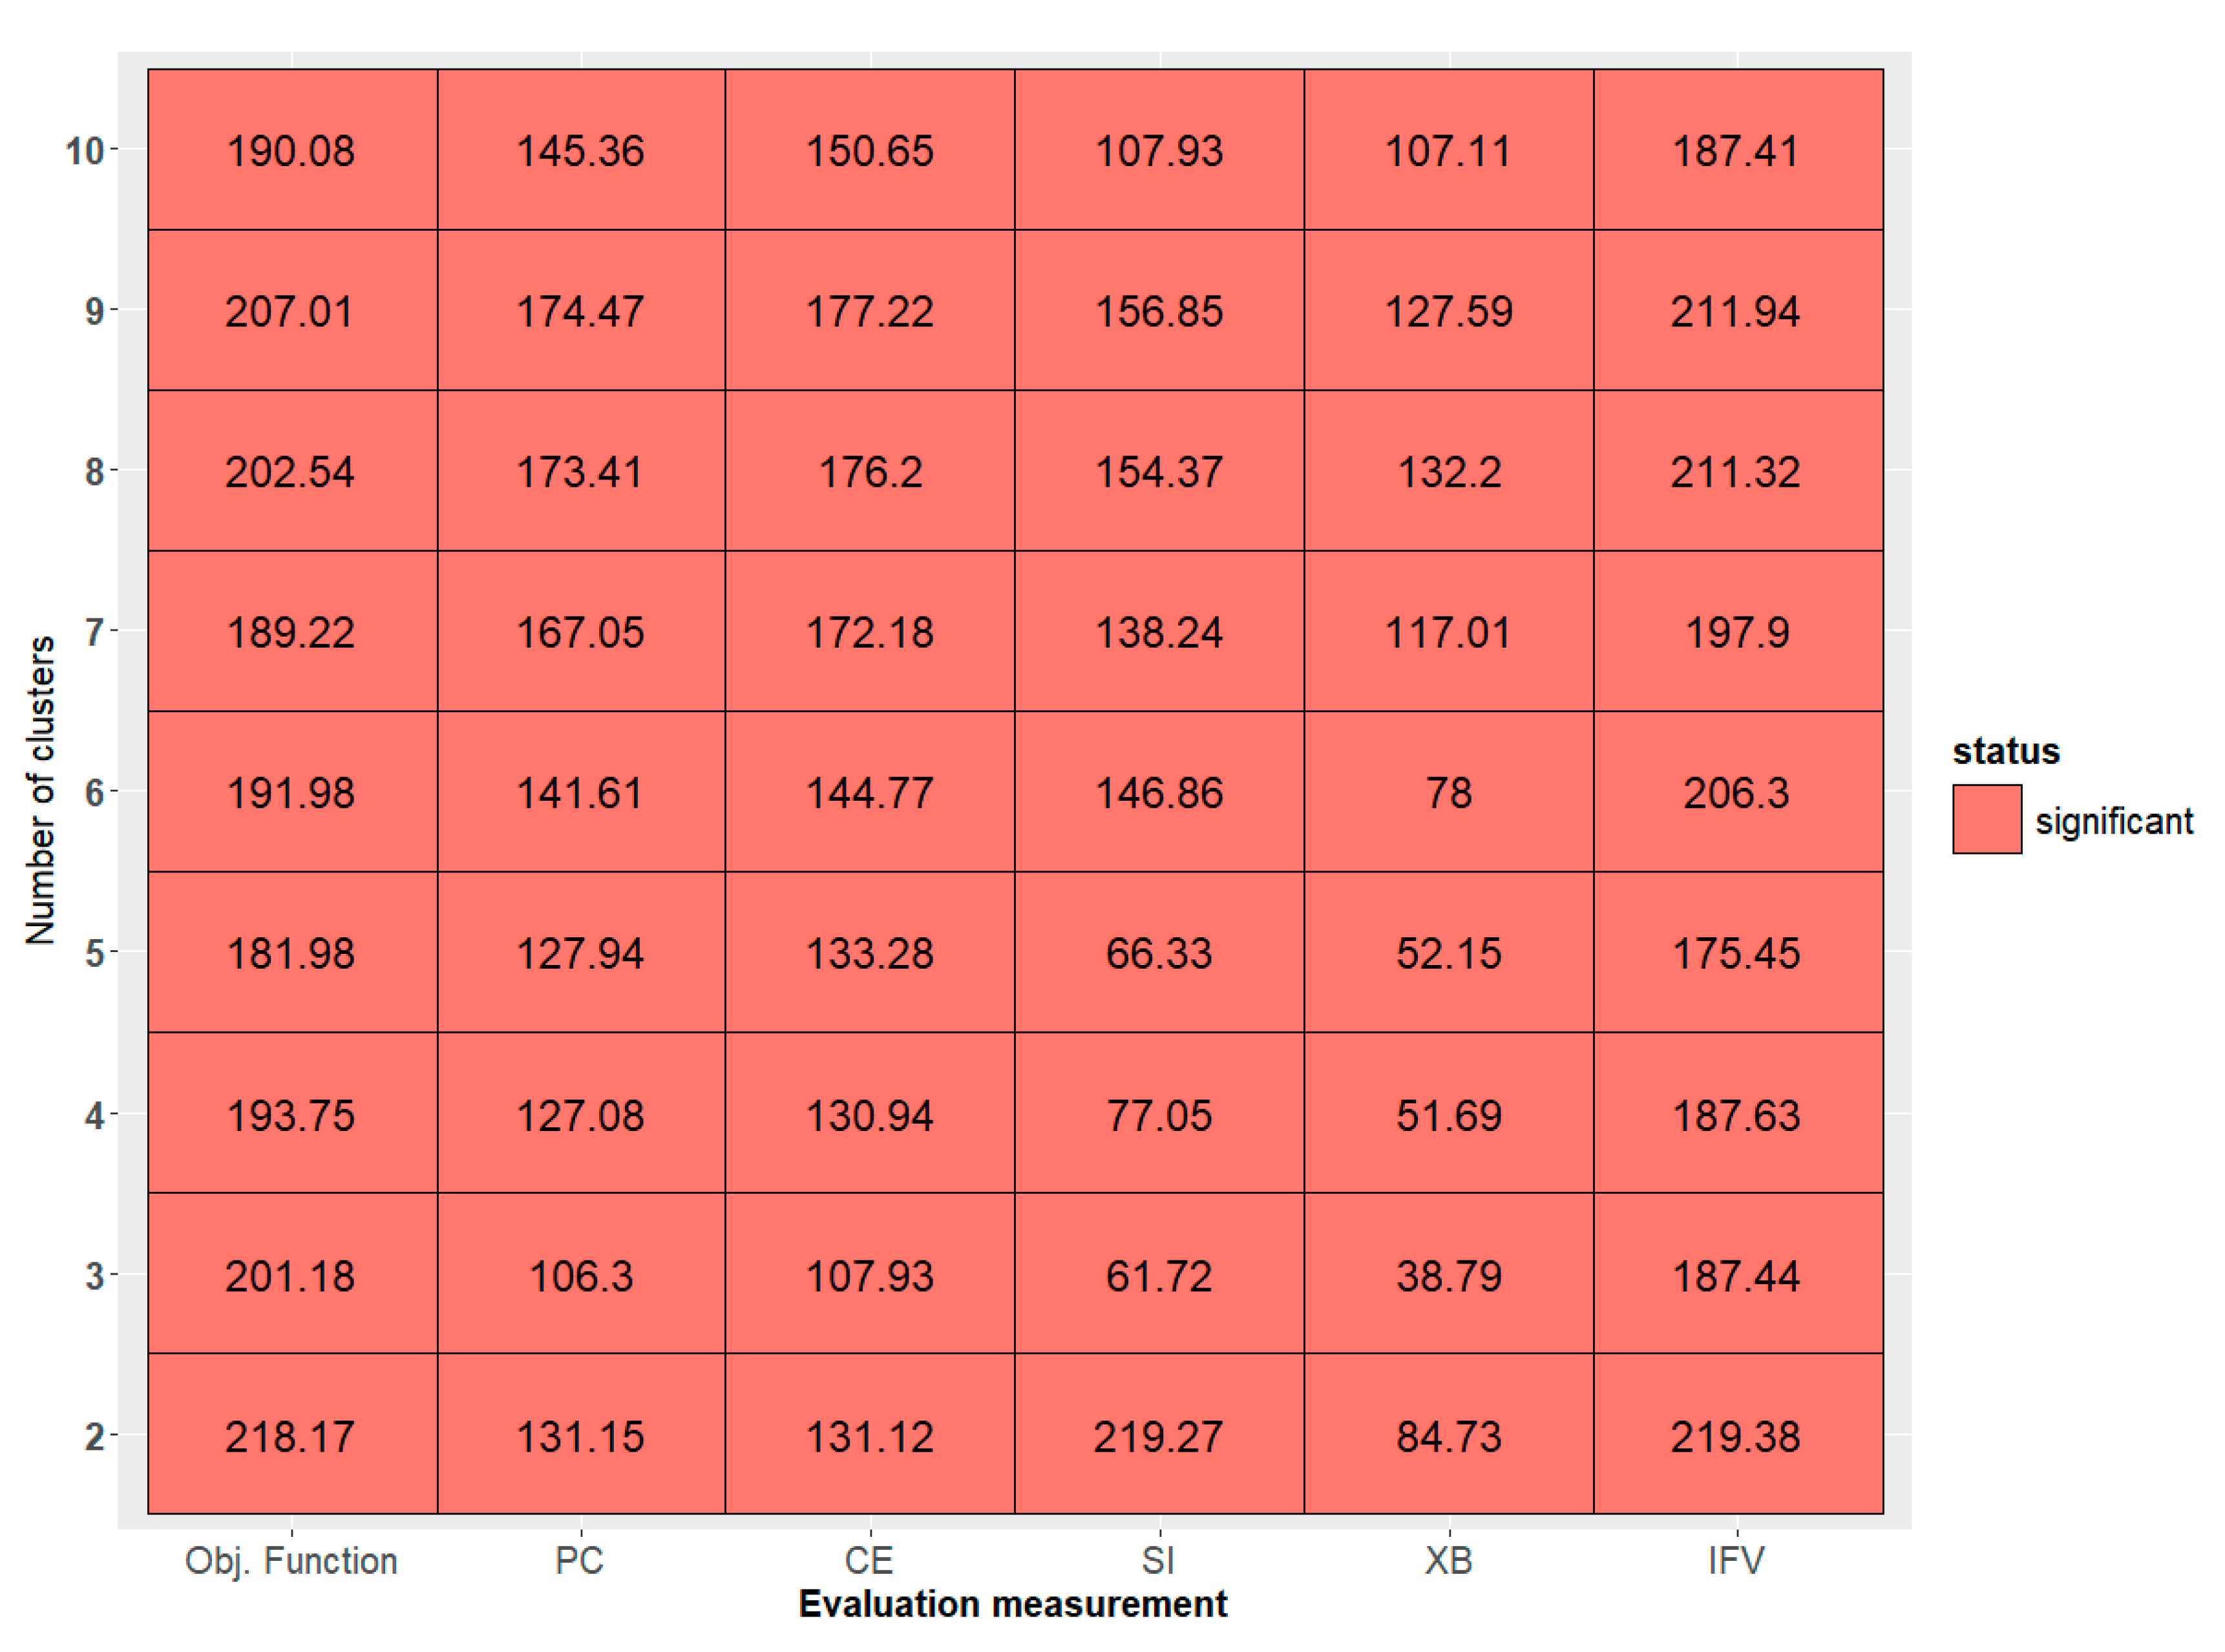
3.4. Evaluation Method
- (1)
- Partition coefficient (PC)The partition coefficient reflects the overlap between the fuzzy subsets and relies on the membership coefficients. Therefore, it lacks the additional consideration of the data and centroid. The partition index is calculated using [20].
- (2)
- Classification entropy (CE)CE represents the fuzziness between clusters. Based on the equation, CE index value will always range from 0 to . Thus, low CE index shows a more optimal cluster. The CE index is calculated as follows [20]
- (3)
- Separation index (S)The S index is a proportion of the objective function value to the minimum cluster separation. The minimum S index displays a an optimal cluster partition. On the other hand, the sum of the distances between centroids reflects the cluster separation [66].
- (4)
- Xie and Beni index (XB)Along with the SC index, the XB index shows the variation magnitude between clusters as well as the separation clarity [66].
- (5)
- IFV indexThe IFV index is often used to validate spatial clustering due to its robustness and stability [67]. A maximum IFV index value reflects a good spatial cluster separation. The IFV index is measured using the equation:
3.5. Parameter Setups
4. Results
4.1. Performance Evaluation
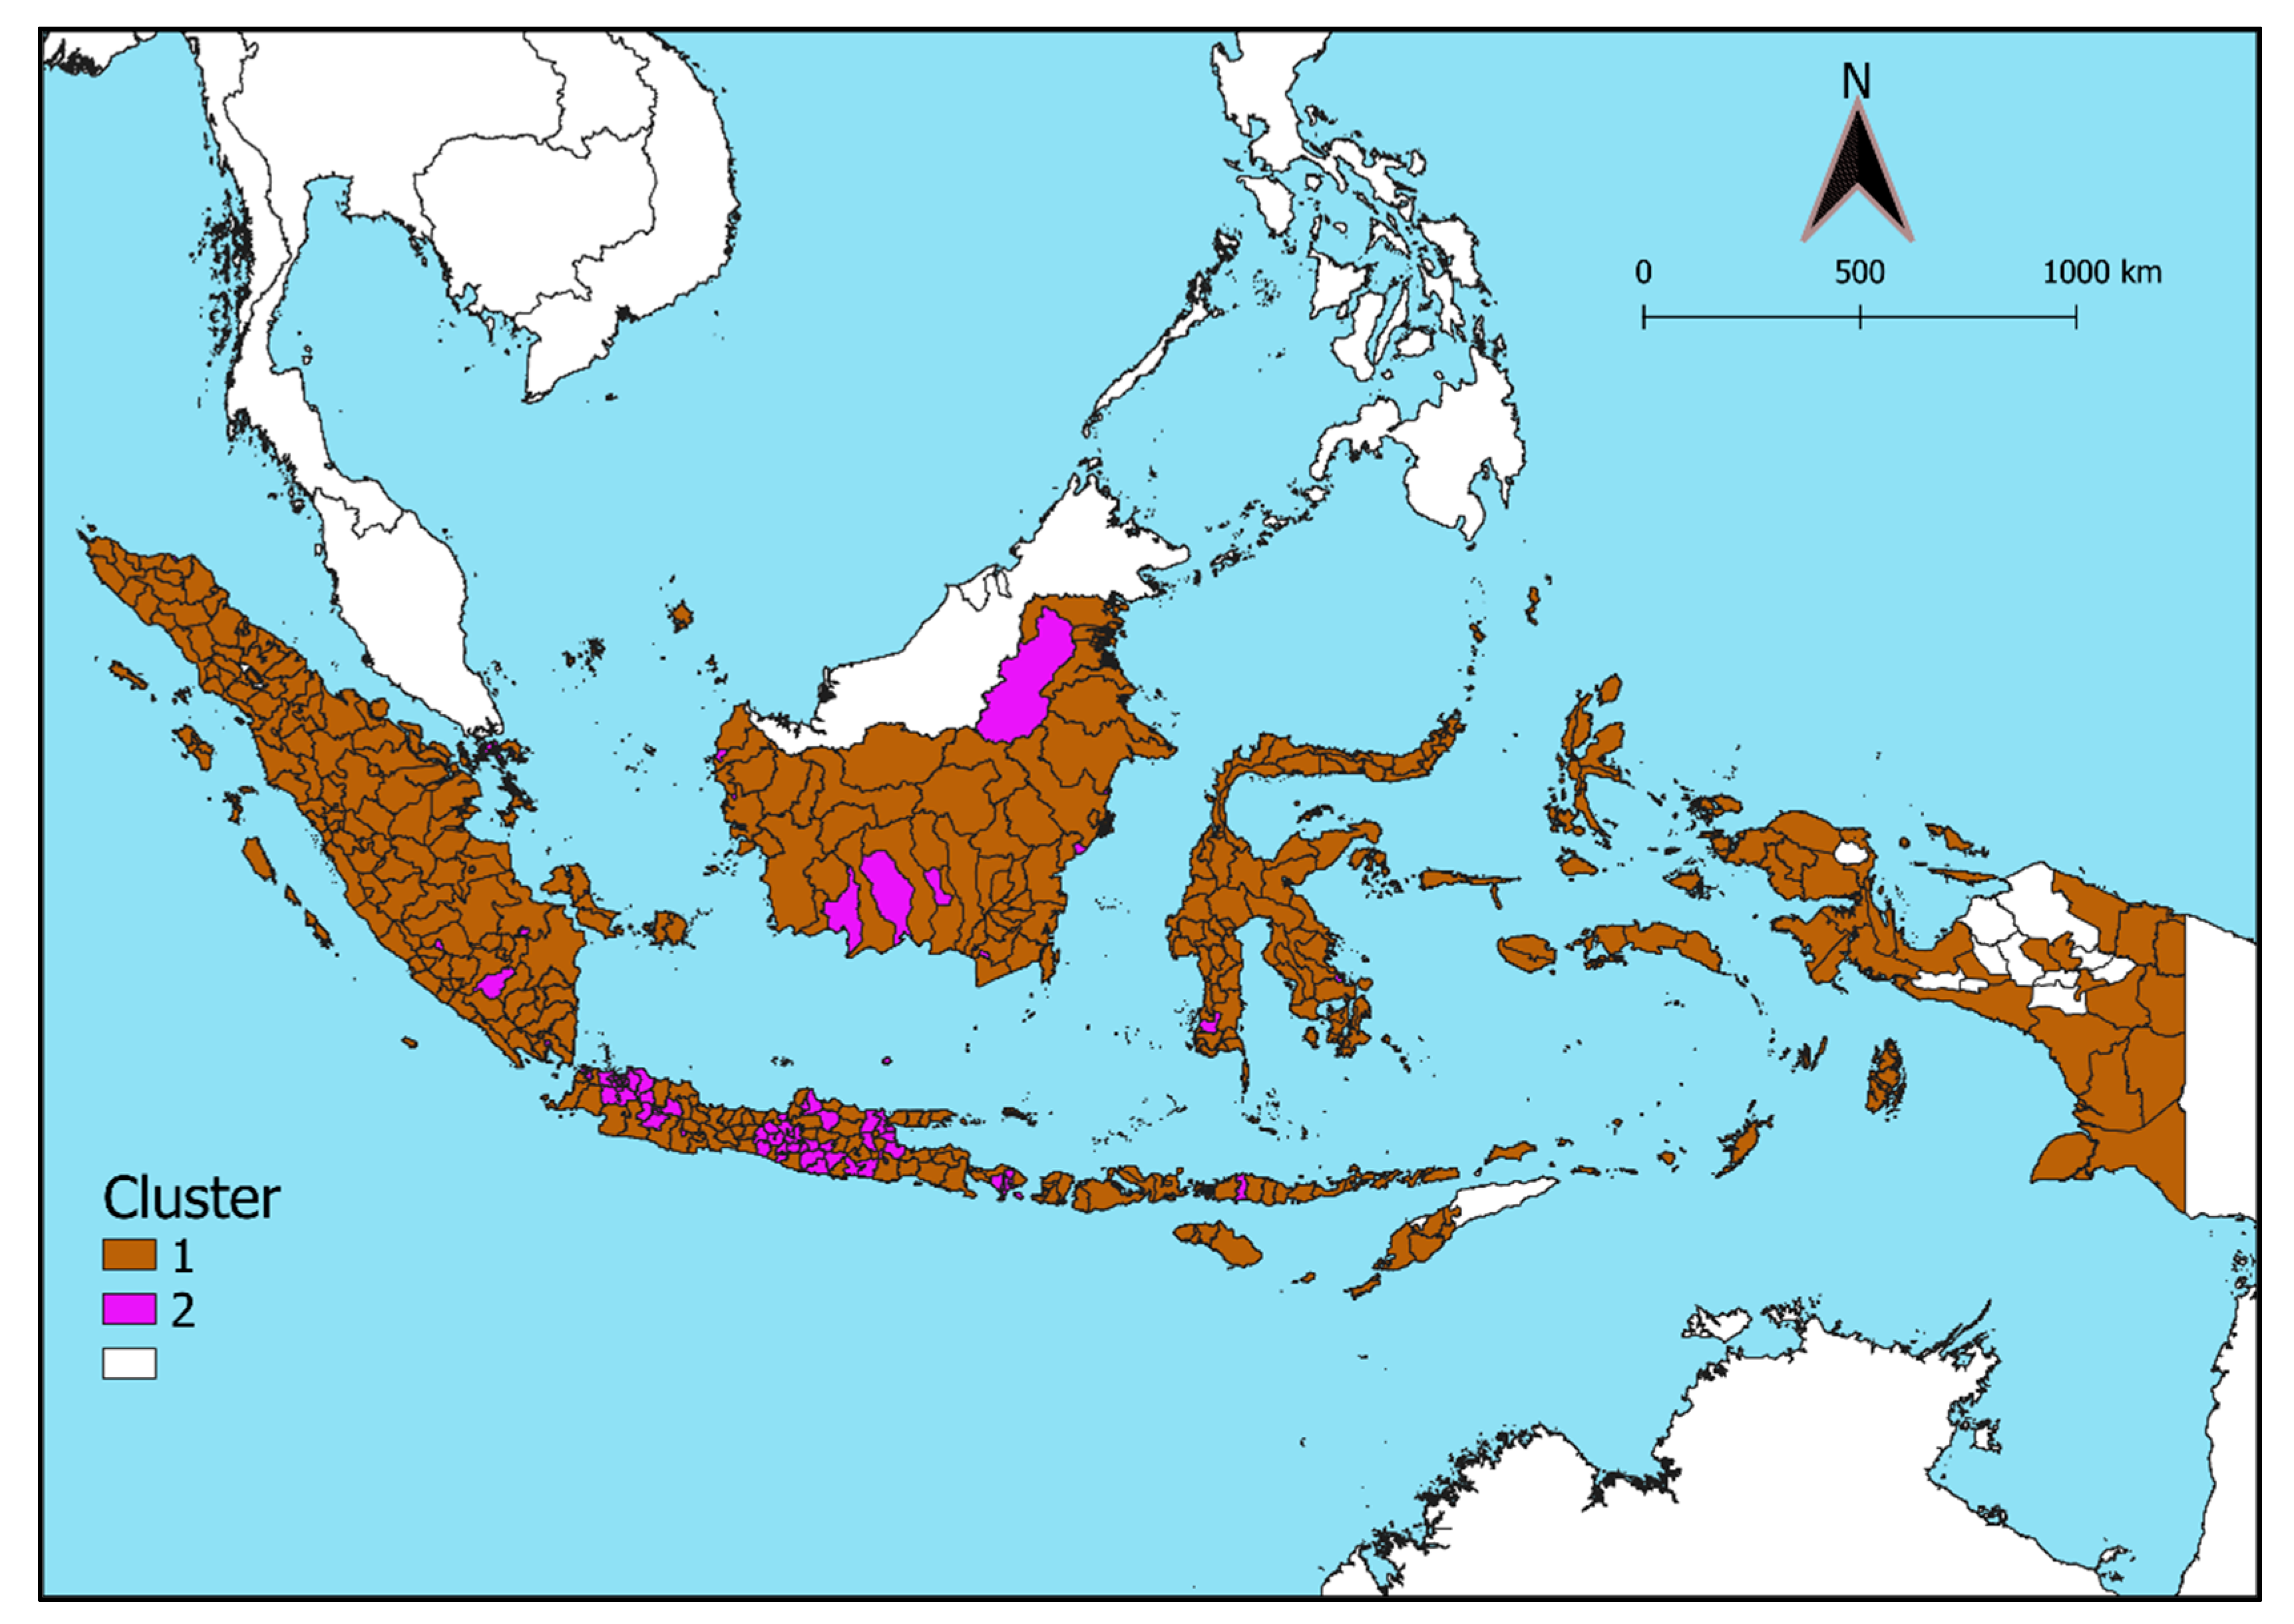
4.2. Clustering Results
5. Discussion
Author Contributions
Funding
Informed Consent Statement
Data Availability Statement
Conflicts of Interest
Appendix A. (Pseudocode of Fuzzy Geographically Weighted Clustering with Flower Pollination Algorithm)
| Algorithm A1 |
| Input: Data , spatial distance matrix , population matrix , number of clusters , fuzzifier , ratio original membership , population effect , spatial distance effect , error tolerance , maximum iteration , number of flowers , switch probability , Levy step-size factor Levy index , Levy flights shift |
| Output: cluster of data, optimum centroid , optimum objective function , validation indices |
| Initialize flower from centroid matrix |
| calculate fitness using the |
| obtain the current global best based on |
| while or do |
| for do |
| generate random number rand = [0,1] |
| if rand<p |
| generate step vector from levy distribution |
| update centroid using global pollination |
| Else |
| draw from selected distribution |
| select random centroid |
| update centroid using local pollination |
| calculate distance between data and centroid using Euclidean distance |
| calculate membership using |
| use geographical modification to update based on |
| recalculate centroid using |
| update fitness of each flower using FGWC-V objective function in step 2 |
| set as and as |
| if |
| update and |
| Calculate validation index of the cluster formation |
| Obtain the cluster of each data using the best membership |
Appendix B. (Variable Name)

| Variable | Description |
|---|---|
| use_cellph | % of population who use cell phones |
| have_cellph | % of population who own a cell phone |
| use_pc | % of population who use a PC |
| acc_int | % of population who access the internet |
| saving | % of population who have savings |
| credit_A | % of households that make credit to KUR |
| credit_B | % of households that make credit to commercial banks |
| credit_C | % of households that make credit to the BPR |
| credit_D | % of households that make credit to cooperatives |
| sour_money | % of households whose source of income comes from working household members |
| edu | % of population who have senior high and above education |
| no_empl_14 | % of population who own a micro business |
| no_empl_519 | % of population who have small businesses |
| course | % of working population who attended training |
| job_dur | the average duration of work of the population |
| digitech1 | % of population who use computers |
| digitech2 | % of population who use smartphones |
| digitech3 | % of population who use other digital technologies |
| job_int | % of population who use the internet |
| jobint_use1 | % of population who use the internet for communication |
| jobint_use2 | % of population use the internet for promotion |
| jobint_use3 | % of population who use the internet to sell via email/social media |
| jobint_use4 | % of population who use the internet to sell via e-commerce |
| financebook | % of population who have financial accounting |
| work_org | % of population who work with individual/household businesses |
| work_loc | % of population who work in their own homes |
| prev_work | % of population who have previous work experience |
References
- McKibin, W.J.; Fernando, R. The Global Macroeconomic Impacts of COVID-19: Seven Scenarios. SSRN Electron. J. 2020, 20, 1–30. [Google Scholar] [CrossRef] [Green Version]
- Djalante, R.; Lassa, J.; Nurhidayah, L.; Minh, H.V.; Mahendradhata, Y.; Ngoc, N.T. The ASEAN’s responses to COVID-19: A policy sciences analysis. PsyArXi 2020, 368. [Google Scholar] [CrossRef]
- Caraka, R.E.; Lee, Y.; Kurniawan, R.; Herliansyah, R.; Kaban, P.A.; Nasution, B.I.; Gio, P.U.; Chen, R.C.; Toharudin, T.; Pardamean, B. Impact of COVID-19 large scale restriction on environment and economy in Indonesia. Glob. J. Environ. Sci. Manag. 2020, 6, 65–84. [Google Scholar] [CrossRef]
- Hudaefi, F.A.; Junari, U.L.; Zaenal, M.H.; Choirin, M.; Rachmanto, I.B.; Ghani, A.R. Zakat in Time of COVID-19 Pandemic: Evidence from World Zakat Forum; BAZNAS Center of Strategic Studies: Jakarta, Indonesia, 2020. [Google Scholar]
- Nuryana, Z.; Fauzi, N.A.F. The Fiqh of disaster: The mitigation of covid-19 in the perspective of Islamic education-neuroscience. Int. J. Disaster Risk Reduct. 2020, 51, 101848. [Google Scholar] [CrossRef]
- Djalante, R.; Lassa, J.; Setiamarga, D.; Sudjatma, A.; Indrawan, M.; Haryanto, B.; Mahfud, C.; Sinapoy, M.S.; Djalante, S.; Rafliana, I.; et al. Review and analysis of current responses to COVID-19 in Indonesia: Period of January to March 2020. Prog. Disaster Sci. 2020, 6, 100091. [Google Scholar] [CrossRef] [PubMed]
- Sparrow, R.; Dartanto, T.; Hartwig, R. Indonesia under the New Normal: Challenges and the Way Ahead. Bull. Indones. Econ. Stud. 2020, 56, 269–299. [Google Scholar] [CrossRef]
- Kamble, S.S.; Belhadi, A.; Gunasekaran, A.; Ganapathy, L.; Verma, S. A large multi-group decision-making technique for prioritizing the big data-driven circular economy practices in the automobile component manufacturing industry. Technol. Forecast. Soc. Chang. 2021, 165, 120567. [Google Scholar] [CrossRef]
- Bjørnbet, M.M.; Skaar, C.; Fet, A.M.; Schulte, K.Ø. Circular economy in manufacturing companies: A review of case study literature. J. Clean. Prod. 2021, 294, 126268. [Google Scholar] [CrossRef]
- Lu, L.; Peng, J.; Wu, J.; Lu, Y. Perceived impact of the Covid-19 crisis on SMEs in different industry sectors: Evidence from Sichuan, China. Int. J. Disaster Risk Reduct. 2021, 55. [Google Scholar] [CrossRef]
- Belhadi, A.; Kamble, S.; Jabbour, C.J.C.; Gunasekaran, A.; Ndubisi, N.O.; Venkatesh, M. Manufacturing and service supply chain resilience to the COVID-19 outbreak: Lessons learned from the automobile and airline industries. Technol. Forecast. Soc. Chang. 2021, 163, 120447. [Google Scholar] [CrossRef] [PubMed]
- Yuhua, B.Z. SMEs in the APEC Region. APEC Policy Support Unit, Policy Brief No.8. December; APEC Secretariat: Singapore, 2013. [Google Scholar]
- Tambunan, T.T.H. SMEs in Asian Developing Countries; Palgrave Macmillan Publisher: London, UK, 2009; ISBN 0230250947. [Google Scholar]
- Antonio, M.S. Islamic microfinance initiatives to enhance small and medium enterprises in Indonesia: From historical overview to contemporary situation. J. Indones. Islam 2011, 5, 1–22. [Google Scholar] [CrossRef] [Green Version]
- Caraka, R.E.; Lee, Y.; Chen, R.C.; Toharudin, T.; Gio, P.U.; Kurniawan, R.; Pardamean, B. Cluster Around Latent Variable for Vulnerability Towards Natural Hazards, Non-Natural Hazards, Social Hazards in West Papua. IEEE Access 2021, 9, 1972–1986. [Google Scholar] [CrossRef]
- Anselin, L.; Florax, R.J.G.M.; Rey, S.J. Advances in Spatial Econometrics; Springer: Berlin/Heidelberg, Germany, 2004. [Google Scholar]
- Foreman-Peck, J.; Nicholls, T. Inter-regional mobility of entrepreneurial SMEs. Ann. Reg. Sci. 2015, 54, 57–87. [Google Scholar] [CrossRef]
- Rufat, S. Spectroscopy of Urban Vulnerability. Ann. Assoc. Am. Geogr. 2013, 103, 505–525. [Google Scholar] [CrossRef]
- Nasution, B.I.; Kurniawan, R.; Siagian, T.H.; Fudholi, A. Revisiting social vulnerability analysis in Indonesia: An optimized spatial fuzzy clustering approach. Int. J. Disaster Risk Reduct. 2020, 51, 101801. [Google Scholar] [CrossRef]
- Bezdek, J.C.; Ehrlich, R.; Full, W. FCM: The fuzzy c-means clustering algorithm. Comput. Geosci. 1984, 10, 191–203. [Google Scholar] [CrossRef]
- Maharani, Y.N.; Lee, S.; Ki, S.J. Social vulnerability at a local level around the Merapi volcano. Int. J. Disaster Risk Reduct. 2016, 20, 63–77. [Google Scholar] [CrossRef] [Green Version]
- Nasution, B.I.; Kurniawan, R. Robustness of classical fuzzy C-means (FCM). In Proceedings of the 2018 International Conference on Information and Communications Technology (ICOIACT), Yogyakarta, Indonesia, 6–7 March 2018; pp. 321–325. [Google Scholar]
- Han, J.; Kamber, M. Data Mining Concepts and Techniques, 2nd ed.; Elsevier Inc.: San Francisco, CA, USA, 2006; ISBN 1-55860-901-6. [Google Scholar]
- Zhou, K.; Yang, S. Exploring the uniform effect of FCM clustering: A data distribution perspective. Knowl. Based Syst. 2016, 96, 76–83. [Google Scholar] [CrossRef]
- Campello, R.J.G.B.; Hruschka, E.R. A fuzzy extension of the silhouette width criterion for cluster analysis. Fuzzy Sets Syst. 2006, 157, 2858–2875. [Google Scholar] [CrossRef]
- Noh, M.; Lee, Y.; Oud, J.H.L.; Toharudin, T. Hierarchical likelihood approach to non-Gaussian factor analysis. J. Stat. Comput. Simul. 2019, 89, 1555–1573. [Google Scholar] [CrossRef]
- Jain, A.K. Data clustering: 50 years beyond K-means. Pattern Recognit. Lett. 2010, 31, 651–666. [Google Scholar] [CrossRef]
- Kang, W.; Lee, M.S.; Lee, Y. HGLM versus conditional estimators for the analysis of clustered binary data. Stat. Med. 2005, 24, 741–752. [Google Scholar] [CrossRef]
- Han, Y.; Yang, K.; Yang, Y.; Ma, Y. Localized Multiple Kernel Learning With Dynamical Clustering and Matrix Regularization. IEEE Trans. Neural Netw. Learn. Syst. 2018, 29, 486–499. [Google Scholar] [CrossRef]
- Wijayanto, A.W.; Purwarianti, A.; Son, L.H. Fuzzy geographically weighted clustering using artificial bee colony: An efficient geo-demographic analysis algorithm and applications to the analysis of crime behavior in population. Appl. Intell. 2016, 44, 377–398. [Google Scholar] [CrossRef]
- Wijayanto, A.W.; Purwarianti, A. Improvement Design of Fuzzy Geo-Demographic Clustering Using Artificial Bee Colony Optimization. In Proceedings of the 2014 International Conference on Cyber and IT Service Management (CITSM), South Tangerang, Indonesia, 3–6 November 2014; ISBN 9781479979752. [Google Scholar]
- Son, L.H.; Cuong, B.C.; Long, H.V. Spatial interaction—Modification model and applications to geo-demographic analysis. Knowl. Based Syst. 2013, 49, 152–170. [Google Scholar] [CrossRef]
- Grekousis, G. Local fuzzy geographically weighted clustering: A new method for geodemographic segmentation. Int. J. Geogr. Inf. Sci. 2021, 35, 152–174. [Google Scholar] [CrossRef]
- Nurmala, N.; Purwarianti, A. Improvement of fuzzy geographically weighted clustering-ant colony optimization performance using context-based clustering and CUDA parallel programming. J. ICT Res. Appl. 2017, 11, 21–37. [Google Scholar] [CrossRef]
- Putra, F.H.; Kurniawan, R. Clustering for Disaster Areas Endemic Dengue Hemorrhagic Fever Based on Factors had Caused in East Java Using Fuzzy Geographically Weighted Clustering—Particle Swarm Optimization. J. Apl. Stat. Komputasi Stat. 2017, 8, 27. [Google Scholar]
- Pamungkas, I.H.; Pramana, S. Improvement Method of Fuzzy Geographically Weighted Clustering using Gravitational Search Algorithm. J. Comput. Sci. Inf. 2019, 11, 10–16. [Google Scholar]
- Yang, X.S. Nature-Inspired Optimization Algorithms; Elsevier Inc.: San Francisco, CA, USA, 2014; ISBN 9780124167452. [Google Scholar]
- Pan, X.; Zhang, Q.; Pan, H. Improved Artificial Bee Colony Algorithm and Its Application to Fundus Retinal Blood Vessel Image Binarization. IEEE Access 2020, 8, 123726–123734. [Google Scholar] [CrossRef]
- Rashedi, E.; Nezamabadi-Pour, H.; Saryazdi, S. GSA: A Gravitational Search Algorithm. Inf. Sci. 2009, 179, 2232–2248. [Google Scholar] [CrossRef]
- Dhal, K.G.; Gálvez, J.; Das, S. Toward the modification of flower pollination algorithm in clustering-based image segmentation. Neural Comput. Appl. 2019, 32, 3059–3077. [Google Scholar] [CrossRef]
- Khursheed, M.U.N.; Nadeem, M.F.; Khalil, A.; Sajjad, I.A.; Raza, A.; Iqbal, M.Q.; Bo, R.; Rehman, W.U. Review of Flower Pollination Algorithm: Applications and Variants. In Proceedings of the 2020 International Conference on Engineering and Emerging Technologies, ICEET 2020, Lahore, Pakistan, 22–23 February 2020; Institute of Electrical and Electronics Engineers Inc.: Manhattan, NY, USA, 2020. [Google Scholar]
- Wang, R.; Zhou, Y. Flower pollination algorithm with dimension by dimension improvement. Math. Probl. Eng. 2014, 2014. [Google Scholar] [CrossRef]
- Chiroma, H.; Shuib, N.L.M.; Muaz, S.A.; Abubakar, A.I.; Ila, L.B.; Maitama, J.Z. A review of the applications of bio-inspired Flower Pollination Algorithm. Procedia Comput. Sci. 2015, 62, 435–441. [Google Scholar] [CrossRef] [Green Version]
- Abdelaziz, A.Y.; Ali, E.S.; Abd Elazim, S.M. Optimal sizing and locations of capacitors in radial distribution systems via flower pollination optimization algorithm and power loss index. Eng. Sci. Technol. Int. J. 2016, 19, 610–618. [Google Scholar] [CrossRef] [Green Version]
- Reddy, P.D.P.; Reddy, V.C.V.; Manohar, T.G. Application of flower pollination algorithm for optimal placement and sizing of distributed generation in Distribution systems. J. Electr. Syst. Inf. Technol. 2016, 3, 14–22. [Google Scholar] [CrossRef] [Green Version]
- Agarwal, P.; Mehta, S. Enhanced flower pollination algorithm on data clustering. Int. J. Comput. Appl. 2016, 38, 144–155. [Google Scholar] [CrossRef]
- Kaur, A.; Pal, S.K.; Singh, A.P. Hybridization of Chaos and Flower Pollination Algorithm over K-Means for data clustering. Appl. Soft Comput. 2020, 97, 105523. [Google Scholar] [CrossRef]
- Nasution, B.I.; Kurniawan, R.; Caraka, R.E. Naspaclust: Nature-Inspired Spatial Clustering. 2021. Available online: https://cran.r-project.org/web/packages/naspaclust/index.html (accessed on 20 June 2021).
- Sani, N.S.; Rahman, M.A.; Bakar, A.A.; Sahran, S.; Sarim, H.M. Machine learning approach for Bottom 40 Percent Households (B40) poverty classification. Int. J. Adv. Sci. Eng. Inf. Technol. 2018, 8, 1698. [Google Scholar] [CrossRef]
- Caraka, R.E.; Lee, Y.; Chen, R.C.; Toharudin, T. Using Hierarchical Likelihood towards Support Vector Machine: Theory and Its Application. IEEE Access 2020, 8, 194795–194807. [Google Scholar] [CrossRef]
- Huang, J.; Lu, J.; Ling, C.X. Comparing naive bayes, decision trees, and SVM with AUC and accuracy. In Proceedings of the IEEE International Conference on Data Mining, ICDM, Melbourne, FL, USA, 22 November 2003; pp. 553–556. [Google Scholar]
- Chen, M.S.; Han, J.; Yu, P.S. Data mining: An overview from a database perspective. IEEE Trans. Knowl. Data Eng. 1996, 8, 866–883. [Google Scholar] [CrossRef] [Green Version]
- Chen, X.W.; Wasikowski, M. FAST: A roc-based feature selection metric for small samples and imbalanced data classification problems. In Proceedings of the ACM SIGKDD International Conference on Knowledge Discovery and Data Mining, Las Vegas, NV, USA, 24–27 August 2008; pp. 124–132. [Google Scholar]
- Dartanto, T.; Otsubo, S. Measurements and Determinants of Multifaceted Poverty: Absolute, Relative, and Subjective Poverty in Indonesia. JICA Res. Inst. 2013, 54, 1–52. [Google Scholar]
- Dartanto, T.; Nurkholis. The determinants of poverty dynamics in Indonesia: Evidence from panel data. Bull. Indones. Econ. Stud. 2013, 49, 61–84. [Google Scholar] [CrossRef] [Green Version]
- Mason, G.A.; Jacobson, R.D. Fuzzy Geographically Weighted Clustering. In Proceedings of the 9th International Conference on Geocomputation, Maynoorth, Ireland, 3–5 September 2007; pp. 1–7. [Google Scholar]
- Liu, H.H.; Chang, L.C.; Li, C.W.; Yang, C.H. Particle swarm optimization-based support vector regression for tourist arrivals forecasting. Comput. Intell. Neurosci. 2018, 2018. [Google Scholar] [CrossRef]
- Caraka, R.E.; Chen, R.C.; Yasin, H.; Pardamean, B.; Toharudin, T.; Wu, S.H. Prediction of Status Particulate Matter 2.5 using State Markov Chain Stochastic Process and HYBRID VAR-NN-PSO. IEEE Access 2019, 7, 161654–161665. [Google Scholar] [CrossRef]
- Warsito, B.; Yasin, H.; Prahutama, A. Particle Swarm Optimization to Obtain Weights in Neural Network. Matematika 2019. [Google Scholar] [CrossRef]
- Wang, X.; Wang, Y. A Hybrid Model of EMD and PSO-SVR for Short-Term Load Forecasting in Residential Quarters. Math. Probl. Eng. 2016, 2016. [Google Scholar] [CrossRef] [Green Version]
- Runkler, T.A.; Katz, C. Fuzzy Clustering by Particle Swarm Optimization. In Proceedings of the 2006 {IEEE} International Conference on Fuzzy Systems, Vancouver, BC, Canada, 16–21 July 2006; IEEE: Manhattan, NY, USA, 2006. [Google Scholar]
- Wijayanto, A.W.; Purwarianti, A. Improvement of fuzzy geographically weighted clustering using particle swarm optimization. In Proceedings of the 2014 International Conference on Information Technology Systems and Innovation (ICITSI), Bandung, Indonesia, 24–27 November 2014; IEEE: Manhattan, NY, USA, 2014; pp. 7–12. [Google Scholar]
- Wijayanto, A.W. Improvement of Fuzzy Geo-Demographic Clustering Using Metaheuristic Optimization on Indonesia Population Census. Master’s Thesis, Bandung Institute of Technology, Bandung, Indonesia, 2014. [Google Scholar]
- Siegel, S. Nonparametric Statistics for the Behavioral Sciences; McGraw-Hill: New York, NY, USA, 1956. [Google Scholar]
- Mehdizadeh, E.; Soheil, S.-N.; Tavakkoli-Moghaddam, R. Optimization of fuzzy clustering criteria by a hybrid PSO and fuzzy c-means clustering algorithm. Iran. J. Fuzzy Syst. 2008, 5, 1–14. [Google Scholar]
- Grekousis, G.; Thomas, H. Comparison of two fuzzy algorithms in geodemographic segmentation analysis: The Fuzzy C-Means and Gustafson-Kessel methods. Appl. Geogr. 2012, 34, 125–136. [Google Scholar] [CrossRef]
- Hu, C.; Meng, L.; Shi, W. Fuzzy clustering validity for spatial data. Geo Spat. Inf. Sci. 2008, 11, 191–196. [Google Scholar] [CrossRef] [Green Version]
- Bansal, J.C.; Singh, P.K.; Saraswat, M.; Verma, A.; Jadon, S.S.; Abraham, A. Inertia Weight strategies in Particle Swarm Optimization. In Proceedings of the 2011 Third World Congress on Nature and Biologically Inspired Computing, Salamanca, Spain, 19–21 October 2011; IEEE: Manhattan, NY, USA, 2011. [Google Scholar]
- Yang, X.S.; Karamanoglu, M.; He, X. Multi-objective flower algorithm for optimization. Procedia Comput. Sci 2013, 18, 861–868. [Google Scholar] [CrossRef] [Green Version]
- Fister, I.; Yang, X.-S.; Brest, J.; Fister, I. On the Randomized Firefly Algorithm. Cuckoo Search Firefly Algorithm Theory Appl. 2013, 27–48. [Google Scholar] [CrossRef]
- BPS-Statistics Indonesia. 2019 Small and Medium Enterprises Profile; BPS-Statistics Indonesia: Jakarta, Indonesia, 2020.
- MCSMEs. Ministry of Cooperation and Small-Medium Enterprises’ National Strategic Plan; Cooperation and Small-Medium Enterprises: Jakarta, Indonesia, 2020. [Google Scholar]

| Information, technology, and communication | [R701] Do you use a cell phone? |
| [R702] Do you have a cell phone? | |
| [R703] Do you use a computer (pc/desktop, laptop/notebook/tablet? | |
| [R704] Have you ever accessed the internet (including Facebook, Twitter, BBM, and WhatsApp)? | |
| Access to financial services | [R2101] How many adult household members (15 years and over) have savings in formal financial institutions (banks, cooperatives, etc.)? |
| Description of sources of income household | [R2301A] What is the main source of financing? |
| General characteristics | What is the highest certificate/STTB owned rank: Do not have SD certificate, Package A, SDLB, SD/MI, Package B, SMPLB, SMP/MTS, Package C |
| Has (NAME) ever received any training/courses/training and obtained a certificate? | |
| Is (NAME) currently attending any training/courses/training (does not have to be certified)? | |
| The main job | What was the main business field/line of work of the place (NAME) worked during the past week? |
| What is the type of occupation/position of the main job (NAME) during the past week? | |
| How long has (NAME) been looking for a job/preparing for a business in the main job? | |
| Is there a certain party (individual/business/company) that regulates/coordinates the business/work (NAME)? | |
| How many workers/employees/employees are paid? | |
| Did (NAME) use digital technology in their main job during the past week? | |
| Did (NAME) use the internet in their main job during the past week? | |
| Is the internet used for: 1. Communication 2. Promotion 3. Carrying out the process of selling goods/services via email/social media (Instagram, Facebook, Twitter, etc.)/instant messaging services (LINE, Whatsapp, Telegram, etc.) 4. Carrying out the process of selling goods/services through the website/marketplace application (Tokopedia, Bukalapak, OLX, etc.) 5. Others, please explain…………………… | |
| How does the agency/institution/company/business where (NAME) works do financial accounting? | |
| Are the goods/services produced from work a week ago prioritized for their own use? | |
| Number of working days, income and wages/salary. | |
| What is the type of agency/institution from the workplace/business of (NAME)? | |
| What is the main location of the workplace/business (NAME) at home? | |
| Work experience | Has (NAME) ever had a previous occupation/main business? |
| Has (NAME) stopped working from the main job/business in the past year? | |
| What was the main reason (NAME) stopped working at the main job/business during the past year? Layoffs 1 Business closes/goes bankrupt 2 Income is not satisfactory 3 Not suitable for the work environment 4 Out of work period/contract 5 Not in accordance with skills/skills gained 6 Pregnant/giving birth/childbirth 7 Taking care of the household 8 Cannot be classified into codes 1–8, write:……………………… 9 | |
| What was the status/position of (NAME) before resigning from the last main job/business? | |
| Doing business alone (1) Doing business assisted by temporary workers/workers (2) |
| Algorithm | Parameters |
|---|---|
| ABC | |
| FPA | |
| GSA | |
| IFA | |
| PSO |
| Performance Measurement | C | FGWC Algorithms | |||||
|---|---|---|---|---|---|---|---|
| CLASSIC | ABC | FPA | GSA | IFA | PSO | ||
| Objective function | 2 | 1.3546 × 10⁶ | 1.3538 × 10⁶ | 1.3497 × 10⁶ | 1.3544 × 10⁶ | 1.3545 × 10⁶ | 1.3544 × 10⁶ |
| 3 | 9.0303 × 10⁵ | 9.0241 × 10⁵ | 8.9936 × 10⁵ | 9.0288 × 10⁵ | 9.0295 × 10⁵ | 9.0288 × 10⁵ | |
| 4 | 6.7728 × 10⁵ | 6.7696 × 10⁵ | 6.7426 × 10⁵ | 6.7719 × 10⁵ | 6.7722 × 10⁵ | 6.7719 × 10⁵ | |
| 5 | 5.4182 × 10⁵ | 5.4162 × 10⁵ | 5.3957 × 10⁵ | 5.4176 × 10⁵ | 5.4178 × 10⁵ | 5.4175 × 10⁵ | |
| 6 | 4.5152 × 10⁵ | 4.5136 × 10⁵ | 4.4970 × 10⁵ | 4.5147 × 10⁵ | 4.5149 × 10⁵ | 4.5146 × 10⁵ | |
| 7 | 3.8701 × 10⁵ | 3.8689 × 10⁵ | 3.8554 × 10⁵ | 3.8698 × 10⁵ | 3.8699 × 10⁵ | 3.8698 × 10⁵ | |
| 8 | 3.3864 × 10⁵ | 3.3856 × 10⁵ | 3.3740 × 10⁵ | 3.3861 × 10⁵ | 3.3862 × 10⁵ | 3.3861 × 10⁵ | |
| 9 | 3.0101 × 10⁵ | 3.0090 × 10⁵ | 3.0002 × 10⁵ | 3.0099 × 10⁵ | 3.0100 × 10⁵ | 3.0099 × 10⁵ | |
| 10 | 2.7091 × 10⁵ | 2.7084 × 10⁵ | 2.7009 × 10⁵ | 2.7089 × 10⁵ | 2.7090 × 10⁵ | 2.7089 × 10⁵ | |
| PC Index | 2 | 5.0000 × 10⁻¹ | 5.0722 × 10⁻¹ | 5.2241 × 10⁻¹ | 5.1076 × 10⁻¹ | 5.0093 × 10⁻¹ | 5.0354 × 10⁻¹ |
| 3 | 3.3333 × 10⁻¹ | 3.4143 × 10⁻¹ | 3.5743 × 10⁻¹ | 3.4124 × 10⁻¹ | 3.3418 × 10⁻¹ | 3.3974 × 10⁻¹ | |
| 4 | 2.5000 × 10⁻¹ | 2.5882 × 10⁻¹ | 2.7072 × 10⁻¹ | 2.5596 × 10⁻¹ | 2.5080 × 10⁻¹ | 2.5246 × 10⁻¹ | |
| 5 | 2.0000 × 10⁻¹ | 2.0537 × 10⁻¹ | 2.1398 × 10⁻¹ | 2.0492 × 10⁻¹ | 2.0053 × 10⁻¹ | 2.0380 × 10⁻¹ | |
| 6 | 1.6667 × 10⁻¹ | 1.7195 × 10⁻¹ | 1.7687 × 10⁻¹ | 1.7186 × 10⁻¹ | 1.6712 × 10⁻¹ | 1.6815 × 10⁻¹ | |
| 7 | 1.4286 × 10⁻¹ | 1.4687 × 10⁻¹ | 1.5209 × 10⁻¹ | 1.4701 × 10⁻¹ | 1.4324 × 10⁻¹ | 1.4289 × 10⁻¹ | |
| 8 | 1.2500 × 10⁻¹ | 1.2891 × 10⁻¹ | 1.3141 × 10⁻¹ | 1.2884 × 10⁻¹ | 1.2525 × 10⁻¹ | 1.2503 × 10⁻¹ | |
| 9 | 1.1111 × 10⁻¹ | 1.1425 × 10⁻¹ | 1.1630 × 10⁻¹ | 1.1459 × 10⁻¹ | 1.1134 × 10⁻¹ | 1.1113 × 10⁻¹ | |
| 10 | 1.0000 × 10⁻¹ | 1.0201 × 10⁻¹ | 1.0412 × 10⁻¹ | 1.0257 × 10⁻¹ | 1.0014 × 10⁻¹ | 1.0002 × 10⁻¹ | |
| CE Index | 2 | 6.9315 × 10⁻¹ | 6.8589 × 10⁻¹ | 6.7032 × 10⁻¹ | 6.8229 × 10⁻¹ | 6.9221 × 10⁻¹ | 6.8958 × 10⁻¹ |
| 3 | 1.0986 × 100 | 1.0866 × 100 | 1.0603 × 100 | 1.0868 × 100 | 1.0973 × 100 | 1.0890 × 100 | |
| 4 | 1.3863 × 100 | 1.3688 × 100 | 1.3390 × 100 | 1.3744 × 100 | 1.3847 × 100 | 1.3814 × 100 | |
| 5 | 1.6094 × 100 | 1.5961 × 100 | 1.5680 × 100 | 1.5972 × 100 | 1.6081 × 100 | 1.5999 × 100 | |
| 6 | 1.7918 × 100 | 1.7761 × 100 | 1.7534 × 100 | 1.7762 × 100 | 1.7904 × 100 | 1.7873 × 100 | |
| 7 | 1.9459 × 100 | 1.9322 × 100 | 1.9051 × 100 | 1.9314 × 100 | 1.9446 × 100 | 1.9458 × 100 | |
| 8 | 2.0794 × 100 | 2.0641 × 100 | 2.0463 × 100 | 2.0641 × 100 | 2.0784 × 100 | 2.0793 × 100 | |
| 9 | 2.1972 × 100 | 2.1834 × 100 | 2.1672 × 100 | 2.1816 × 100 | 2.1962 × 100 | 2.1971 × 100 | |
| 10 | 2.3026 × 100 | 2.2927 × 100 | 2.2764 × 100 | 2.2897 × 100 | 2.3019 × 100 | 2.3025 × 100 | |
| S Index | 2 | 4.6807 × 10⁷ | 1.0339 × 10² | 1.5034 × 101 | 3.1627 × 10² | 1.0507 × 10³ | 4.9634 × 10² |
| 3 | 6.8092 × 10¹⁰ | 1.2966 × 10³ | 2.5468 × 10³ | 1.2263 × 10³ | 9.5055 × 10³ | 4.3475 × 10³ | |
| 4 | 9.6128 × 10¹¹ | 1.1329 × 10³ | 1.3652 × 10⁴ | 2.8750 × 10³ | 1.3684 × 10⁴ | 8.5458 × 10³ | |
| 5 | 2.4582 × 10¹² | 2.7337 × 10³ | 2.4891 × 10⁴ | 1.2615 × 10⁴ | 2.6536 × 10⁴ | 1.1127 × 10⁴ | |
| 6 | 3.6300 × 10¹³ | 1.8326 × 10³ | 8.0931 × 10⁴ | 5.1090 × 10² | 2.1415 × 10⁴ | 9.7044 × 10³ | |
| 7 | 4.1404 × 10¹³ | 6.9357 × 10³ | 5.1912 × 10⁴ | 2.6892 × 10³ | 6.6719 × 10⁴ | 1.7776 × 10⁴ | |
| 8 | 2.5955 × 10¹³ | 7.8481 × 10³ | 9.2450 × 10⁴ | 1.6523 × 10³ | 5.4829 × 10⁴ | 3.0956 × 10⁴ | |
| 9 | 2.3469 × 10¹³ | 7.0561 × 10³ | 1.0135 × 10⁵ | 1.4089 × 10³ | 3.3104 × 10⁴ | 2.4702 × 10⁴ | |
| 10 | 2.5988 × 10¹⁵ | 1.0877 × 10⁴ | 1.9946 × 10⁵ | 1.7557 × 10⁴ | 4.1839 × 10⁴ | 4.1954 × 10⁴ | |
| XB Index | 2 | 4.0829 × 100 | 4.2544 × 100 | 4.1573 × 100 | 4.2736 × 100 | 4.1352 × 100 | 4.1909 × 100 |
| 3 | 2.7219 × 100 | 2.8401 × 100 | 2.8319 × 100 | 2.8610 × 100 | 2.7720 × 100 | 2.8337 × 100 | |
| 4 | 2.0414 × 100 | 2.1693 × 100 | 2.1693 × 100 | 2.1557 × 100 | 2.0831 × 100 | 2.1092 × 100 | |
| 5 | 1.6331 × 100 | 1.7233 × 100 | 1.7308 × 100 | 1.7263 × 100 | 1.6655 × 100 | 1.7135 × 100 | |
| 6 | 1.3609 × 100 | 1.4438 × 100 | 1.4379 × 100 | 1.4574 × 100 | 1.3914 × 100 | 1.4078 × 100 | |
| 7 | 1.1665 × 100 | 1.2400 × 100 | 1.2446 × 100 | 1.2472 × 100 | 1.1928 × 100 | 1.1910 × 100 | |
| 8 | 1.0207 × 100 | 1.0864 × 100 | 1.0690 × 100 | 1.0923 × 100 | 1.0418 × 100 | 1.0399 × 100 | |
| 9 | 9.0729 × 10⁻¹ | 9.5956 × 10⁻¹ | 9.5982 × 10⁻¹ | 9.7005 × 10⁻¹ | 9.2428 × 10⁻¹ | 9.2411 × 10⁻¹ | |
| 10 | 8.1656 × 10⁻¹ | 8.5981 × 10⁻¹ | 8.5519 × 10⁻¹ | 8.6651 × 10⁻¹ | 8.3250 × 10⁻¹ | 8.3358 × 10⁻¹ | |
| IFV Index | 2 | 2.3289 × 10⁻⁸ | 1.1365 × 10⁻² | 8.2913 × 10⁻² | 4.1144 × 10⁻³ | 1.2061 × 10⁻³ | 2.6313 × 10⁻³ |
| 3 | 4.0231 × 10⁻⁸ | 3.2324 × 10⁻² | 2.0135 × 10⁻¹ | 1.4923 × 10⁻² | 4.7535 × 10⁻³ | 1.3659 × 10⁻² | |
| 4 | 4.9924 × 10⁻⁸ | 3.7302 × 10⁻² | 3.2216 × 10⁻¹ | 1.7016 × 10⁻² | 6.0455 × 10⁻³ | 1.2509 × 10⁻² | |
| 5 | 4.0018 × 10⁻⁸ | 3.6548 × 10⁻² | 3.7416 × 10⁻¹ | 2.0551 × 10⁻² | 7.0764 × 10⁻³ | 1.8697 × 10⁻² | |
| 6 | 2.9146 × 10⁻⁸ | 4.2314 × 10⁻² | 4.1691 × 10⁻¹ | 2.4747 × 10⁻² | 8.3875 × 10⁻³ | 1.5328 × 10⁻² | |
| 7 | 2.4576 × 10⁻⁸ | 4.1615 × 10⁻² | 4.5595 × 10⁻¹ | 2.2740 × 10⁻² | 7.8361 × 10⁻³ | 9.4770 × 10⁻³ | |
| 8 | 2.2690 × 10⁻⁸ | 3.4981 × 10⁻² | 4.6065 × 10⁻¹ | 2.3783 × 10⁻² | 7.6422 × 10⁻³ | 9.2776 × 10⁻³ | |
| 9 | 2.2372 × 10⁻⁸ | 5.4328 × 10⁻² | 4.8662 × 10⁻¹ | 2.3515 × 10⁻² | 7.4486 × 10⁻³ | 9.1279 × 10⁻³ | |
| 10 | 2.0450 × 10⁻⁸ | 3.7936 × 10⁻² | 4.3299 × 10⁻¹ | 2.1008 × 10⁻² | 7.1109 × 10⁻³ | 8.5118 × 10⁻³ | |
| Computational time (seconds) | 2 | 0.561 | 108.347 | 32.218 | 13.996 | 86.177 | 16.162 |
| 3 | 0.799 | 100.495 | 30.331 | 12.932 | 77.502 | 13.480 | |
| 4 | 0.734 | 112.403 | 36.463 | 15.897 | 94.718 | 17.125 | |
| 5 | 0.910 | 83.480 | 31.878 | 14.340 | 85.477 | 13.678 | |
| 6 | 0.906 | 103.444 | 38.463 | 17.064 | 105.026 | 21.565 | |
| 7 | 0.974 | 124.028 | 41.173 | 18.286 | 108.363 | 19.510 | |
| 8 | 1.013 | 94.965 | 33.810 | 16.148 | 82.565 | 15.617 | |
| 9 | 1.111 | 118.785 | 40.832 | 20.101 | 118.395 | 21.933 | |
| 10 | 1.118 | 104.519 | 38.686 | 17.916 | 81.331 | 11.986 | |
| Number of iterations | 2 | 11.440 | 32.380 | 36.940 | 15.080 | 17.840 | 18.140 |
| 3 | 12.420 | 34.420 | 38.280 | 15.440 | 17.840 | 16.740 | |
| 4 | 12.780 | 30.420 | 38.100 | 15.440 | 17.800 | 17.300 | |
| 5 | 13.320 | 26.480 | 36.340 | 15.440 | 17.840 | 17.260 | |
| 6 | 13.640 | 25.300 | 36.200 | 15.000 | 17.840 | 19.820 | |
| 7 | 13.780 | 29.380 | 36.960 | 15.160 | 17.840 | 19.820 | |
| 8 | 13.860 | 26.880 | 34.140 | 15.040 | 17.880 | 20.460 | |
| 9 | 13.900 | 25.520 | 33.340 | 15.040 | 17.880 | 20.360 | |
| 10 | 13.960 | 27.260 | 35.720 | 15.400 | 17.920 | 19.020 | |
| Cluster | Use_Cellph | Have_Cellph | Use_Pc | Acc_Int | Saving | Credit_A | Credit_B | Credit_C | Credit_D |
| 1 | 88.25552 | 80.55931 | 15.37845 | 27.27296 | 34.50903 | 9.506159 | 10.82205 | 2.227692 | 4.093793 |
| 2 | 89.42493 | 85.69444 | 27.77035 | 47.54352 | 45.87103 | 11.127022 | 12.41292 | 3.176292 | 5.00927 |
| sour_money | edu | course | job_dur | no_empl_14 | no_empl_519 | digitech1 | digitech2 | digitech3 | |
| 1 | 96.96485 | 46.61807 | 88.37956 | 44.57606 | 84.07763 | 14.43613 | 10.33827 | 39.21705 | 24.71888 |
| 2 | 96.38307 | 63.90895 | 83.51627 | 47.63658 | 80.92 | 16.39125 | 24.34142 | 68.87062 | 40.24244 |
| job_int | jobint_use1 | jobint_use2 | jobint_use3 | jobint_use4 | financebook | work_org | work_loc | prev_work | |
| 1 | 25.97092 | 25.30045 | 11.53989 | 10.93522 | 2.296787 | 55.59538 | 94.41761 | 30.41872 | 49.09258 |
| 2 | 61.53131 | 60.9503 | 33.52371 | 34.04755 | 9.251676 | 71.5543 | 92.99104 | 38.11023 | 59.03073 |
Publisher’s Note: MDPI stays neutral with regard to jurisdictional claims in published maps and institutional affiliations. |
© 2021 by the authors. Licensee MDPI, Basel, Switzerland. This article is an open access article distributed under the terms and conditions of the Creative Commons Attribution (CC BY) license (https://creativecommons.org/licenses/by/4.0/).
Share and Cite
Caraka, R.E.; Kurniawan, R.; Nasution, B.I.; Jamilatuzzahro, J.; Gio, P.U.; Basyuni, M.; Pardamean, B. Micro, Small, and Medium Enterprises’ Business Vulnerability Cluster in Indonesia: An Analysis Using Optimized Fuzzy Geodemographic Clustering. Sustainability 2021, 13, 7807. https://doi.org/10.3390/su13147807
Caraka RE, Kurniawan R, Nasution BI, Jamilatuzzahro J, Gio PU, Basyuni M, Pardamean B. Micro, Small, and Medium Enterprises’ Business Vulnerability Cluster in Indonesia: An Analysis Using Optimized Fuzzy Geodemographic Clustering. Sustainability. 2021; 13(14):7807. https://doi.org/10.3390/su13147807
Chicago/Turabian StyleCaraka, Rezzy Eko, Robert Kurniawan, Bahrul Ilmi Nasution, Jamilatuzzahro Jamilatuzzahro, Prana Ugiana Gio, Mohammad Basyuni, and Bens Pardamean. 2021. "Micro, Small, and Medium Enterprises’ Business Vulnerability Cluster in Indonesia: An Analysis Using Optimized Fuzzy Geodemographic Clustering" Sustainability 13, no. 14: 7807. https://doi.org/10.3390/su13147807
APA StyleCaraka, R. E., Kurniawan, R., Nasution, B. I., Jamilatuzzahro, J., Gio, P. U., Basyuni, M., & Pardamean, B. (2021). Micro, Small, and Medium Enterprises’ Business Vulnerability Cluster in Indonesia: An Analysis Using Optimized Fuzzy Geodemographic Clustering. Sustainability, 13(14), 7807. https://doi.org/10.3390/su13147807