Abstract
While mixed-species cover crops are gaining worldwide popularity, their utility in the ‘plough-out’ period in tropical sugar cane systems has not been investigated. Field trials investigating weed suppression (one season only), biomass production and nitrogen accumulation of single-species and mixed-species cover crops were conducted over two seasons on a commercial sugarcane farm in the Australian tropics. Mixed-species cover crops showed strong weed suppression, and were among the top treatments for biomass production each year, but did not yield the highest biomass in either season. Sunn hemp (Crotalaria juncea cv. Global sunn) produced the most biomass in the drier-than-average 2016–2017 season (>10 t dry matter ha−1), while soybean (Glycine max cv. Leichardt) produced the most biomass (5.3 t dry matter ha−1) in the wetter-than-average 2018–2019 season, highlighting the influence of seasonal conditions on species’ biomass production. The inclusion of multiple species in a short-term cover crop in the tropics where extreme weather events can occur can thus be seen as a risk mitigation strategy given the risk of failure of any given species in a given season.
1. Introduction
Sugarcane (Saccharum officinarum) is cultivated on an estimated 27 million ha across the globe [1], predominantly in tropical regions. The total annual harvested area of sugarcane in Australia is around 400,000 ha, with around 35 Mt biomass harvested. At the start of a production cycle in Australia, sugarcane is established from vegetative propagules known as ‘billets’ or ‘setts’ and the first crop is termed ‘plant cane’. This crop is typically harvested after a year and the sugarcane plant then regrows from the roots and crown (‘stool’), remaining in the soil to produce a ’ratoon crop’. Sugarcane in the Australian tropics is typically harvested annually with four or more ratoon crops grown before cane is removed [2]. While ratoon crops can have lower yields than plant cane crops, the cost of production is typically lower [3]. However, the continual production of sugarcane in the same field over time has led to observations of yield decline, which appears to be related to a decline in soil health and build-up of pathogens associated with the sugarcane monoculture [4].
One potential management option to address yield decline in sugarcane is the introduction of rotation crops in the fallow period between plough-out and replanting of subsequent cane crops [5]. Potential benefits of rotation crops or cover crops in the summer wet season in the Australian tropics during the sugarcane fallow period include improved groundcover and protection against erosion, reduced NO3− leaching, increased carbon (C) inputs into soils and improvements in soil biological populations related to cane health. A number of studies have investigated short-term cover crops or longer-term break crops over 9–42 months during the sugarcane cycle [2,6], but most have focussed on fallow legume crops to break the monocot monoculture and improve soil microbial populations related to cane health [5]. More recent studies have investigated the influence of fallow legume crops on nitrogen (N) supply to subsequent cane crops [7,8] or the capacity of specific rotation crops to suppress pests of sugarcane, including nematodes (e.g., [9]).
Leaching of NO3− during the fallow period has been observed in tropical sugarcane systems [10], being both a loss of resources and also a potential pollutant. There is increasing evidence that grass–legume mixtures are proficient at minimising NO3− leaching [11] through capturing and storing N in biomass, potentially available to the cane crop later in the season following the mineralisation of biomass. Indeed, higher cover crop biomass production has been positively correlated with a reduction in NO3− leaching [12]. Ecological theory suggests that cover crop mixes, due to diversity of plants, could produce more biomass than single-species plantings due to complementarity of resource use [13], which could be important for N cycling and accumulation of soil organic carbon.
We are unaware of any published studies on dual- or mixed-species cover crops in tropical sugarcane systems, but it is possible that they may play a role in reducing NO3− leaching and increasing soil C in these systems. The present study was therefore undertaken to investigate biomass production and N accumulation in single-species and mixed-species cover crops, and N fixation in leguminous cover crops. One potential issue of mixed-species cover crops in sugarcane systems is a lack of herbicide options to control weeds compared to single-species cover crops, where herbicide options are typically available. In particular, the inclusion of grass species in cover crop mixes can preclude the use of grass-selective herbicides that are typically used to control volunteer cane plants during the fallow period. The present study therefore also examined potential weed suppression of mixed-species cover crops compared to a range of single-species cover crops in the first of two trial seasons. It was hypothesised that mixed-species cover crops would produce more biomass than single-species cover crops, and would therefore be more weed suppressive.
2. Materials and Methods
Field trials were established in separate fields on the same commercial sugarcane farm near Ingham, Queensland, Australia (18°37′26.84″ S, 146°10′30.80″ E), in December 2016 and December 2018, to investigate weed suppression (trial 1, 2016–2017 only), biomass production and N accumulation (both seasons) and legume N fixation (trial 2, 2018–2019 only) in a range of single-species and mixed-species cover crops in the traditional plough-out period between sugarcane crops. Sugarcane has been grown on the farm for >100 years, with a controlled-traffic permanent bed system on 1.83 m row spacing for the past 14–16 years. Raised beds enable drainage in furrow areas following heavy rainfall, and also allow wheel traffic to be concentrated in the furrow so soil in beds (where sugarcane and break crops are grown) is not compacted by machinery. The farm has been ‘green harvested’ with trash retention (i.e., no burning, with sugarcane leaf material left on the soil) since 1985. Trials in both fields were laid out using a randomised block design (n = 3) with plots being three beds wide (5.49 m × 20 m long). No herbicides were used to control weeds in either trial due to potential damage to neighbouring susceptible cover crops.
2.1. Trial 1
The soil type was a fluvisol [14] and selected chemical properties of the top 0–15 cm layer are given in Table 1 (samples analysed at Qld Department of Environment and Science Chemistry Centre). Prior to the establishment of the trial, the site was disked twice to chop up sugarcane trash into smaller pieces and to incorporate 4 t ha−1 of a lime/dolomite blend containing 32% Ca and 3% Mg (Miriwinni Lime Pty Ltd., Miriwinni, Australia). A bed renovator was used to form beds prior to cover crop seeds being manually broadcast onto the surface of each plot on 24 December 2016 before being incorporated using a wavey disc cultivator. Cover crop treatments and seeding rates are given in Table 2. Legumes were inoculated with appropriate rhizobia prior to sowing (Table 2). Temperature and rainfall during the trial period are shown in Figure 1a.

Table 1.
Key chemical properties of 0–15 cm layer of soil at trial 1 and trial 2.
Table 2.
Cover crop treatments and seeding rates in trial 1 and trial 2.
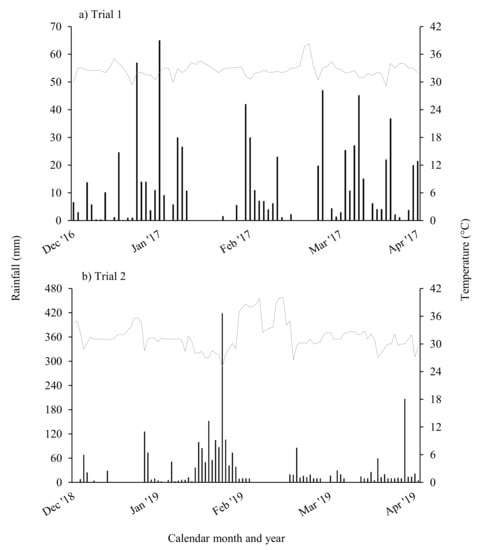
Figure 1.
Daily rainfall and maximum temperature data for (a) trial 1 in the 2016–2017 season; and (b) trial 2 in the 2018–2019 season.
2.2. Trial 2
A second trial adjacent to trial 1 was established on 21 December 2018 (seeding rates are given in Table 2). Temperature and rainfall during the trial period are shown in Figure 1b. Some species used in trial 1 were omitted in trial 2 due to poor growth in 2016–2017 (e.g., canola) or lack of available seed, with new species introduced to replace these treatments (burgundy bean, rice). Given the proximity of broadleaf and monocot plots, weeds were controlled by hand on 27th and 28th of February 2019 in single-species plots. A significant wet weather period was experienced in early February 2019 (Figure 1b) and cowpeas in the single-species plots died off due to Phytophthora root rot caused by waterlogging.
2.3. Measurements
For trial 1, the percent weed cover was assessed on 13 March 2017 by giving each plot a percentage rate of weeds. This was done by visibly inspecting the entire plot and estimating the proportion of biomass comprised of weeds (i.e., species that were not sown in that plot).
For biomass production and nutrient contents, a 1 m length of the centre row (of three) in the middle raised bed was harvested manually from each plot prior to cover crop termination at each trial. Field site 1 biomass was sampled on 13 March 2017 and field site 2 biomass was sampled on 12 April 2019. Fresh weight was recorded in the field using digital scales, and samples were transported to a shed and roughly chopped/homogenised using a mulcher. A 500 g subsample of mulched material was then dried to determine % dry matter. Plot dry weight was calculated by multiplying the field fresh weight by the % dry matter of the subsample. Cover crop biomass per plot was determined by multiplying the total plot biomass by the % cover crop from the weed estimates. Dried plant material was roughly ground and a subsample finely ground for subsequent nutrient analysis. Approximately 0.2 g ground material was digested in aqua regia in a MARS Xpress microwave oven (CEM Corporation, Matthews, NC, USA) and concentrations of Mg, Ca, P, K, Zn, Mn, Fe, and Cu were quantified using inductively coupled plasma optical emission spectroscopy (ICP-OES 4300D, Perkin Elmer, Waltham, MA, USA). Concentrations of N and S in 0.2 g subsamples were quantified using a LECO TruMAC CNS analyser. All biomass and N accumulation data were expressed on a per ha basis.
At field site 2 (2018–2019), % N derived from the atmosphere (%Ndfa) in legumes and biological N fixation were quantified using the 15N natural abundance method [15]. Nitrogen isotope ratios in legumes and non-legumes (radish, Jap millet, rice and sunflower) were measured using a Thermo Delta V plus isotope ratio mass spectrometer (Thermo Scientific, Bremen, Germany) after combustion on a Thermo Flash EA 1112 elemental analyser (Thermo Scientific, Bremen, Germany). The %Ndfa in legume shoots was calculated as per Shearer and Kohl [15]:
where ‘δ15N reference plant’ was the average δ15N of all non-legume shoot samples (+3.0 ‰ ± 0.5) and B values were: cowpea −1.61 ‰ [16], sunn hemp −1.08 ‰ (Unkovich, et al. 2008), velvet bean −1.82 ‰ [16], soybeans (all varieties) −1.70 ‰ [17], burgundy bean −1.40 ‰ [18], pigeon pea −1.12 ‰ [16] and lablab −1.09 ‰ [16]. Fixed N for each legume was calculated by multiplying the %Ndfa by the respective shoot biomass.
2.4. Statistical Analyses
Shoot biomass and N accumulation data (both trials) and percent weed data (2016 trial) were analysed using a two-way ANOVA, fitting cover crop treatment and block as factors. Data transformation (log [10]) was undertaken on cover crop N content data in trial 1 to satisfy normality assumptions. Data were analysed in Genstat Release 19.1 [19]. Significance of cover crop treatment differences were tested using a Duncan’s multiple range test.
3. Results
3.1. Trial 1 (2016–2017 Season)
Around 780 mm of rainfall fell during the 11-week cover crop-growing period (Figure 1a). This is less than the historical average rainfall of >1000 mm for this period (Bureau of Meteorology 2020). No weeds were observed in soybean cv. Leichardt and cowpea single-species treatments or in any of the mixed-species cover crops (Figure 2a). In contrast, sunflower and canola plots were dominated by weeds to the extent that when weeds were visually assessed on 13 March 2017, no canola plants were observed. Desmanthus plots also had >50% weeds by visual observation.
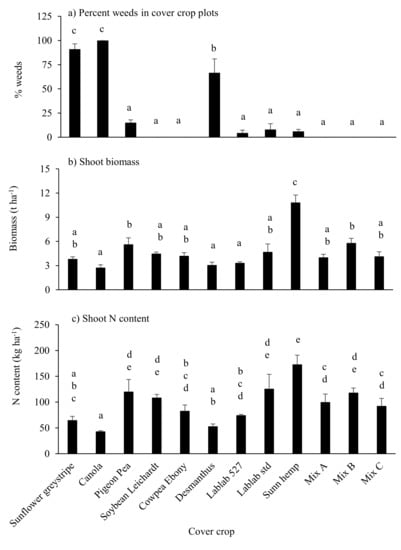
Figure 2.
Visually estimated percentage of weeds in plots (a), shoot biomass production (b) and N content (c) in single-species and mixed-species cover crop treatments in the 2016–2017 season. Error bars represent SEM (n = 3). Means not followed by a common letter are significantly different at p ≤ 0.05. Note that all biomass in canola plots, and a large proportion of biomass in sunflower and desmanthus plots, was from weed species.
Cover crop biomass production was highest in sunn hemp plots (>10 t ha−1) and was lowest in the plots dominated by weeds (canola, sunflower and desmanthus) and lablab cv. Rongai 527. Nitrogen accumulation in shoots was significantly higher in sunn hemp than all other treatments (Figure 2b). There was no significant difference in N accumulation between other legume and mixed-species treatments, with the exception of desmanthus, which was significantly lower than all but the lablab cv. Rongai 527 and cowpea treatments, likely due to the high proportion of (non-leguminous) weeds in this treatment (Figure 2a,c).
3.2. Trial 2 (2018–2019 Season)
The site received >2500 mm rainfall during the trial period (Figure 1b). It was noted that the cowpeas in the single-species plots and in all mixed-species plots, and sunflowers in mix 2, died off at the onset on heavy rainfall and soil waterlogging, while other species persisted. Biomass production in tillage radish was significantly lower than all other treatments except sunflower, which had died prematurely due to wet weather. All treatments other than the radish and sunflower produced between 3 and 4.5 t biomass ha−1 (Figure 3a). In contrast to the dry 2016–2017 season where sunn hemp yielded significantly (p < 0.05) more biomass than soybean cv. Leichardt (10.8 vs. 4.4 t ha−1), in the wet 2018–2019 season biomass yields of soybean cv. Leichardt and sunn hemp (5.3 vs. 4.3 t ha−1) were not significantly different.
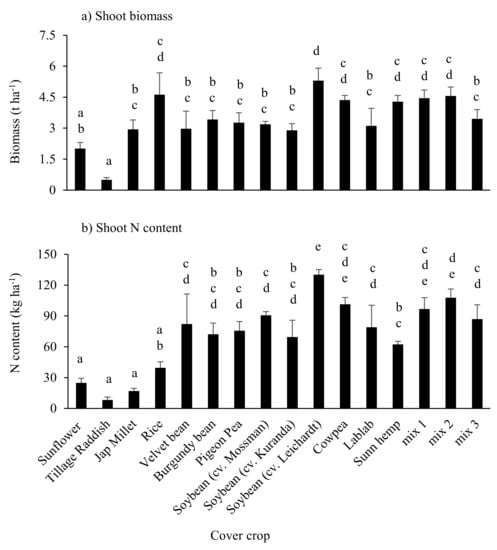
Figure 3.
Shoot biomass production (a) and N content (b) in single-species and mixed-species cover crop treatments in trial 2. Error bars represent SEM (n = 3). Means not followed by a common letter are significantly different at p ≤ 0.05. Note: cowpea plots contained a mixture of weeds and decayed cowpea residue as cowpeas died in February 2019 due to wet weather.
Nitrogen content in shoots (N accumulation) was generally higher in the legume and mixed-species treatments (which contained legume species) than in non-leguminous dicot and grass species (Figure 3b). Of the legumes, N content of shoots was lowest in sunn hemp, reflecting the lower tissue N concentrations (Table S1).
In legumes, %Ndfa was highest in pigeon pea (around 90%) but was only 45–50% on average in soybean cv. Mossman and Leichardt, sunn hemp and lablab (Table 3). The maximum amount of N fixed in shoots was 68 kg N ha−1 in both soybean cv. Leichardt and pigeon pea, with the lowest shoot-fixed N in sunn hemp with only 29 kg N ha−1 (Table 3).
Table 3.
Percent nitrogen derived from atmosphere (%Ndfa) and total fixed nitrogen in shoots of legumes grown in trial 2 (2018–2019). Means are shown ± SEM (n = 3).
4. Discussion
While a number of studies have investigated break crops, typically legumes, in the traditional fallow period in tropical cane systems (e.g., [2]), potential benefits of mixed-species cover crops in these systems have not been explored. Data from trial 1 (2016–2017) indicated that mixed-species cover crops were highly competitive against weeds compared to some of the single-species cover crops, including sunflowers, canola and desmanthus. Further, biomass production of mixed-species plots was always among the highest of all treatments, although never greater than the highest single-species treatment in either year. These findings are consistent with a number of studies in temperate environments that indicate while mixed-species cover crops show strong weed suppression and high biomass compared to many single-species treatments, they rarely rank higher than the top performing single-species treatment in any given site or season [12,20,21,22]. This is not attributed to ‘over-yielding’ as a result of niche complementarity in the mixed-species treatments, since at least one of the individual components of the mixed species produced more biomass as a single species than the mixed-species treatments in each season; for example, sunn hemp as a single species in trial 1 and soybean cv. Leichardt as a single species in trial 2. Rather, it appears that different species thrive in different seasons, and inclusion of multiple species in a plot mitigates the risk of failure of any given species in a given season, particularly in seasons with extreme weather events [20]. The poor growth of cowpeas following the extremely wet weather in trial 2 (2019 season; >2000 mm in one month) highlighted this point. While the death of cowpeas in the single-species plots led to weed infestation, death of cowpeas in the mixed-species plots did not result in weed infestation, as other species (e.g., lablab in mix 3) continued to thrive and maintained weed suppression. From a practical point of view, the strong weed suppression by mixed-species cover crops suggests that weed control (lack of available herbicide options) should not be a barrier to any potential adoption of mixed-species cover crops in tropical cane systems. In contrast, poor weed suppression in single-species canola, sunflower and desmanthus treatments in trial 1 is problematic due to perceived risk of problem weeds setting seed and the need for selective herbicides to remove key broadleaf and grass weeds. Farmer adoption of mixed-species cover crops is therefore a more likely prospect if seed costs are not prohibitive.
In a study in subtropical sugarcane systems, soybean crops grown across a range of soil types during the fallow phase had %Ndfa values ranging from 75–91%, with the exception of two crops that were waterlogged during early growth that had %Ndfa values of around 30% [17]. The lower %Ndfa values in soybeans in the present study (52% in cv. Leichardt to 69% in cv. Kuranda) likely reflect the wet seasonal conditions that can negatively impact both plant growth and rhizobia performance in soybean [23]. In contrast, pigeon pea had an estimated %Ndfa of around 90%, suggesting that rhizobia were not negatively impacted by the wet conditions. It is worth noting, however, that %Ndfa was estimated using the 15N natural abundance method and several factors increased the chance of error in these estimations. Firstly, the reference (non-N fixing) plants had an average δ15N of +3.0 ± 0.5 ‰, and reference plant δ15N values < +4.0 ‰ increase the chance of under or overestimation of %Ndfa [16]. Secondly, the B values used were obtained from plants at mid-pod filling stages (16, 17, 18) while legumes in the field trial were sampled between flowering and pod filling depending on the species. The use of B values from growth stages earlier than mid pod filling has a limited impact on %Ndfa estimations when reference plants have δ15N values > +4.0 ‰, but has a greater influence on %Ndfa estimates as the δ15N values of reference plants approach those of the legumes tested [24]. Thus, it should be noted that the %Ndfa values measured provide only an estimate of the biological N fixed by the legumes in trial 2.
Accumulation of N in cover crops reflects both the uptake of soil N, as well as N acquired through biological N2 fixation in the case of legumes or mixed-species plots that contain legumes. Dabney et al. [25] highlight the point that while grasses and other non-legumes are efficient at scavenging N, their growth is often limited by N deficiency, and hence growing a legume and non-legume in a cover crop mix often leads to greater biomass production without sacrificing the N scavenging capacity. Lower N content in shoots of grass and non-legume broadleaf cover crops in trial 2 compared to legume single-species plantings and mixed-species treatments is consistent with this notion. In particular, the low shoot N concentration (Table S1) and visible N deficiency symptoms in the single-species radish plots (Figure S1) indicate that in high rainfall and leaching environments, growth and N capture by non-legumes may indeed be limited by N deficiency. As per the biomass accumulation, N accumulation in mixed-species plots was always among the highest of all treatments, although never greater than the highest (legume) single-species treatment in either year (Figure 1c and Figure 2b). However, the fact that the best performing legume in terms of N accumulation was different between trial 1 and trial 2 again indicates the utility of mixed-species plots with multiple legume species in mitigating the risk of failure of a particular legume species in a given season. While legume and mixed plots had the most N in shoots, which may indicate scavenging of N and reduced leaching, a key question remains around the fate of this N after cover crop termination. Previous studies indicate rapid turnover of residue-N in these systems [17] and it may be that fixation of large amounts of N may be problematic if uncontrolled mineralisation in the warm, wet tropics then leads to large nitrate-leaching losses in the weeks or months following termination of the cover crops.
5. Conclusions
The hypothesis that mixed-species cover crops would produce more biomass than single-species cover crops due to complementarity of resource use was not supported, because biomass production in mixed-species plots was never greater than the highest single-species treatment in either trial. However, mixed-species cover crops were highly weed suppressive and the inclusion of multiple species mitigated the risk of failure of any given species in a particular season. Mixed-species cover crops accumulated substantial amounts of N in aboveground biomass, but further research is warranted to investigate the fate of cover crop N after termination in tropical environments.
Supplementary Materials
The following are available online at https://www.mdpi.com/article/10.3390/agriculture11070640/s1, Figure S1: Radish plants under single-species planting (top panel) and in a mixed-species plot (bottom panel). Note yellowing of leaves consistent with nitrogen deficiency in plants grown as a single species, Table S1: Nutrient concentrations in cover crop shoots at termination at field trial 2 (2018–2019).
Author Contributions
Conceptualisation, L.D.B., T.J.R. and L.v.Z.; methodology, L.D.B., T.J.R. and L.v.Z.; experimental conduct, M.Z. and L.D.B.; writing—original draft preparation, L.D.B. and T.J.R.; writing—review and editing, L.D.B., T.J.R., M.Z. and L.v.Z. All authors have read and agreed to the published version of the manuscript.
Funding
This research was funded by Herbert Cane Productivity Services Limited, Project Catalyst and The Cooperative Research Centre for High Performance Soils, grant number 4.1.002.
Conflicts of Interest
The authors declare no conflict of interest.
References
- FAOSTAT. 2014. Available online: http://www.fao.org/faostat/en/ (accessed on 20 October 2019).
- Pankhurst, C.E.; Magarey, R.C.; Stirling, G.R.; Blair, B.L.; Bell, M.J.; Garside, A.L. Management practices to improve soil health and reduce the effects of detrimental soil biota associated with yield decline of sugarcane in Queensland, Australia. Soil Till. Res. 2003, 72, 125–137. [Google Scholar] [CrossRef]
- Chumphu, S.; Jongrungklang, N.; Songsri, P. Association of physiological responses and root distribution patterns of ratooning ability and yield of the second ratoon cane in sugarcane elite clones. Agronomy 2019, 9, 200. [Google Scholar] [CrossRef] [Green Version]
- Magarey, R.C. Yield decline in sugarcane. In Current Trends in Sugarcane Pathology; Rao, G.P., Gillespie, A.G., Upadhyaya, P.P., Bergman, A., Agnihotri, V.P., Chen, T.T., Eds.; International Books and Periodicals Supply Service: Pitampura, India, 2003; pp. 393–412. [Google Scholar]
- Garside, A.L.; Bell, M.J. Fallow legumes in the Australian sugar industry: Review of recent research findings and implications for the sugarcane cropping system. Proc. Aust. Soc. Sugar Cane Technol. 2001, 23, 230–235. [Google Scholar]
- Umrit, G.; Bholah, M.A.; Ng Kee Kwong, K.F. Nitrogen benefits of legume green manuring in sugarcane farming systems in Mauritius. Sugar Tech. 2009, 11, 12–16. [Google Scholar] [CrossRef]
- Park, S.E.; Webster, A.J.; Horan, H.L.; James, A.T.; Thorburn, P.J. Legume rotation crops lessen the need for nitrogen fertiliser throughout the sugarcane cropping cycle. Field Crops Res. 2010, 119, 331–341. [Google Scholar] [CrossRef]
- Bell, M.J.; Garside, A.L. Growth and yield responses to amending the sugarcane monoculture: Interactions between break history and nitrogen fertiliser. Crop Pasture Sci. 2014, 65, 287–299. [Google Scholar] [CrossRef] [Green Version]
- Berry, S.D.; Rhodes, R.; Foster, J.; Risede, J.-M.; van Antwerpen, R. The effect of cover crops on plant parasitic nematodes of sugarcane. Int. J. Pest Manag. 2011, 57, 363–375. [Google Scholar] [CrossRef]
- Nachimuthu, G.; Bell, M.J.; Halpin, N. Nitrogen losses in terrestrial hydrological pathways in sugarcane cropping systems of Australia. J. Soil Water Conserv. 2017, 72, 32–35. [Google Scholar] [CrossRef]
- Kaye, J.; Finney, D.; White, C.; Bradley, B.; Schipanski, M.; Alonso-Ayuso, M.; Hunter, M.; Burgess, M.; Mejia, C. Managing nitrogen through cover crop species selection in the US mid-Atlantic. PLoS ONE 2019, 14, e0215448. [Google Scholar] [CrossRef] [PubMed]
- Finney, D.M.; White, C.M.; Kaye, J.P. Biomass production and carbon/nitrogen ratio influence ecosystem services from cover crop mixtures. Agron. J. 2016, 108, 39–52. [Google Scholar] [CrossRef] [Green Version]
- Tilman, D. The ecological consequences of changes in biodiversity: A search for general principles. Ecology 1999, 80, 1455–1474. [Google Scholar] [CrossRef]
- IUSS Working Group WRB. World Reference Base for Soil Resources 2014. In International Soil Classification System for Naming Soils and Creating Legends for Soil Maps, 3rd ed.; FAO: Rome, Italy, 2014. [Google Scholar]
- Shearer, G.; Kohl, D.H. N2 fixation in field settings: Estimations based on natural 15N abundance. Aust. J. Plant Physiol. 1986, 13, 699–756. [Google Scholar]
- Unkovich, M.J.; Herridge, D.F.; Peoples, M.B.; Cadisch, G.; Boddey, R.M.; Giller, K.E.; Alves, B.; Chalk, P.M. Measuring Plant-associated Nitrogen Fixation in Agricultural Systems; Australian Centre for International Agricultural Research: Canberra, Australia, 2008. [Google Scholar]
- Kearney, L.J.; Dutilloy, E.; Rose, T.J. Nitrogen fixation in summer-grown soybean crops and fate of fixed-N over a winter fallow in subtropical sugarcane systems. Soil Res. 2019, 57, 845–850. [Google Scholar] [CrossRef]
- Bell, L.W.; Lawrence, J.; Johnson, B.; Peoples, M.B. New ley legumes increase nitrogen fixation and availability and grain crop yields in subtropical cropping systems. Crop Pasture Sci. 2017, 68, 11–26. [Google Scholar] [CrossRef]
- VSN International. Genstat for Windows, 19th ed.; VSN International: Hemel Hempstead, UK, 2018. [Google Scholar]
- Wortman, S.E.; Francis, C.A.; Lindquist, J.L. Cover crop mixtures for the western corn belt: Opportunities for increased productivity and stability. Agron. J. 2012, 104, 699–705. [Google Scholar] [CrossRef] [Green Version]
- Florence, A.M.; Higley, L.G.; Drijber, R.A.; Francis, C.A.; Lindquist, J.L. Cover crop mixture diversity, biomass productivity, weed suppression, and stability. PLoS ONE 2019, 14, e0206195. [Google Scholar] [CrossRef] [PubMed] [Green Version]
- Antosh, E.; Idowu, J.; Schutte, B.; Lehnhoff, E. Winter cover crops effects on soil properties and sweet corn yield in semi-arid irrigated systems. Agron. J. 2020, 112, 92–106. [Google Scholar] [CrossRef]
- Sung, F.J.M. Waterlogging effect on nodule nitrogenase and leaf nitrate reductase activities in soybean. Field Crop. Res. 1993, 35, 183–189. [Google Scholar] [CrossRef]
- Rose, T.J.; Kearney, L.J.; Erler, D.V.; Rose, M.T.; Van Zwieten, L.; Raymond, C.A. Influence of growth stage and seed nitrogen on B values and potential contributions to error in estimating biological N2 fixation using the 15N natural abundance method. Plant Soil 2018, 425, 389–399. [Google Scholar] [CrossRef]
- Dabney, S.; Delgado, J.A.; Reeves, D.W. Using winter cover crops to improve soil and water quality. Commun. Soil Sci. Plant Anal. 2001, 32, 1221–1250. [Google Scholar] [CrossRef]
Publisher’s Note: MDPI stays neutral with regard to jurisdictional claims in published maps and institutional affiliations. |
© 2021 by the authors. Licensee MDPI, Basel, Switzerland. This article is an open access article distributed under the terms and conditions of the Creative Commons Attribution (CC BY) license (https://creativecommons.org/licenses/by/4.0/).