
Prediction of Treatment Outcome with Inflammatory Biomarkers after 2 Months of Therapy in Pulmonary Tuberculosis Patients: Preliminary Results

 ,
,  , ,
, ,  , and
, and
Abstract
:1. Introduction
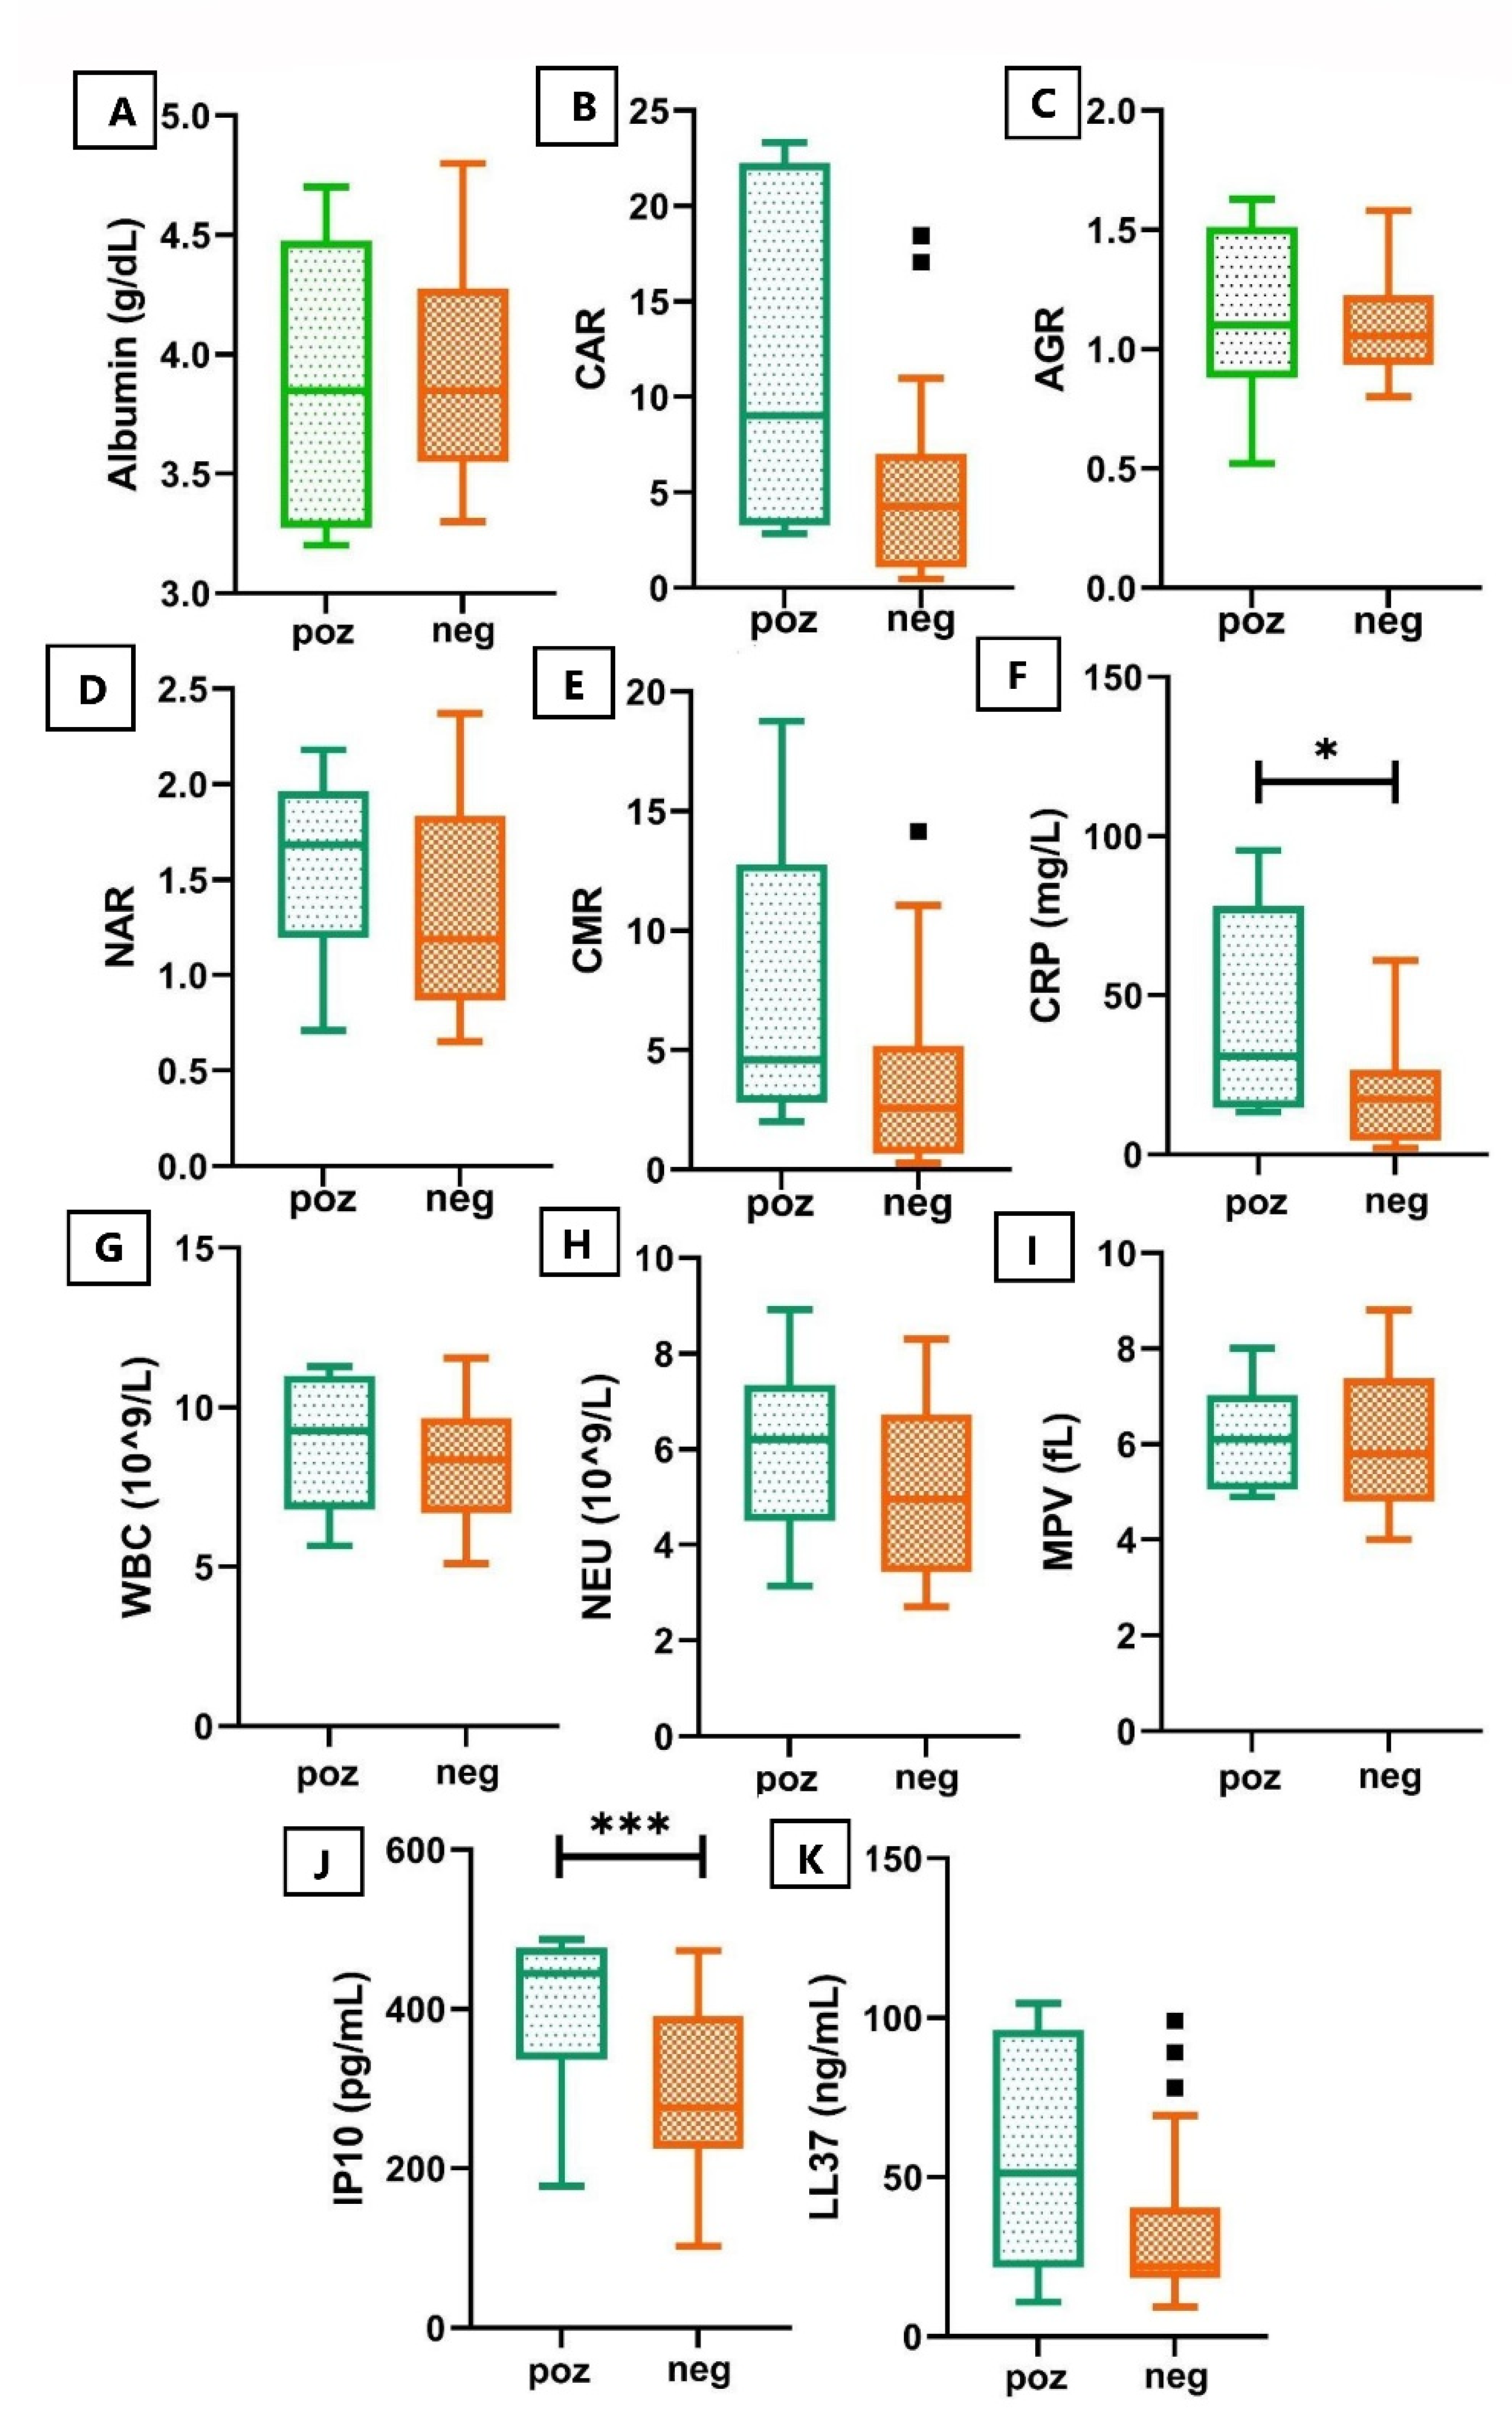
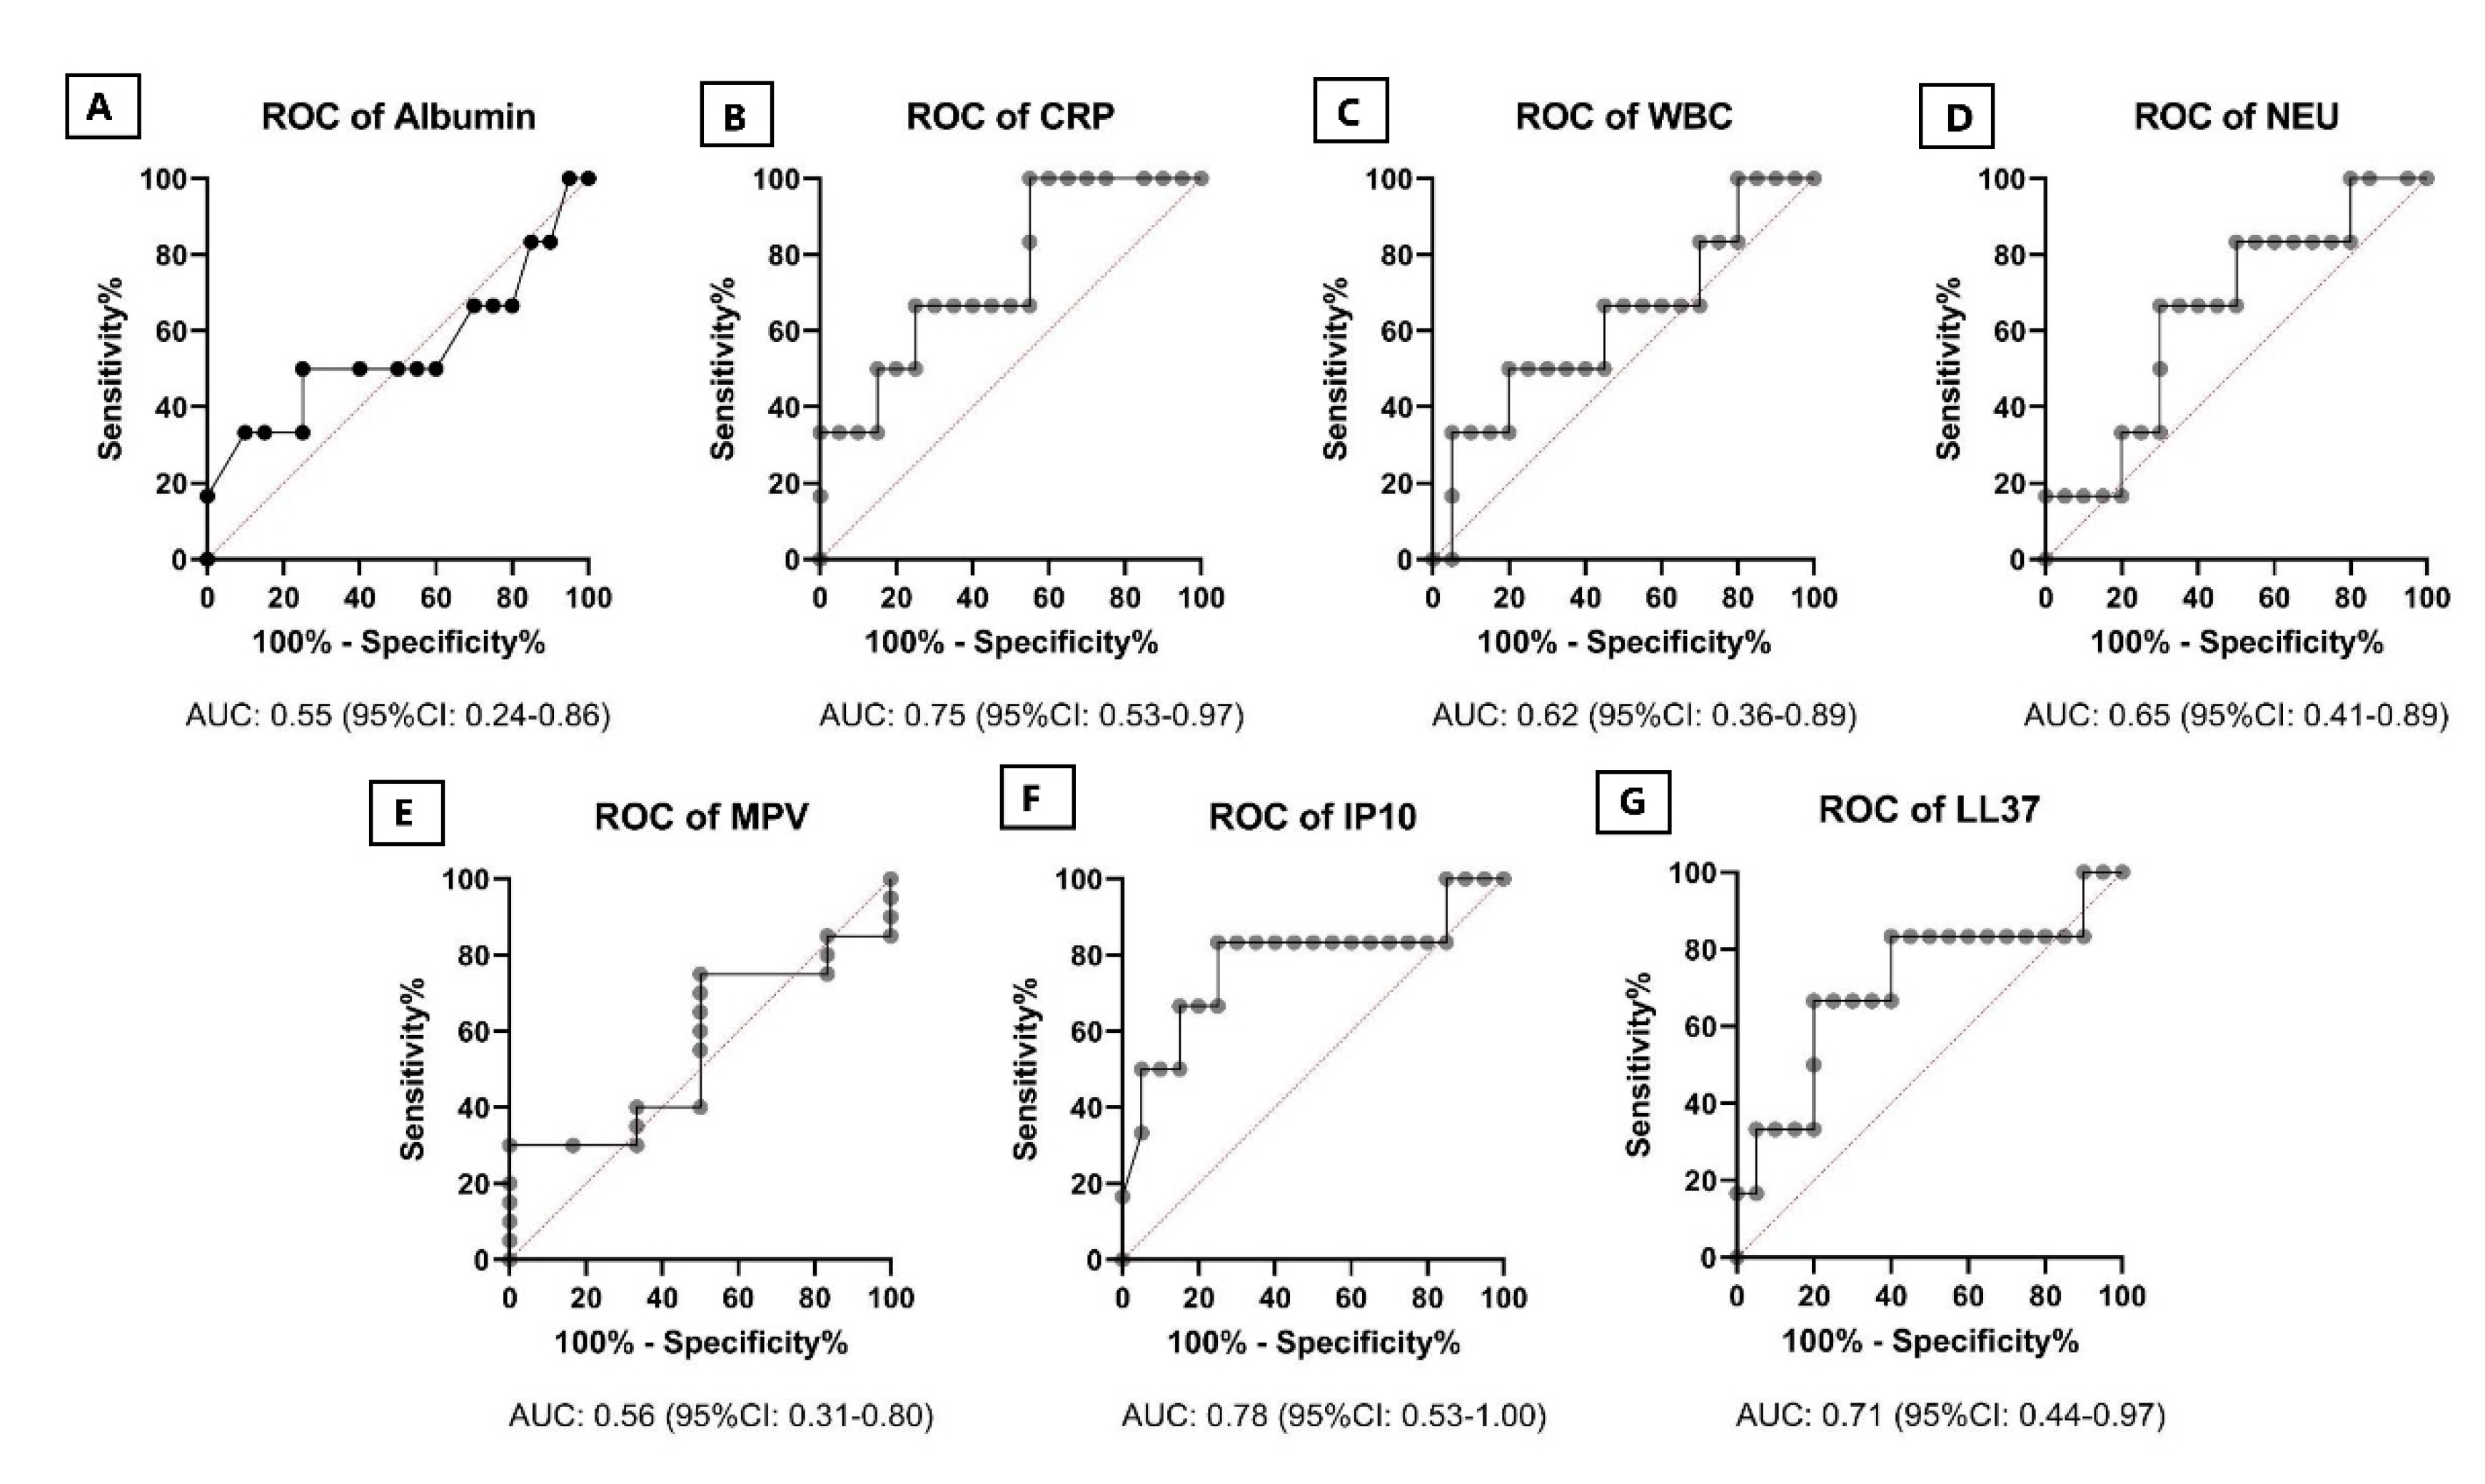
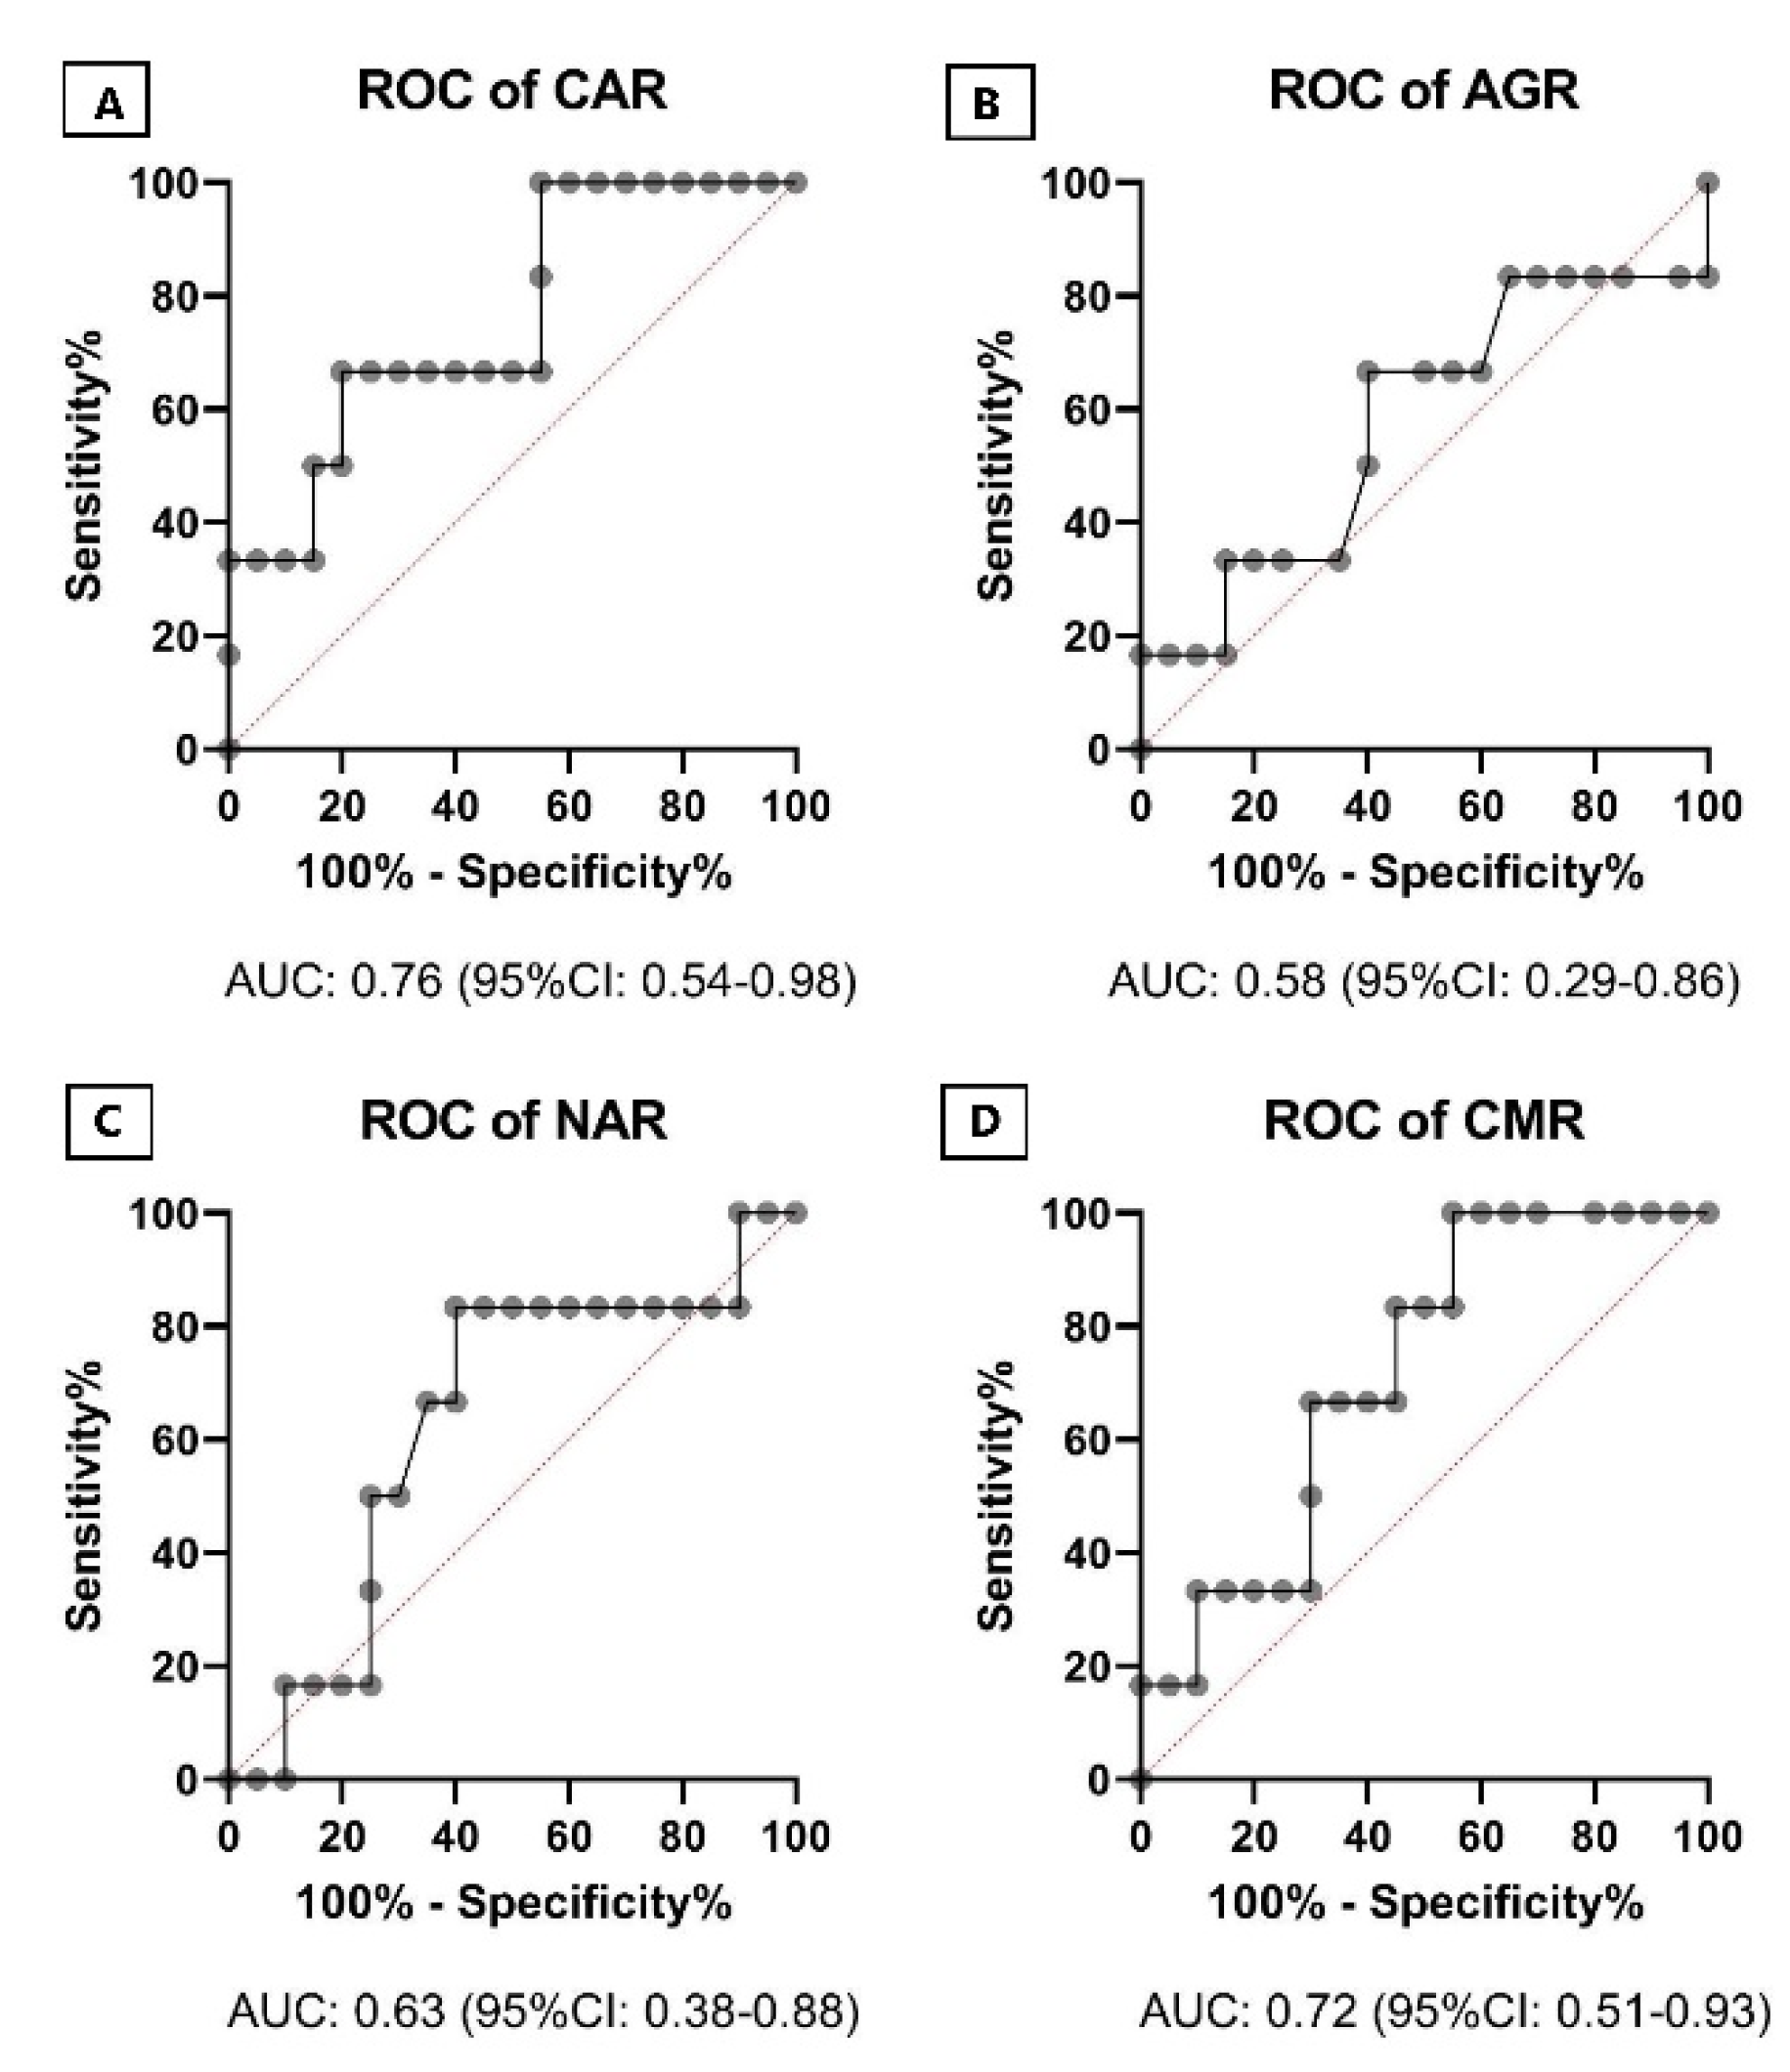
2. Results
3. Discussion
4. Materials and Methods
4.1. Study Subjects
4.2. Blood Count Measurements and Biochemical Analysis
4.3. ELISA Methods
4.3.1. IP-10 (CXCL10)
4.3.2. Human LL-37
4.4. Statistical Analysis
Supplementary Materials
Author Contributions
Funding
Institutional Review Board Statement
Informed Consent Statement
Data Availability Statement
Conflicts of Interest
References
- Sinigaglia, A.; Peta, E.; Riccetti, S.; Venkateswaran, S.; Manganelli, R.; Barzon, L. Tuberculosis-Associated MicroRNAs: From Pathogenesis to Disease Biomarkers. Cells 2020, 9, 2160. [Google Scholar] [CrossRef]
- Naidoo, C.C.; Nyawo, G.R.; Wu, B.G.; Walzl, G.; Warren, R.M.; Segal, L.N.; Theron, G. The microbiome and tuberculosis: State of the art, potential applications, and defining the clinical research agenda. Lancet Respir. Med. 2019, 7, 892–906. [Google Scholar] [CrossRef]
- World Health Organization. Compendium of WHO Guidelines and Associated Standards: Ensuing Optimum Delivery of the Cascade of Care for Patients with Tuberculosis, 2nd ed.; World Health Organization: Geneva, Switzerland, 2018. [Google Scholar]
- World Health Organization. Guidelines for Treatment of Drug-Susceptible Tuberculosis and Patient Care (2017 Update); World Health Organization: Geneva, Switzerland, 2017. [Google Scholar]
- Saleh, M.A.; van de Garde, E.M.; van Hasselt, J.C. Host-response biomarkers for the diagnosis of bacterial respiratory tract infections. Clin. Chem. Lab. Med. 2019, 57, 442–451. [Google Scholar] [CrossRef] [PubMed] [Green Version]
- Wallis, R.S.; Peppard, T.; Hermann, D. Month 2 culture status and treatment duration as predictors of recurrence in pulmonary tuberculosis: Model validation and update. PLoS ONE 2015, 10, e0125403. [Google Scholar] [CrossRef]
- Fayed, H.M.; Mohammed, A.E.; Badawy, M.S. The utility and validity of immunological, inflammatory, and nutritional-based scores and indices in active Pulmonary Tuberculosis. Int. Clin. Pathol. J. 2018, 6, 199–213. [Google Scholar]
- Gunluoglu, G.; Yazar, E.E.; Veske, N.S.; Seyhan, E.C.; Altin, S. Mean platelet volume as an inflammation marker in active pulmonary tuberculosis. Multidiscip. Respir. Med. 2014, 9, 11. [Google Scholar] [CrossRef] [PubMed] [Green Version]
- Zumla, A.; Rao, M.; Parida, S.K.; Keshavjee, S.; Cassell, G.; Wallis, R.; Axelsson-Robertsson, R.; Doherty, M.; Andersson, J.; Maeurer, M. Inflammation and tuberculosis: Host-directed therapies. J. Intern. Med. 2015, 277, 373–387. [Google Scholar] [CrossRef] [PubMed]
- Walzl, G.; Ronacher, K.; Hanekom, W.; Scriba, T.J.; Zumla, A. Immunological biomarkers of tuberculosis. Nat. Rev. Immunol. 2011, 11, 343–354. [Google Scholar] [CrossRef]
- Tenforde, M.W.; Gupte, N.; Dowdy, D.W.; Asmuth, D.M.; Balagopal, A.; Pollard, R.B.; Sugandhavesa, P.; Lama, J.R.; Pillay, S.; Cardoso, S.W.; et al. C-Reactive Protein (CRP), Interferon Gamma-Inducible Protein 10 (IP-10), and Lipopolysaccharide (LPS) Are Associated with Risk of Tuberculosis after Initiation of Antiretroviral Therapy in Resource-Limited Settings. PLoS ONE 2015, 10, e0117424. [Google Scholar] [CrossRef] [PubMed] [Green Version]
- Qiu, X.; Xiong, T.; Su, X.; Qu, Y.; Ge, L.; Yue, Y.; Zeng, Y.; Li, W.; Hu, P.; Mu, D. Accumulate evidence for IP-10 in diagnosing pulmonary tuberculosis. BMC Infect. Dis. 2019, 19, 924. [Google Scholar] [CrossRef] [Green Version]
- Lee, M.Y.; Kim, Y.J.; Lee, H.J.; Cho, S.Y.; Park, T.S. Mean platelet volume in mycobacterium tuberculosis infection. BioMed Res. Int. 2016, 2016, 7508763. [Google Scholar] [CrossRef] [PubMed] [Green Version]
- Chedid, C.; Kokhreidze, E.; Tukvadze, N.; Banu, S.; Uddin, M.K.M.; Biswas, S.; Russomando, G.; Acosta, C.C.D.; Arenas, R.; Ranaivomanana, P.P.; et al. Association of baseline white blood cell counts with tuberculosis treatment outcome: A prospective multicentered cohort study. Int. J. Infect. Dis. 2020, 100, 199–206. [Google Scholar] [CrossRef] [PubMed]
- Hong, J.Y.; Lee, H.J.; Kim, S.Y.; Chung, K.S.; Kim, E.Y.; Jung, J.Y.; Park, M.S.; Kim, Y.S.; Kim, S.K.; Chang, J.; et al. Efficacy of IP-10 as a biomarker for monitoring tuberculosis treatment. J. Infect. 2014, 68, 252–258. [Google Scholar] [CrossRef]
- Wang, S.; Diao, N.; Lu, C.; Wu, J.; Gao, Y.; Chen, J.; Zhou, Z.; Huang, H.; Shao, L.; Jin, J.; et al. Evaluation of the diagnostic potential of IP-10 and IL-2 as biomarkers for the diagnosis of active and latent tuberculosis in a BCG-vaccinated population. PLoS ONE 2012, 7, e51338. [Google Scholar] [CrossRef] [PubMed]
- Bongiovanni, B.; Marín-Luevano, S.; D’Attilio, L.; Díaz, A.; del Valle Fernández, R.; Santucci, N.; Bértola, D.; Bay, M.L.; Rivas-Santiago, B.; Bottasso, O. Evidence that changes in antimicrobial peptides during tuberculosis are related to disease severity, clinical presentation, specific therapy and levels of immune-endocrine mediators. Cytokine 2020, 126, 154913. [Google Scholar] [CrossRef] [PubMed]
- Oliveira, G.S.; Costa, R.P.; Gomes, P.; Gomes, M.S.; Silva, T.; Teixeira, C. Antimicrobial Peptides as Potential Anti-Tubercular Leads: A Concise Review. Pharmaceuticals 2021, 14, 323. [Google Scholar] [CrossRef] [PubMed]
- Rivas-Santiago, B.; Santiago, C.E.R.; Castañeda-Delgado, J.E.; León–Contreras, J.C.; Hancock, R.E.; Hernandez-Pando, R. 2013 Activity of LL-37, CRAMP and antimicrobial peptide-derived compounds E2, E6 and CP26 against Mycobacterium tuberculosis. Int. J. Antimicrob. Agents 2013, 41, 143–148. [Google Scholar] [CrossRef]
- Zhan, Y.; Jiang, L. Status of vitamin D, antimicrobial peptide cathelicidin and T helper-associated cytokines in patients with diabetes mellitus and pulmonary tuberculosis. Exp. Ther. Med. 2015, 9, 11–16. [Google Scholar] [CrossRef] [Green Version]
- Farr, K.; Ravindran, R.; Strnad, L.; Chang, E.; Chaisson, L.H.; Yoon, C.; Worodria, W.; Andama, A.; Ayakaka, I.; Bbosa Nalwanga, P.; et al. Diagnostic performance of blood inflammatory markers for tuberculosis screening in people living with HIV. PLoS ONE 2018, 13, e0206119. [Google Scholar]
- Petruccioli, E.; Scriba, T.J.; Petrone, L.; Hatherill, M.; Cirillo, D.M.; Joosten, S.A.; Ottenhoff, T.H.; Denkinger, C.M.; Goletti, D. Correlates of tuberculosis risk: Predictive biomarkers for progression to active tuberculosis. Eur. Respir. J. 2016, 48, 1751–1763. [Google Scholar] [CrossRef] [Green Version]
- Wilson, D.; Moosa, M.Y.S.; Cohen, T.; Cudahy, P.; Aldous, C.; Maartens, G. Evaluation of tuberculosis treatment response with serial C-reactive protein measurements. Open Forum Infect. Dis. 2018, 5, ofy253. [Google Scholar] [CrossRef] [Green Version]
- Azzurri, A.; Sow, O.Y.; Amedei, A.; Bah, B.; Diallo, S.; Peri, G.; Benagiano, M.; D’Elios, M.M.; Mantovani, A.; Del Prete, G. IFN-γ-inducible protein 10 and pentraxin 3 plasma levels are tools for monitoring inflammation and disease activity in Mycobacterium tuberculosis infection. Microbes Infect. 2005, 7, 1–8. [Google Scholar] [CrossRef]
- Ferrian, S.; Manca, C.; Lubbe, S.; Conradie, F.; Ismail, N.; Kaplan, G.; Gray, C.M.; Fallows, D. A combination of baseline plasma immune markers can predict therapeutic response in multidrug resistant tuberculosis. PLoS ONE 2017, 12, e0176660. [Google Scholar] [CrossRef] [PubMed]
- Chendi, B.H.; Snyders, C.I.; Tonby, K.; Jenum, S.; Kidd, M.; Walzl, G.; Chegou, N.N.; Dyrhol-Riise, A.M. A Plasma 5-Marker Host Biosignature Identifies Tuberculosis in High and Low Endemic Countries. Front. Immunol. 2021, 12, 437. [Google Scholar] [CrossRef] [PubMed]
- Bozkaya, Y.; Erdem, G.U.; Demirci, N.S.; Yazıcı, O.; Özdemir, N.Y.; Köstek, O.; Zengin, N. Prognostic importance of the albumin to globulin ratio in metastatic gastric cancer patients. Curr. Med. Res. Opin. 2019, 35, 275–282. [Google Scholar] [CrossRef] [PubMed]
- Park, J.; Kim, H.J.; Kim, J.; Choi, Y.B.; Shin, Y.S.; Lee, M.J. Predictive value of serum albumin-to-globulin ratio for incident chronic kidney disease: A 12-year community-based prospective study. PLoS ONE 2020, 15, e0238421. [Google Scholar] [CrossRef] [PubMed]
- Tanriverdi, Z.; Gungoren, F.; Tascanov, M.B.; Besli, F.; Altiparmak, I.H. Comparing the diagnostic value of the C-reactive protein to albumin ratio with other inflammatory markers in patients with stable angina pectoris. Angiology 2020, 71, 360–365. [Google Scholar] [CrossRef]
- Llop-Talaveron, J.; Badia-Tahull, M.B.; Leiva-Badosa, E. An inflammation-based prognostic score, the C-reactive protein/albumin ratio predicts the morbidity and mortality of patients on parenteral nutrition. Clin. Nutr. 2018, 37, 1575–1583. [Google Scholar] [CrossRef] [PubMed]
- Wang, R.; He, M.; Ou, X.; Xie, X.; Kang, Y. CRP Albumin ratio is positively associated with poor outcome in patients with traumatic brain injury. Clin. Neurol. Neurosurg. 2020, 195, 106051. [Google Scholar] [CrossRef]
- Suh, B.; Park, S.; Shin, D.W.; Yun, J.M.; Keam, B.; Yang, H.K.; Ahn, E.; Lee, H.; Park, J.H.; Cho, B. Low albumin-to-globulin ratio associated with cancer incidence and mortality in generally healthy adults. Ann. Oncol. 2014, 25, 2260–2266. [Google Scholar] [CrossRef]
- Abakay, O.; Abakay, A.; Sen, H.S.; Tanrikulu, A.C. The relationship between inflammatory marker levels and pulmonary tuberculosis severity. Inflammation 2015, 38, 691–696. [Google Scholar] [CrossRef]
- Thomsen, M.; Ingebrigtsen, T.S.; Marott, J.L.; Dahl, M.; Lange, P.; Vestbo, J.; Nordestgaard, B.G. Inflammatory biomarkers and exacerbations in chronic obstructive pulmonary disease. JAMA 2013, 309, 2353–2361. [Google Scholar] [CrossRef] [PubMed] [Green Version]
- Holtz, T.H.; Sternberg, M.; Kammerer, S.; Laserson, K.F.; Riekstina, V.; Zarovska, E.; Skripconoka, V.; Wells, C.D.; Leimane, V. Time to sputum culture conversion in multidrug-resistant tuberculosis: Predictors and relationship to treatment outcome. Ann. Intern. Med. 2006, 144, 650–659. [Google Scholar] [CrossRef]
- Wallis, R.S.; Wang, C.; Doherty, T.M.; Onyebujoh, P.; Vahedi, M.; Laang, H.; Olesen, O.; Parida, S.; Zumla, A. Biomarkers for tuberculosis disease activity, cure, and relapse. Lancet Infect. Dis. 2010, 10, 68–69. [Google Scholar] [CrossRef]
- Sigal, G.B.; Segal, M.R.; Mathew, A.; Jarlsberg, L.; Wang, M.; Barbero, S.; Small, N.; Haynesworth, K.; Davis, J.L.; Weiner, M.; et al. Biomarkers of tuberculosis severity and treatment effect: A directed screen of 70 host markers in a randomized clinical trial. EBioMedicine 2017, 25, 112–121. [Google Scholar] [CrossRef] [PubMed] [Green Version]
- Jayakumar, A.; Vittinghoff, E.; Segal, M.R.; MacKenzie, W.R.; Johnson, J.L.; Gitta, P.; Saukkonen, J.; Anderson, J.; Weiner, M.; Engle, M.; et al. Serum biomarkers of treatment response within a randomized clinical trial for pulmonary tuberculosis. Tuberculosis 2015, 95, 415–420. [Google Scholar] [CrossRef] [Green Version]
- Huang, C.T.; Lee, L.N.; Ho, C.C.; Shu, C.C.; Ruan, S.Y.; Tsai, Y.J.; Wang, J.Y.; Yu, C.J. High serum levels of procalcitonin and soluble TREM-1 correlated with poor prognosis in pulmonary tuberculosis. J. Infect. 2014, 68, 440–447. [Google Scholar] [CrossRef] [Green Version]
- Mesquita, E.D.; Gil-Santana, L.; Ramalho, D.; Tonomura, E.; Silva, E.C.; Oliveira, M.M.; Andrade, B.B.; Kritski, A. Associations between systemic inflammation, mycobacterial loads in sputum and radiological improvement after treatment initiation in pulmonary TB patients from Brazil: A prospective cohort study. BMC Infect. Dis. 2016, 16, 368. [Google Scholar] [CrossRef] [Green Version]
- Ştefanescu, S.; Cocoş, R.; Turcu-Stiolica, A.; Mahler, B.; Meca, A.D.; Giura, A.M.C.; Bogdan, M.; Shelby, E.S.; Zamfirescu, G.; Pisoschi, C.G. Evaluation of prognostic significance of hematological profiles after the intensive phase treatment in pulmonary tuberculosis patients from Romania. PLoS ONE 2021, 16, e0249301. [Google Scholar] [CrossRef]
- Gil-Santana, L.; Cruz, L.A.; Arriaga, M.B.; Miranda, P.F.; Fukutani, K.F.; Silveira-Mattos, P.S.; Silva, E.C.; Oliveira, M.G.; Mesquita, E.D.; Rauwerdink, A.; et al. Tuberculosis-associated anemia is linked to a distinct inflammatory profile that persists after initiation of antitubercular therapy. Sci. Rep. 2019, 9, 1381. [Google Scholar] [CrossRef] [Green Version]
- Cannas, A.; Calvo, L.; Chiacchio, T.; Cuzzi, G.; Vanini, V.; Lauria, F.N.; Pucci, L.; Girardi, E.; Goletti, D. IP-10 detection in urine is associated with lung diseases. BMC Infect. Dis. 2010, 10, 333. [Google Scholar] [CrossRef] [Green Version]
- Teng, T.; Liu, J.; Wei, H. Anti-mycobacterial peptides: From human to phage. Cell. Physiol. Biochem. 2015, 35, 452–466. [Google Scholar] [CrossRef]
- Yamshchikov, A.V.; Kurbatova, E.V.; Kumari, M.; Blumberg, H.M.; Ziegler, T.R.; Ray, S.M.; Tangpricha, V. Vitamin D status and antimicrobial peptide cathelicidin (LL-37) concentrations in patients with active pulmonary tuberculosis. Am. J. Clin. Nutr. 2010, 92, 603–611. [Google Scholar] [CrossRef] [Green Version]
- Comella-del-Barrio, P.; Abellana, R.; Villar-Hernández, R.; Jean Coute, M.D.; Sallés Mingels, B.; Canales Aliaga, L.; Narcisse, M.; Gautier, J.; Ascaso, C.; Latorre, I.; et al. A model based on the combination of IFN-γ, IP-10, ferritin and 25-hydroxyvitamin D for discriminating latent from active tuberculosis in children. Front. Microbiol. 2019, 10, 1855. [Google Scholar] [CrossRef] [Green Version]
- Rakotosamimanana, N.; Richard, V.; Raharimanga, V.; Gicquel, B.; Doherty, T.M.; Zumla, A.; Razanamparany, V.R. Biomarkers for risk of developing active tuberculosis in contacts of TB patients: A prospective cohort study. Eur. Respir. J. 2015, 46, 1095–1103. [Google Scholar] [CrossRef]
- Morris, C.D.; Bird, A.R.; Nell, H. The haematological and biochemical changes in severe pulmonary tuberculosis. QJM Int. J. Med. 1989, 73, 1151–1159. [Google Scholar]
- Amilo, G.I.; Meludu, S.C.; Ele, P.U.; Ezechukwu, C.; Onyenekwe, C.; Chukwu, M.I. Haematologic indices in pulmonary tuberculosis with or without HV Co-infection in South Eastern Nigeria. Adv. Life Sci. Technol. 2013, 11, 1–7. [Google Scholar]
- Kassa, E.; Enawgaw, B.; Gelaw, A.; Gelaw, B. Effect of anti-tuberculosis drugs on hematological profiles of tuberculosis patients attending at University of Gondar Hospital, Northwest Ethiopia. BMC Hematol. 2016, 16, 1. [Google Scholar] [CrossRef] [Green Version]
- Gurol, G.; Ciftci, I.H.; Terzi, H.A.; Atasoy, A.R.; Ozbek, A.; Koroglu, M. Are there standardized cutoff values for neutrophil-lymphocyte ratios in bacteremia or sepsis? J. Microbiol. Biotechnol. 2015, 25, 521–525. [Google Scholar] [CrossRef] [Green Version]
- Srivastava, S.; Ernst, J.D.; Desvignes, L. Beyond macrophages: The diversity of mononuclear cells in tuberculosis. Immunol. Rev. 2014, 262, 179–192. [Google Scholar] [CrossRef] [Green Version]
- Hilda, J.N.; Das, S.; Tripathy, S.P.; Hanna, L.E. Role of neutrophils in tuberculosis: A bird’s eye view. Innate Immun. 2020, 26, 240–247. [Google Scholar] [CrossRef] [PubMed]
- Han, Z.; He, X.; Peng, S. Neutrophil count to albumin ratio as a prognostic indicator for HBV-associated decompensated cirrhosis. J. Clin. Lab. Anal. 2021, 35, e23730. [Google Scholar] [CrossRef]
- Peng, Y.; Xue, Y.; Wang, J.; Xiang, H.; Ji, K.; Wang, J.; Lin, C. Association between neutrophil-to-albumin ratio and mortality in patients with cardiogenic shock: A retrospective cohort study. BMJ Open 2020, 10, e039860. [Google Scholar] [CrossRef] [PubMed]
- Ye, Y.; Chen, W.; Gu, M.; Xian, G.; Pan, B.; Zheng, L.; Zhang, Z.; Sheng, P. Serum globulin and albumin to globulin ratio as potential diagnostic biomarkers for periprosthetic joint infection: A retrospective review. J. Orthop. Surg. Res. 2020, 15, 459. [Google Scholar] [CrossRef]
- Asher, V.; Lee, J.; Bali, A. Preoperative serum albumin is an independent prognostic predictor of survival in ovarian cancer. Med. Oncol. 2012, 29, 2005–2009. [Google Scholar] [CrossRef] [PubMed]
- Guthrie, G.J.K.; Roxburgh, C.S.D.; Farhan-Alanie, O.M.; Horgan, P.G.; McMillan, D.C. Comparison of the prognostic value of longitudinal measurements of systemic inflammation in patients undergoing curative resection of colorectal cancer. Br. J. Cancer 2013, 109, 24–28. [Google Scholar] [CrossRef] [Green Version]
- Okolie, C. Serum Albumin/Globulin ratio in Tuberculosis and HIV Patients any Relationship? Mycobact. Dis. 2016, 6, 199. [Google Scholar]
- Tsai, C.C.; Hsieh, Y.P.; Tsai, S.M.; Kor, C.T.; Chiu, P.F. Superiority of albumin–globulin ratio over albumin to predict mortality in patients undergoing peritoneal dialysis. Sci. Rep. 2020, 10, 19764. [Google Scholar] [CrossRef]
- Park, J.E.; Chung, K.S.; Song, J.H.; Kim, S.Y.; Kim, E.Y.; Jung, J.Y.; Kang, Y.; Park, M.S.; Kim, Y.S.; Chang, J.; et al. The C-reactive protein/albumin ratio as a predictor of mortality in critically ill patients. J. Clin. Med. 2018, 7, 333. [Google Scholar] [CrossRef] [Green Version]
- Kapsoritakis, A.N.; Koukourakis, M.I.; Sfiridaki, A.; Potamianos, S.P.; Kosmadaki, M.G.; Koutroubakis, I.E.; Kouroumalis, E.A. Mean platelet volume: A useful marker of inflammatory bowel disease activity. Am. J. Gastroenterol. 2001, 96, 776–781. [Google Scholar] [CrossRef]
- Purnak, T.; Olmez, S.; Torun, S.; Efe, C.; Sayilir, A.; Ozaslan, E.; Tenlik, I.; Kalkan, I.H.; Beyazit, Y.; Yuksel, O. Mean platelet volume is increased in chronic hepatitis C patients with advanced fibrosis. Clin. Res. Hepatol. Gastroenterol. 2013, 37, 41–46. [Google Scholar] [CrossRef]
- Tozkoparan, E.; Deniz, O.; Ucar, E.; Bilgic, H.; Ekiz, K. Changes in platelet count and indices in pulmonary tuberculosis. Clin. Chem. Lab. Med. 2007, 45, 1009–1013. [Google Scholar] [CrossRef]
- Averbakh, M.M.; Ergeshow, A. Interaction between Mycobacterium tuberculosis and Human Host: Role of Cytokines in Pathogenesis and Treatment Monitoring. Tuberculosis 2018, 93. [Google Scholar] [CrossRef] [Green Version]
- Chen, Y.C.; Chin, C.H.; Liu, S.F.; Wu, C.C.; Tsen, C.C.; Wang, Y.H.; Chao, T.Y.; Lie, C.H.; Chen, C.J.; Wang, C.C.; et al. Prognostic values of serum IP-10 and IL-17 in patients with pulmonary tuberculosis. Dis. Markers 2011, 31, 101–110. [Google Scholar] [CrossRef]
- Tonby, K.; Ruhwald, M.; Kvale, D.; Dyrhol-Riise, A.M. IP-10 measured by Dry Plasma Spots as biomarker for therapy responses in Mycobacterium Tuberculosis infection. Sci. Rep. 2015, 5, 9223. [Google Scholar] [CrossRef] [PubMed] [Green Version]
- Ruhwald, M.; Aabye, M.G.; Ravn, P. IP-10 release assays in the diagnosis of tuberculosis infection: Current status and future directions. Expert Rev. Mol. Diagn. 2012, 12, 175–187. [Google Scholar] [CrossRef] [PubMed] [Green Version]
- García-Basteiro, A.L.; Mambuque, E.; den Hertog, A.; Saavedra, B.; Cuamba, I.; Oliveras, L.; Blanco, S.; Bulo, H.; Brew, J.; Cuevas, L.E.; et al. IP-10 kinetics in the first week of therapy are strongly associated with bacteriological confirmation of tuberculosis diagnosis in HIV-infected patients. Sci. Rep. 2017, 7, 14302. [Google Scholar] [CrossRef] [Green Version]
- Kabeer, B.S.A.; Raja, A.; Raman, B.; Thangaraj, S.; Leportier, M.; Ippolito, G.; Girardi, E.; Lagrange, P.H.; Goletti, D. IP-10 response to RD1 antigens might be a useful biomarker for monitoring tuberculosis therapy. BMC Infect. Dis. 2011, 11, 135. [Google Scholar] [CrossRef] [Green Version]
- Santos, V.S.; Goletti, D.; Kontogianni, K.; Adams, E.R.; Molina-Moya, B.; Dominguez, J.; Crudu, V.; Martins-Filho, P.R.; Ruhwald, M.; Lawson, L.; et al. Acute phase proteins and IP-10 as triage tests for the diagnosis of tuberculosis: Systematic review and meta-analysis. Clin. Microbiol. Infect. 2019, 25, 169–177. [Google Scholar] [CrossRef] [PubMed] [Green Version]
- Goletti, D.; Raja, A.; Kabeer, B.S.A.; Rodrigues, C.; Sodha, A.; Butera, O.; Carrara, S.; Vernet, G.; Longuet, C.; Ippolito, G.; et al. IFN-γ, but not IP-10, MCP-2 or IL-2 response to RD1 selected peptides associates to active tuberculosis. J. Infect. 2010, 61, 133–143. [Google Scholar] [CrossRef] [PubMed]
- Ruhwald, M.; Bodmer, T.; Maier, C.; Jepsen, M.; Haaland, M.B.; Eugen-Olsen, J.; Ravn, P. Evaluating the potential of IP-10 and MCP-2 as biomarkers for the diagnosis of tuberculosis. Eur. Respir. J. 2008, 32, 1607–1615. [Google Scholar] [CrossRef] [PubMed] [Green Version]
- Kim, S.Y.; Kim, J.; Kim, D.R.; Kang, Y.A.; Bong, S.; Lee, J.; Kim, S.; Lee, N.S.; Sim, B.; Cho, S.N.; et al. Urine IP-10 as a biomarker of therapeutic response in patients with active pulmonary tuberculosis. BMC Infect. Dis. 2018, 18, 240. [Google Scholar] [CrossRef]
- Mihret, A.; Bekele, Y.; Bobosha, K.; Kidd, M.; Aseffa, A.; Howe, R.; Walzl, G. Plasma cytokines and chemokines differentiate between active disease and non-active tuberculosis infection. J. Infect. 2013, 66, 357–365. [Google Scholar] [CrossRef] [PubMed]
- Gonzalez-Curiel, I.; Castañeda-Delgado, J.; Lopez-Lopez, N.; Araujo, Z.; Hernandez-Pando, R.; Gandara-Jasso, B.; Macias-Segura, N.; Enciso-Moreno, A.; Rivas-Santiago, B. Differential expression of antimicrobial peptides in active and latent tuberculosis and its relationship with diabetes mellitus. Hum. Immunol. 2011, 72, 656–662. [Google Scholar] [CrossRef] [PubMed]
- Torres-Juarez, F.; Cardenas-Vargas, A.; Montoya-Rosales, A.; González-Curiel, I.; Garcia-Hernandez, M.H.; Enciso-Moreno, J.A.; Hancock, R.; Rivas-Santiago, B. LL-37 Immunomodulatory Activity during Mycobacterium tuberculosis Infection in Macrophages. Infect. Immun. 2015, 83, 4495–4503. [Google Scholar] [CrossRef] [PubMed] [Green Version]
- Yang, B.; Good, D.; Mosaiab, T.; Liu, W.; Ni, G.; Kaur, J.; Liu, X.; Jessop, C.; Yang, L.; Fadhil, R.; et al. Significance of LL-37 on immunomodulation and disease outcome. BioMed Res. Int. 2020, 2020, 8349712. [Google Scholar]
- Majewski, K.; Agier, J.; Kozłowska, E.; Brzezińska-Błaszczyk, E. Serum level of cathelicidin LL-37 in patients with active tuberculosis and other infectious diseases. J. Biol. Regul. Homeost. Agents 2017, 31, 731–736. [Google Scholar]
- Liu, Q.; Lu, P.; Martinez, L.; Yang, H.; Lu, W.; Ding, X.; Zhu, L. Factors affecting time to sputum culture conversion and treatment outcome of patients with multidrug-resistant tuberculosis in China. BMC Infect. Dis. 2018, 18, 114. [Google Scholar] [CrossRef] [Green Version]
- Kayigamba, F.R.; Bakker, M.I.; Mugisha, V.; Gasana, M.; van der Loeff, M.F.S. Sputum completion and conversion rates after intensive phase of tuberculosis treatment: An assessment of the Rwandan control program. BMC Res. Notes 2012, 5, 357. [Google Scholar] [CrossRef] [Green Version]
- D’Souza, K.A.; Zaidi, S.M.; Jaswal, M.; Butt, S.; Khowaja, S.; Habib, S.S.; Malik, A.A. Factors associated with month 2 smear non-conversion among Category 1 tuberculosis patients in Karachi, Pakistan. J. Infect. Public Health 2018, 11, 283–285. [Google Scholar] [CrossRef]
- Cox, H.S.; Kalon, S.; Allamuratova, S.; Sizaire, V.; Tigay, Z.N.; Rüsch-Gerdes, S.; Karimovich, H.A.; Kebede, Y.; Mills, C. Multidrug-resistant tuberculosis treatment outcomes in Karakalpakstan, Uzbekistan: Treatment complexity and XDR-TB among treatment failures. PLoS ONE 2007, 2, e1126. [Google Scholar] [CrossRef] [PubMed] [Green Version]
- Pefura-Yone, E.W.; Kengne, A.P.; Kuaban, C. Non-conversion of sputum culture among patients with smear positive pulmonary tuberculosis in Cameroon: A prospective cohort study. BMC Infect. Dis. 2014, 14, 138. [Google Scholar] [CrossRef] [PubMed] [Green Version]


| Characteristics | Total (n = 26) | Positive Culture (n = 6) | Negative Culture (n = 20) | p-Value |
|---|---|---|---|---|
| Age (years) | 47.85 ± 8.98 | 48.17 ± 9.5 | 47.75 ± 9.1 | 0.9649 |
| Gender Female Male | 3 (12%) 23 (88%) | 1 (3.8%) 5 (19.2%) | 2 (7.7%) 18 (69.2%) | >0.99 |
| Living environment Urban Rural | 6 (24%) 20 (76%) | 1 (3.8%) 5 (19.2%) | 5 (19.2%) 15 (57.7%) | >0.99 |
| Educational level Low Middle | 2 (8%) 24 (92%) | 1 (3.8%) 5 (19.2%) | 1 (3.8%) 19 (73.1%) | 0.4154 |
| Smoker Yes No | 18 (69%) 8 (31%) | 4 (15.4%) 2 (7.7%) | 14 (53.8%) 6 (23.1%) | >0.99 |
| Alcohol Yes No | 3 (12%) 23 (88%) | 0 6 (23.1%) | 3 (11.5%) 17 (65.4%) | >0.99 |
| Biomarkers | T0 (n = 20) | T2 (n = 20) | p-Value |
|---|---|---|---|
| Albumin (g/dL) | 3.64 ± 0.54 | 3.94 ± 0.45 | 0.0596 |
| CAR | 12.87 ± 12.08 | 5.27 ± 5.22 | 0.0263 * |
| AGR | 1.04 ± 0.27 | 1.11 ± 0.24 | 0.2336 |
| NAR | 2.10 ± 1.20 | 1.33 ± 0.54 | 0.0020 *** |
| CMR | 7.08 ± 7.3 | 3.77 ± 3.92 | 0.0898 |
| CRP (mg/L) | 43.06 ± 38.68 | 19.18 ± 17.67 | 0.0268 * |
| WBC | 10.20 ± 2.99 | 8.18 ± 1.91 | 0.0181 * |
| NEU (103/uL) | 7.28 ± 2.96 | 5.10 ± 1.75 | 0.0061 * |
| MPV (fL) | 6.62 ± 1.21 | 6.02 ± 1.49 | 0.1510 |
| IP10 | 382.9 ± 97.26 | 294.1 ± 108.4 | 0.0080 ** |
| LL37 | 42.26 ± 30.98 | 34.10 ± 27.34 | 0.1918 |
| T2-T0 | Positive Culture (n = 6) | Negative Culture (n = 20) | p-Value |
|---|---|---|---|
| Albumin (g/dL) | 0.65 ± 0.6 | 0.29 ± 0.28 | 0.1649 |
| CAR | −7.1 ± 15.69 | −7.6 ± 8.83 | 0.2425 |
| AGR | 0.2 ± 0.28 | 0.07 ± 0.12 | 0.5620 |
| NAR | −0.64 ± 0.57 | −0.77 ± 1.01 | 0.8937 |
| CMR | −1.89 ± 5.77 | −3.32 ± 5.69 | 0.2816 |
| CRP (mg/L) | −12.61 ± 38.99 | −23.88 ± 28.88 | 0.0459 * |
| WBC (109/L) | −0.9 ± 1.06 | −2.02 ± 2.34 | 0.2681 |
| NEU (109/L) | −0.89 ± 1.03 | −2.18 ± 2.49 | 0.3006 |
| MPV (fL) | −0.13 ± 0.27 | −0.6 ± 1.4 | 0.2362 |
| IP10 (pg/mL) | 23.42 ± 40.65 | −88.83 ± 77.5 | 0.0006 *** |
| LL37 (ng/mL) | 1.68 ± 12.9 | −8.17 ± 22.84 | 0.0702 |
| Age | Albumin | CAR | AGR | NAR | CMR | CRP | WBC | NEU | MPV | IP10 | LL-37 | |
|---|---|---|---|---|---|---|---|---|---|---|---|---|
| Age | 1 | −0.31 | 0.22 | 0.01 | 0.18 | 0.25 | 0.21 | 0.08 | 0.04 | -0.23 | 0.10 | −0.27 |
| Albumin | 1 | −0.71 | 0.73 | −0.52 | −0.63 | −0.67 | −0.17 | −0.29 | 0.23 | −0.69 | 0.39 | |
| CAR | 1 | −0.6 | 0.7 | 0.96 | 0.99 | 0.48 | 0.56 | −0.40 | 0.77 | −0.13 | ||
| AGR | 1 | −0.51 | −0.59 | −0.58 | −0.30 | −0.37 | 0.32 | −0.51 | 0.50 | |||
| NAR | 1 | 0.72 | 0.68 | 0.88 | 0.95 | −0.44 | 0.66 | −0.39 | ||||
| CMR | 1 | 0.97 | 0.53 | 0.6 | −0.58 | 0.71 | −0.24 | |||||
| CRP | 1 | 0.48 | 0.55 | −0.42 | 0.76 | −0.12 | ||||||
| WBC | 1 | 0.93 | −0.32 | 0.41 | −0.25 | |||||||
| NEU | 1 | −0.40 | 0.53 | −0.27 | ||||||||
| MPV | 1 | −0.20 | 0.59 | |||||||||
| IP10 | 1 | −0.14 | ||||||||||
| LL-37 | 1 |
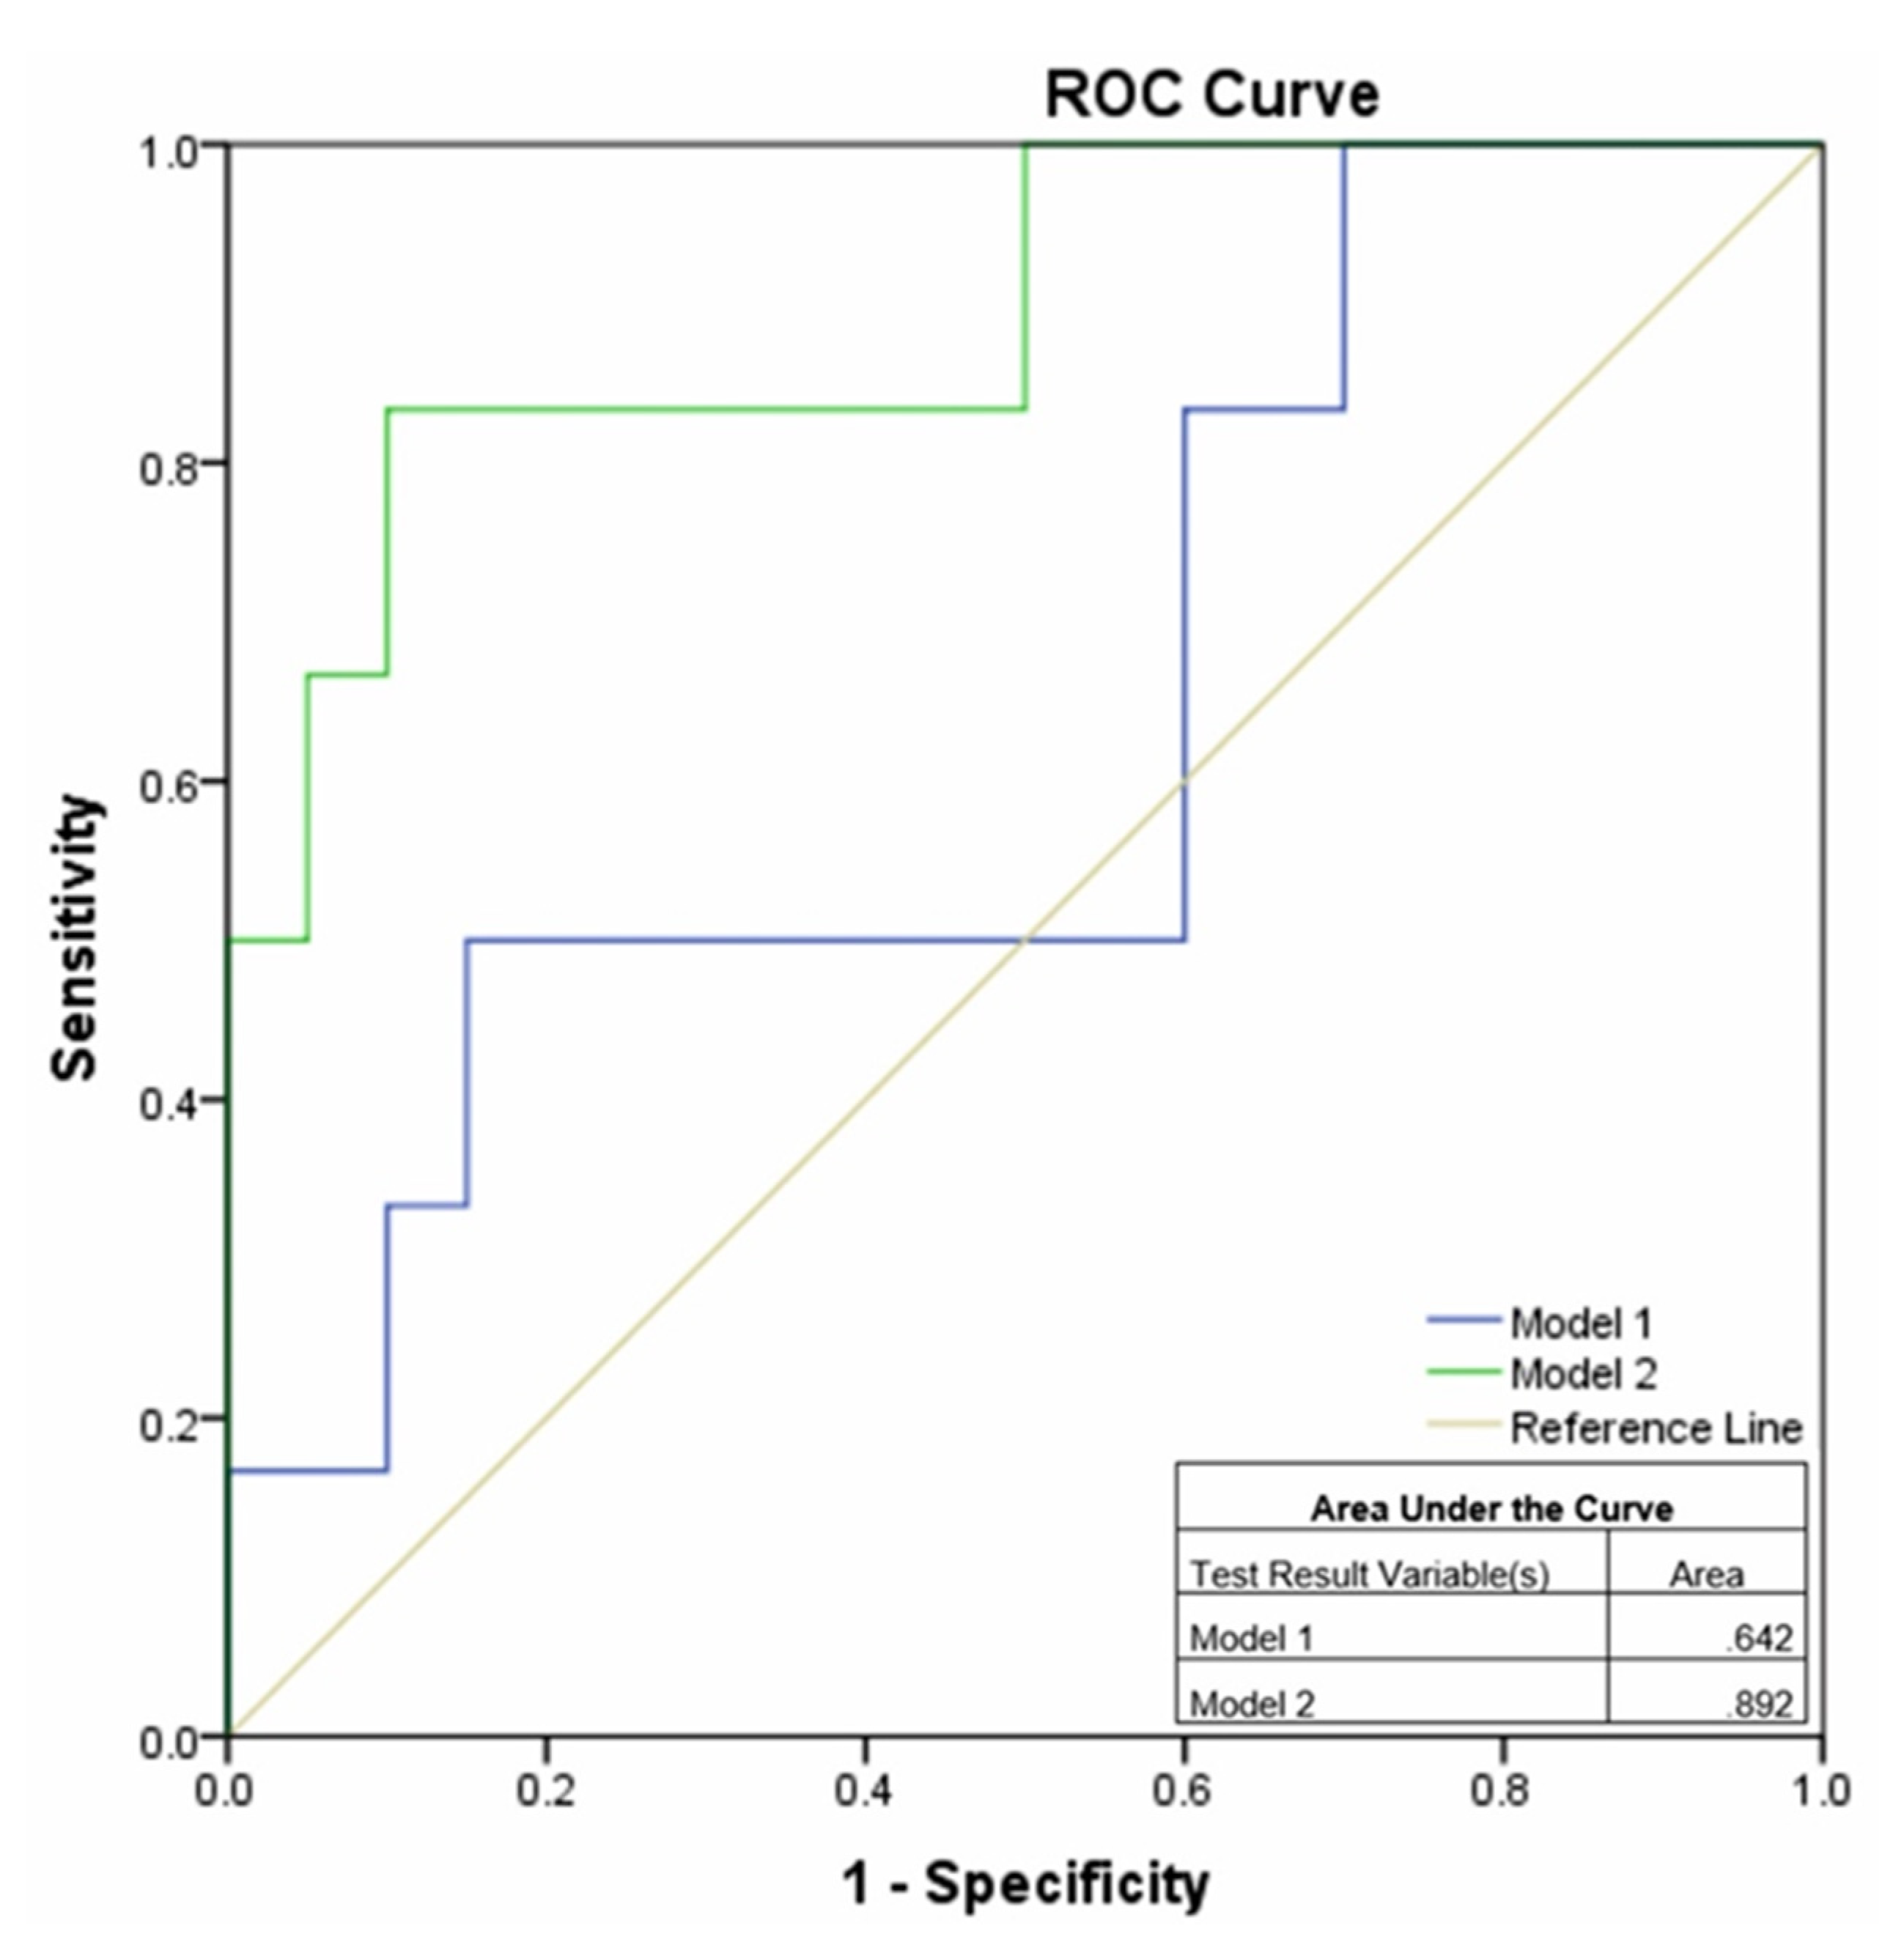
| Model | Predictors | AUC, 95% CI | p-Value |
|---|---|---|---|
| Model 1 | Albumin, AGR, LL37, MPV | 0.642 0.381–0.902 | 0.301 |
| Model 2 | WBC, NAR, NEU, CAR, CMR, CRP, IP10 | 0.892 0.732–1.0 | 0.004 |
Publisher’s Note: MDPI stays neutral with regard to jurisdictional claims in published maps and institutional affiliations. |
© 2021 by the authors. Licensee MDPI, Basel, Switzerland. This article is an open access article distributed under the terms and conditions of the Creative Commons Attribution (CC BY) license (https://creativecommons.org/licenses/by/4.0/).
Share and Cite
Stefanescu, S.; Cocoș, R.; Turcu-Stiolica, A.; Shelby, E.-S.; Matei, M.; Subtirelu, M.-S.; Meca, A.-D.; Stanciulescu, E.C.; Popescu, S.O.; Biciusca, V.; et al. Prediction of Treatment Outcome with Inflammatory Biomarkers after 2 Months of Therapy in Pulmonary Tuberculosis Patients: Preliminary Results. Pathogens 2021, 10, 789. https://doi.org/10.3390/pathogens10070789
Stefanescu S, Cocoș R, Turcu-Stiolica A, Shelby E-S, Matei M, Subtirelu M-S, Meca A-D, Stanciulescu EC, Popescu SO, Biciusca V, et al. Prediction of Treatment Outcome with Inflammatory Biomarkers after 2 Months of Therapy in Pulmonary Tuberculosis Patients: Preliminary Results. Pathogens. 2021; 10(7):789. https://doi.org/10.3390/pathogens10070789
Chicago/Turabian StyleStefanescu, Simona, Relu Cocoș, Adina Turcu-Stiolica, Elena-Silvia Shelby, Marius Matei, Mihaela-Simona Subtirelu, Andreea-Daniela Meca, Elena Camelia Stanciulescu, Stefana Oana Popescu, Viorel Biciusca, and et al. 2021. "Prediction of Treatment Outcome with Inflammatory Biomarkers after 2 Months of Therapy in Pulmonary Tuberculosis Patients: Preliminary Results" Pathogens 10, no. 7: 789. https://doi.org/10.3390/pathogens10070789
APA StyleStefanescu, S., Cocoș, R., Turcu-Stiolica, A., Shelby, E.-S., Matei, M., Subtirelu, M.-S., Meca, A.-D., Stanciulescu, E. C., Popescu, S. O., Biciusca, V., & Pisoschi, C.-G. (2021). Prediction of Treatment Outcome with Inflammatory Biomarkers after 2 Months of Therapy in Pulmonary Tuberculosis Patients: Preliminary Results. Pathogens, 10(7), 789. https://doi.org/10.3390/pathogens10070789