Article

Long-Term Application of Organic Wastes Improves Soil Carbon and Structural Properties in Dryland Affected by Coal Mining Activity

1
Institute of Agricultural Resources and Regional Planning, Chinese Academy of Agricultural Sciences, Beijing 100081, China
2
Department of Soil and Water, Faculty of Agriculture, Al-Azhar University (Assiut Branch), Assiut 71524, Egypt
3
Institute of Environment and Sustainable Development in Agriculture, Chinese Academy of Agricultural Sciences, Beijing 100081, China
*
Authors to whom correspondence should be addressed.
Sustainability 2021, 13(10), 5686; https://doi.org/10.3390/su13105686
Submission received: 23 April 2021 / Revised: 11 May 2021 / Accepted: 12 May 2021 / Published: 19 May 2021

Abstract

:
Organic wastes have a positive impact on soil physical and chemical properties in the agroecosystems. However, its main effects on soil organic carbon (SOC) or total organic carbon, TOC (SOC and coal-C) contents as well as their effects on soil physico-chemical properties are still unclear. Two types of organic wastes (maize straw and manure) were utilized in dryland affected by mining activities to quantify their relative effect on soil physico-chemical properties. Regression analysis was used to assess the relationship between the soil physical properties, SOC, and TOC as well as their respective contributions to improving these properties. Treatments included control (CK), straw (S), low manure (LM), medium manure plus straw (S-MM), and high manure plus straw (S-HM). The results showed that SOC, soil bulk density, mean weight diameter (MWD), soil total porosity, soil penetration resistance, saturated hydraulic conductivity, and soil infiltration rate were strongly influenced by the application of organic wastes. A stronger linear relationship between SOC and the MWD, (R2 = 0.93, p < 0.05) compared to that between TOC and MWD indicated the important role of SOC in improving soil aggregation relative to the effect of TOC. According to the principal component analysis (PCA), the application of organic wastes had stronger effects on SOC contents and physical properties than TOC (SOC and coal-C). These findings advance our understanding of the actual effect of organic wastes on soil physical properties and SOC in dryland affected by mining activities and could inform fertilizer management decisions to improve soil properties.

Highlights

Organic waste applications can be beneficial strategies for reclamation of dryland affected by mining activities. Straw co-application with manure provided the best soil improvement. SOC had more influence on soil physical properties than the TOC. Soil hydraulic conductivity was closely associated with the improvement of MWD and SOC.

1. Introduction

Although the economic importance of extracting surface coal mining near agricultural areas, these mining activities lead to the transformation of large areas of arable land into unproductive or low-productivity soil [1,2]. These mining processes lead to the removal of soil materials that damage the ecosystem and degrade soil properties, negatively impacting the nutrient cycle. In China, these soils located near coal mining areas are typically used for the production of crops to achieve the goal of balancing needs and population growth through increased arable soils [3,4]. Shanxi Province, in the eastern Loess Plateau, is the second-biggest coal-producing region after Inner Mongolia [5,6]. From the 1990s, the Shouyang-Yangquan mining area undertook several coal gob pile reclamation projects. Reclamation of mine soils (RMS) can not only impact the development of the physical and chemical properties of spoil soil but also shorten the reclamation time [7,8]. Previous studies have shown that mine soils have low organic carbon, high bulk density, poor structure, and low water conductivity [2,5,9].
In addition to the coal mining activities, the Loess Plateau soils suffer from several problems such as severe soil erosion, the fragile ecological environment, and high chemical fertilizer applications, which have led to soil degradation [4,10]. Therefore, improving farmland management and preventing the degradation of soil resources are urgent problems in the sustainable development of the ecological environment of this area. Among the practices employed to reclaim and improve the properties of dryland affected by mining activities are organic wastes applications [1,8,10,11,12,13].
In mining areas, coal particles, coal dust, and airborne coal particles are emitted and combined with biogenic carbon from different organic waste inputs. Coal waste pollutants lead to serious errors in the determination of soil organic carbon (SOC) in arable soils nearing mining areas [14,15]. The amount of coal waste contribution to SOC is unknown in soil affected by coal mining activities, which makes it hard to understand the effect of C additions from the decomposition of organic waste applications and plant materials in soil affected by coal mining activities [16]. Das and Maiti [17] concluded that the estimation of biogenic carbon and coal-C is necessary for assessment of the actual SOC content in RMS in dry tropical climates. The differentiation between SOC derived from organic wastes (biogenic C) and coal (geogenic C) is important for understanding the dynamics of the soil carbon and the improvement in soil physical properties. This is important for understanding to what extent management practices contribute to the reclamation of land affected by coal mining activities.
In mine soils, enhancing the SOC is associated with improving the soil physical and hydraulic properties, especially in the surface layer after reclamation [2,18]. Via two reclaimed sites in Jackson and Vinton counties, Ohio [8] found that long-term organic fertilization caused increases in SOC and soil aggregation so improved water movement even though it decreased soil bulk density. Luna et al. [19], reported that the application of organic amendments increased total porosity, which resulted in an improvement in water conductivity and decreased erosion on the RMS. However, some studies have shown insignificant changes in soil bulk density, infiltration rate, and saturated hydraulic conductivity when organic wastes were applied to soils [20].
The effectiveness of the application of different organic wastes in dryland affected by coal mining on SOC or TOC contents and soil physical properties are still unclear. Most previous studies depend on traditional methods for measuring SOC content regardless of its source. However, it is very important to distinguish the effect of organic C and coal C and their interaction effects on soil physical properties. We hypothesize that the long-term application of organic wastes has a stronger impact on SOC, aggregate stability, and soil hydraulic conductivity compared to TOC, which may positively affect these physical properties and consequently improve the productivity of these soils. Therefore, the current study aimed to quantify and compare the effect of SOC from long-term application of organic wastes and TOC (SOC + coal-C) on soil physical properties in dryland affected by coal mining activities.

2. Materials and Methods

2.1. Site Description

A long-term fertilizer experiment with continuous spring maize was initiated in 1992 at the Dryland Farm Experiment Station in Shouyang, Shanxi Province, China (37° N–38° N, 112° E–113° E; 1100 m ASL). The site is in the Shouyang-Yangquan mining area at the northern temperate zone and has a tarry monsoon climate. It is cold and arid in winter, hot and rainy in summer. The mean daily temperature is 28.2 °C in the warmest month (July) and −11.4 °C in the coldest month (January). The meteorological data through the period of 1992 to 2018 is presented in Table 1. The annual sunshine duration is 2710 h. The annual average prospective evaporation is 1700–1800 mm, and the yearly frost-free season is nearly 130 days. Spring maize is the main crop grown under the one-crop-per-year cropping system. The soil was sandy loam in texture (Table 2) and it could be classified as a Calcaric-Fluvic Cambisol [21,22,23]. The site has received organic wastes, since 1992 that consists of Maize straw (S) and cattle manure (M).
The initial soil chemical and physical properties (in 1992) of the studied area are shown in Table 2.

2.2. Experimental Design and Sampling

The experiment was arranged in randomized block design with three replicates, the area of each plot was 36 m2 (6 × 6 m2). The experiment included five treatments as follows:
(1)
Unfertilized control (CK),
(2)
3000 kg ha−1 maize straw (S),
(3)
1500 kg ha−1 cattle manure as low (LM),
(4)
3000 kg ha−1 maize straw residue plus 4500 kg ha−1 cattle manure as medium (S-MM), and
(5)
3000 kg ha−1 maize straw residue plus 6000 kg ha−1 cattle manure as high rate (S-HM).
Each plot of the treatments S, LM, S-MM, and S-HM had nitrogen 105 kg ha−1 and phosphorus 105 kg ha−1 applied once a year, respectively, using urea (46% N) and calcium superphosphate (7% P) in a ratio of N to P of 1:0.44. At the same time, the source of potassium depended on the supply of organic wastes.
The organic manure was cattle manure obtained from local farms, whereas maize straw from the previous year’s harvest. The weighted mean contents for cattle manure of organic matter, total N, P, and K content of 360 g kg−1, 9.6 g kg−1, 1.7 g kg−1, and 7.4 g kg−1, respectively (ratio of N:P: K = 100:18:77), and 750 g kg−1, 6.3 g kg−1, 0.04 g kg−1, and 7.2 g kg−1, respectively, for maize straw (ratio of N:P: K = 100:6:114). Maize straw (S), cattle manure (M), and mineral fertilizers (F) were broadcasted and incorporated into the soil by ploughing (20 cm deep) after the maize harvest in the fall. The winter and spring seasons are dry and there are frequently high winds. Locally recommended maize varieties were utilized, at a seeding rate of 30 kg ha−1. Due to heavy winter, maize was seeded on 28 April 2018 without ploughing and harvested in late September. Seeds were sown at an intensity of 5.55 × 10⁴ plant ha−1 to preserve a spacing of 60 × 33 cm. Two manual weeding operations were carried out during the growing season. The maize was harvested near the soil with sickles and all harvested residues were removed from the plots.
After maize harvesting in 2018 soil samples were collected at six points selected randomly from 0–10 and 10–20 cm depth from each plot by soil auger and mixed well to form a composite sample. Six soil cores (5 cm diameter and 5 cm height) were sampled to measure soil bulk density. The total porosity was then calculated from soil bulk density assuming that the soil particle density was 2.65 mg m−3 [26]. Moist soil samples were taken to the laboratory, left on the bench for air-drying to a stable weight, and then separated gently breaking (by wood hammer) apart along the natural break to obtain aggregate sizes < 8 mm. After complete mixing, one subsample was dried at 105 °C to determine soil moisture gravimetrically according to Page et al. [27]. Soil samples passed through 8-mm sieve were subjected to determine four aggregate size fractions according to Elliott [28]. Samples of 80 g were put on the top of a 2-mm sieve and gently immersed in deionized water for 5 min at room temperature. The aggregates were separated by manually moving (3 cm vertical distance 50 times in 2 min). The rest of each soil sample on the 2-mm sieve was collected. The passing soil suspension was transferred to the next finer sieve, and the sieving operation was repeated. In the sieving process, there were three consecutive sieves, with pore diameters of 2, 0.25, and 0.053 mm, respectively. Thus, the size fractions acquired were (1) large macroaggregates of >2 mm, (2) small macroaggregates of 2–0.25 mm, (3) micro aggregates of 0.25–0.053 mm, and (4) the silt and clay fraction of <0.053 mm that was collected by centrifugation. All separated fractions were oven-dried at 60 °C and then weighed, and the mean weight diameter (MWD, mm) was calculated as an index of the aggregate stability according to [29,30] using the following equation:
M W D = i = 1 n x ¯ i w i i = 1 n w i
where xi is the mean diameter of the size fraction (mm), and wi is the proportion of the size fraction in the whole soil (%).
The steady-state phase of soil infiltration rate (INR) was measured according to the criterion suggested by USDA [31] at the field. This method uses a single ring infiltrometer with a diameter of 152 mm. The time required for a known quantity of water, equal to a 25.4 mm head (444 mL of water), to infiltrate into the soil is recorded. The saturated hydraulic conductivity (Ks) was determined on soil cores by the constant-head method [32].
In 2018, soil penetration resistance (PR) as an indicator for soil compaction was measured for 0–10 and 10–20 cm depth using a hand-pushing electronic cone penetrometer (Eijkelkamp Penetrologger). The measurements were carried out at six spots in each plot in October just after harvesting the maize crop. The soil moisture content of each plot was measured in both soil layers.
The coal-C content of soil samples was analyzed using a Chemi-thermal method as described by Ussiri and Lal [16]. Thinly ground 2 g soil samples were chemically treated by 1 M HCl (to remove carbonates), 0.5 M NaOH, 60% HNO3, and HF then heated in a muffle furnace at 340 °C for three hours. The remained C fraction that is resistant to chemical extraction and thermal oxidation is defined as the coal-C, which was analyzed by the elemental-analyzer systems GmbH (Vario Pyro Cube, Germany). Newly derived SOC concentration of the soil samples was determined by subtracting the coal-C from the total organic carbon (TOC) (Figure 1).

2.3. Statistical Analysis

A one-way analysis of variance (ANOVA) and Duncan’s test were perfected by SPSS 21.0 (SPSS Inc., Chicago, IL, USA) for the analysis of difference and the test of significant variance (p < 0.05). The relation between soil variables and treatments were analyzed with principal component analysis (PCA) by using Origin Pro 2017. Multiple linear regressions (MLR) were performed using statistical models of Freedman (2009).

3. Results

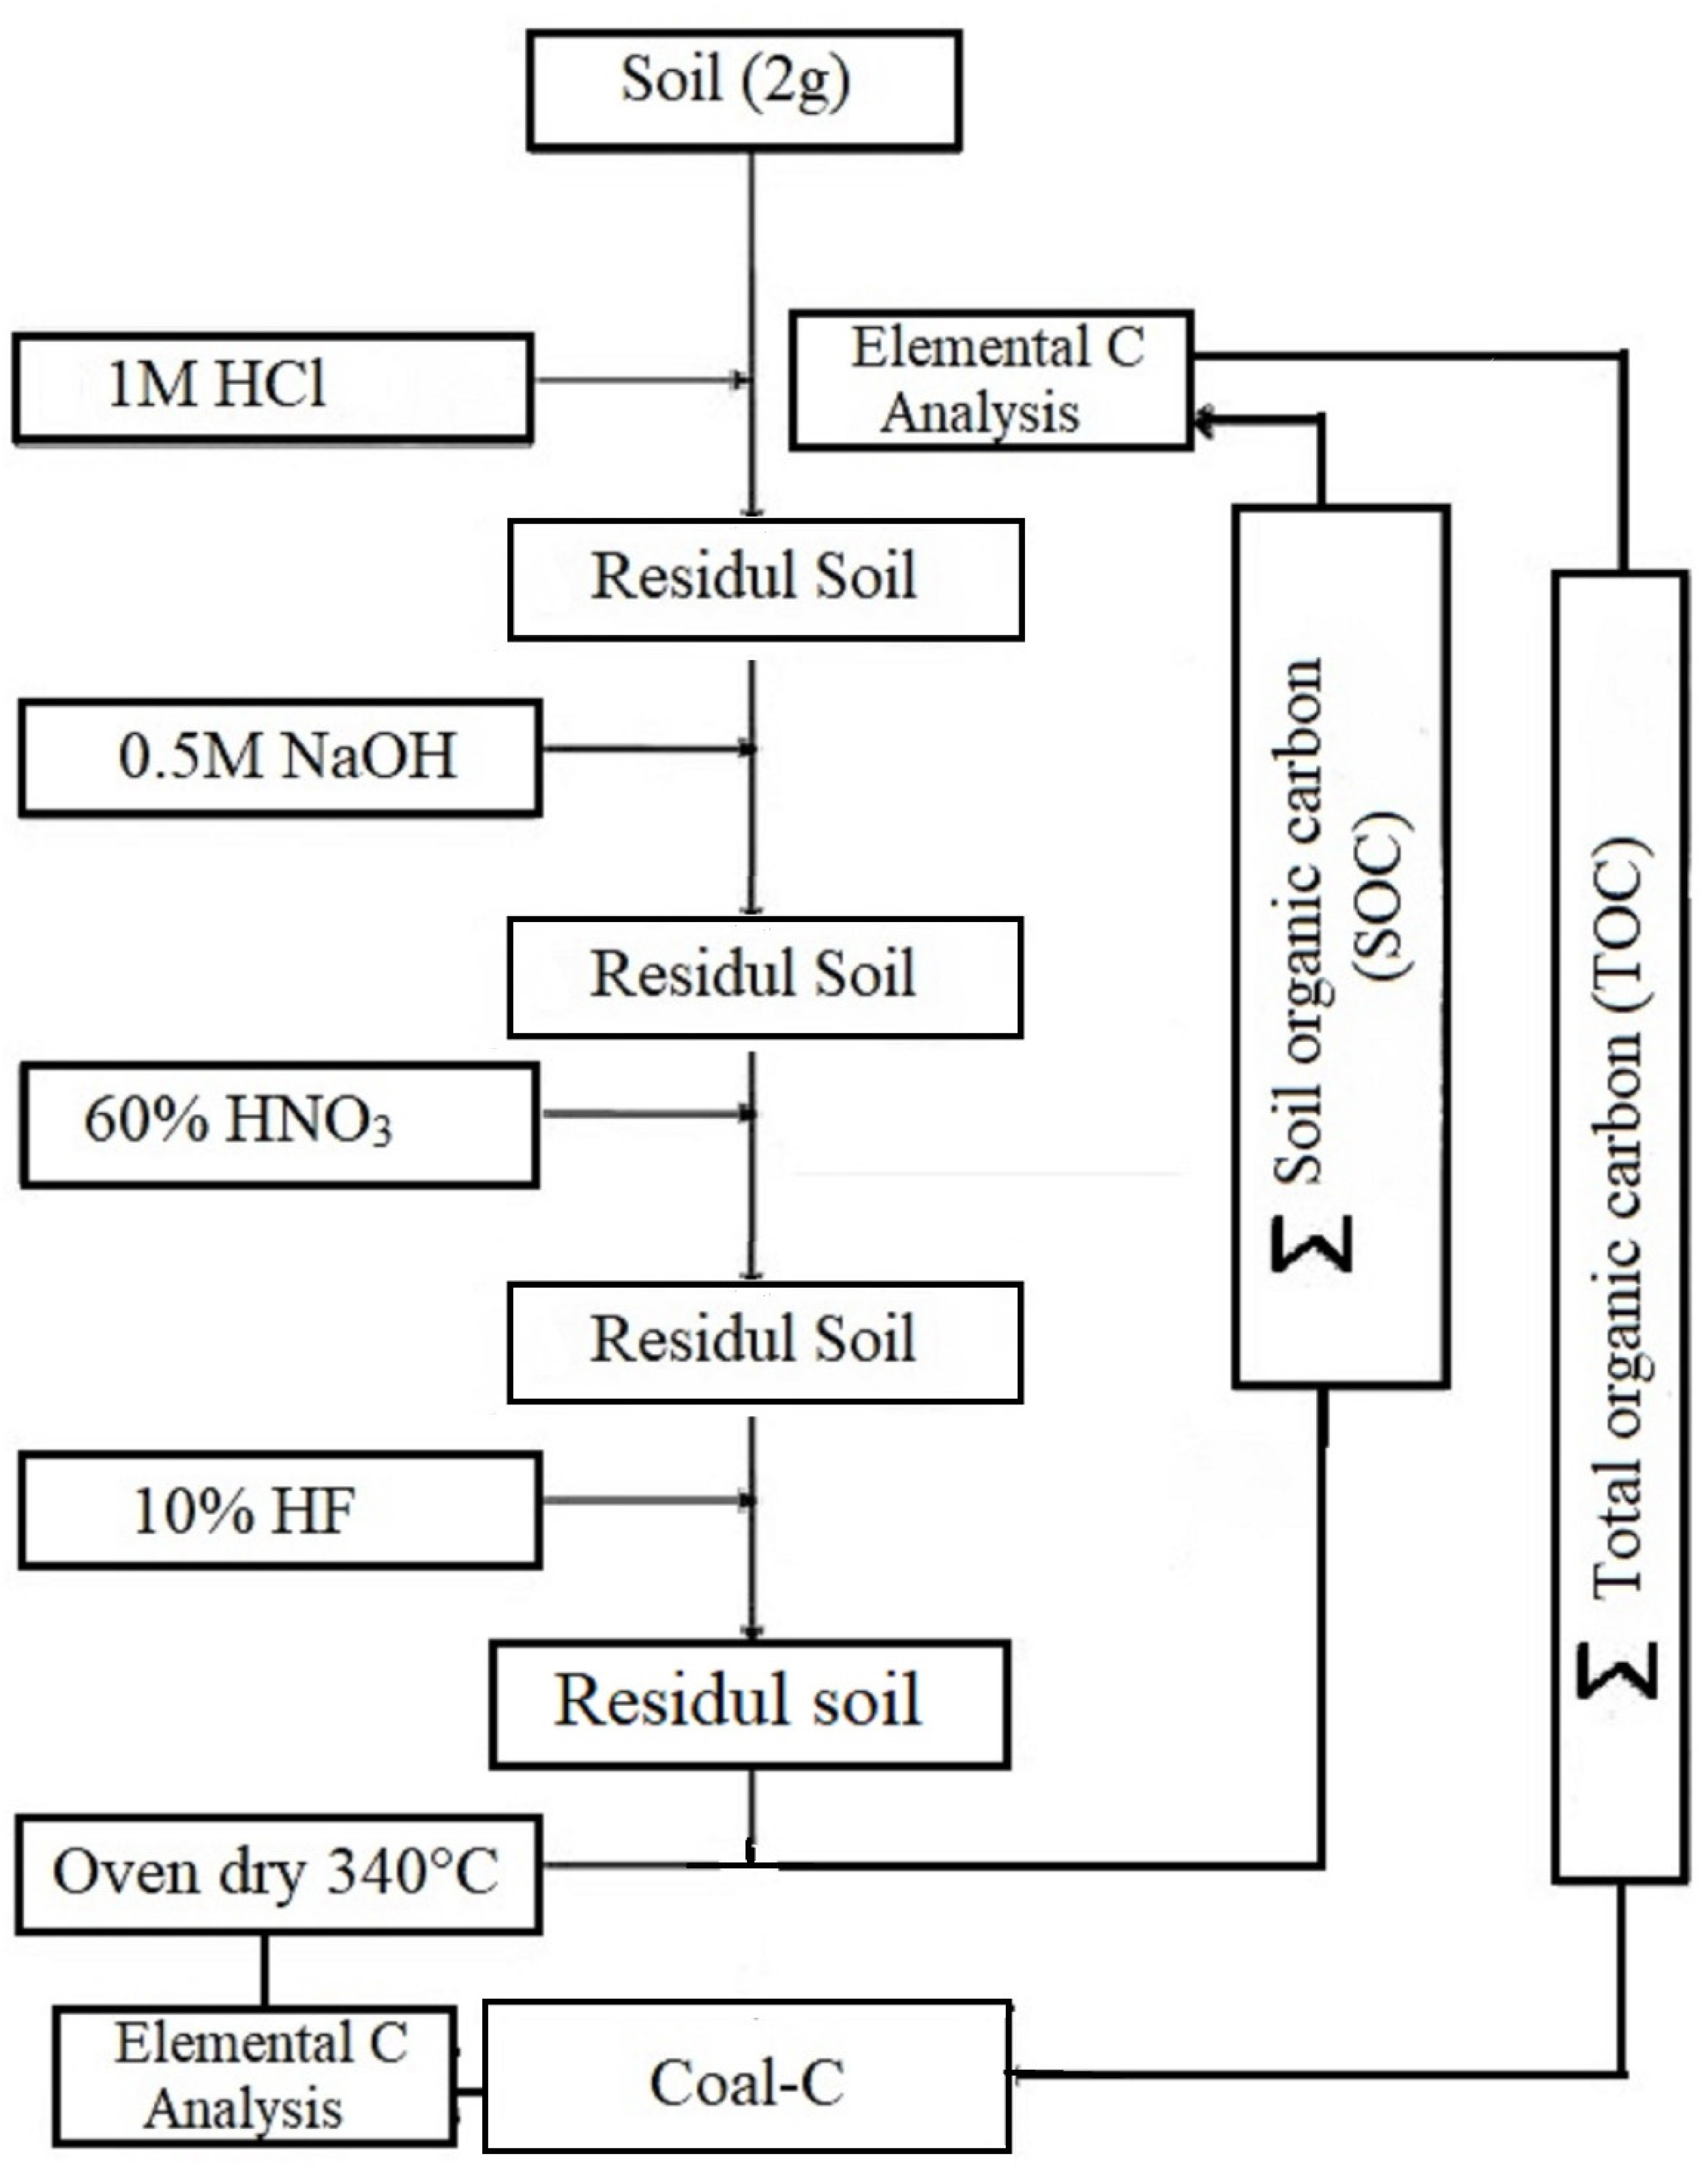
3.1. Soil Carbon Components

In general, total organic carbon content (TOC) that includes both soil organic carbon and coal-C constantly increased with the application of organic wastes. The TOC content significantly increased in the S-HM treatment, while it showed an insignificant increase in the other treatments (S-MM, S, and LM) compared to CK treatment in both soil layers (Table 3).
Regarding coal-C distribution along with the application of organic wastes, insignificant variations were found among all treatments in 0–10 cm soil depth. The coal-C contents were highly significantly increased in 10–20 cm soil depth with S-HM and S treatments (Table 3).
Long-term application of organic wastes realized significant (p < 0.05) effects on soil organic carbon content (SOC or biogenic carbon). The SOC content of both soil layers progressively increased with the application of organic wastes (Table 3). The SOC content in S-HM and S-MM treatments was 16.91 and 16.43 g C kg−1 soil, respectively, and it was 15.82, 15.72, and 15.16 g C kg−1 soil in LM, S, and CK treatments, respectively, in the surface soil layer (Table 3). The same trend of SOC content was recognized in the subsurface layer (10–20 cm), but not statically significant between LM, S-MM, and S-HM treatments.

3.2. Soil Bulk Density (ρb) and Total Porosity (P-Core)

The long-term application of organic wastes resulted in a significant reduction in the soil bulk density of the 0–10 cm soil layer compared to the CK treatment (Table 4). S-HM, S-MM, and LM treatments exhibited a significant (p < 0.05) reduction in soil bulk density reflecting a significant increase in the total soil porosity compared to the CK treatment. While in a 10–20 cm soil layer, S-HM and S-MM treatments showed a significant effect on both bulk density and total porosity compared to the other treatments. Regardless of the organic waste application, bulk density increased with soil depth consequently the total porosity decreased.

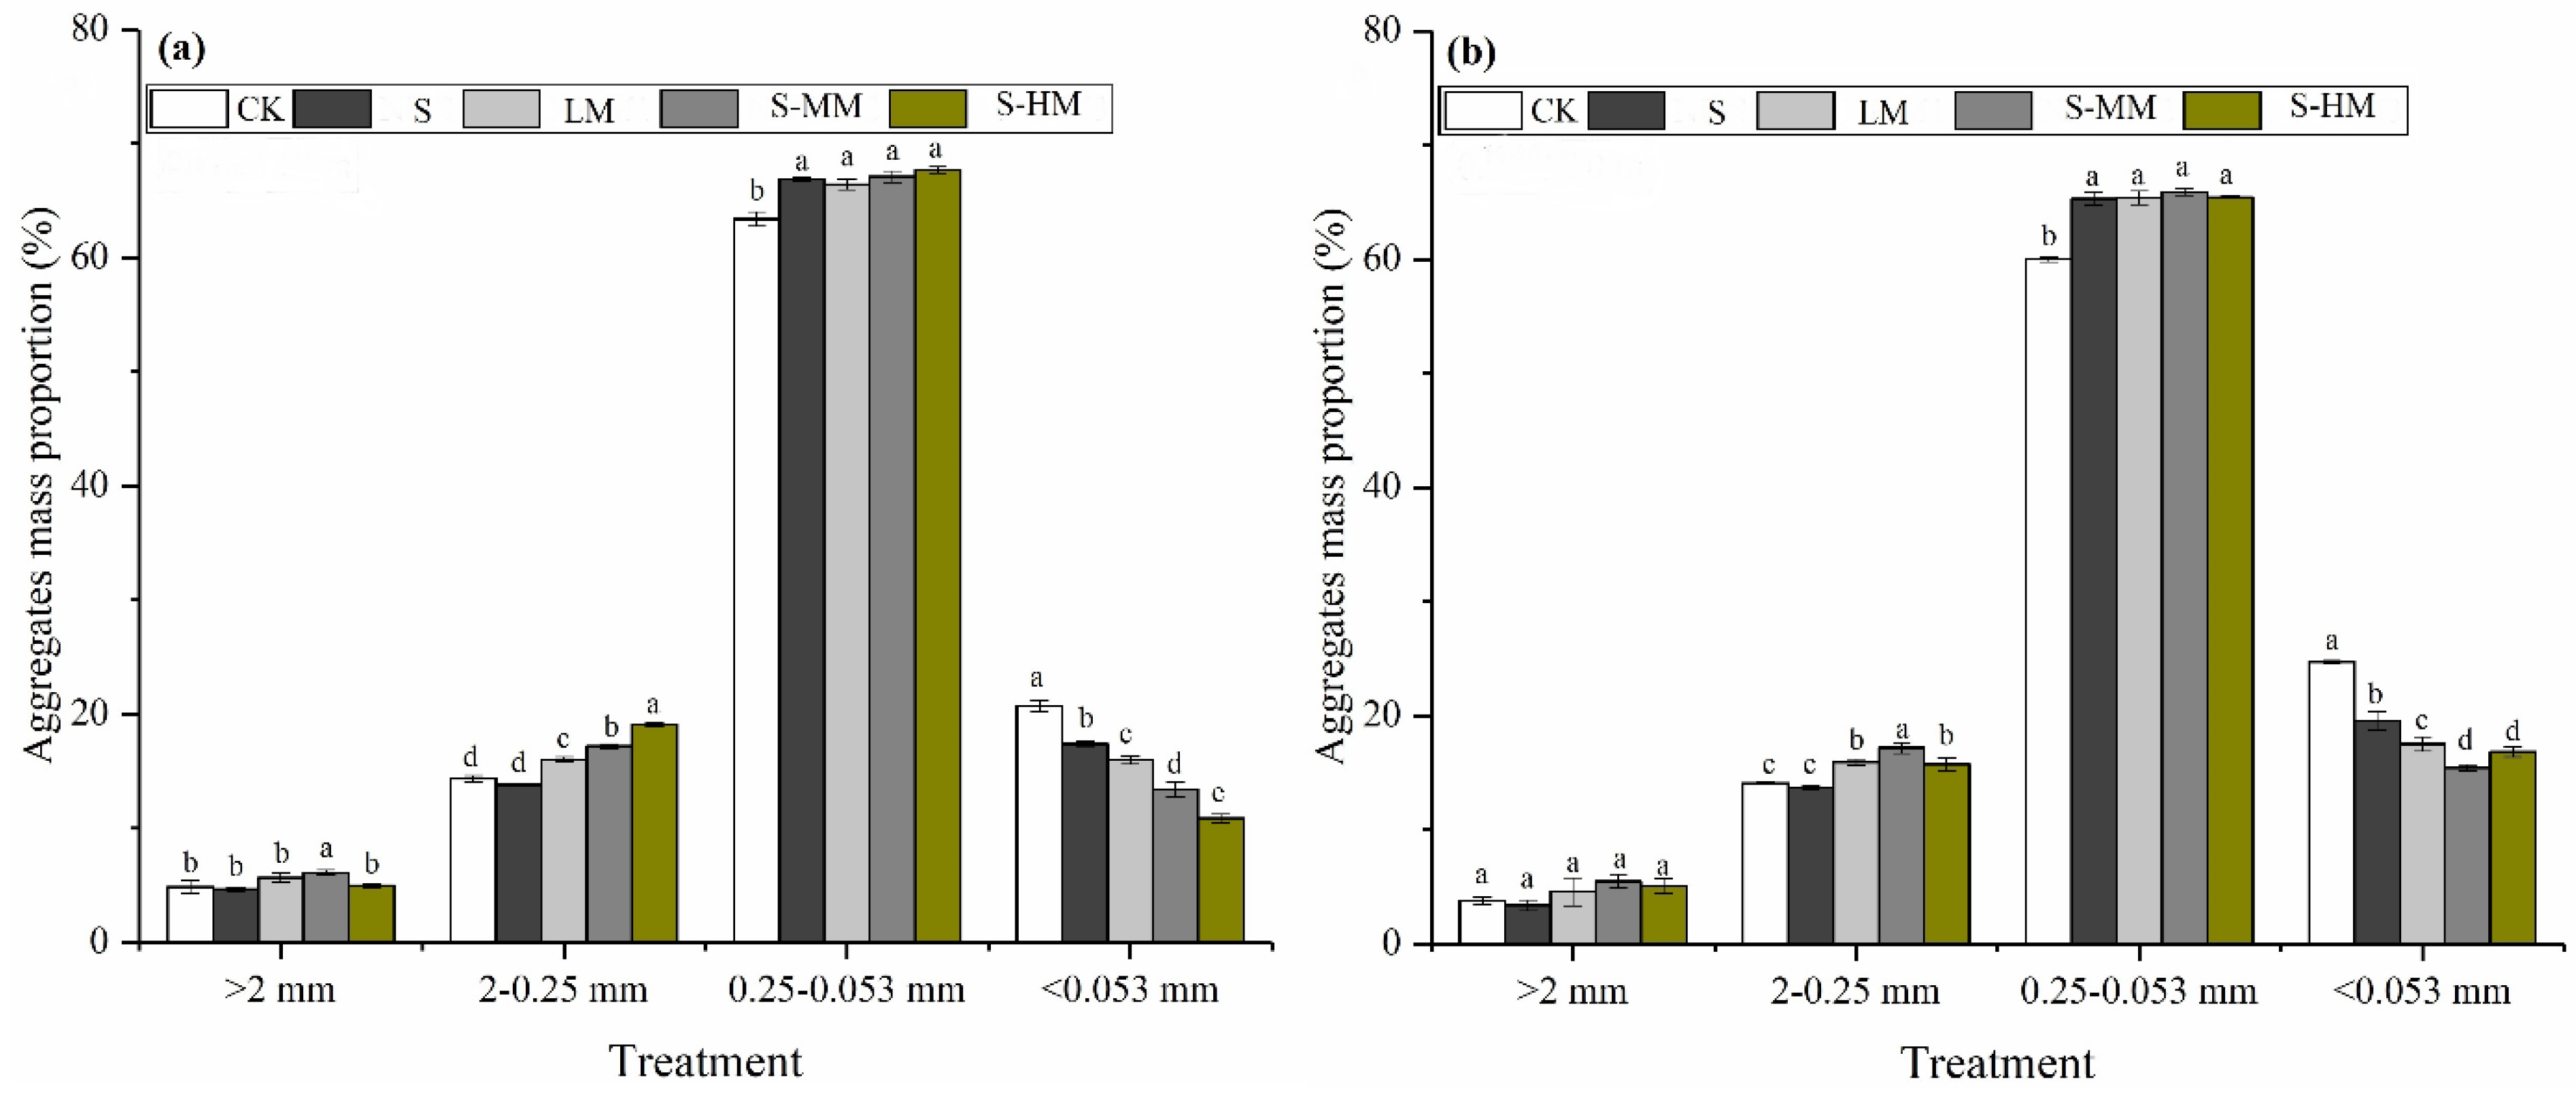
3.3. The Size Distribution of Soil Water-Stable Aggregates

In the surface layer (0–10 cm), the aggregates with size >2 mm only with S-MM treatment significantly increased compared to the other treatments. The different manure applications had a significant effect on aggregate with size 2–0.25 mm than the S and CK treatments in both the soil layer. The aggregate size of 0.25–0.053 and <0.053 mm in both soil layers significantly differed as a result of organic wastes application compared to the CK treatment. The number and size of soil water-stable aggregates decreased as soil depth increased (Figure 2). For all treatments, the micro aggregates (0.25–0.053 mm) are the dominant ones in each soil layer, followed by the macroaggregates (>0.25 mm).

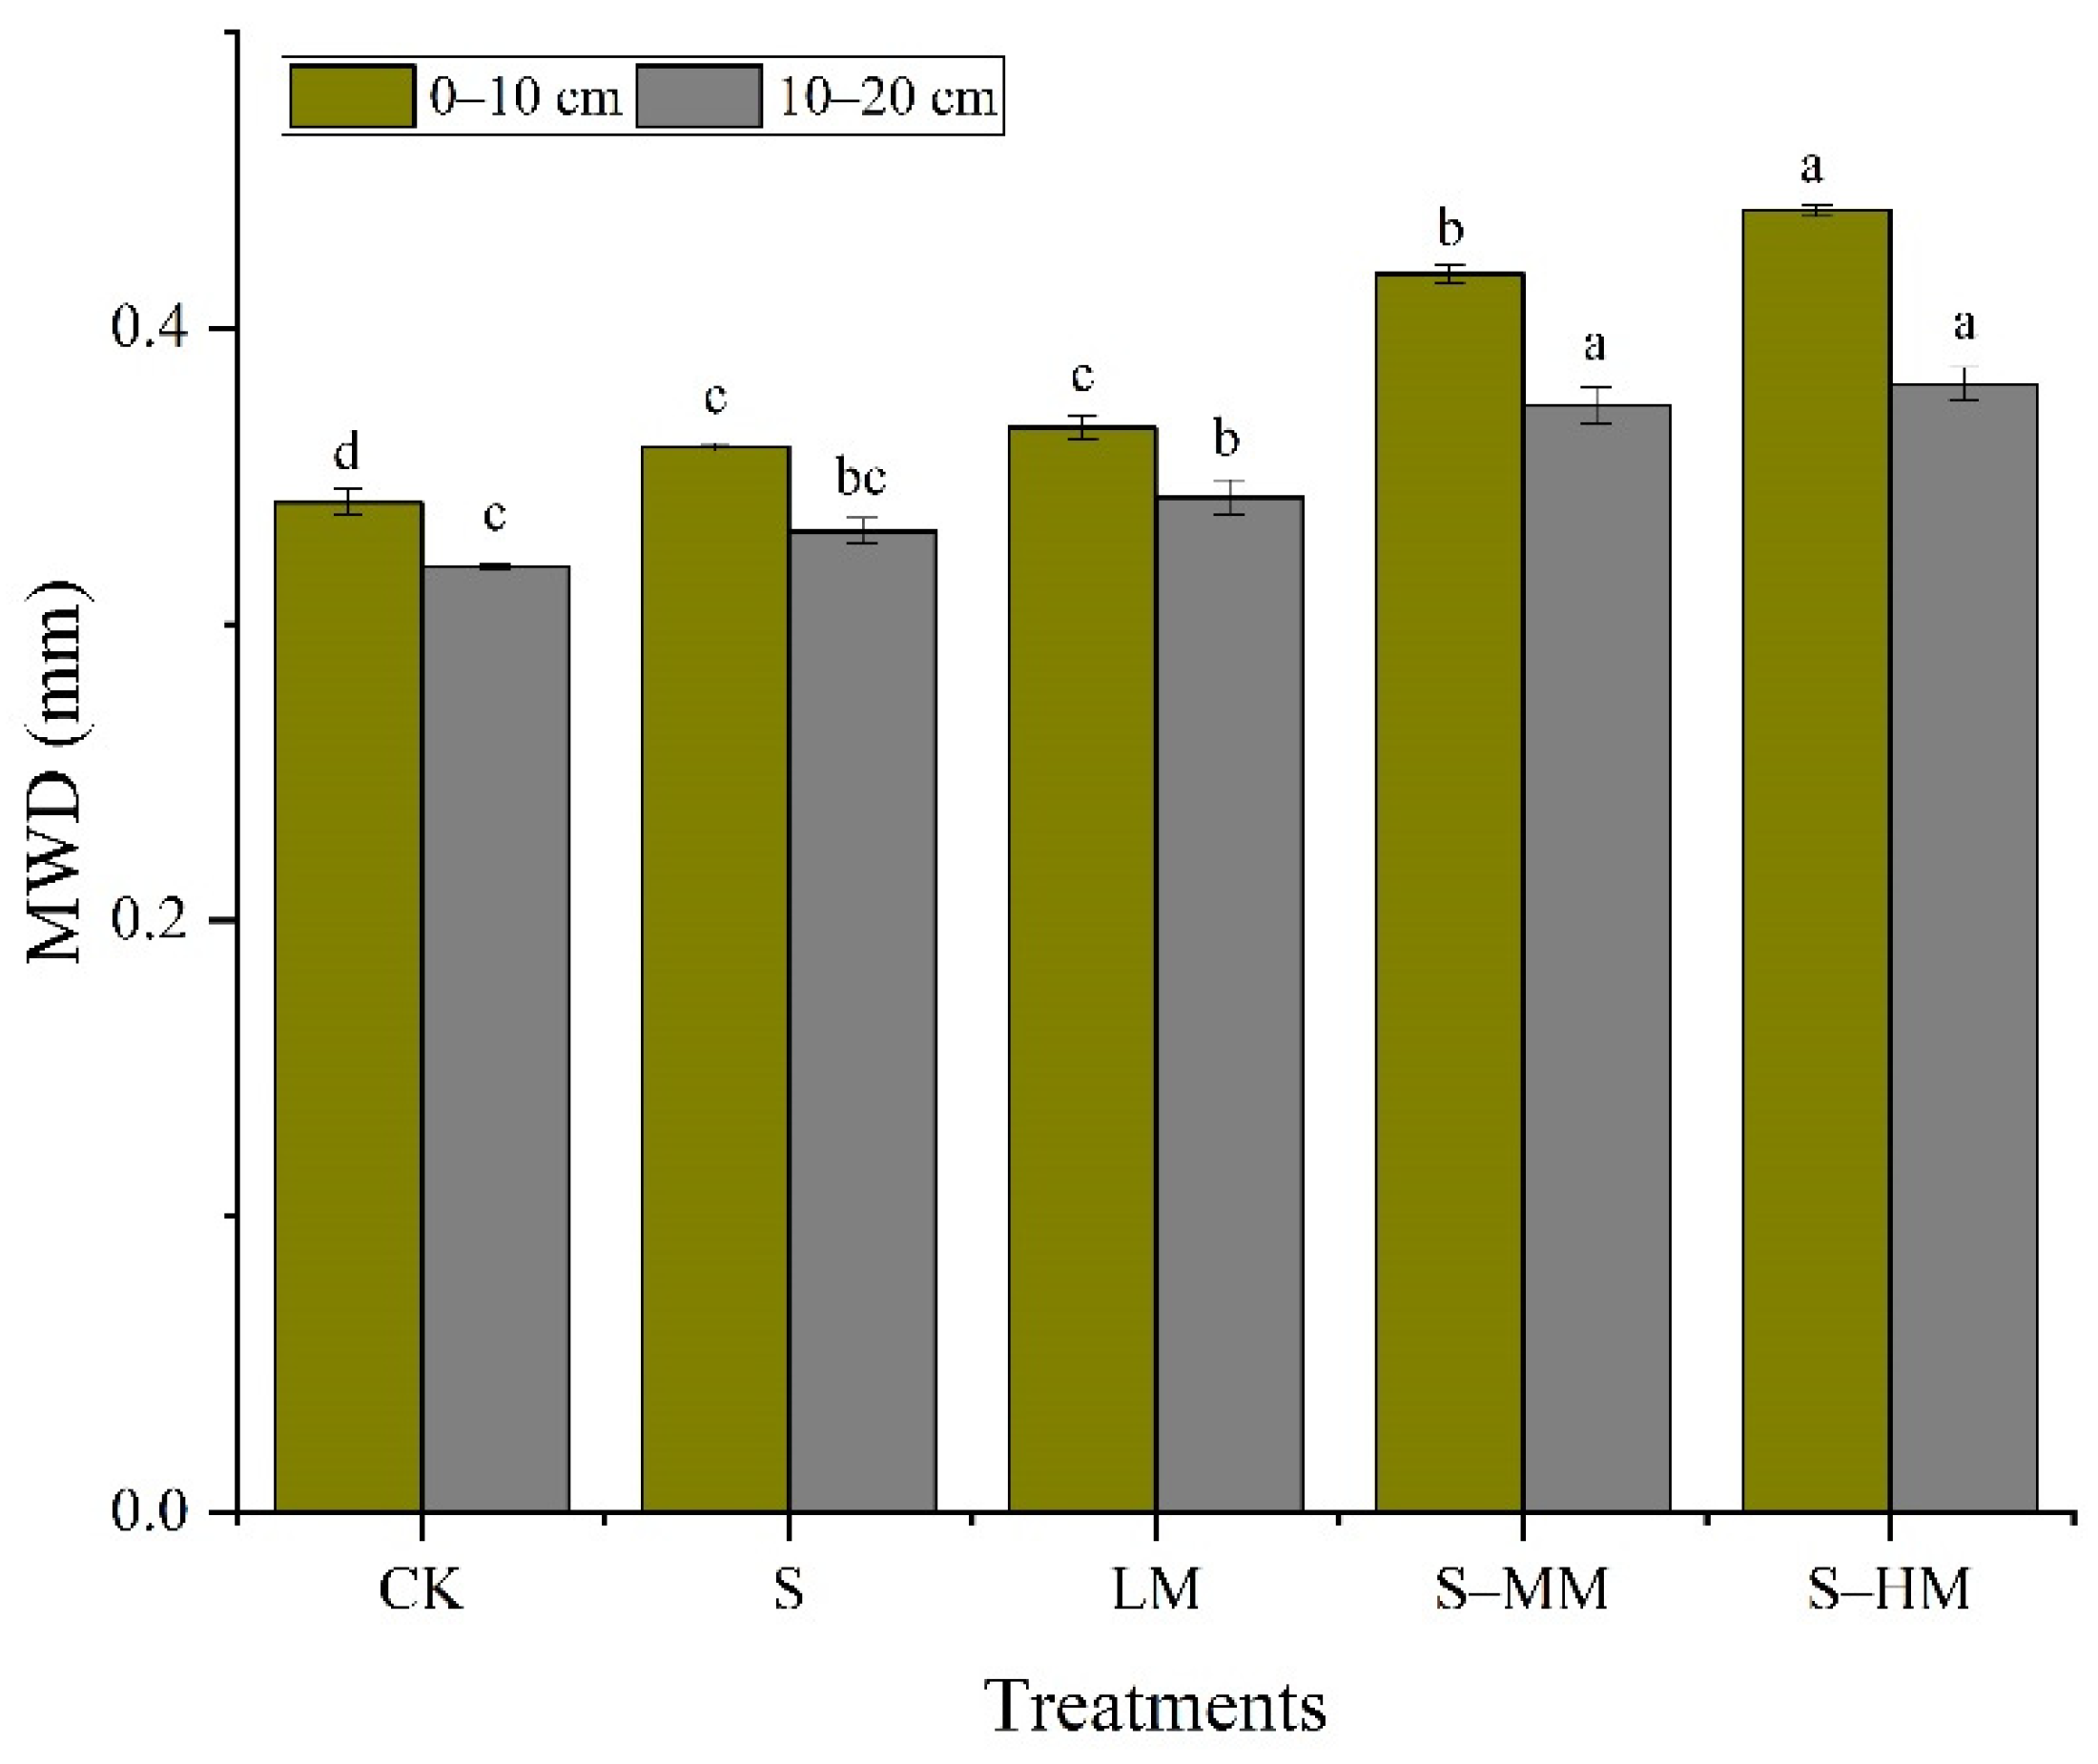
3.4. Mean Weight Diameter (MWD)

Long-term application of organic wastes showed significant (p < 0.05) effects on the MWD, which is considered as a reference of soil aggregation. The highest MWD values of the surface layer were obtained in S-HM, S-MM, LM, and S treatments, being 0.44, 0.42, 0.37, and 0.36 mm, respectively, with statically significant differences from the CK treatment (Figure 3). The MWD values of the subsurface layer were lower than those in the surface one with significant effects (p < 0.05) among treatments (Figure 3).

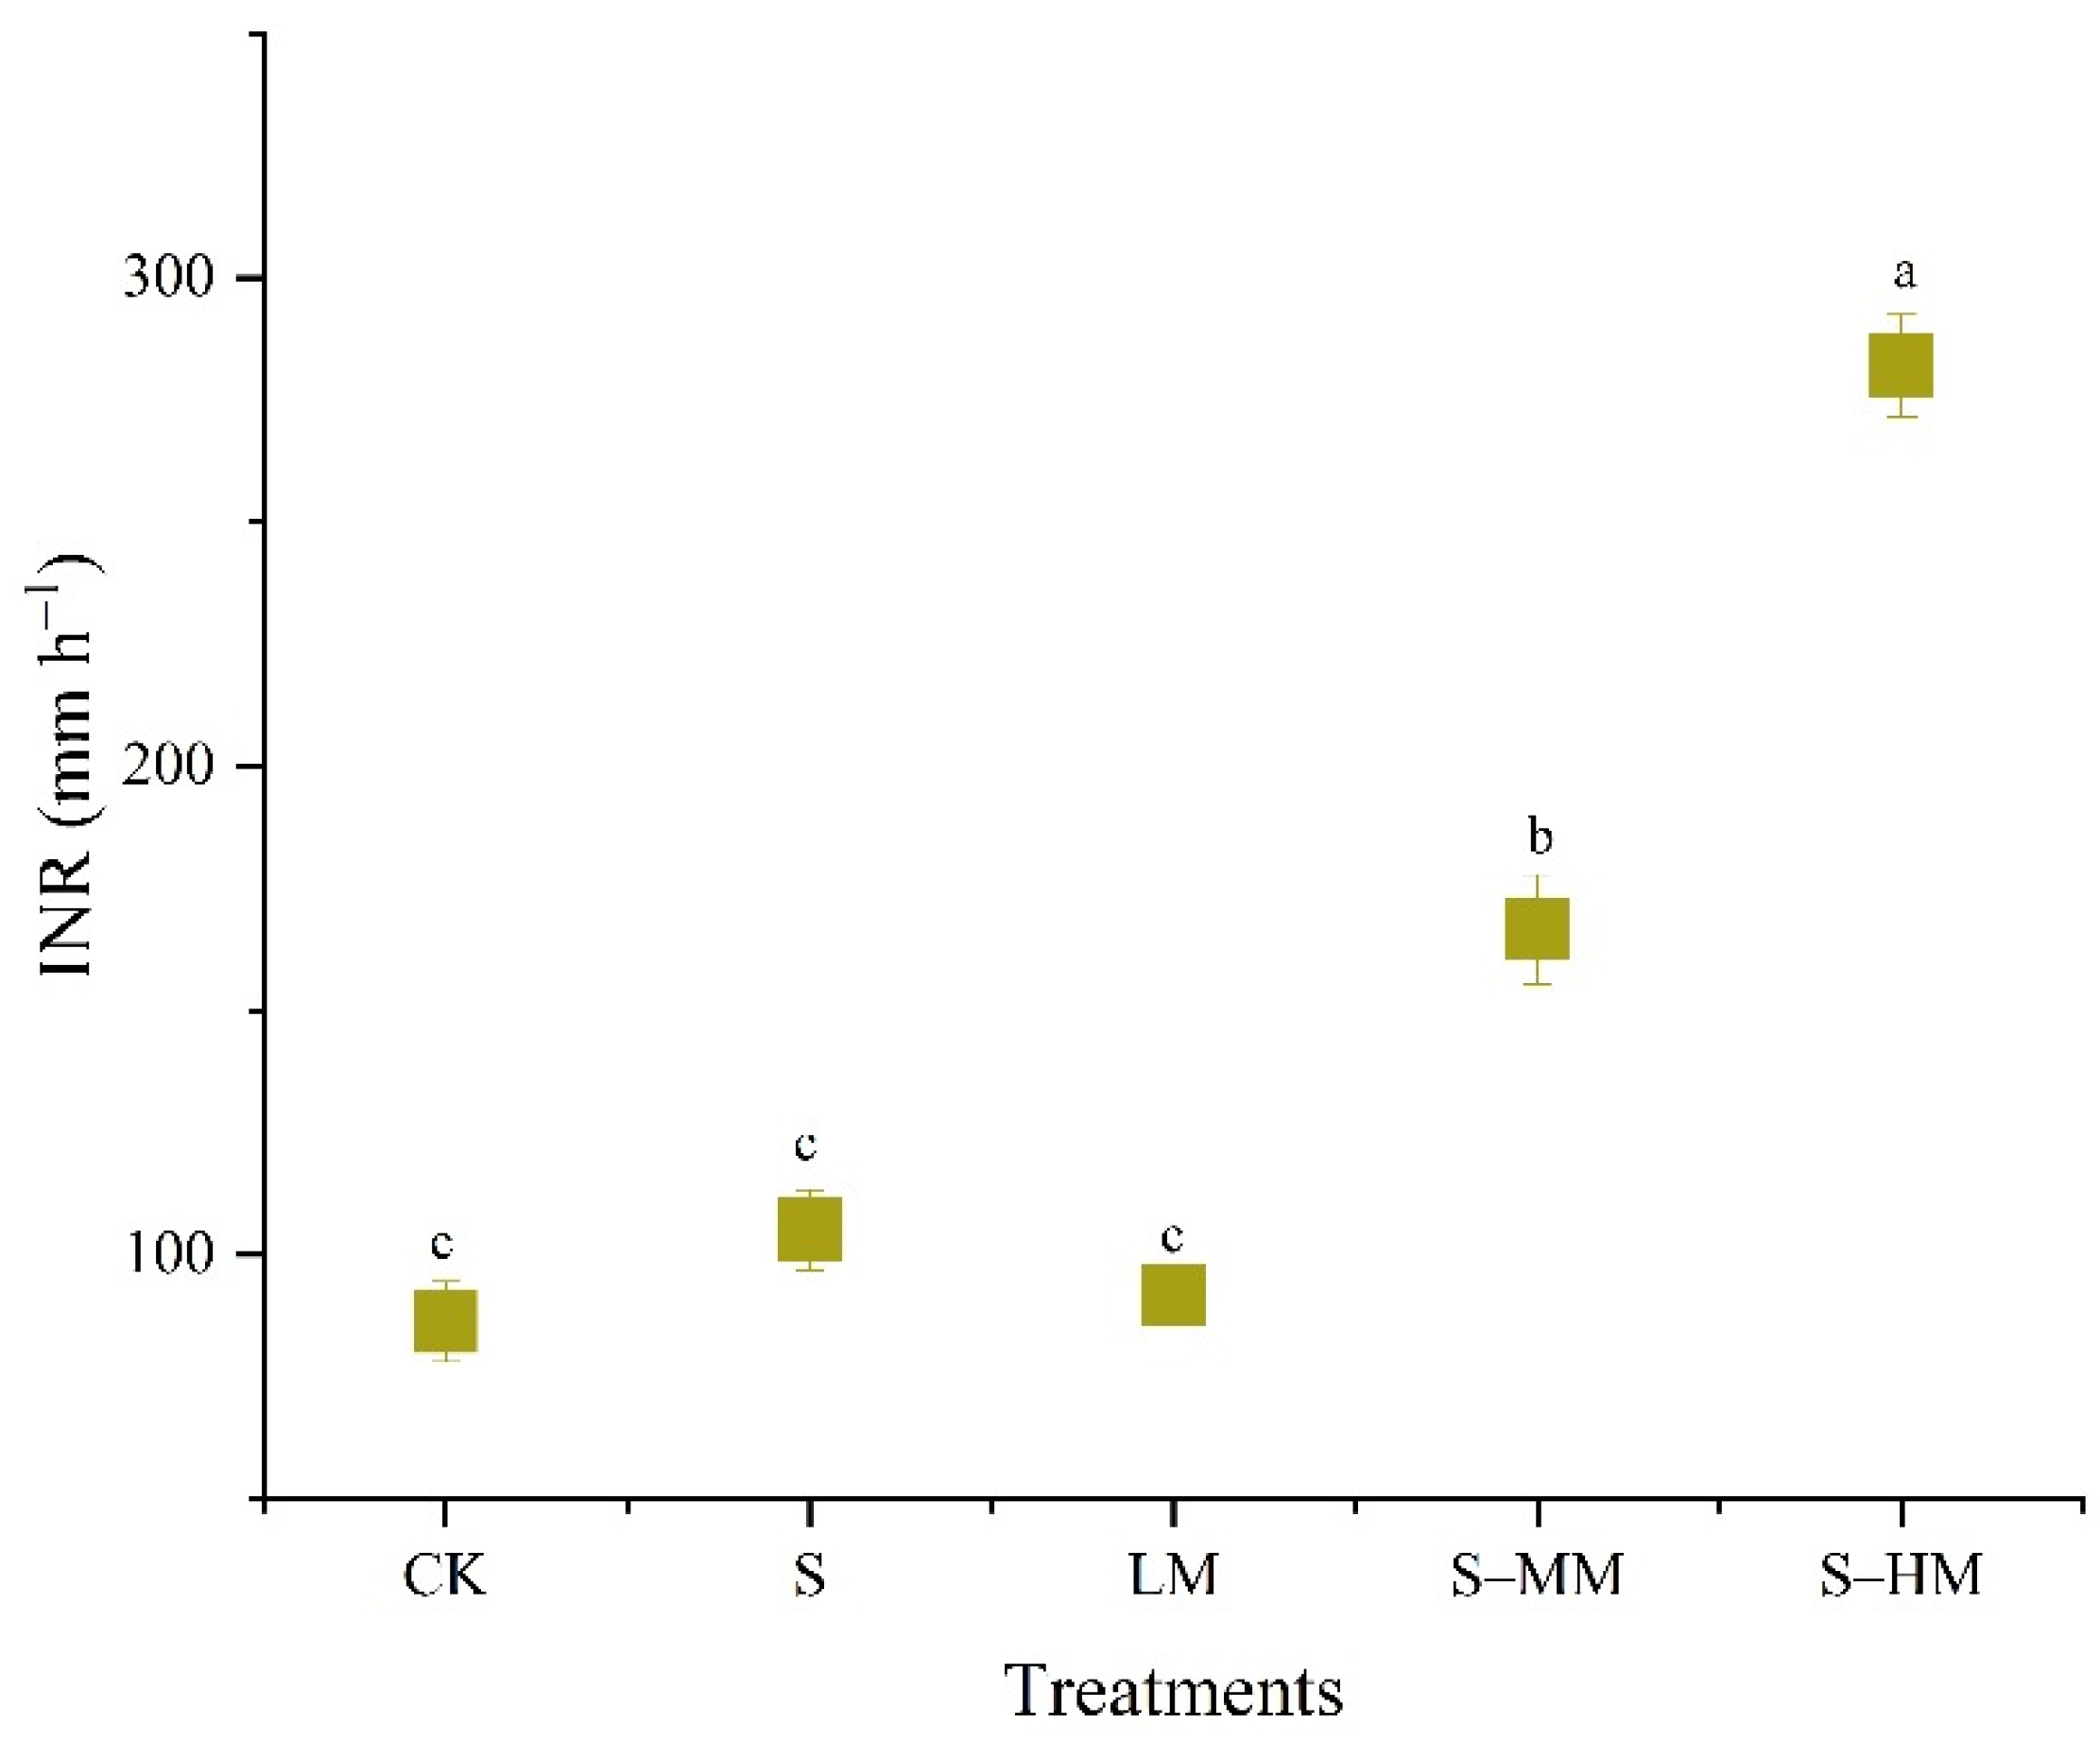
3.5. Saturated Hydraulic Conductivity (Ks) and Infiltration Rate (INR)

The Ks in 0–10 and 10–20 cm soil layers as affected by different applications of organic wastes are shown in Table 4. In the surface layer (0–10 cm), it was observed that the Ks had the highest value on S-HM treatment followed by S-MM, LM, S, and CK treatments. The S-HM, S-MM, and LM treatments increased Ks values by 115.50, 61, and 51.32%, respectively, compared to the CK treatment. In the subsurface layer (10–20 cm), the Ks values increase with the application of organic wastes, but with insignificant effects among treatments compared to the CK treatment.
The long-term application of organic wastes had varying effects on the infiltration rate (INR); it played a major role in improving the INR values (Figure 4). The high manure application rates had higher INR values than those of other applications. The S-HM and S-MM treatments increased INR by 226 and 93%, respectively, compared to the CK treatment. While the S-HM treatment increased the INR by 168 and 207% compared to the S and LM treatments, respectively. There was an insignificant difference in the INR between the LM and S treatments. On the other hand, the INR statistically significant variation for S-MM and S-HM vs. LM, S, and CK treatments.

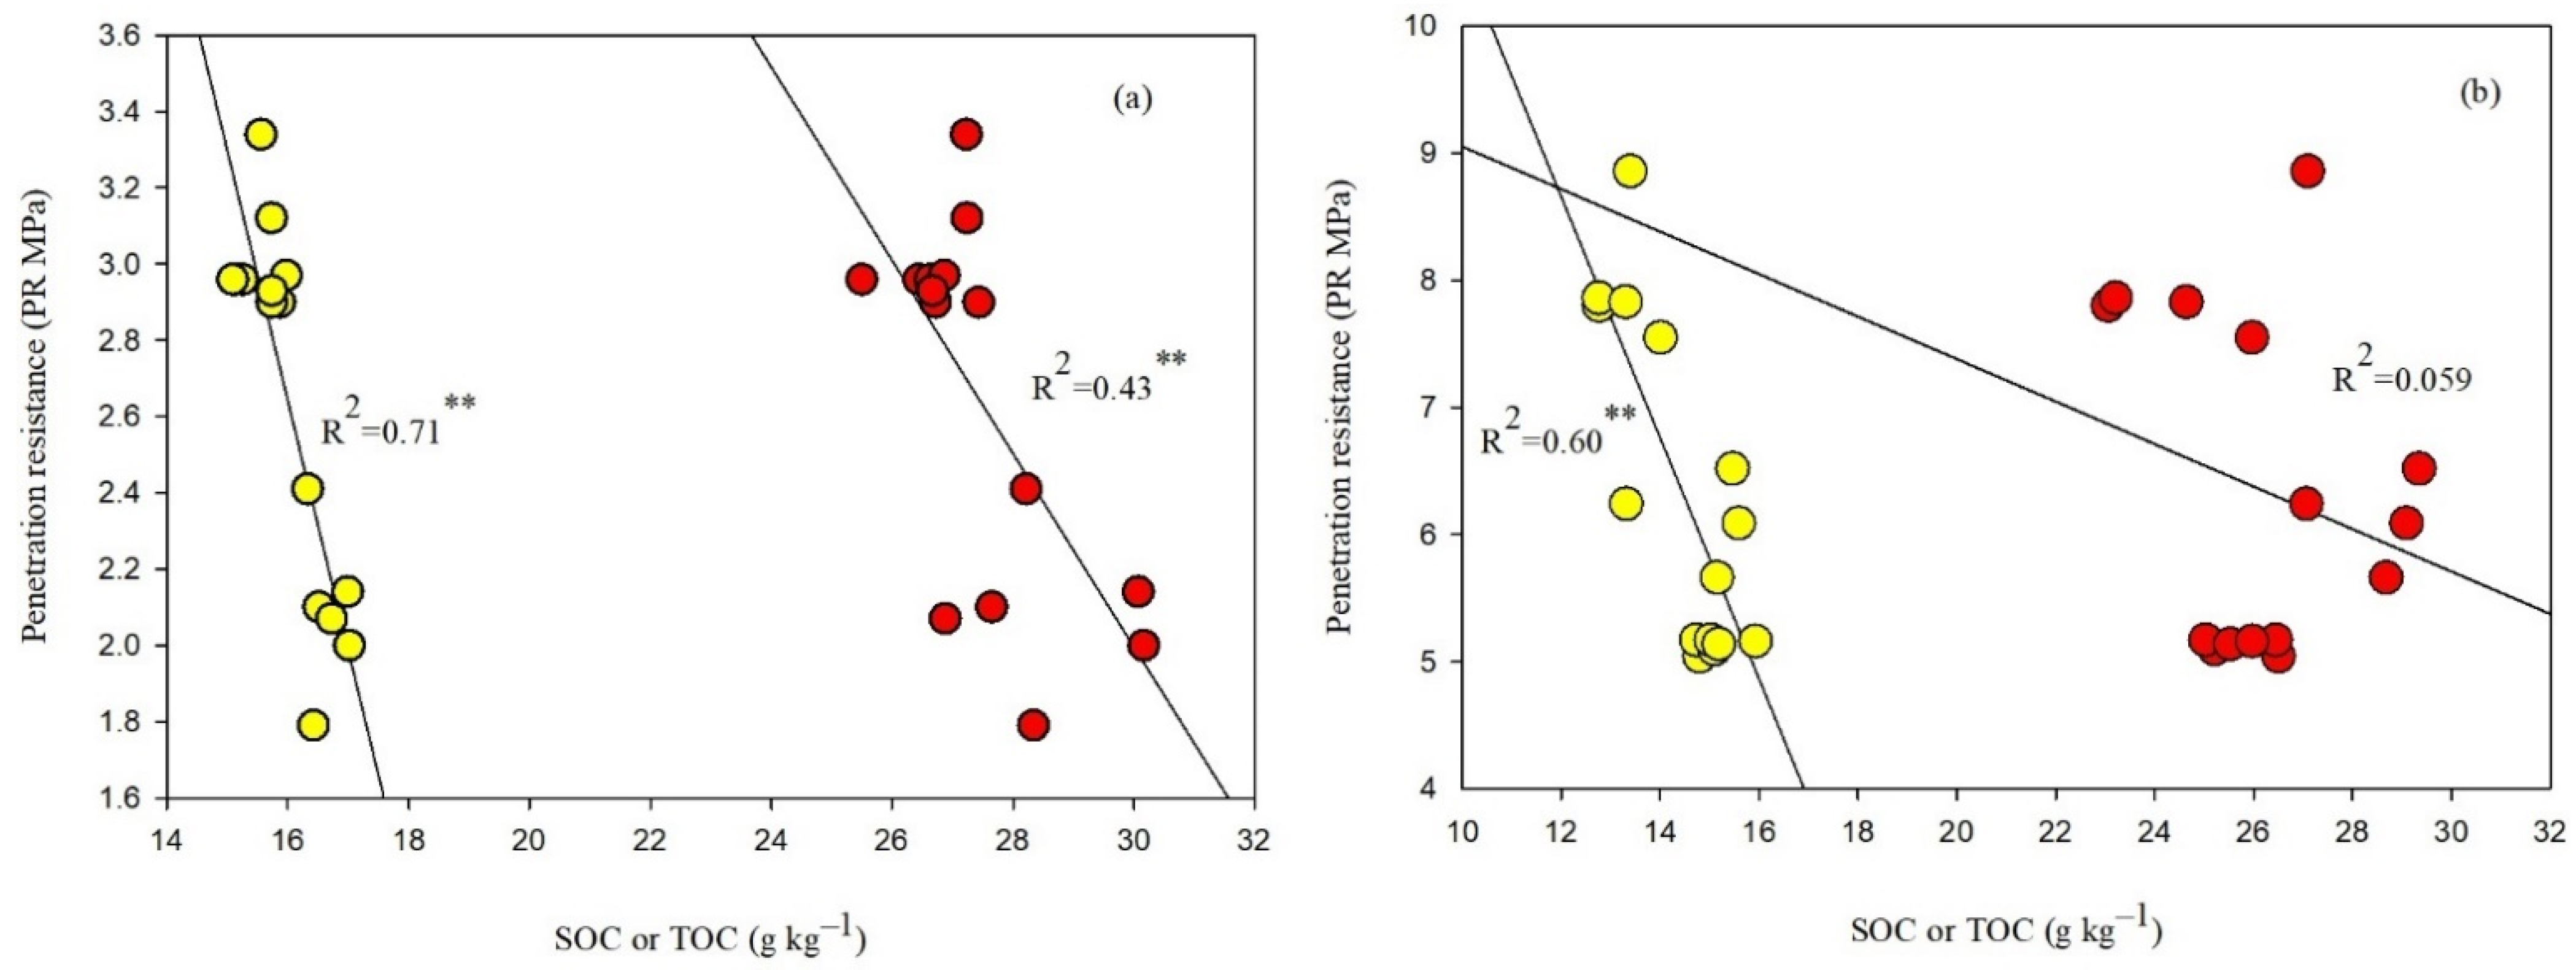
3.6. Soil Penetration Resistance (PR)

The average PR values for 0–10 and 10–20 cm soil layers amended with different organic waste applications are presented in Table 4. The organic material applications had a significant (p < 0.05) effect on penetration resistance. In the surface layer, the penetration resistance showed low values with S-HM (2.07 MPa) and S-MM (2.10 MPa) treatments. While it showed high values with S (3.12 MPa) followed by CK (2.96 MPa) treatment, with insignificant effect among CK, S, and LM treatments. The PR significantly increased with soil depth for all treatments. The influence of manure applications on PR was completely analogous except for S-HM treatment at the subsurface layer.

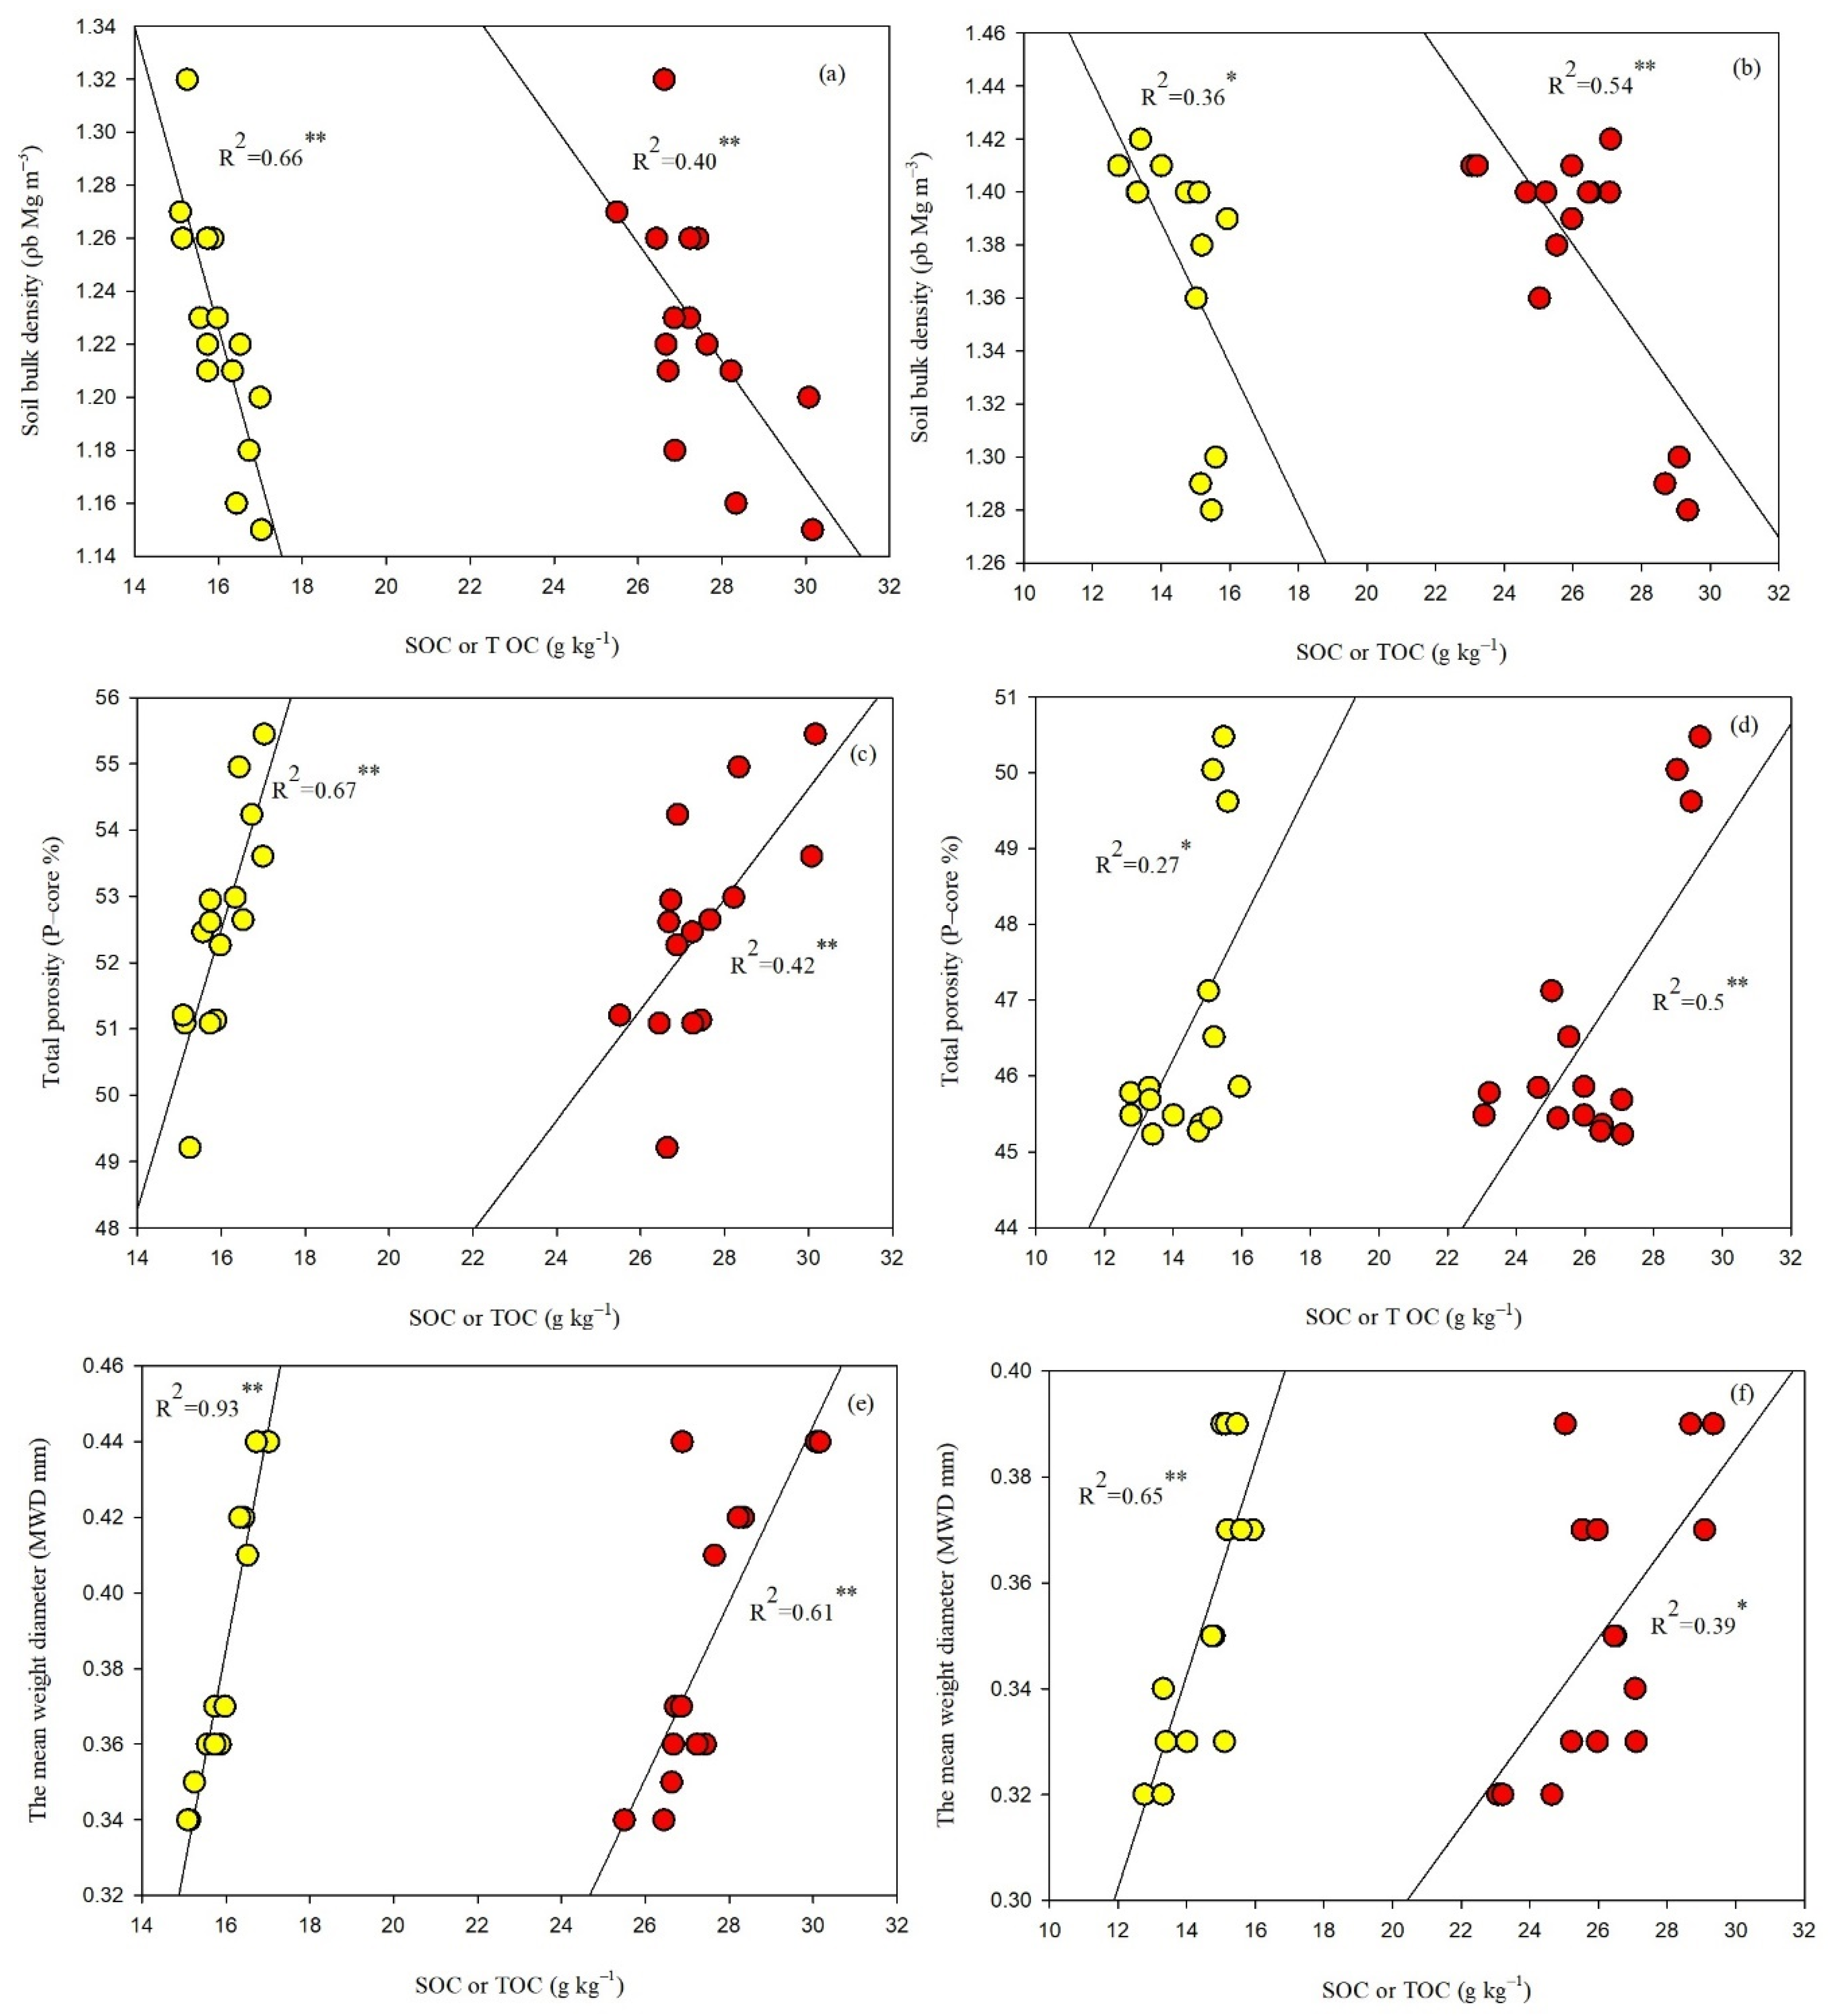
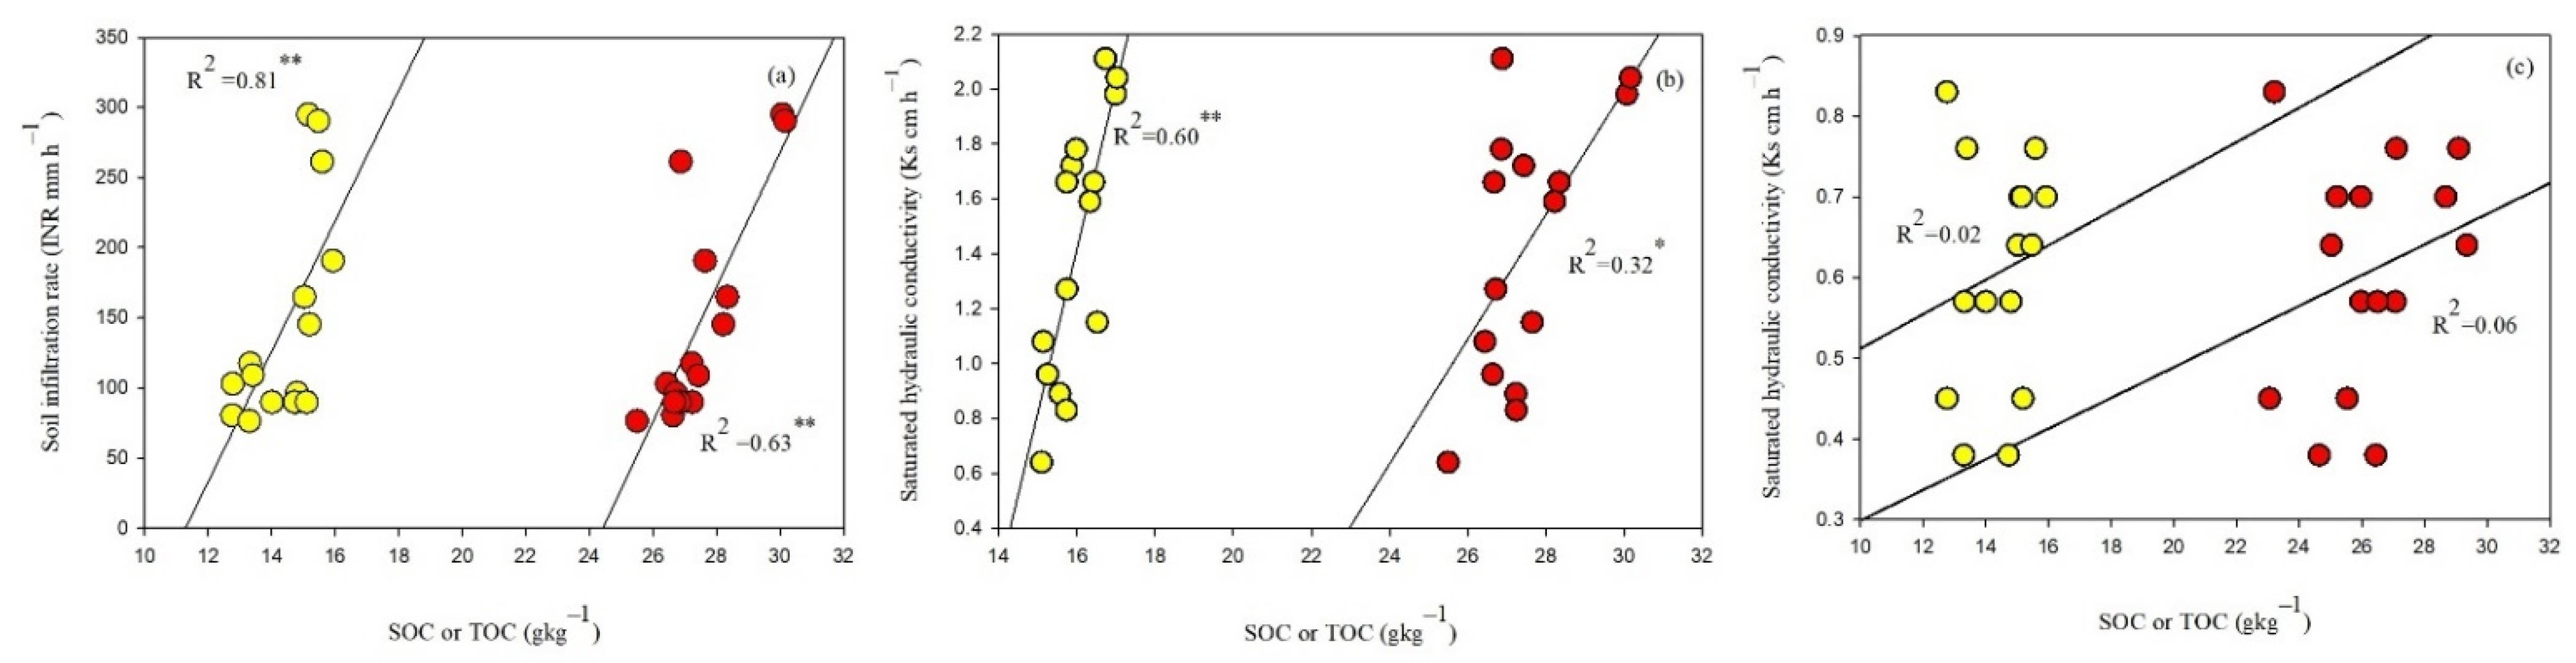
3.7. Soil Physical Properties in Relation to TOC and SOC

The soil bulk density was negative significantly correlated with SOC and TOC in both soil layers. The regression value of this negative correlation was higher with SOC than that of TOC in the surface layer, and the opposite trend was true in the subsurface layer (Figure 5a,b). Total soil porosity was positively correlated with SOC and TOC in both soil layers (Figure 5c,d).
The MWD significantly increased with increasing SOC or TOC of both soil layers. Moreover, for both soil layers, MWD was more closely related to the SOC (R2 > 0.9, p < 0.01) than TOC (Figure 5e,f). The water infiltration (INR) significantly increased with the increasing content of soil organic carbon or total soil organic carbon. The INR was more strongly related to the SOC (R2 > 0.8, p < 0.001) than TOC (Table 5 and Figure 6a).
The Ks was positive significantly correlated with SOC or TOC in surface soil layers. Otherwise, Ks was positively insignificant correlated with SOC or TOC in the subsurface soil layer. The regression (R2) value of this positive correlation was higher with SOC than that of TOC in the surface layer (Table 5 and Figure 6b,c). In general, a significant negative correlation was observed between PR and SOC in both soil layers, while the correlation between PR and TOC was only significant at the surface soil layer (0–10 cm). The R2 value of this negative correlation was higher with SOC than that of TOC in both soil layers (Table 5 and Figure 7a,b).
Soil bulk density (ρb), total soil porosity (P-core), mean weight diameter (MWD), soil infiltration rate (INR), saturated hydraulic conductivity (Ks), and penetration resistance (PR).

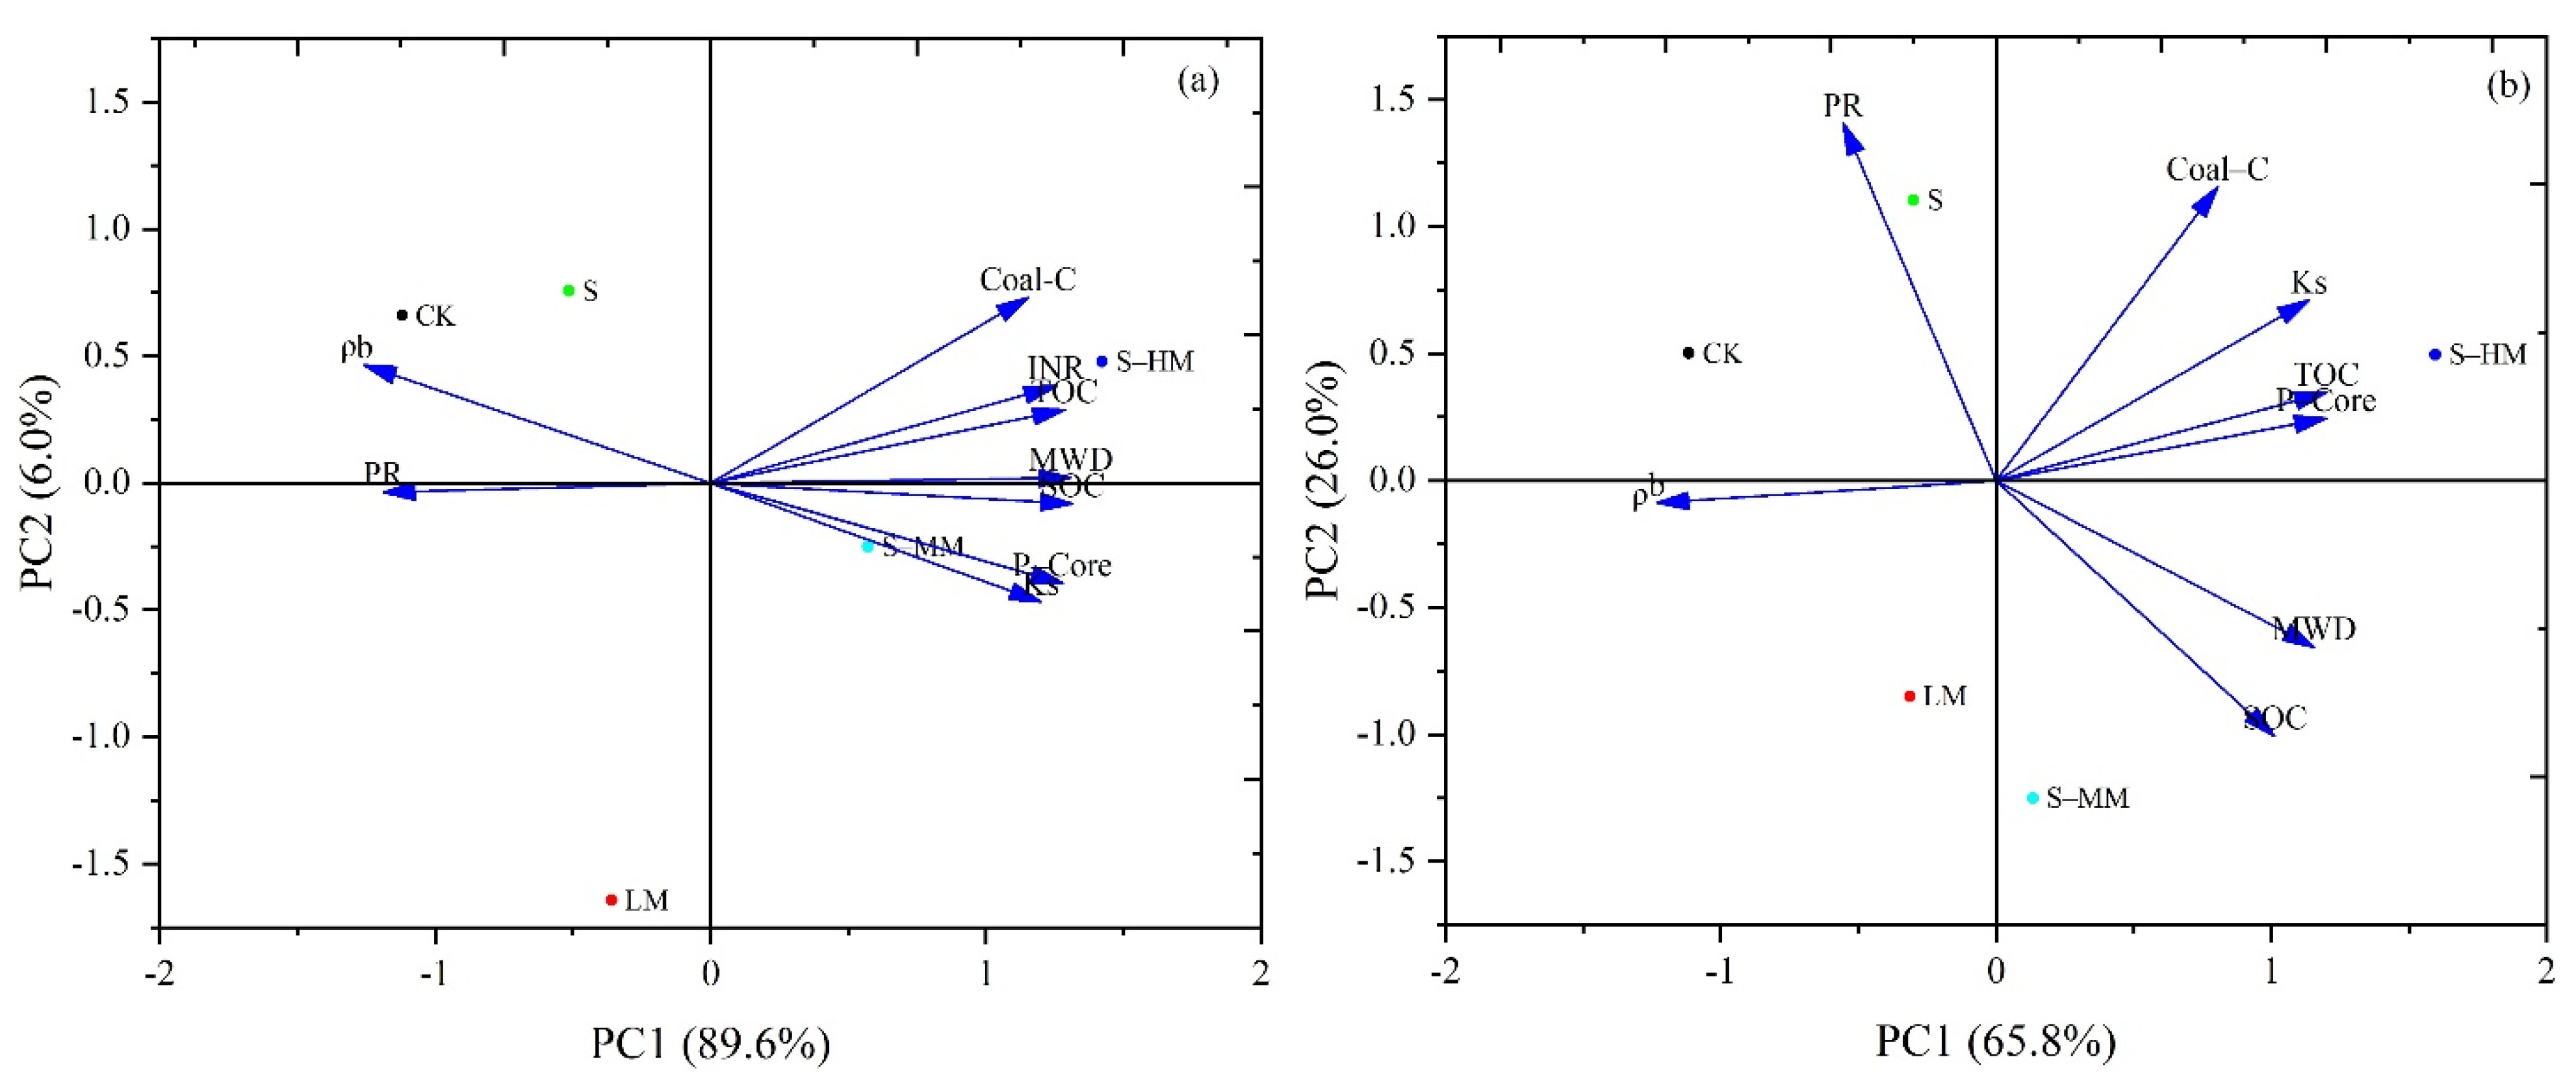
3.8. Principal Components Analysis (PCA)

Depending on the PCA of soil characteristics (Figure 8), the first two principal components explained approximately 95.60% of the total variation: PC1 (89.60%) and PC2 (6.00%) for 0–10 cm soil layer (a). While the first two principal components explained approximately 81.80% of the total variation: PC1 (65.80%) and PC2 (26.00%) for 10–20 cm soil layer (b). The 1st principal component can be interpreted as a gradient of TOC and SOC contents, with positive eigenvector values for MWD, INR, Ks, and P-core. The 2nd principal component is mainly related to a gradient of TOC and SOC contents, with negative eigenvector values for PR and ρb.
The PCA consequence of the organic waste application plotted on the scale of the first PCA components is grouped (Figure 8a,b). Axis 1 separated the S-HM, and S-MM, with high values of MWD, INR, KS, P-core, SOC, and TOC, and it is related mainly to the manure rate application. Axis 2 distinguished mainly the LM, S, and CK from the other treatments, with a tendency to high values of ρb and PR.

4. Discussion

In the mine soil, organic waste application and fertilization practices play an important function in creating a balance in the soil organic carbon level. Therefore, it is essential to determine organic (biogenic) and coal (geogenic) carbon to assess the role of each in conserving soil organic content as well as improve soil physical properties. The coal-C portion gradually increased with soil depth (>10 cm) except for the S-MM and CK treatments. This action might be due to sedimentation of coal-C in the subsurface soil layer as a result of rainfall impacts, which leached it downward. These results agreed with Ussiri and Lal [16], who reported that the contribution of coal-C was not obvious in the surface layers (<10 cm depth). This was probably due to the application of organic wastes, which have been applied at topsoil.
The SOC contents of the topsoil significantly increased with the application of organic wastes. Other comparable studies suggested that the integrated applications of organic manure had better promising effects for both recovering and increasing the SOC in mine soils than the performance of any of them individually [33,34,35,36,37]. The SOC content significantly diverged among organic waste applications at 0–10 cm soil layers, and it increased by increasing the rate of manure application (Table 3). Additionally, S and LM treatments increased SOC content compared with CK treatment, where a slight variation was observed with the CK treatment in both layers. These results agreed with those of Song et al. [37], who studied the effect of long-term fertilization under rainfed areas with continuous maize cropping in the black soil (Clay Loam) of Northeast China. They observed that farmyard manure at the rate of 23 t ha−1 or maize straw at the rate of 7.5 × 10³ kg ha−1 with balanced inorganic fertilizers at the rate of 50 kg N ha−1, 82.5 kg P2O5 ha−1 and 82.5 kg K2O ha−1 had a favorable influence on the SOC content. Generally, the SOC content balance is determined by the amount of organic wastes input and output. The increased SOC content might be explained by the amount of C input since the soil mineralization rate is commonly steady, and, therefore, the rate of SOC variation is directly linked to the C input from organic applications [38,39]. The higher application of organic wastes input in S-MM and S-HM treatments enhanced SOC and TOC contents in the soil. It led to increased maize growth compared to the control treatment, which contributed to a higher rate of root residues in the soil [37]. The application of organic wastes and root biomass input with S, LM, S-MM, and S-HM treatments contributed to the promoted C content in the soil [37,40]. Moreover, the SOC was higher in the combined application of organic wastes than that of individual application. This could be attributed to the higher C inputs in the combined applications. Moreover, low temperature and soil moisture play an important role in the mineralization of organic waste. [37,41]. Ogle et al. [42] mentioned that organic wastes have further increased SOC content in humid climates compared to arid climates. Nonetheless, they explained that the only exception to climate restrictions on SOC, is the low-rate application of organic matter that had a major impact on C inputs and SOC contents in humid and arid climate conditions. In general, these results pointed out that organic waste plays a significant role in increasing SOC contents in the soil affected by coal mining activity.
Soil bulk density (ρb) reduction and consequently the increase of total soil porosity as a result of organic wastes application might be due to the increasing of TOC or SOC (Table 4). In addition, the low ρb value of the surface layer (0–10 cm) for all treatments may be attributed to the incorporation of organic waste applications and plant residue with the surface layer [12]. Moreover, the most important factor for reducing bulk density is soil organic carbon (SOC) content that increases bioactivity and root penetration [1,41,43]. Ciećko et al. [44] observed that soil organic carbon was an important factor in increase soil total porosity and decrease in ρb. Multiple stepwise linear regression (MLR) showed that the combination of SOC and TOC significantly decreased the soil bulk density and increased the total porosity, of both soil layers (Table 5). As shown in Figure 5a–d, the soil bulk density value significantly decreased with increasing SOC content because it encourages soil particles cohesion and binds soil particles and roots, which in turn, form soil aggregates and changes soil pore size distribution [43]. Furthermore, there was a strong correlation between the SOC and both soil bulk density and total porosity. The potential influence of coal-C on soil bulk density and total porosity differed. This may be due to the texture and density of the coal waste resulting from mining activities likely close to that of those in the undisturbed soils [45,46].
Mean weight diameter (MWD), is one of the main indexes of soil aggregates stability and soil structure [37,47,48]. The results demonstrated that long-term application of organic wastes had positive effects on soil aggregates with a systematic increase in the MWD in both soil layers (Figure 3), which means soil aggregate stability was improved by organic wastes application. Soil aggregate stability is affected by many factors, of which tillage practice and organic applications are considered as the extremely essential ones. Stable and large soil aggregates were achieved by adding organic wastes compared to those in CK treatment indicating the improvement of soil physical characteristics. Qu et al. [7] reported that the MWD was strongly based on the soil binding of the reclaimed cropland soil of the Dongtan Coal Mine in Zoucheng City. Soil microbes secrete polymeric substances and plant polysaccharides led to form colloids, which drive the binding of soil particles together, while surface charge and electrostatic pull play an important role in the interaction of soil aggregations and organic polymers [49,50]. Accordingly, increasing the application of organic wastes leads to forming soil aggregates, which exhibit a gradual increase in the MWD of both soil layers. Furthermore, the application of individual organic wastes did not result in an increase in the MWD in 10–20 cm soil layers (Figure 3). The soil surface layer has a greater number of fine roots or fungi more than that of the subsurface layer, which contributes to more accumulation of active organic matter (OM) comparatively rich in monosaccharides and polysaccharides [7,12]. Multiple stepwise linear regression (MLR) showed that the combination of SOC and TOC significantly improved the aggregate stability (Table 5). The positive correlations of MWD and SOC or TOC indicated that SOC and TOC may play an important role in the soil aggregate stability (Figure 5e,f). The significant positive correlations between MWD and SOC compared to TOC suggested the important role of SOC in encouraging aggregation by binding soil particles together [51,52]. The potential influence of TOC on the aggregate stability of mine soils has been confirmed by the results of [18,19,53].
The high values of Ks and INR of the surface layer with long-term organic wastes application are an indication of improving the soil structure and porosity. However, the overall Ks values at 10–20 cm soil layer were lower than those of 0–10 cm soil layer, due to the changes in soil properties, especially slightly low organic matter content and relatively high soil bulk density of the subsurface layer. The saturated hydraulic conductivity (Table 4) and soil infiltration (Figure 4) values are extremely related to the favorable soil structure, a reduction in 𝜌b as well as increasing MWD, and SOC content. The results indicated that the increase in SOC contents had an important role to encourage the formation of stable micro-aggregates (0.25–0.053 mm) and develop soil structure, that improves soil hydraulic conductivity. These results agreed with other studies [8,20,54,55,56]. Shukla et al. [8] suggested that the decrease in ρb and the increase in SOC, MWD, and INR of the RMS are indications of the positive influence of inorganic fertilizer application on improving the soil structure and hydraulic properties. Brar et al. [13] reported that there were significant enhancements in soil infiltration rate with the long-term application of inorganic and organic fertilizers compared to non-treated plots. Generally, the high organic carbon content led to an increase in Ks value, because the organic carbon promoted the improvement of the soil aggregate structure, resulting in the possible increase in effective pore volume [43,57]. In addition, the deep roots of maize in reclaimed mine soils can increase the hydraulic conductivity [52], through the creation of root channels, crack formation, and root exudates that help to aggregates formation [35,58]. Araya and Ghezzehei, [59] observed that the most important structural variables on Ks were ρb and C content. In our study, the Ks values decreased extremely in all treatments within 10–20 cm soil layer compared with the surface layer, which was likely consequent to compaction resulting in decreased effective pore volume [43,57]. Multiple stepwise linear regression (MLR) showed that the combination of SOC and TOC significantly increased the water infiltration (Table 5). There was also a positive significant effect of SOC on Ks, while there was a negative insignificant influence of TOC on Ks occurred in the surface soil layer (Table 5), which indicated that the effect of SOC on Ks and INR was stronger than the effect of TOC (Figure 6a–c). The increase in SOC as a result of organic waste applications most likely increased the root growth, biological activity, and soil pore space that leads to an increased water infiltration rate [19].
The results displayed that the PR values varied with depth. The influence of manure applications on the penetration resistance (PR) was completely analogous in the 10–20 cm soil layer Table 4. The high values of the PR in the deep soil layer can be attributed to the formation of a hard plow pan as a result of the long-term conventional tillage. While low values of PR in the surface layer can be traced back to being influenced by the application of organic wastes at the surface soil layer [23,41,60]. Multiple stepwise linear regression (MLR) showed that the interaction between SOC and TOC significantly reduced the PR, as well as the PR and SOC, were closely related, with an insignificant association between PR and TOC (Table 4). The significant negative correlations between PR and SOC compared to TOC suggested an important role of soil organic carbon in boosting the total soil porosity (Figure 7a,b).
The principal component analysis (PCA) revealed that more TOC and SOC contents were closely related to the applications of organic wastes, while coal-C realized a high impact on TOC. Furthermore, the coal-C had a slightly positive impact on SOC content at the 0–10 cm soil layer and a slightly negative effect at the 10–20 cm soil layer (Figure 8 and Table 5). These effects depend on the ability of soil microorganisms to attack the coal carbon because it is more resistant to decomposition [45,61]. An influence in SOC content caused by coal-C was also reported by [44,62].
The PCA also pointed out that high values of ρb and PR were associated with LM, S, and CK treatments due to low SOC contents. On the other hand, manure combined with straw (S-HM and S-MM treatments) showed that ρb and PR values were reduced as a result of SOC accumulations. Manure combined with straw encouraged the cohesion of soil particles, which in turn, form soil aggregates [10,12,33,52,54]. Celik et al. [41] reported that preserving a suitable amount of organic matter with long-term application led to a decrease in both soil bulk density and penetration resistance, which enhances the aggregation index and lessens soil compaction. The results also showed a strong association between PR and coal-C, which indicates a positive impact of coal-C on those parameters in a 10–20 cm soil layer. This might be attributed to the sedimentation of coal particles at the subsurface soil layer.
Moreover, the PCA indicated that the aggregate stability and the high SOC content were closely associated with applications of manure with straw (S-HM and S-MM) in the 0–10 cm soil layer. The combined application of organic wastes and mineral fertilizer had a significant effect on increasing the aggregate stability and its development than using each material individually [7,35,39,63]. Further, SOC is considered a nutrient source for plants and microorganisms resulted in organic secretion, which leads to binding soil particles to form aggregates [60,64,65,66,67,68]. Moreover, the lower relation between TOC and MWD compared to that of SOC and MWD indicated weak effects of coal-C on soil aggregation. Some previous studies reported that the increased application of coal fly ash upon a certain proportion in the soil leads to an increase in the soil’s cloddy nature [46,69].
In this study, the application of organic wastes improved the aggregate stability and increased soil porosity and homogeneity, so allowing rapid water movement, as indicated by the higher values of Ks and INR. The high manure application significantly increased the Ks and INR values and enhanced soil aggregates. These results are in harmony with our hypothesis that long-term application of organic waste encourages soil aggregates formation, which improved water hydraulic properties. Ozlu et al. [60] reported that high manure application increased the INR rate at all sites in South Dakota. The results also showed a stronger association between INR and TOC than that of INR and SOC due to the weak correlation between INR and coal-C. Likewise, the association between the TOC and Ks was lower than that of Ks and SOC. Moreover, a negative association was found between Ks and coal-C. The adverse effect of coal-C on Ks on the soil surface may be due to the fact that coal particles absorb water as a water-repellent material. [45,61]. Adriano and Weber [61] reported that the effect of coal fly ash application on soil hydraulic conductivity depended on soil type and properties of coal wastes.

5. Conclusions

Soil cultivation and environmental balance recovery can be introduced in the areas affected by coal mining activities on the Loess Plateau of China by the application of organic wastes. It might be concluded that combined application of organic wastes (straw and manure) had a positive effect on SOC and soil physical properties than that of the individual application. The TOC and SOC were strongly and positively correlated with total soil porosity, mean weight diameter, water infiltration rate, and saturated hydraulic conductivity. The application of organic wastes plays an important role in increasing the SOC and TOC content, which promote forming stable soil aggregates as well as decrease soil bulk density. According to the principal component analysis (PCA), the soil organic carbon had strong effects on most soil physical properties more than total organic carbon. Moreover, PCA showed that soil infiltration rate and saturated hydraulic conductivity were closely associated with the improvement of aggregate stability and soil carbon components in the surface layer. This study helps us to understand the real effect of soil organic carbon from the application of organic wastes and total organic carbon in developing soil physical properties in dryland affected by coal mining activity. These findings confirmed that on dryland affected by coal mining activity, we can improve the SOC content and soil physical properties by choosing suitable management practices with high organic matter input.

Author Contributions

Conceptualization, A.A.A.; methodology, A.A.A. and S.L. software, A.A.A. and X.S.; validation, A.A.A. and H.W.; formal analysis, A.A.A. and M.Z.; investigation, A.A.A. and F.Z.; resources, A.A.A. and J.L.; data curation, A.A.A. and S.L.; writing—original draft preparation, A.A.A.; writing—review and editing, A.A.A. and L.G.; visualization, A.A.A. and H.W.; supervision, X.W.; project administration, X.W.; funding acquisition, X.W. All authors have read and agreed to the published version of the manuscript.

Funding

This research was supported by Technology Innovation Engineering Project, grant number (G202115-2), the National Key Research and Development Program of China (2018YFD0200408 and 2018YFE0112300), Fundamental Research Funds for Central Non-profit Scientific Institution (1610132019033), Science and Technology Project (2015BAD22B03), and National Natural Science Foundation of China (42007074, 51679243 and 31661143011). The APC was funded by Technology Innovation Engineering Project.

Institutional Review Board Statement

Not applicable.

Informed Consent Statement

Not applicable.

Data Availability Statement

Not applicable.

Acknowledgments

We wish to thank the editors and reviewers for their constructive comments.

Conflicts of Interest

The authors declare that they have no conflict of interest.

References

  1. Yuan, Y.; Zhao, Z.; Zhang, P.; Chen, L.; Hu, T.; Niu, S.; Bai, Z. Soil organic carbon and nitrogen pools in reclaimed mine soils under forest and cropland ecosystems in the Loess Plateau, China. Ecol. Eng. 2017, 102, 137–144. [Google Scholar] [CrossRef]
  2. Guzman, J.G.; Ussiri, D.A.N.; Lal, R. Soil physical properties following conversion of a reclaimed minesoil to bioenergy crop production. Catena 2019, 176, 289–295. [Google Scholar] [CrossRef]
  3. Qu, J.F.; Hou, Y.L.; Ge, M.Y.; Wang, K.; Liu, S.; Zhang, S.L.; Li, G.; Chen, F. Carbon dynamics of reclaimed coal mine soil under agricultural use: A chronosequence study in the Dongtan Mining Area, Shandong Province, China. Sustainability 2017, 9, 629. [Google Scholar] [CrossRef] [Green Version]
  4. Xu, Z.; Zhang, Y.; Yang, J.; Liu, F.; Bi, R.; Zhu, H.; Lv, C.; Yu, J. Effect of underground coal mining on the regional soil organic carbon pool in farmland in a mining subsidence area. Sustainability 2019, 11, 4961. [Google Scholar] [CrossRef] [Green Version]
  5. Feng, Y.; Wang, J.; Bai, Z.; Reading, L. Effects of surface coal mining and land reclamation on soil properties: A review. Earth-Sci. Rev. 2019, 191, 12–25. [Google Scholar] [CrossRef]
  6. Almeida, J.R.C.; Akkal, D.; Hassel, S.; Travis, M.J.; Banihashemi, L.; Kerr, N.; Kupfer, D.J.; Phillips, M.L. Reduced gray matter volume in ventral prefrontal cortex but not amygdala in bipolar disorder: Significant effects of gender and trait anxiety. Psychiatry Res. Neuroimaging 2009, 171, 54–68. [Google Scholar] [CrossRef] [Green Version]
  7. Qu, J.F.; Tan, M.; Hou, Y.L.; Ge, M.Y.; Wang, A.N.; Wang, K.; Shan, J.X.; Chen, F. Effects of the stability of reclaimed soil aggregates on organic carbon in coal mining subsidence areas. Am. Soc. Agric. Biol. Eng. 2018, 34, 843–854. [Google Scholar] [CrossRef]
  8. Shukla, M.K.; Lal, R.; Underwood, J.; Ebinger, M. Physical and Hydrological Characteristics of Reclaimed Minesoils in Southeastern Ohio. Soil Sci. Soc. Am. J. 2004, 68, 1352–1359. [Google Scholar] [CrossRef]
  9. Ussiri, D.A.N.; Lal, R. Carbon sequestration in reclaimed minesoils. Crc. Crit. Rev. Plant Sci. 2005, 24, 151–165. [Google Scholar] [CrossRef]
  10. Jing, Z.; Wang, J.; Zhu, Y.; Feng, Y. Effects of land subsidence resulted from coal mining on soil nutrient distributions in a loess area of China. J. Clean. Prod. 2018, 177, 350–361. [Google Scholar] [CrossRef]
  11. Miao, Z.; Marrs, R. Ecological restoration and land reclamation in open-cast mines in Shanxi Province, China. J. Environ. Manag. 2000, 59, 205–215. [Google Scholar] [CrossRef]
  12. Ussiri, D.A.N.; Lal, R. Land Management Effects on Carbon Sequestration and Soil Properties in Reclaimed Farmland of Eastern Ohio, USA. Open J. Soil Sci. 2013, 3, 46–57. [Google Scholar] [CrossRef] [Green Version]
  13. Brar, B.S.; Singh, J.; Singh, G.; Kaur, G. Effects of long term application of inorganic and organic fertilizers on soil organic carbon and physical properties in maize-wheat rotation. Agronomy 2015, 5, 220–238. [Google Scholar] [CrossRef]
  14. Chatterjee, A.; Shrestha, R.L.R.K.; Ussiri, D.A.N. Soil carbon pools of reclaimed minesoils under grass and forest landuses. Land Degrad. Dev. 2009, 20, 300–307. [Google Scholar] [CrossRef]
  15. Ussiri, D.A.N.; Jacinthe, P.A.; Lal, R. Methods for determination of coal carbon in reclaimed minesoils: A review. Geoderma 2014, 214, 155–167. [Google Scholar] [CrossRef]
  16. Ussiri, D.A.N.; Lal, R. Method for Determining Coal Carbon in the Reclaimed Minesoils Contaminated with Coal. Soil Sci. Soc. Am. J. 2008, 72, 231–237. [Google Scholar] [CrossRef]
  17. Das, R.; Maiti, S.K. Importance of carbon fractionation for the estimation of carbon sequestration in reclaimed coalmine soils—A case study from Jharia. Ecol. Eng. 2016, 90, 135–140. [Google Scholar] [CrossRef]
  18. Koſodziej, B.; Bryk, M.; Sſowiſska-Jurkiewicz, A.; Otremba, K.; Gilewska, M. Soil physical properties of agriculturally reclaimed area after lignite mine: A case study from central Poland. Soil Tillage Res. 2016, 163, 54–63. [Google Scholar] [CrossRef]
  19. Luna, L.; Vignozzi, N.; Miralles, I.; Solé-Benet, A. Organic amendments and mulches modify soil porosity and infiltration in semiarid mine soils. L. Degrad. Dev. 2018, 29, 1019–1030. [Google Scholar] [CrossRef]
  20. Alagna, V.; Di Prima, S.; Rodrigo-Comino, J.; Iovino, M.; Pirastru, M.; Keesstra, S.D.; Novara, A.; Cerdà, A. The impact of the age of vines on soil hydraulic conductivity in vineyards in eastern Spain. Water 2017, 10, 14. [Google Scholar] [CrossRef] [Green Version]
  21. IUSS Working Group WRB. World Reference Base for Soil Resources: A Framework for International Classification, Correlation and Communication; FAO: Rome, Italy, 2006; Available online: http://www.fao.org/3/a0510e/A0510E.pdf (accessed on 11 May 2021).
  22. Wang, X.; Cai, D.; Hoogmoed, W.B.; Perdok, U.D.; Oenema, O. Crop residue, manure and fertilizer in dryland maize under reduced tillage in northern China: I grain yields and nutrient use efficiencies. Nutr. Cycl. Agroecosyst. 2007, 79, 1–16. [Google Scholar] [CrossRef] [Green Version]
  23. Xin, X.; Zhang, J.; Zhu, A.; Zhang, C. Effects of long-term (23 years) mineral fertilizer and compost application on physical properties of fluvo-aquic soil in the North China Plain. Soil Tillage Res. 2016, 156, 166–172. [Google Scholar] [CrossRef]
  24. Wang, X.; Cai, D.; Wu, H.; Hoogmoed, W.B.; Oenema, O. Effects of variation in rainfall on rainfed crop yields and water use in dryland farming areas in China. Arid Land Res. Manag. 2016, 30, 1–24. [Google Scholar] [CrossRef]
  25. Li, S.; Wu, X.; Liang, G.; Gao, L.; Wang, B.; Lu, J.; Abdelrhman, A.A.; Song, X.; Zhang, M.; Zheng, F.; et al. Is least limiting water range a useful indicator of the impact of tillage management on maize yield? Soil Tillage Res. 2020, 199. [Google Scholar] [CrossRef]
  26. Chen, J.-S.; Chiu, C.-Y. Characterization of soil organic matter in different particle-size fractions in humid subalpine soils by CP/MAS 13C NMR. Geoderma 2003, 117, 129–141. [Google Scholar] [CrossRef]
  27. Page, A.L.; Miller, R.H.; Keeney, D.R. Methods of Soil Analysis. Part 2. American Society of Agronomy; Soil Science Society of America: Madison, WI, USA, 1982. [Google Scholar]
  28. Elliott, E.T. Aggregate structure and carbon, nitrogen, and phosphorus in native and cultivated soils 1. Soil Sci. Soc. Am. J. 1986, 50, 627–633. [Google Scholar] [CrossRef]
  29. Mazurak, A.P. Effect of gaseous phase on water-stable synthetic aggregates. Soil Sci. 1950, 69, 135–148. [Google Scholar] [CrossRef]
  30. Youker, R.E.; McGuinness, J.L. A short method of obtaining mean weight-diameter values of aggregate analyses of soils. Soil Sci. 1957, 83, 291–294. [Google Scholar] [CrossRef]
  31. US Department of Agriculture. USDA Soil quality test kit guide. In USDA Agricultural Research Service: National Resources Conservation Service; US Department of Agriculture: Washington, DC, USA, 1999; pp. 3–4. [Google Scholar]
  32. Klute, A.; Dirksen, C. Hydraulic conductivity of saturated soils. In Methods of Soil Analysis; ASA and SSSA: Madison, WI, USA, 1986; pp. 694–700. [Google Scholar]
  33. Rodríguez-Vila, A.; Asensio, V.; Forján, R.; Covelo, E.F. Build-up of carbon fractions in technosol-biochar amended partially reclaimed mine soil grown with Brassica juncea. J. Soils Sediments 2016, 16, 1529–1537. [Google Scholar] [CrossRef]
  34. Li, T.; Gao, J.; Hong, J.; Xie, Y.; Gao, Z.; Meng, H.; Li, L.; Meng, L. Variation of nutrients and selected soil properties in reclaimed soil of different ages at a coal-mining subsidence area on the Loess Plateau, China. Ekoloji 2018, 27, 547–554. [Google Scholar]
  35. Jiang, H.; Han, X.; Zou, W.; Hao, X.; Zhang, B. Seasonal and long-term changes in soil physical properties and organic carbon fractions as affected by manure application rates in the Mollisol region of Northeast China. Agric. Ecosyst. Environ. 2018, 268, 133–143. [Google Scholar] [CrossRef]
  36. Zhang, M.; Cheng, G.; Feng, H.; Sun, B.; Zhao, Y.; Chen, H.; Chen, J.; Dyck, M.; Wang, X.; Zhang, J.; et al. Effects of straw and biochar amendments on aggregate stability, soil organic carbon, and enzyme activities in the Loess Plateau, China. Environ. Sci. Pollut. Res. 2017, 24, 10108–10120. [Google Scholar] [CrossRef]
  37. Song, Z.W.; Zhu, P.; Gao, H.J.; Peng, C.; Deng, A.X.; Zheng, C.Y.; Mannaf, M.A.; Islam, M.N.; Zhang, W.J. Effects of long-term fertilization on soil organic carbon content and aggregate composition under continuous maize cropping in Northeast China. J. Agric. Sci. 2015, 153, 236–244. [Google Scholar] [CrossRef]
  38. Jastrow, J.D.; Amonette, J.E.; Bailey, V.L. Mechanisms controlling soil carbon turnover and their potential application for enhancing carbon sequestration. Clim. Chang. 2007, 80, 5–23. [Google Scholar] [CrossRef]
  39. Zhou, H.; Peng, X.; Perfect, E.; Xiao, T.; Peng, G. Effects of organic and inorganic fertilization on soil aggregation in an Ultisol as characterized by synchrotron based X-ray micro-computed tomography. Geoderma 2013, 195, 23–30. [Google Scholar] [CrossRef]
  40. Li, J.; Li, H.; Zhang, Q.; Shao, H.; Gao, C.; Zhang, X. Effects of fertilization and straw return methods on the soil carbon pool and CO2 emission in a reclaimed mine spoil in Shanxi Province, China. Soil Tillage Res. 2019, 195, 104361. [Google Scholar] [CrossRef]
  41. Celik, I.; Gunal, H.; Budak, M.; Akpinar, C. Effects of long-term organic and mineral fertilizers on bulk density and penetration resistance in semi-arid Mediterranean soil conditions. Geoderma 2010, 160, 236–243. [Google Scholar] [CrossRef]
  42. Ogle, S.M.; Breidt, F.J.; Paustian, K. Agricultural Management Impacts on Soil Organic Carbon Storage under Moist and Dry Climatic Conditions of Temperate and Tropical Regions. Biogeochemistry 2005, 72, 87–121. [Google Scholar] [CrossRef]
  43. Hati, K.M.; Swarup, A.; Dwivedi, A.K.; Misra, A.K.; Bandyopadhyay, K.K. Changes in soil physical properties and organic carbon status at the topsoil horizon of a vertisol of central India after 28 years of continuous cropping, fertilization and manuring. Agric. Ecosyst. Environ. 2007, 119, 127–134. [Google Scholar] [CrossRef]
  44. Ciećko, Ż.; Żołnowski, A.C.; Chelstowski, A. Long-term effect of coal fly ash application on soil total nitrogen and organic carbon concentrations. In Application of Phytotechnologies for Cleanup of Industrial, Agricultural, and Wastewater Contamination; Springer: Berlin/Heidelberg, Germany, 2010; pp. 147–158. [Google Scholar]
  45. Shaheen, S.M.; Hooda, P.S.; Tsadilas, C.D. Opportunities and challenges in the use of coal fly ash for soil improvements—A review. J. Environ. Manag. 2014, 145, 249–267. [Google Scholar] [CrossRef] [Green Version]
  46. Ukwattage, N.L.; Ranjith, P.G.; Bouazza, M. The use of coal combustion fly ash as a soil amendment in agricultural lands (with comments on its potential to improve food security and sequester carbon). Fuel 2013, 109, 400–408. [Google Scholar] [CrossRef]
  47. Guo, Z.; Zhang, L.; Yang, W.; Hua, L.; Cai, C. Aggregate stability under long-term fertilization practices: The case of eroded ultisols of south-central China. Sustainability 2019, 11, 1169. [Google Scholar] [CrossRef] [Green Version]
  48. Jiang, M.; Wang, X.; Liusui, Y.; Han, C.; Zhao, C.; Liu, H. Variation of soil aggregation and intra-aggregate carbon by long-term fertilization with aggregate formation in a grey desert soil. Catena 2017, 149, 437–445. [Google Scholar] [CrossRef]
  49. Watteau, F.; Villemin, G.; Burtin, G.; Jocteur-Monrozier, L. Root impact on the stability and types of micro-aggregates in silty soil under maize. Eur. J. Soil Sci. 2006, 57, 247–257. [Google Scholar] [CrossRef]
  50. Colica, G.; Li, H.; Rossi, F.; Li, D.; Liu, Y.; De Philippis, R. Microbial secreted exopolysaccharides affect the hydrological behavior of induced biological soil crusts in desert sandy soils. Soil Biol. Biochem. 2014, 68, 62–70. [Google Scholar] [CrossRef]
  51. Krümmelbein, J.; Horn, R.; Raab, T.; Bens, O.; Hüttl, R.F. Soil physical parameters of a recently established agricultural recultivation site after brown coal mining in Eastern Germany. Soil Tillage Res. 2010, 111, 19–25. [Google Scholar] [CrossRef]
  52. Krümmelbein, J.; Raab, T. Development of soil physical parameters in agricultural reclamation after brown coal mining within the first four years. Soil Tillage Res. 2012, 125, 109–115. [Google Scholar] [CrossRef]
  53. Yunusa, I.A.M.; Manoharan, V.; Odeh, I.O.A.; Shrestha, S.; Skilbeck, C.G.; Eamus, D. Structural and hydrological alterations of soil due to addition of coal fly ash. J. Soils Sediments 2011, 11, 423–431. [Google Scholar] [CrossRef]
  54. Shi, Y.; Zhao, X.; Gao, X.; Zhang, S.; Wu, P. The Effects of Long-Term Fertiliser Applications on Soil Organic Carbon and Hydraulic Properties of a Loess Soil in China. L. Degrad. Dev. 2016, 67, 60–67. [Google Scholar] [CrossRef]
  55. Meurer, K.H.E.; Franko, U.; Stange, C.F.; Dalla Rosa, J.; Madari, B.E.; Jungkunst, H.F. Direct nitrous oxide (N2O) fluxes from soils under different land use in Brazil—a critical review. Environ. Res. Lett. 2016, 11, 023001. [Google Scholar] [CrossRef]
  56. Benjamin, J.G.; Mikha, M.M.; Vigil, M.F. Organic Carbon Effects on Soil Physical and Hydraulic Properties in a Semiarid Climate. Soil Sci. Soc. Am. J. 2008, 72, 1357–1362. [Google Scholar] [CrossRef] [Green Version]
  57. Mandal, N.; Dwivedi, B.S.; Datta, S.P.; Meena, M.C.; Tomar, R.K. Soil hydrophysical properties under different nutrient management practices, their relationship with soil organic carbon fractions and crop yield under pigeonpea-wheat sequence. J. Plant Nutr. 2019, 42, 384–400. [Google Scholar] [CrossRef]
  58. Angers, D.A.; Caron, J. Plant-induced changes in soil structure: Processes and feedbacks. Biogeochemistry 1998, 42, 55–72. [Google Scholar] [CrossRef]
  59. Araya, S.N.; Ghezzehei, T.A. Using machine learning for prediction of saturated hydraulic conductivity and its sensitivity to soil structural perturbations. Water Resour. Res. 2019, 55, 5715–5737. [Google Scholar] [CrossRef]
  60. Ozlu, E.; Kumar, S.; Arriaga, F.J. Responses of Long-Term Cattle Manure on Soil Physical and Hydraulic Properties under a Corn–Soybean Rotation at Two Locations in Eastern South Dakota. Soil Sci. Soc. Am. J. 2019, 83, 1459–1467. [Google Scholar] [CrossRef]
  61. Adriano, D.C.; Weber, J.T. Influence of fly ash on soil physical properties and turfgrass establishment. J. Environ. Qual. 2001, 30, 596–601. [Google Scholar] [CrossRef] [PubMed]
  62. Ciećko, Ż.; Żołnowski, A.C.; Madej, M.; Wasiak, G.; Lisowski, J. Long-Term Effects of Hard Coal Fly Ash on Selected Soil Properties. Pol. J. Environ. Stud. 2015, 24, 1949–1957. [Google Scholar] [CrossRef]
  63. Zhao, H.; Shar, A.G.; Li, S.; Chen, Y.; Shi, J.; Zhang, X.; Tian, X. Effect of straw return mode on soil aggregation and aggregate carbon content in an annual maize-wheat double cropping system. Soil Tillage Res. 2018, 175, 178–186. [Google Scholar] [CrossRef]
  64. Zhang, J.; Sun, C.; Liu, G.; Xue, S. Effects of long-term fertilisation on aggregates and dynamics of soil organic carbon in a semi-arid agro-ecosystem in China. PeerJ 2018. [Google Scholar] [CrossRef]
  65. Bouajila, A.; Gallali, T. Land use effect on soil and particulate organic carbon, and aggregate stability in some soils in Tunisia. Afr. J. Agric. Res. 2010, 5, 764–774. [Google Scholar] [CrossRef]
  66. Wang, B.; Gao, L.; Yu, W.; Wei, X.; Li, J.; Li, S.; Song, X.; Liang, G.; Cai, D.; Wu, X. Distribution of soil aggregates and organic carbon in deep soil under long-term conservation tillage with residual retention in dryland. J. Arid Land 2019, 11, 241–254. [Google Scholar] [CrossRef] [Green Version]
  67. Zhang, P.; Wei, T.; Li, Y.; Wang, K.; Jia, Z.; Han, Q.; Ren, X. Effects of straw incorporation on the stratification of the soil organic C, total N and C:N ratio in a semiarid region of China. Soil Tillage Res. 2015, 153, 28–35. [Google Scholar] [CrossRef]
  68. Zhang, P.; Wei, T.; Jia, Z.; Han, Q.; Ren, X.; Li, Y. Effects of straw incorporation on soil organic matter and soil water-stable aggregates content in semiarid regions of Northwest China. PLoS ONE 2014, 9, e92839. [Google Scholar] [CrossRef] [PubMed]
  69. Salé, L.Y.; Chanasyk, D.S.; Naeth, A.M.; Mine, R. Temporal influence of fly ash on soil bulk density and aggregate size distribution. In Proceedings of the 20th Annual British Columbia Mine Reclamation Symposium, Kamloops, Canada, 17–20 June 1996; pp. 184–195. [Google Scholar]
Figure 1. A schematic diagram showing the steps and processes required to removing soil organic carbon for coal-derived C quantification of soil affected by coal mining activities (modified from Ussiri and Lal [16]).
Sustainability 13 05686 g001
Figure 2. Soil aggregate size distributions (%) for the 0–10 cm (a) and 10–20 cm (b) soil layers affected by the long-term application of organic wastes (n = 3). Lowercase letters indicate significant differences (p < 0.05) between treatments. Error bars represent standard errors of the mean. In the figure, (CK) unfertilized control, (S) maize straw, (LM) low-rate cattle manure, (S-MM) maize straw, plus medium-rate cattle manure, and (S-HM) maize straw plus high-rate cattle manure.
Sustainability 13 05686 g002
Figure 3. The mean weight diameter (MWD) for the 0–10 cm and 10–20 cm soil layers affected by the long-term application of organic wastes (n = 3). Lowercase letters indicate significant differences (p < 0.05) between treatments. Error bars represent standard errors of the mean.
Sustainability 13 05686 g003
Figure 4. The soil infiltration rate (INR) is affected by the long-term application of organic wastes (n = 6). Lowercase letters indicate significant differences (p < 0.05) between treatments. Error bars represent standard errors of the mean.
Sustainability 13 05686 g004
Figure 5. Relationships between the SOC or TOC content and soil bulk density (ρb) of (a) 0–10 cm layer and (b) 10–20 cm layer and the total porosity (P-core) of (c) 0–10 cm layer and (d) 10–20 cm layer and the mean weight diameter (MWD) of (e) 0–10 cm layer and (f) 10–20 cm layer in studied soil. Yellow dots represent SOC content and red ones TOC content, respectively. Correlation (r) is significant at ** p < 0.01, and * p < 0.05.
Sustainability 13 05686 g005
Figure 6. Relationships between the SOC or TOC content and (a) soil infiltration rate (INR) and saturated hydraulic conductivity (Ks) of (b) 0–10 cm layer and (c) 10–20 cm layer in studied soil. Yellow dots represent SOC content and red ones TOC content, respectively. Correlation (r) is significant at ** p < 0.01, and * p < 0.05.
Sustainability 13 05686 g006
Figure 7. Relationships between the SOC or TOC content and penetration resistance (PR) of (a) 0–10 cm layer and (b) 10–20 cm layer in studied soil. Yellow dots represent SOC content and red ones TOC content, respectively. Correlation (r) is significant at ** p < 0.01.
Sustainability 13 05686 g007
Figure 8. Principal component analysis (PCA) using the variables total organic carbon (TOC) and soil organic carbon (SOC), coal carbon (coal-C), bulk density (ρb), total porosity (P-core), mean weight diameter (MWD), penetration resistance (PR), and saturated hydraulic conductivity (Ks), of (a) 0–10 cm layer and (b) 10–20 cm layer, while the soil infiltration rate (INR) for surface (0–10 cm) layer. In the figure, (CK) unfertilized control, (S) maize straw, (LM) low-rate cattle manure, (S-MM) maize straw, plus medium-rate cattle manure, and (S-HM) maize straw plus high-rate cattle manure.
Sustainability 13 05686 g008
Table 1. The meteorological data in Shouyang through the period of 1992 to 2018.
Period1992–2018Source
MonthJanuaryFebruaryMarchAprilMayJuneJulyAugustSeptemberOctoberNovemberDecemberYear
Mean monthly precipitation(mm)2.54.813.322.43555.4120.111262.731.610.21.5471.5Wang et al. [24] and Li et al. [25]
2018
Mean low °C−1414182328272620159115.3
Mean low °C−14−14−2381318167−1−5−131.3
Mean monthly precipitation(mm)1.60.08.131.259.058.4169.0118.741.58.35.90.0501.8
Table 2. Some soil physical and chemical properties of the tested soils (0–10; 10–20 cm) in 1992.
Soil Layer (cm)Soil Particle Size Distribution (g kg−1)Available Soil Nutrient (mg kg−1)SOC (g kg−1)pH
SandSiltClayNPK
0–10586.00357.0058.00588.39625.67.9
10–20597.00346.0058.00526.993257.9
Table 3. Soil carbon components (TOC, SOC, and Coal-C) for the 0–10 cm and 10–20 cm soil depths affected by the long-term organic material applications.
Layer (cm)TreatmentTOCSOCCoal-C
g C kg−1
0–10CK26.20 ± 0.40 b15.16 ± 0.05 d11.03 ± 0.31 a
S27.30 ± 0.07 ab15.72 ± 0.09 c11.58 ± 0.05 a
LM26.75 ± 0.06 ab15.82 ± 0.08 c10.93 ± 0.03 a
S-MM28.10 ± 0.21 ab16.43 ± 0.06 b11.64 ± 0.26 a
S-HM29.04 ± 0.9 a16.91 ± 0.09 a12.42 ± 0.69 a
10–20CK23.63 ± 0.40 d12.94 ± 0.18 c10.69 ± 0.33 b
S26.71 ± 0.07 b13.57 ± 0.22 b13.14 ± 0.59 a
LM26.06 ± 0.06 b14.88 ± 0.11 a11.18 ± 0.54 b
S-MM25.51 ± 0.21 b15.38 ± 0.28 a10.13 ± 0.11 b
S-HM29.04 ± 0.20 a15.41 ± 0.13 a13.72 ± 0.11 a
TOC = total soil organic carbon; SOC = biogenic carbon; Coal-C = coal carbon. Data are represented as means ± S.E (n = 3). Different lowercase letters in the same column indicate significant differences at p < 0.05 according to Duncan’s multiple range tests.
Table 4. Soil bulk density (ρb), total porosity (P-core), saturated hydraulic conductivity (Ks), and penetration resistance (PR) for the 0–10 cm and 10–20 cm soil layers affected by the long-term application of organic materials.
Layer (cm)TreatmentρbP-CoreKsPR
mg m−3cm cm−3cm h−1MPa
0–10CK1.28 ± 0.02 a0.51 ± 0.0064 d0.94 ± 0.13 b2.96 ± 0.01 a
S1.25 ± 0.01 b0.52 ± 0.0045 cd1.08 ± 0.29 b3.12 ± 0.13 a
LM1.22 ± 0.01 bc0.53 ± 0.0020 bc1.50 ± 0.15 a2.93 ± 0.02 a
S-MM1.20 ± 0.02 c0.54 ± 0.0072 ab1.51 ± 0.15 a2.10 ± 0.18 b
S-HM1.18 ± 0.01 c0.54 ± 0.0054 a2.03 ± 0.04 a2.07 ± 0.01 a
10–20CK1.41 ± 0.01 a0.46 ± 0.0011 c0.53 ± 0.14 a7.83 ± 0.02 a
S1.41 ± 0.01 a0.46 ± 0.0013 c0.62 ± 0.1 a7.55 ± 0.50 a
LM1.40 ± 0.01 a0.45 ± 0.0010 c0.56 ± 0.1 a5.10 ± 0.04 b
S-MM1.38 ± 0.01 b0.47 ± 0.0034 b0.61 ± 0.1 a5.16 ± 0.01 b
S-HM1.29 ± 0.01 c0.50 ± 0.0025 a0.70 ± 0.03 a6.09 ± 0.15 b
Data are represented as means ± S.E (n = 6). Different lowercase letters in the same column indicate significant differences at p < 0.05 according to Duncan’s multiple range tests.
Table 5. Multiple stepwise linear regression (MLR) between SOC, as well as TOC content, and some soil physical properties of the 0–10 cm and 10–20 cm soil layers affected by the long-term application of organic materials.
Soil Layer (cm)ParameterEquationR2F
0–10Ρb2.12 − (0.06 × SOC) + (0.004 × TOC)0.6712.10
P-core18.82 + (2.31 × SOC) − (0.12 × TOC)0.6712.20
MWD−0.54 + (0.061 × SOC) − (0.002 × TOC)0.9381.25
INR−1583.37 + (94.20 × SOC) + (9.20 × TOC)0.8430.54
Ks−8.10 + (0.70 × SOC) − (0.06 × TOC)0.6310.36
PR13.20 − (0.76 × SOC) + (0.054 × TOC)0.7215.46
10–20Ρb1.93 − (0.012 × SOC) − (0.015 × TOC)0.609.20
P-core26.77 + (0.28 × SOC) + (0.60 × TOC)0.546.88
MWD0.023 + (0.02 × SOC) + (0.003 × TOC)0.6513.56
INR−790.376 + (22.52 × SOC) + (23.36 × TOC)0.6310.33
Ks0.09 + (0.003 × SOC) + (0.02 × TOC)0.660.46
PR17.66 − (1.20 × SOC) + (0.21 × TOC)0.6712.37
Publisher’s Note: MDPI stays neutral with regard to jurisdictional claims in published maps and institutional affiliations.

