


Evaluating the Impact of Crop Layout Changes on N and P Nutrient Balance: A Case Study in the West Liaohe River Basin, China


Abstract
:1. Introduction
2. Materials and Methods
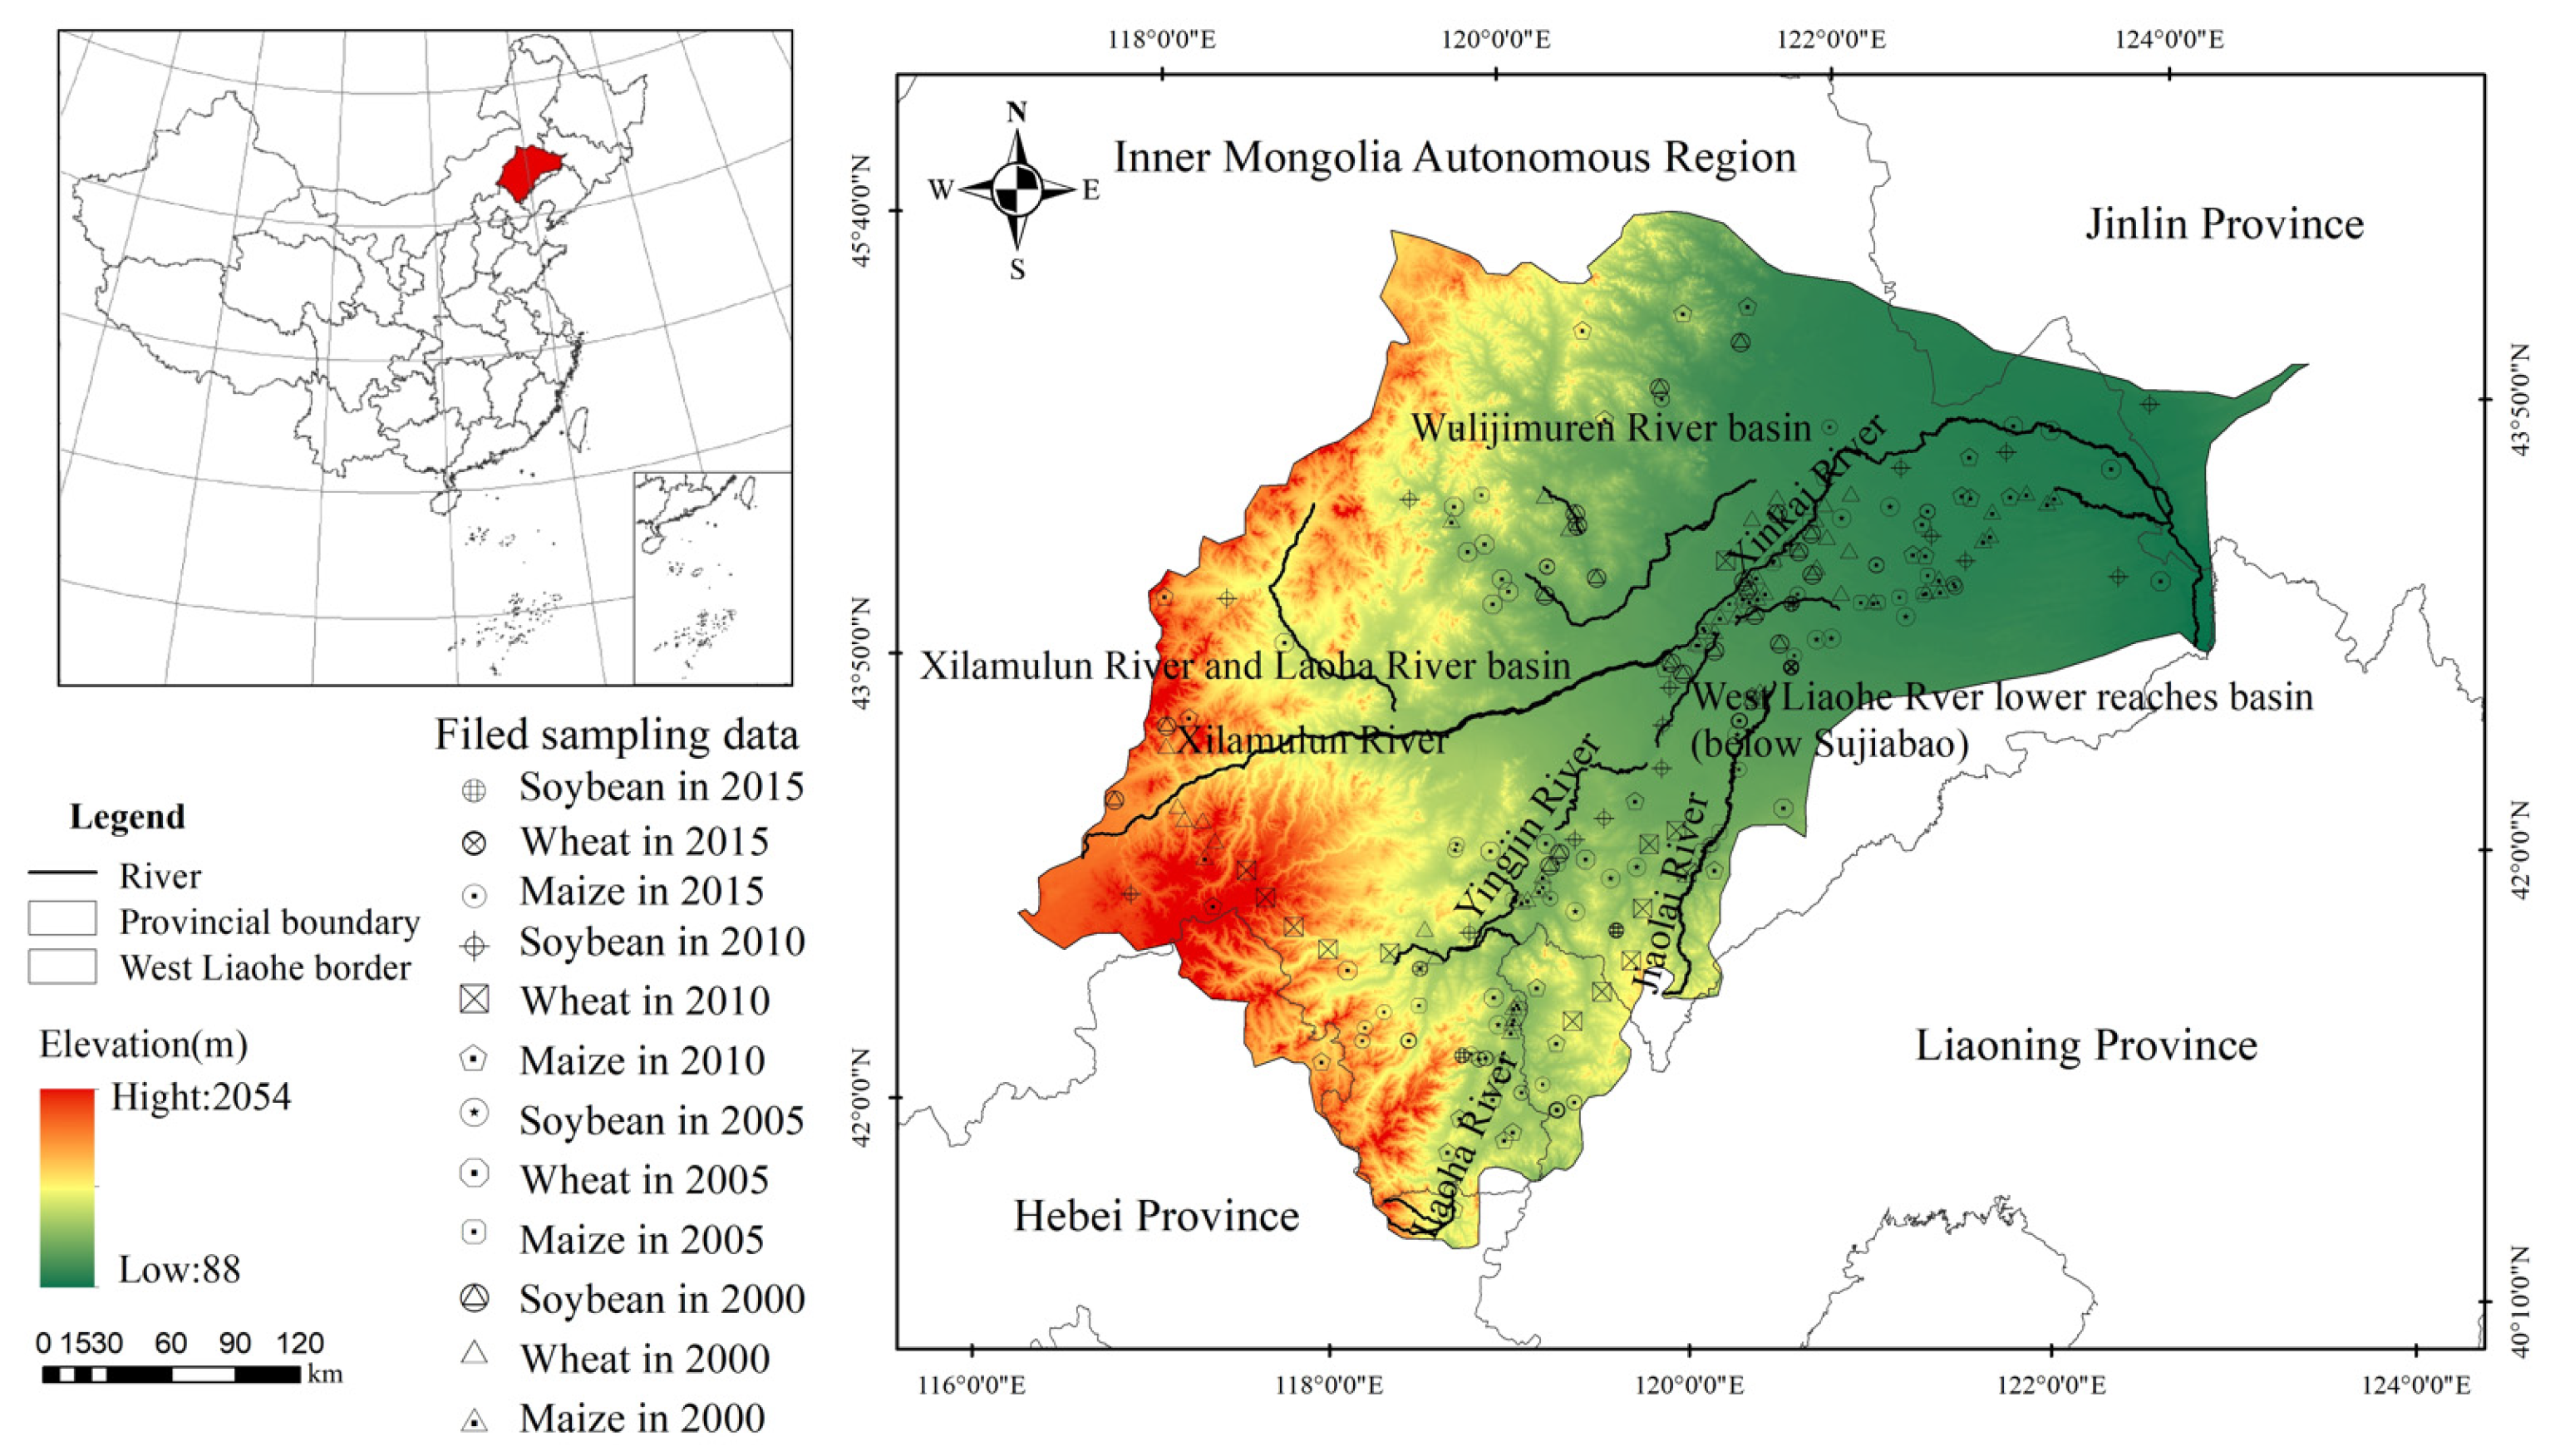
2.1. Study Area
2.2. Data Sources
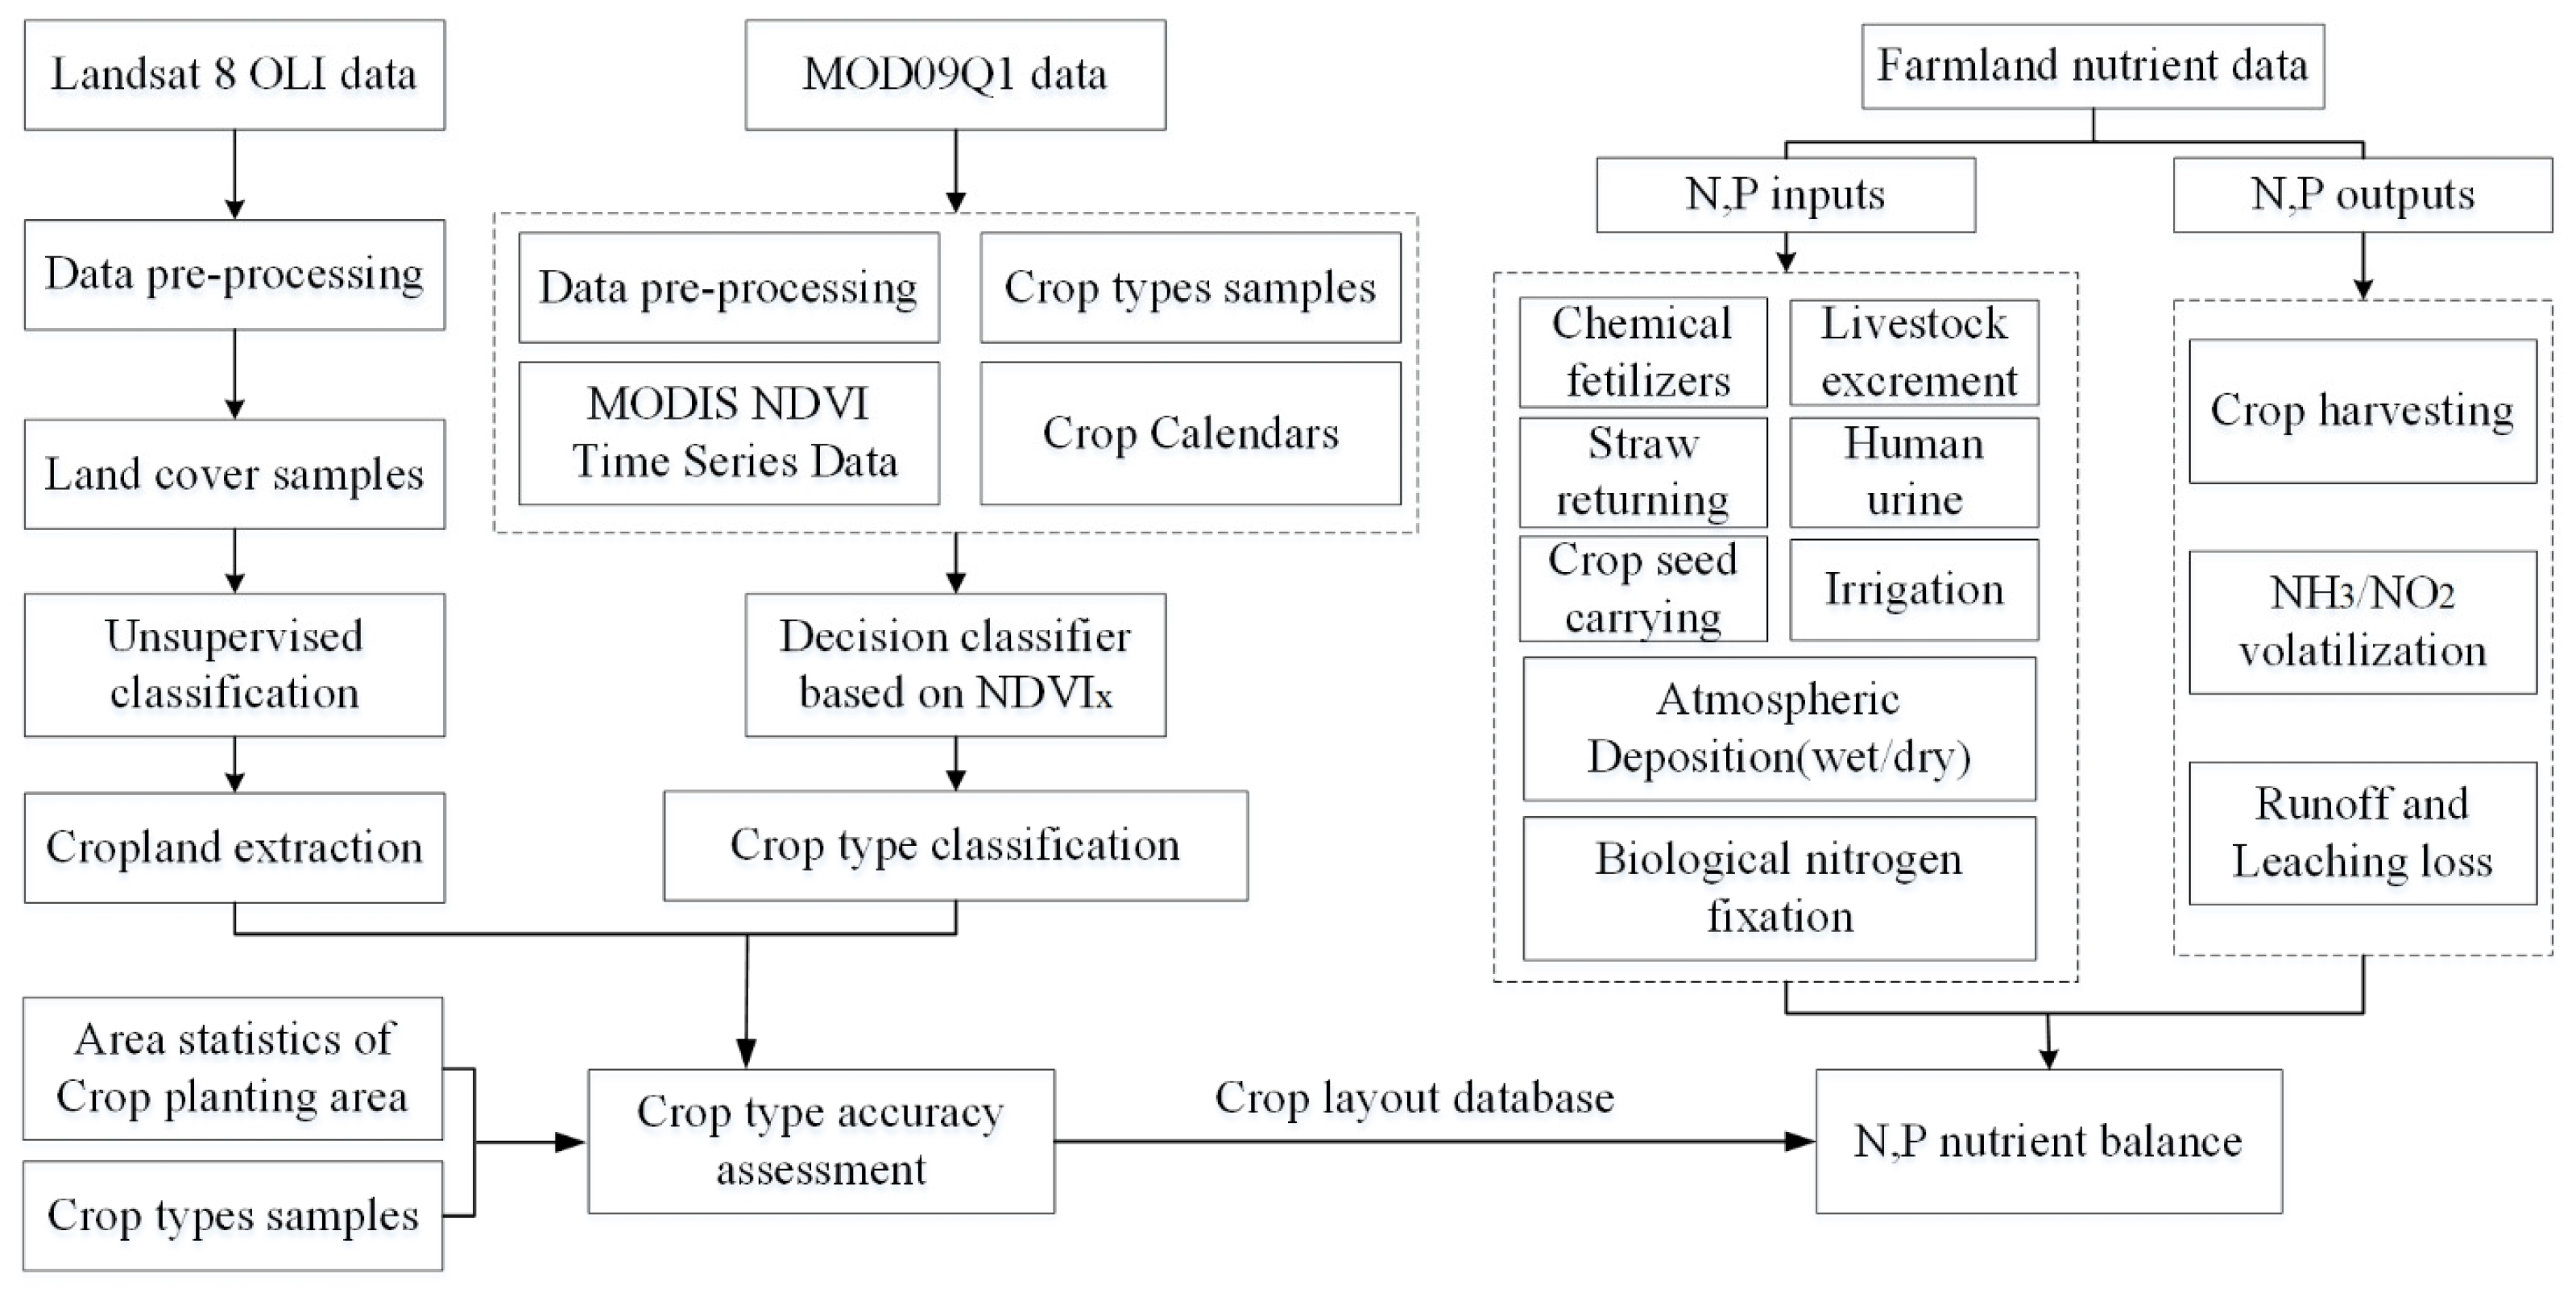
2.3. Methods
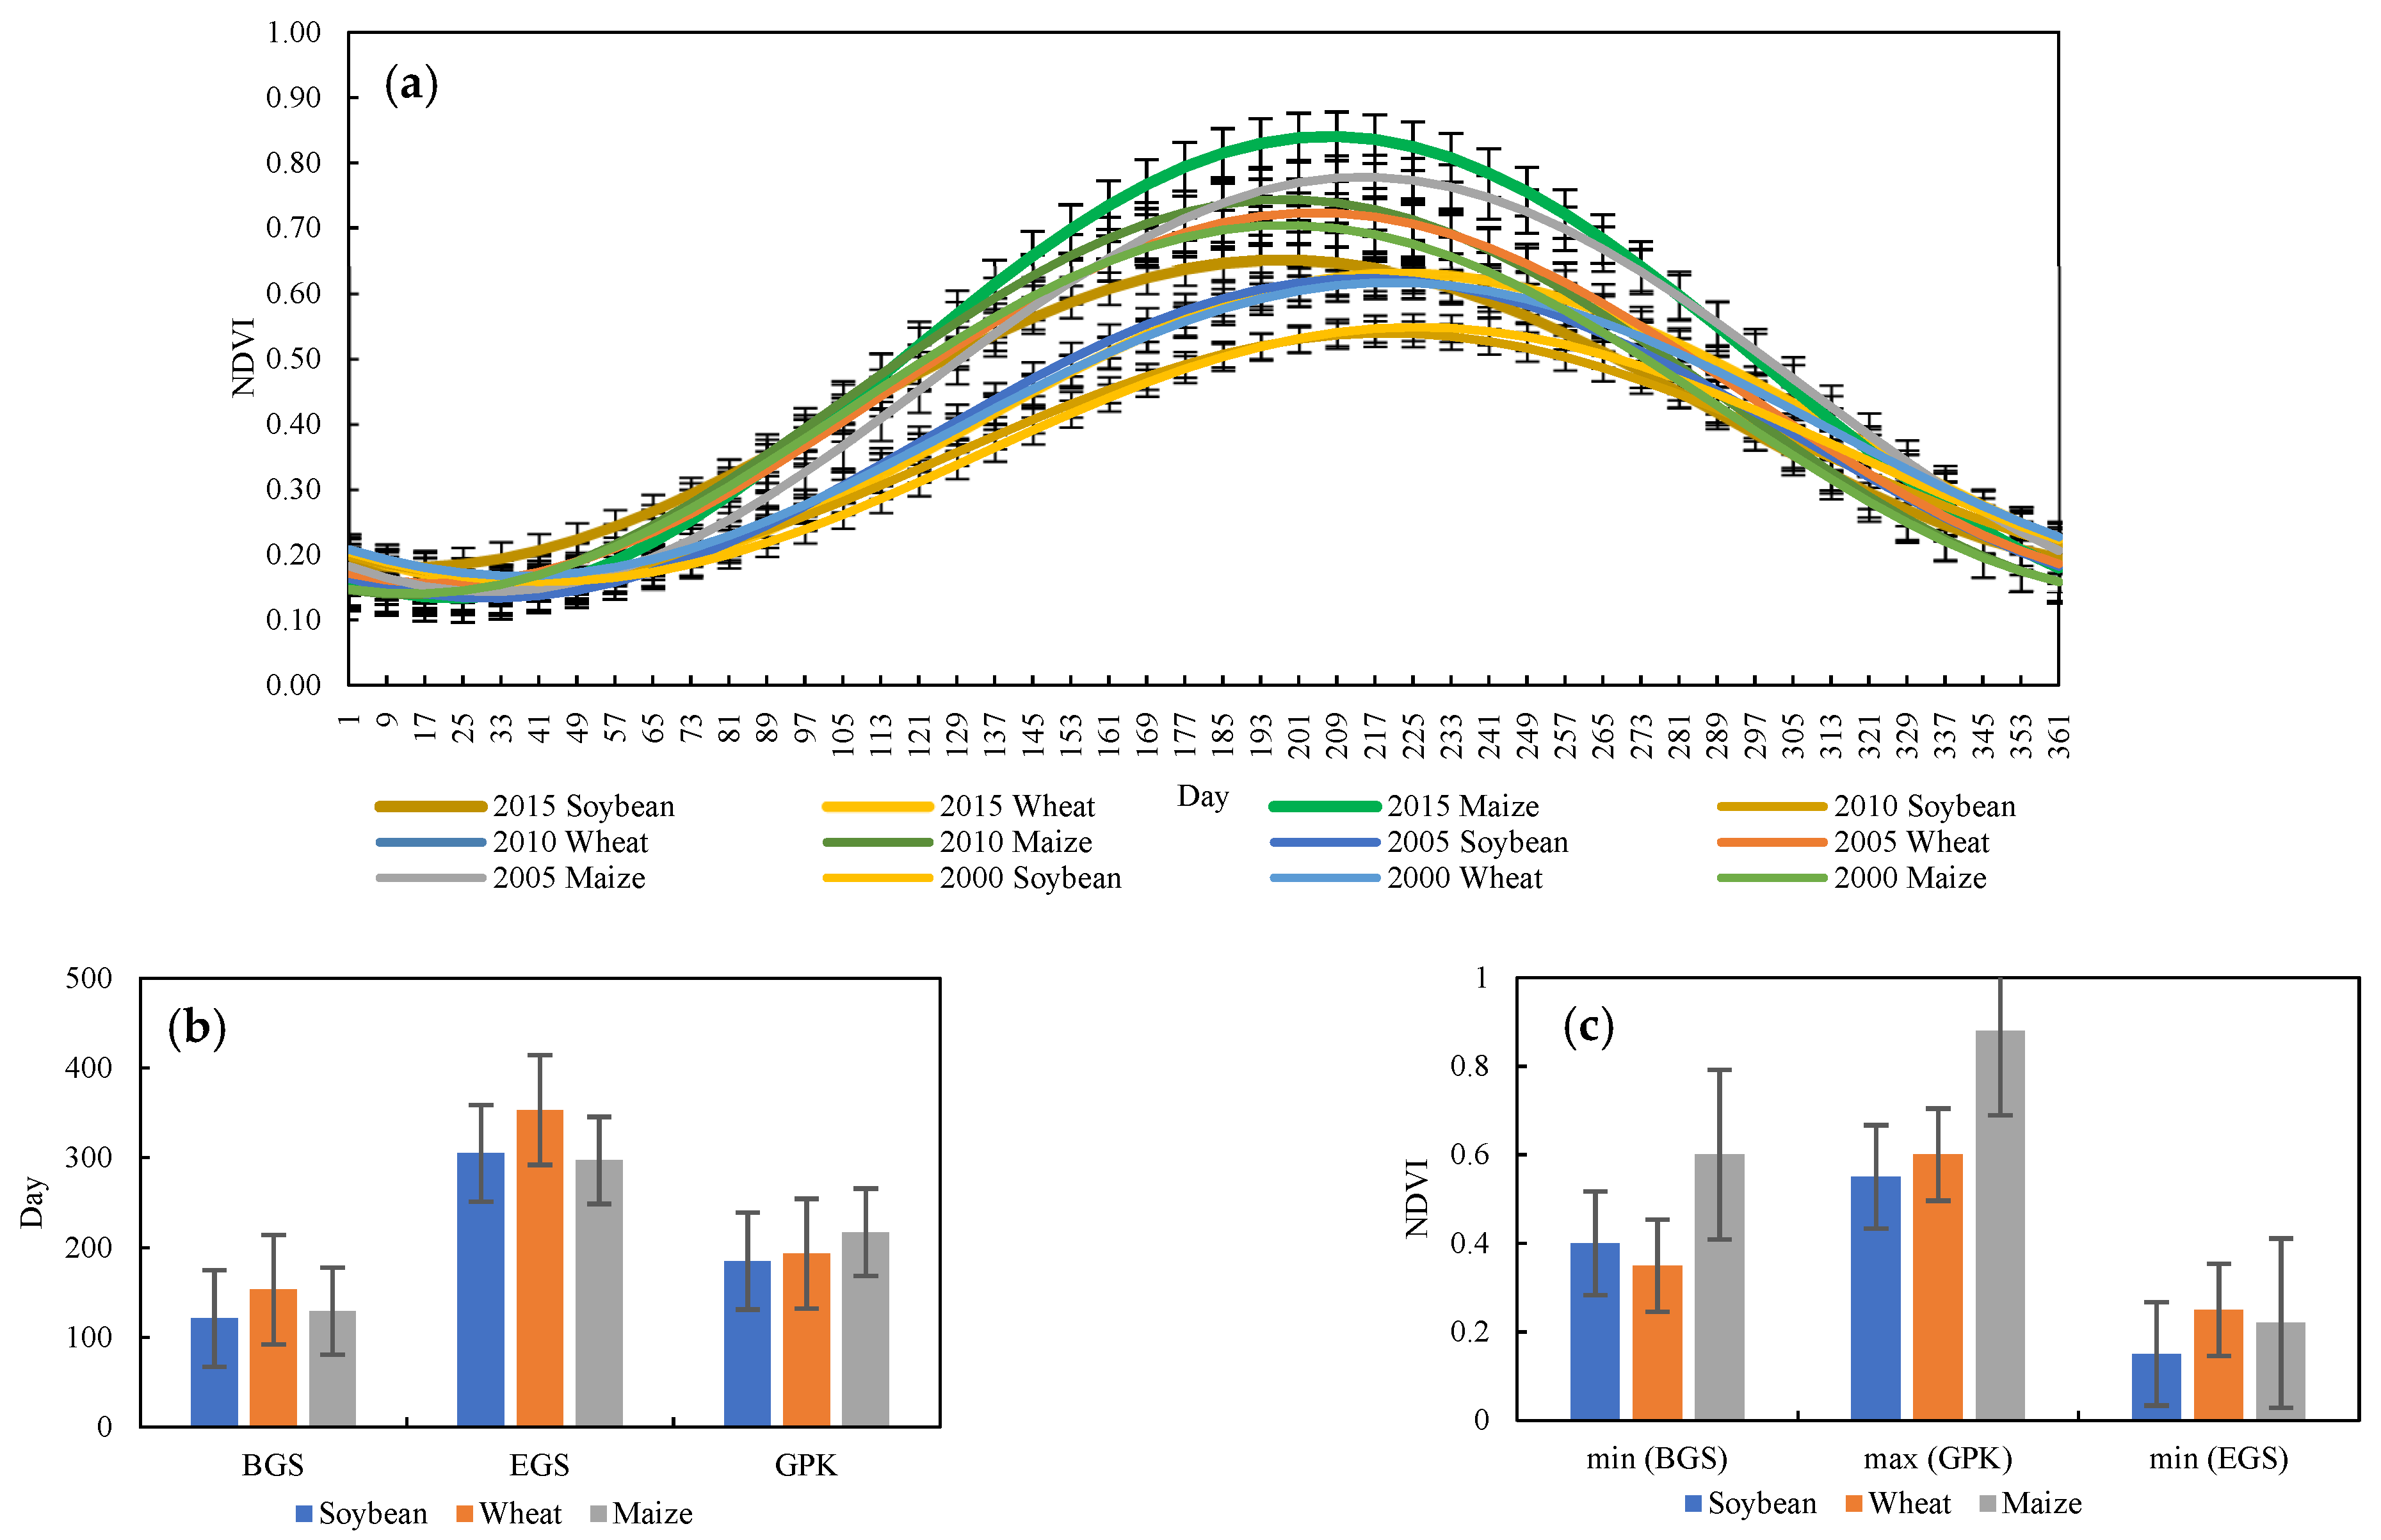
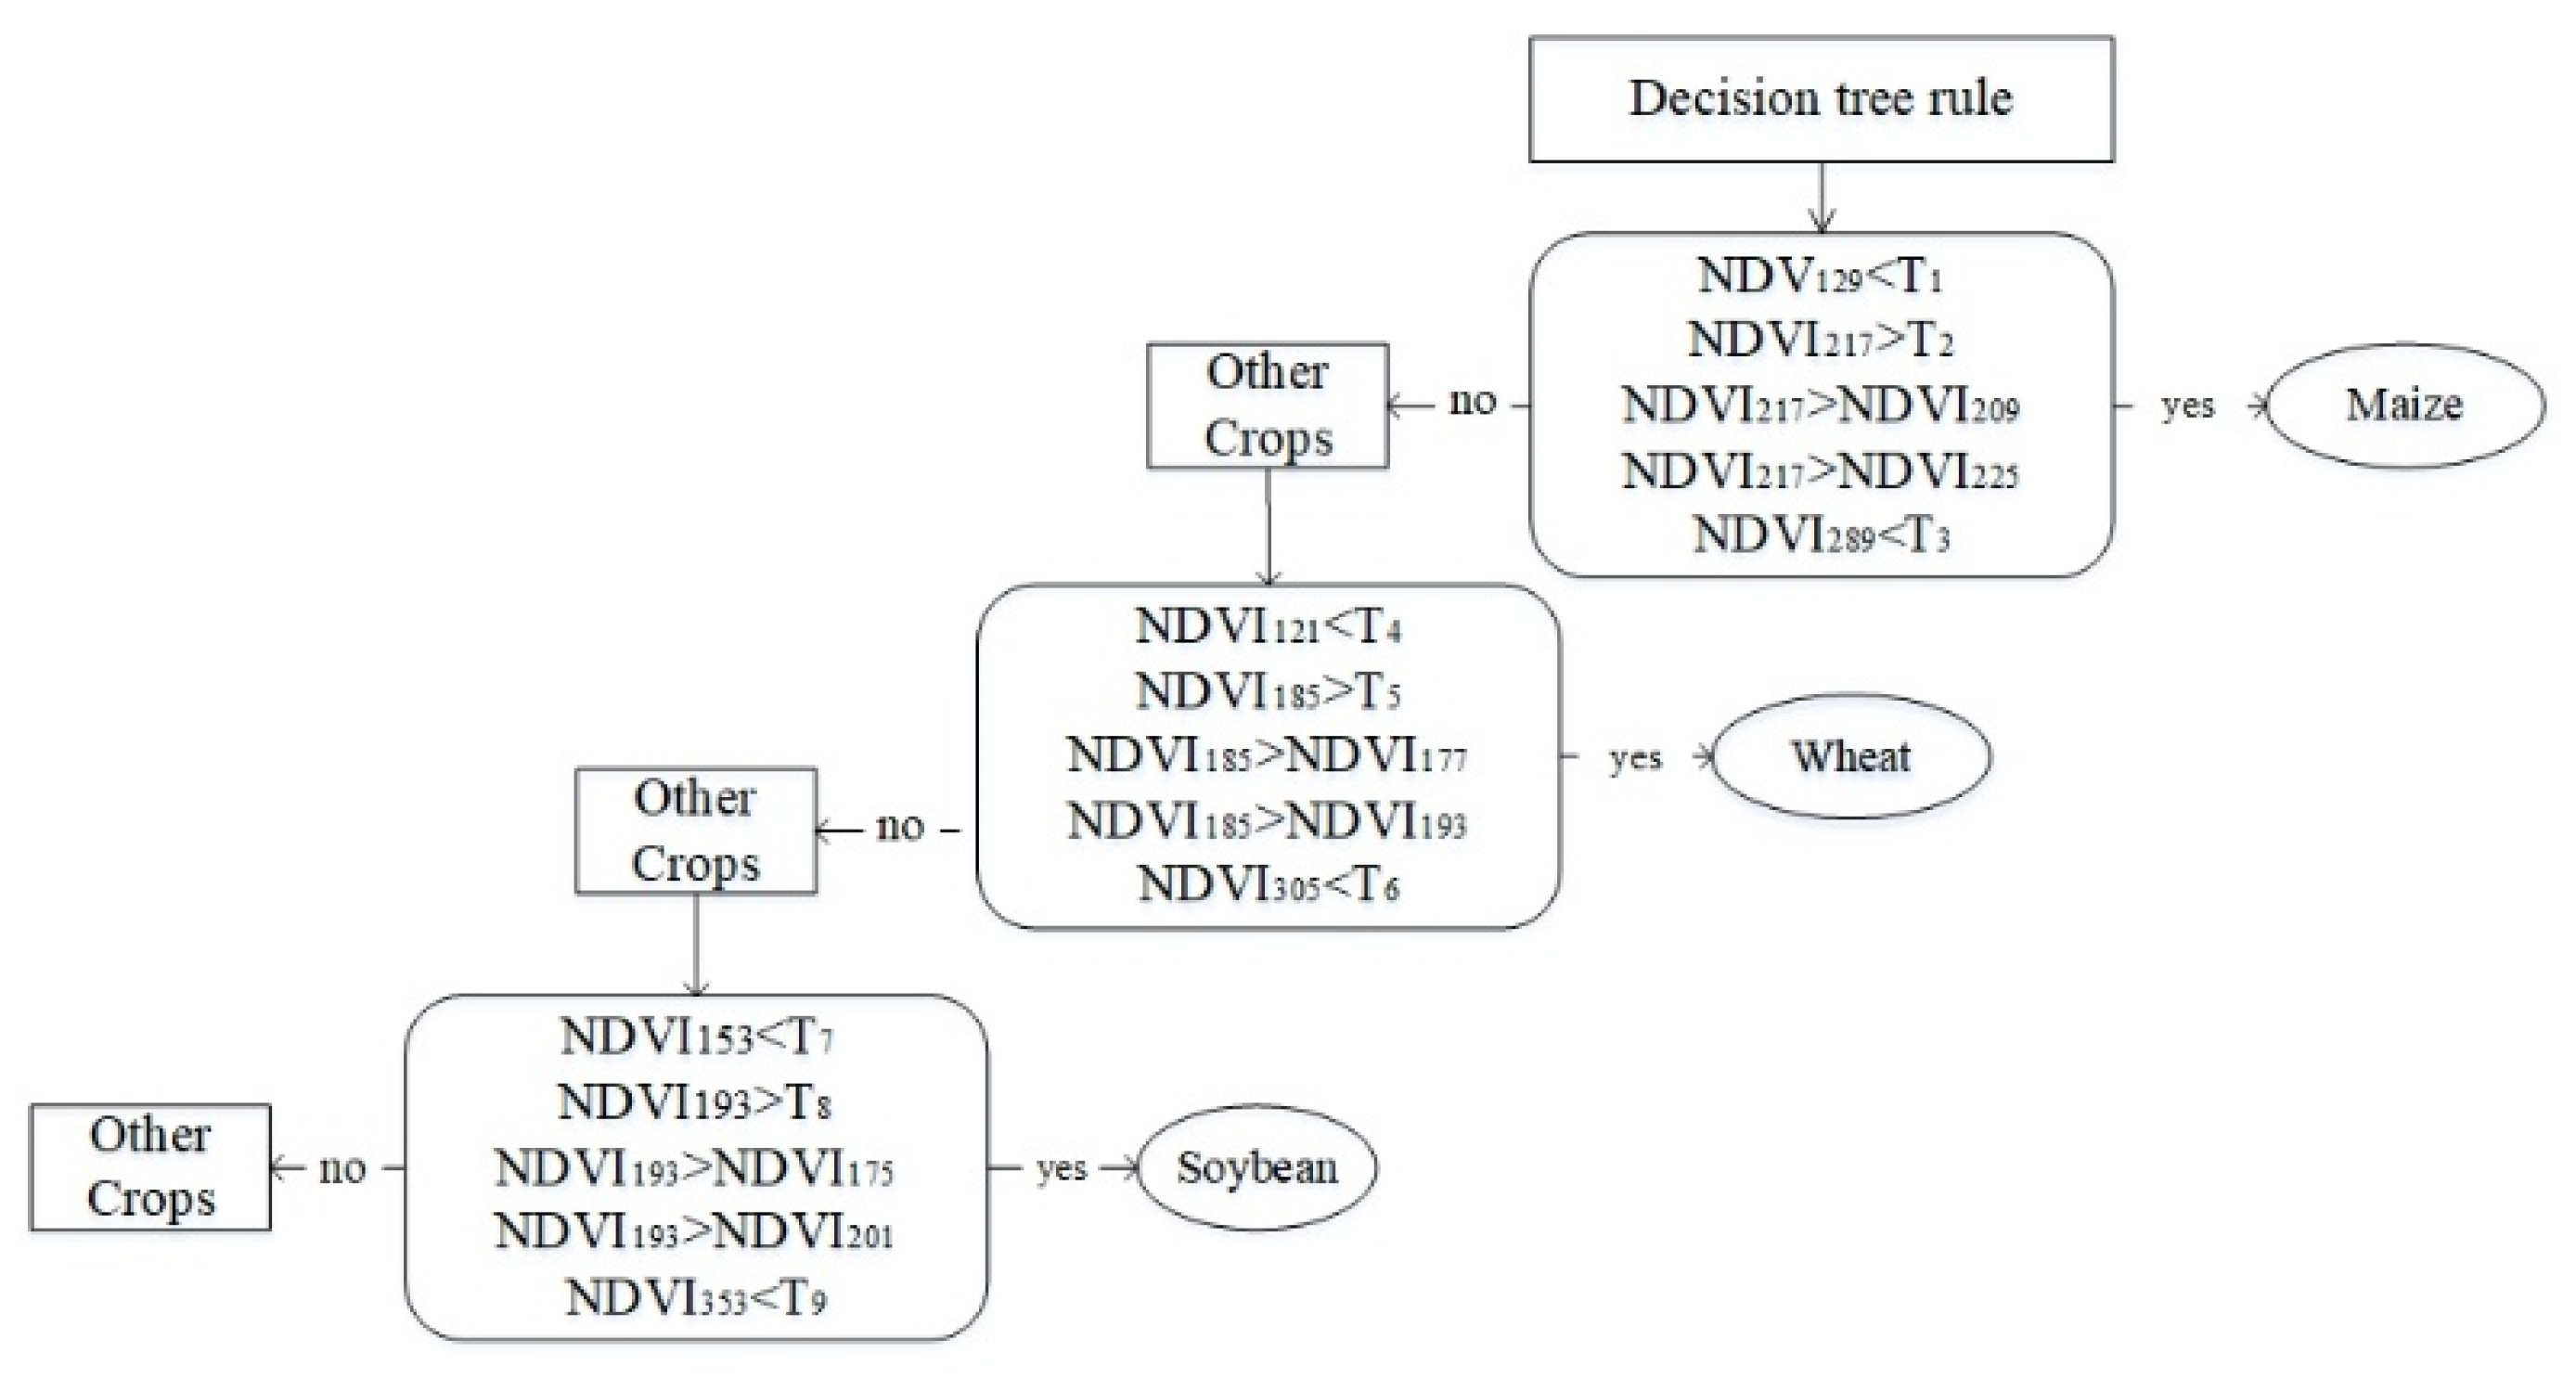
2.3.1. Approach to Mapping Crop Type
- (1)
- If the BGS of the crop pixel is 129, GPK is 217, and EGS is 297, then the modified pixel is classified as maize.
- (2)
- If the BGS of the crop pixel is 153, GPK is 193, and EGS is 353, then the modified pixel is classified as wheat.
- (3)
- If the BGS of the crop pixel is 129, GPK is 297, and EGS is 217, the modified pixel is classified as soybean.
- (4)
- T1–T9 were used to identify the NDVI thresholds of key phenological nodes (emergence, tasseling, and maturity) of crops.

2.3.2. N and P Nutrient Balance Model
2.3.3. N and P Input–Output and Parameters
3. Results
3.1. Precision Verification
3.2. Description of Crop Planting Spatial Pattern
3.2.1. Temporal and Spatial Distribution Characteristics of Crops
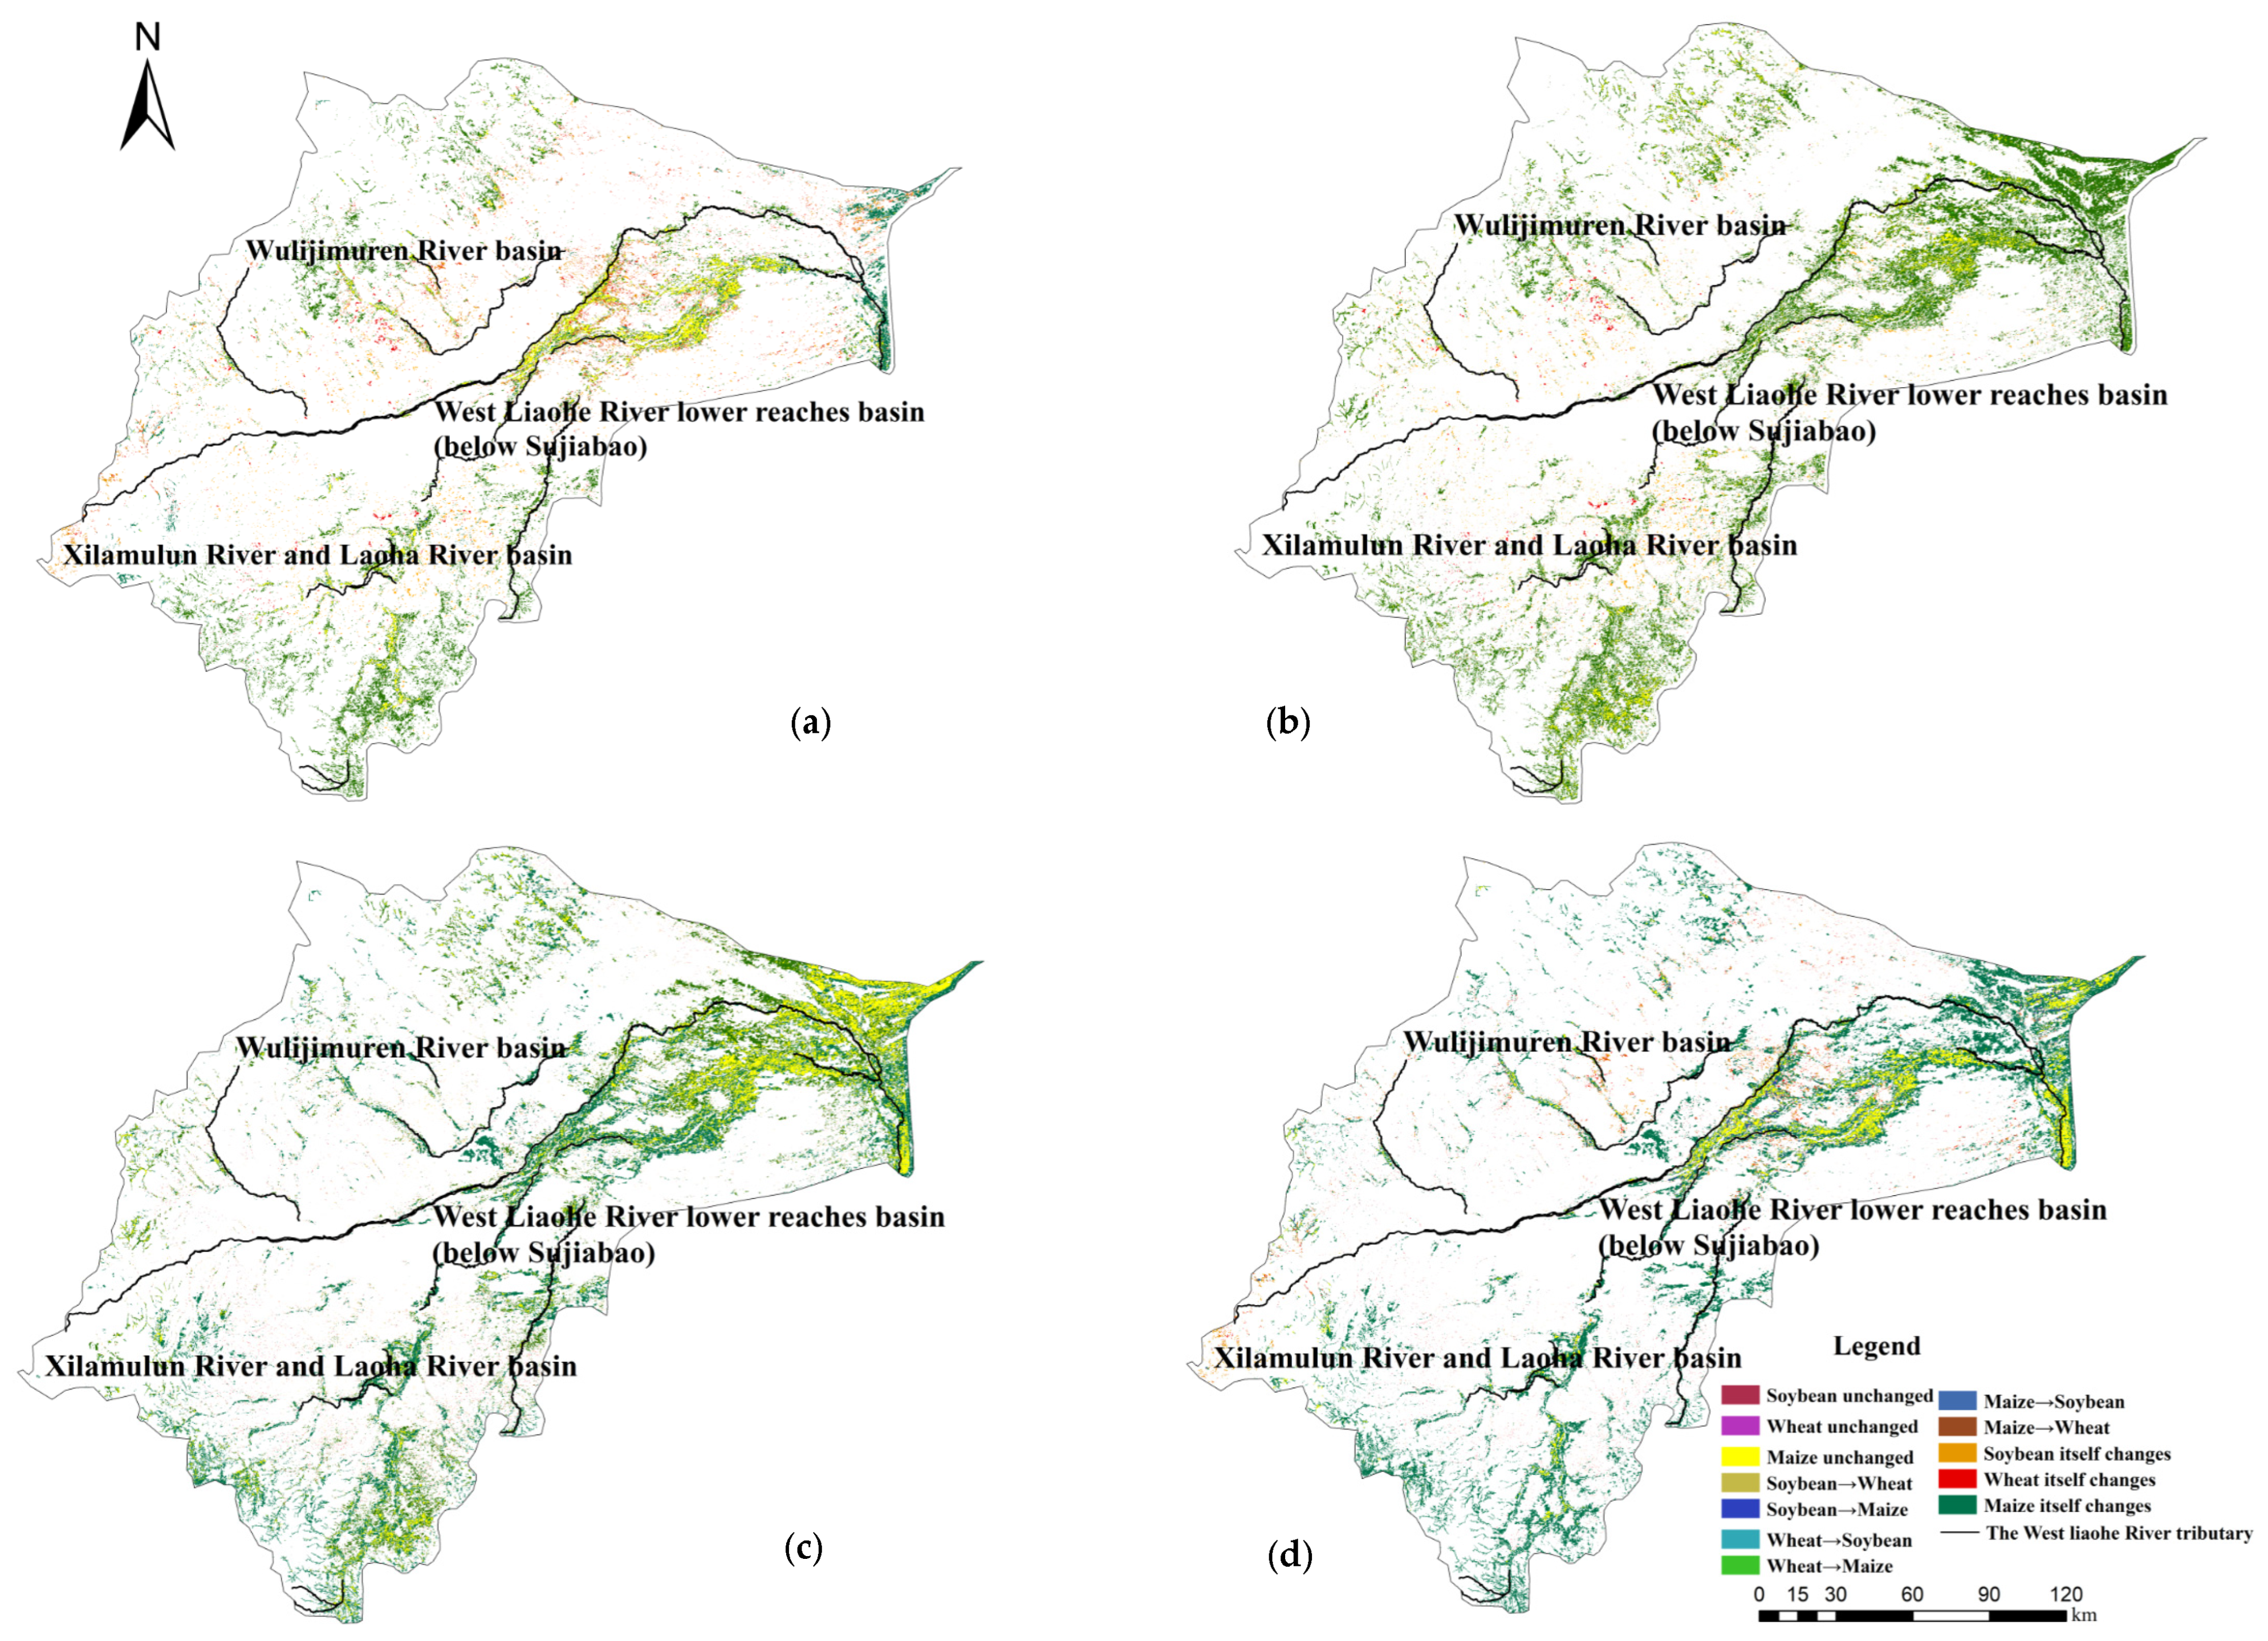
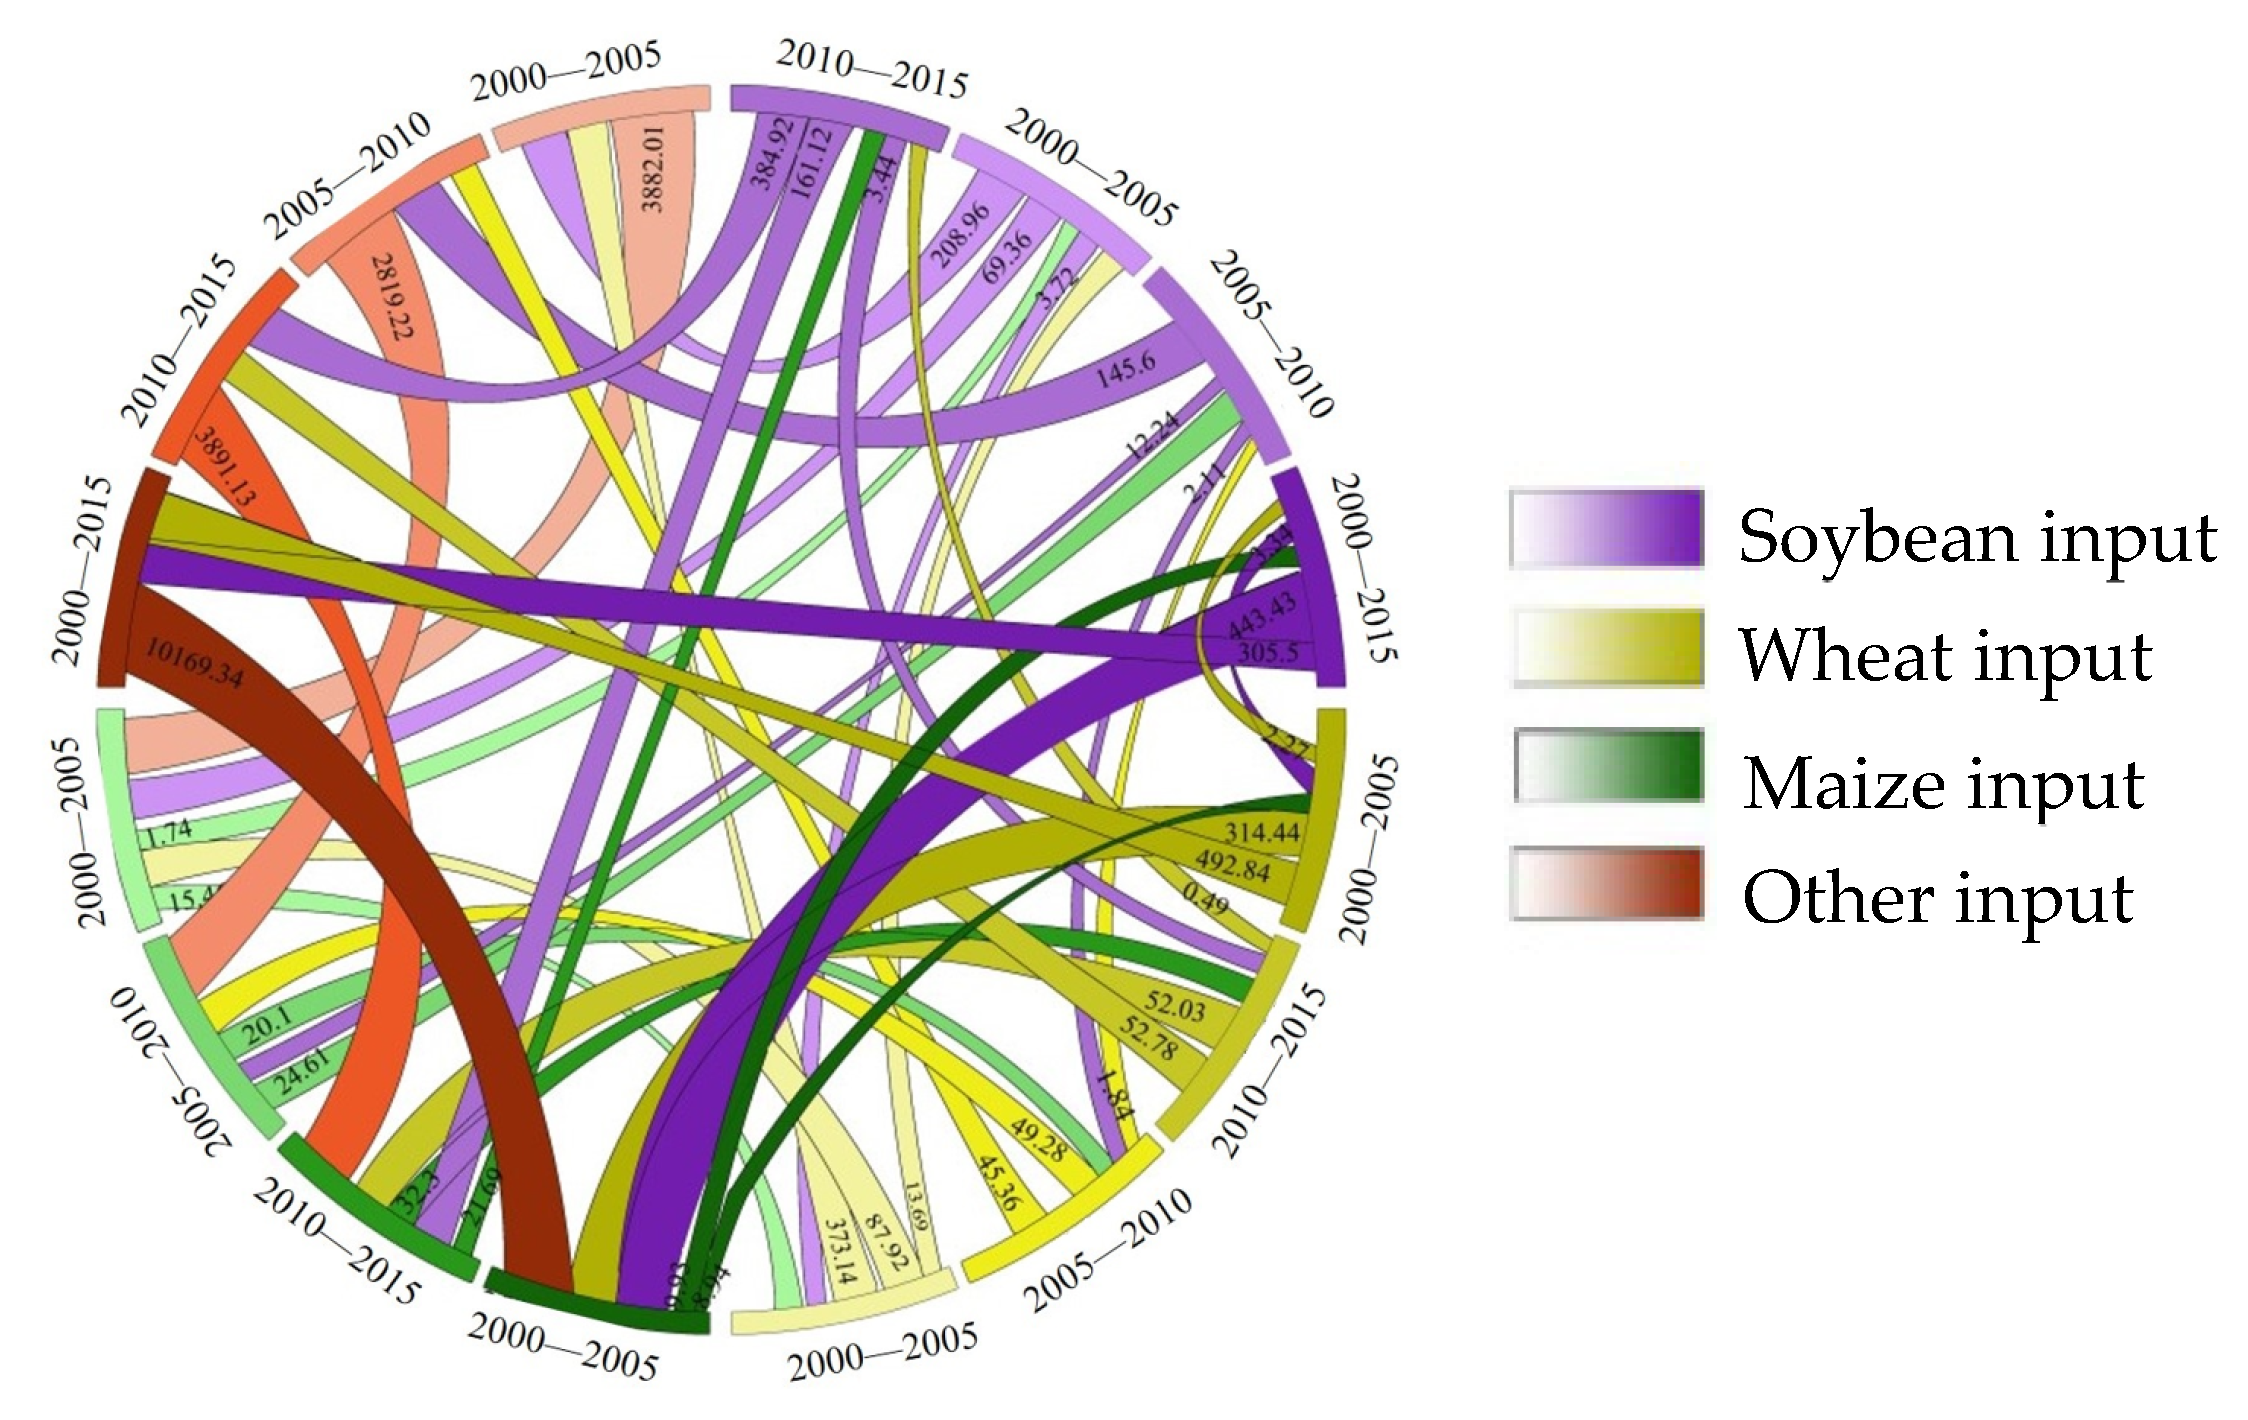
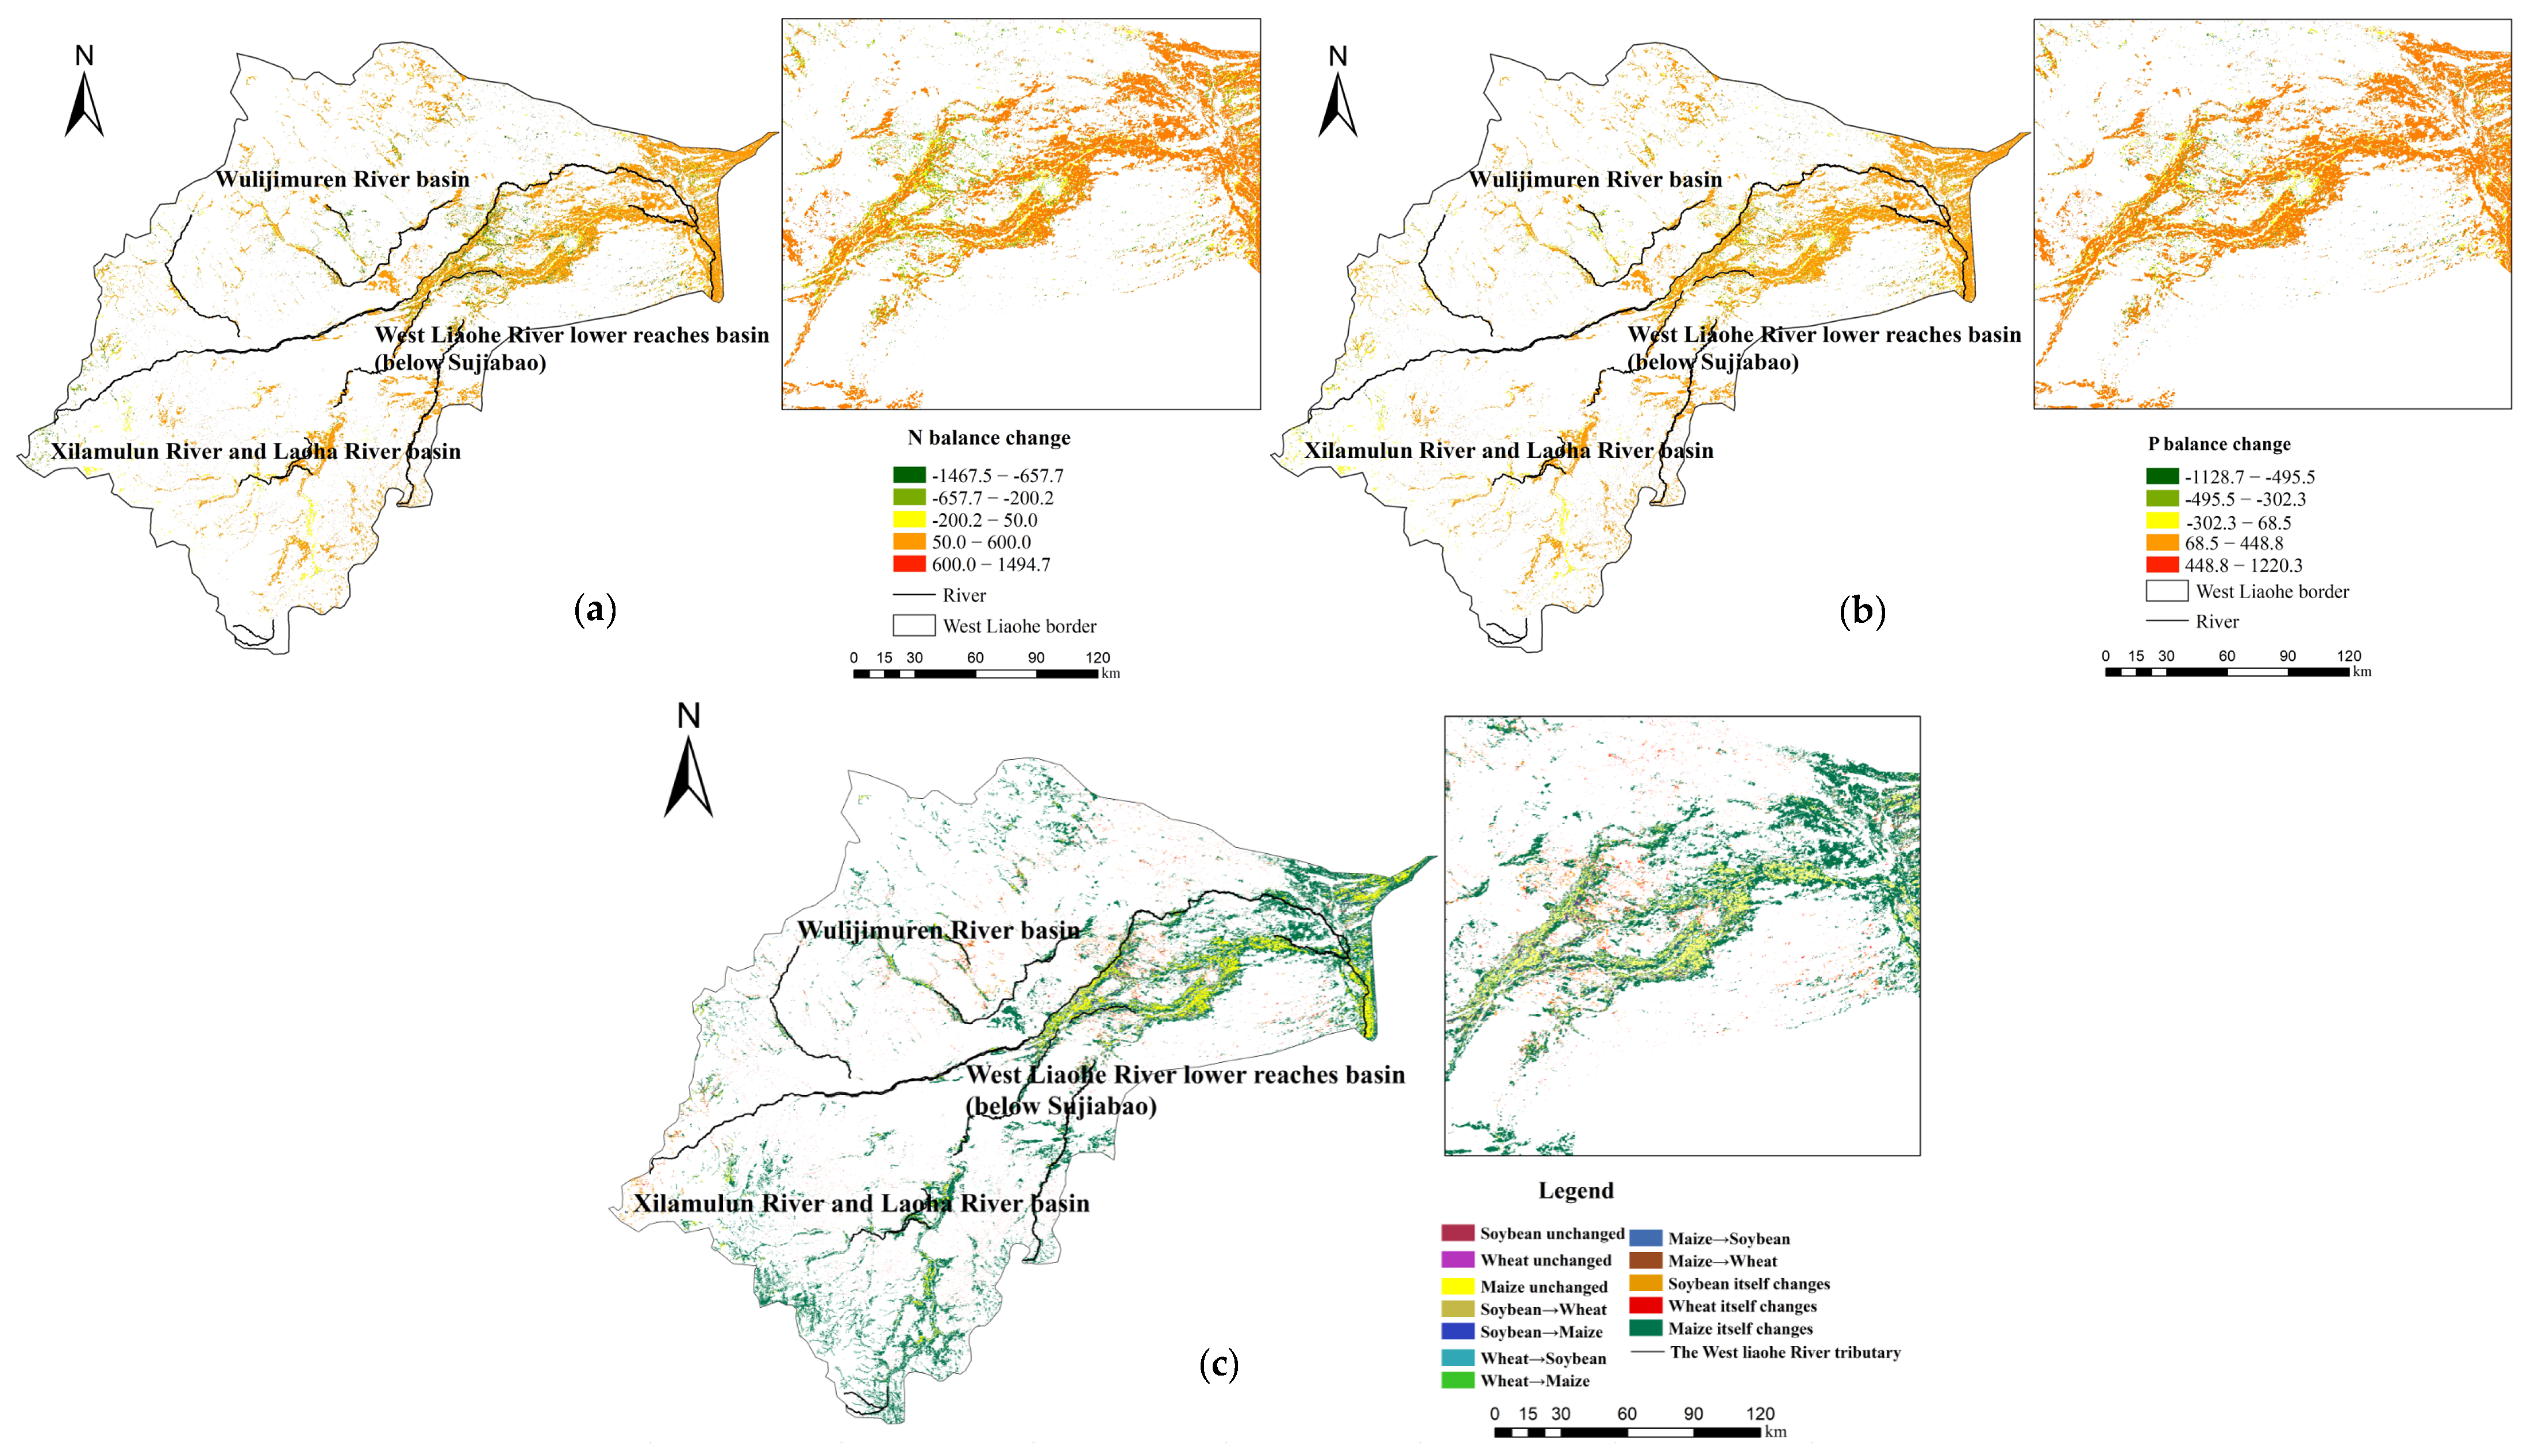
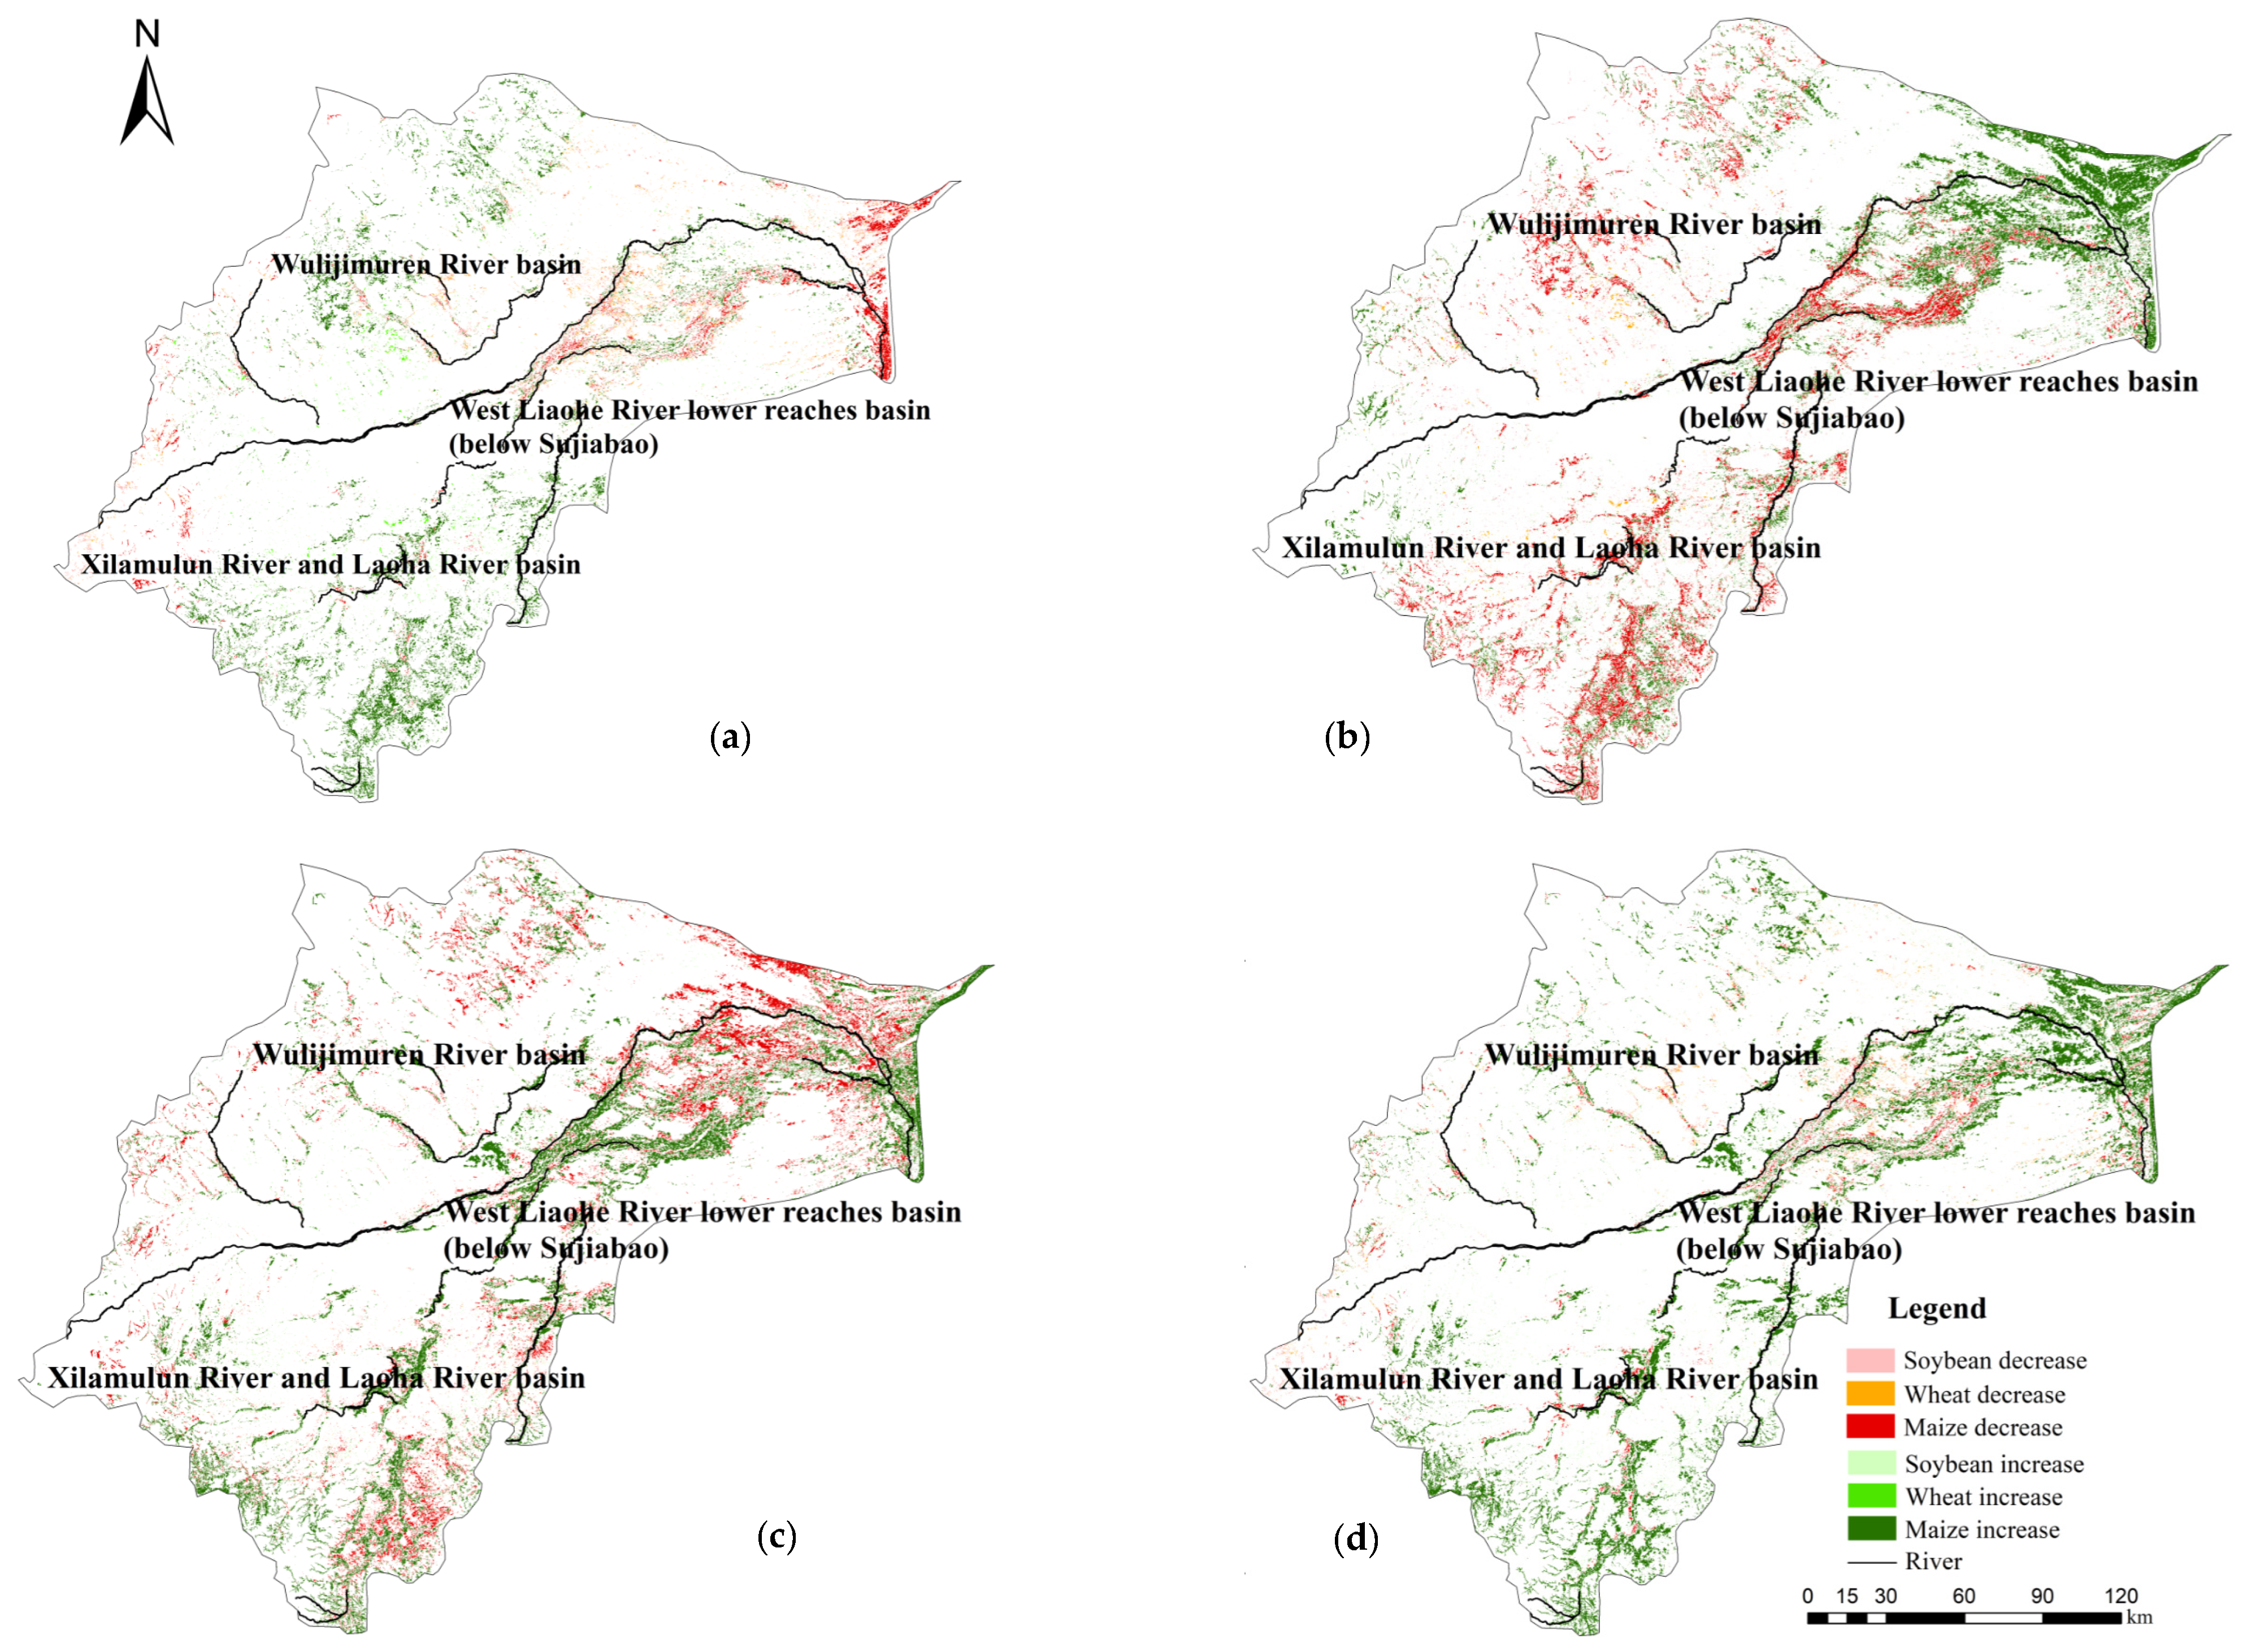
3.2.2. Major Crops Transfer Changes from 2000–2015
3.3. N and P Input–Output and Balance
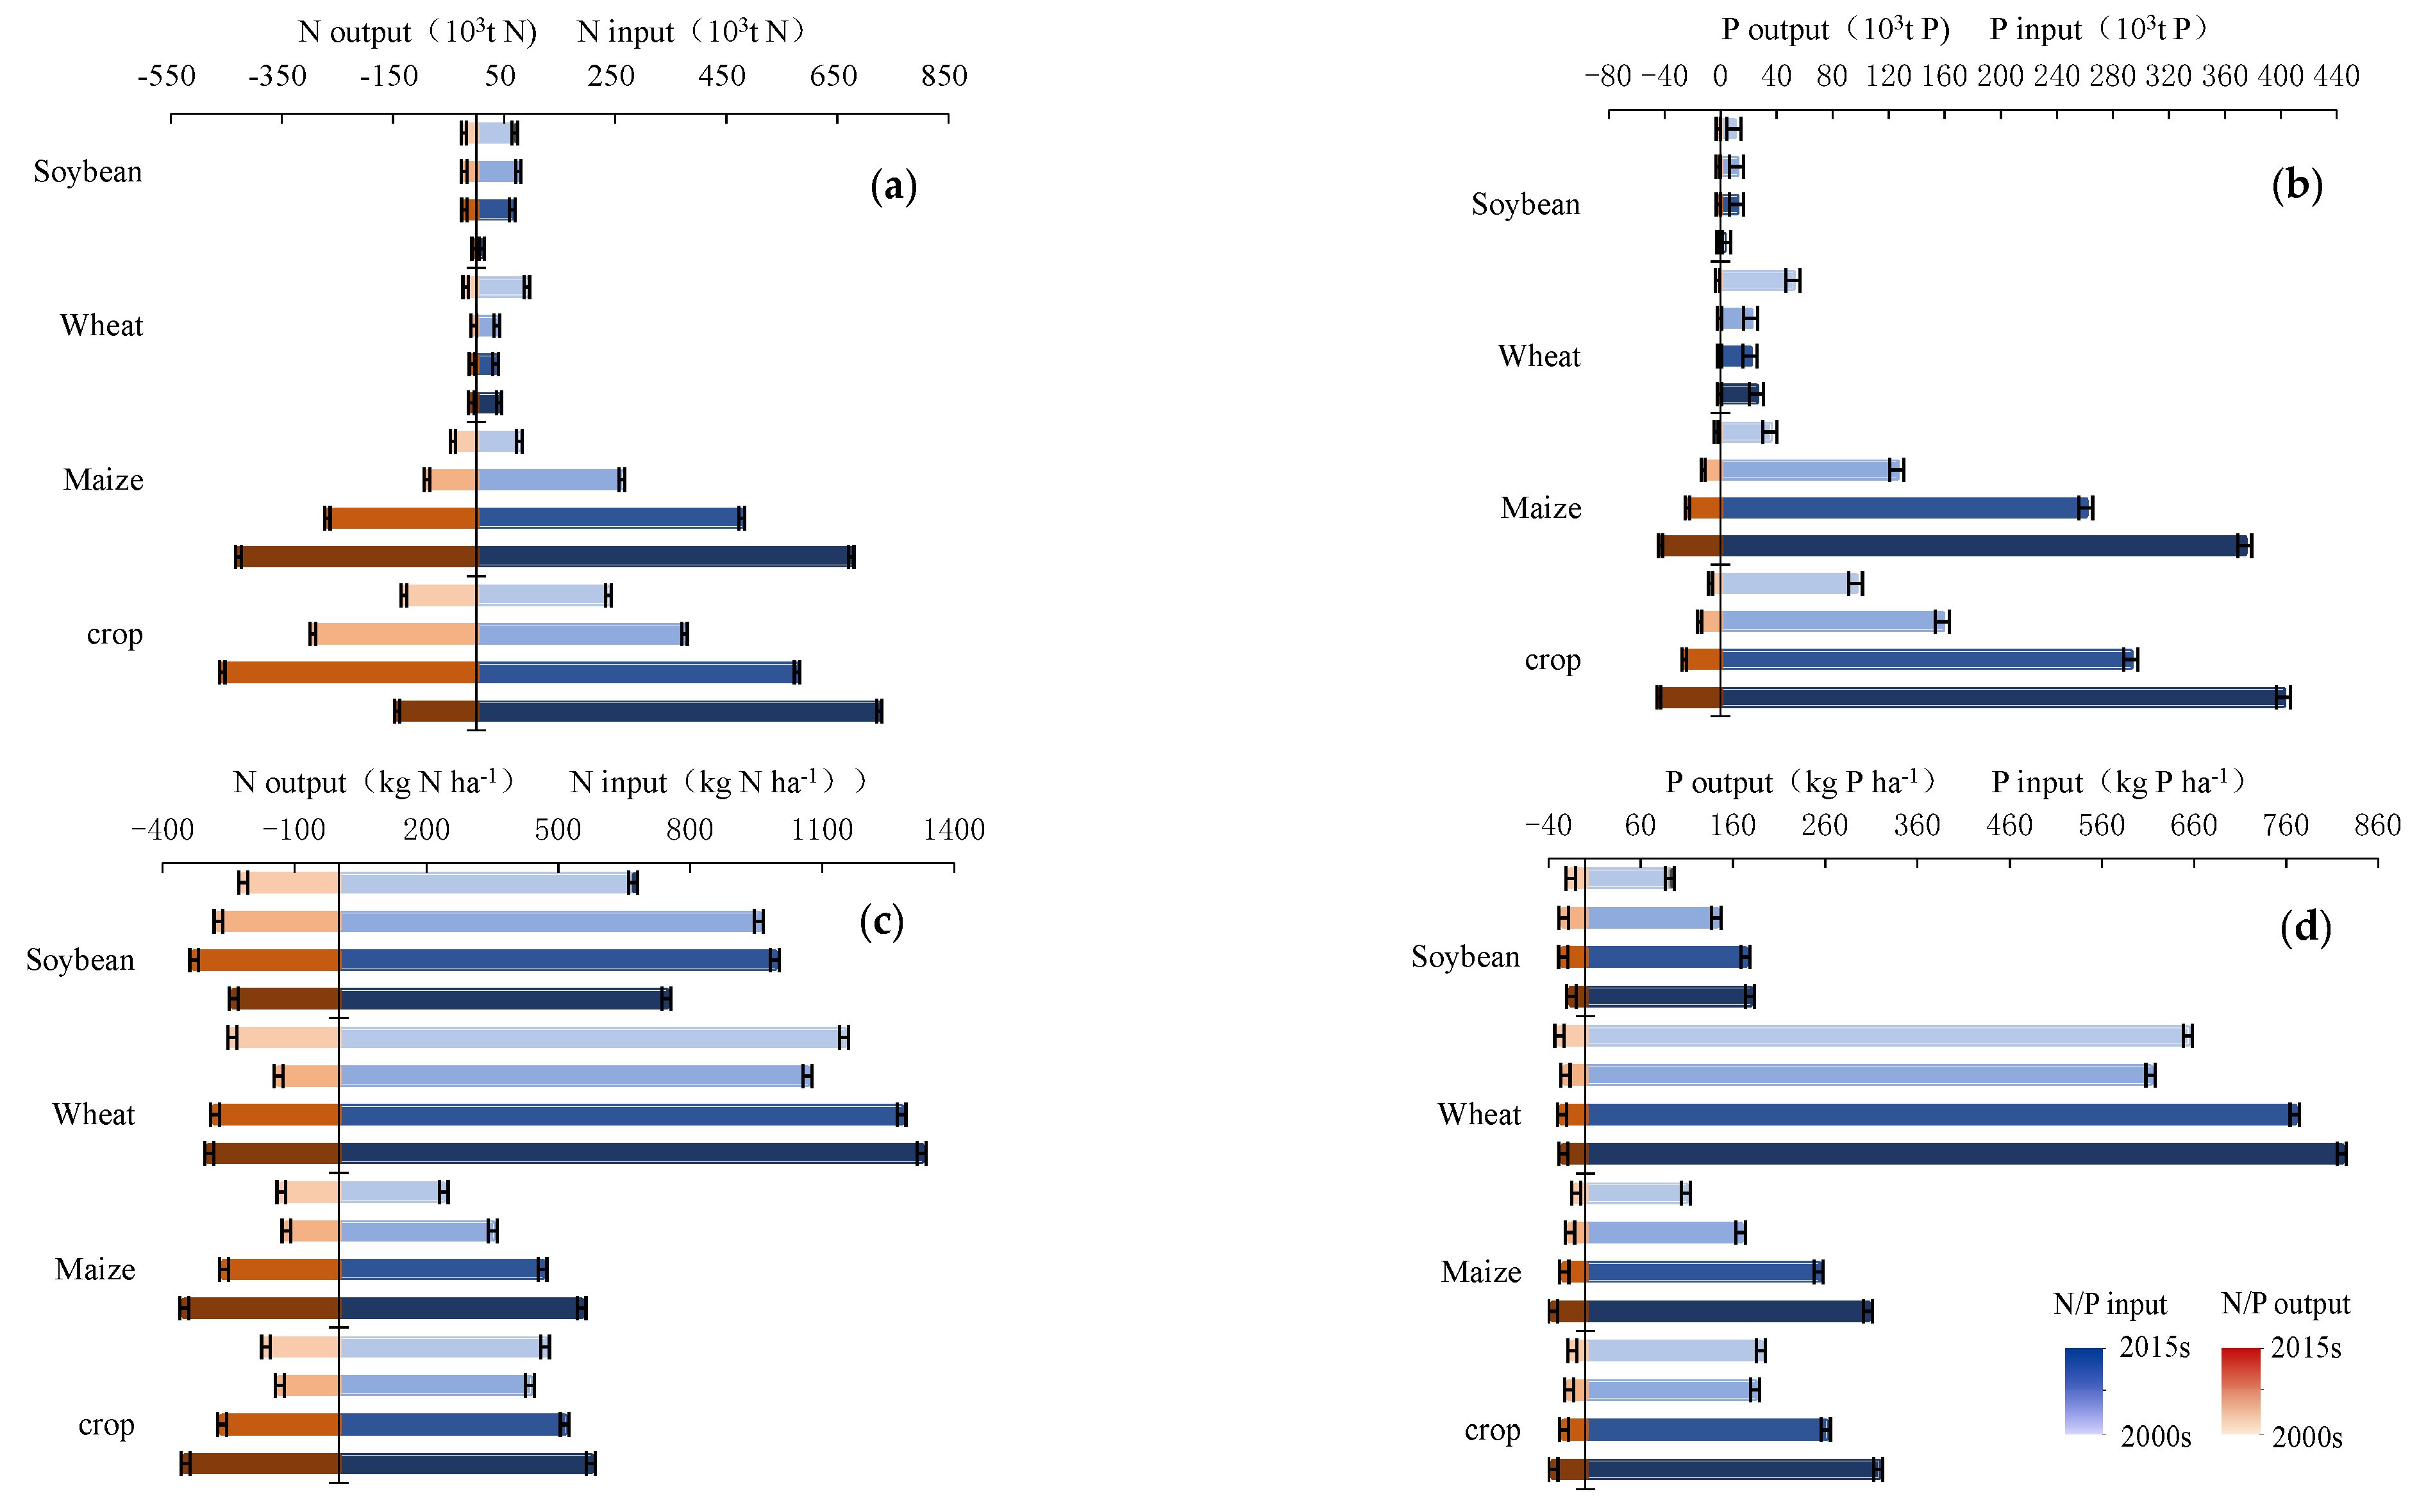
3.3.1. N and P Input–Output
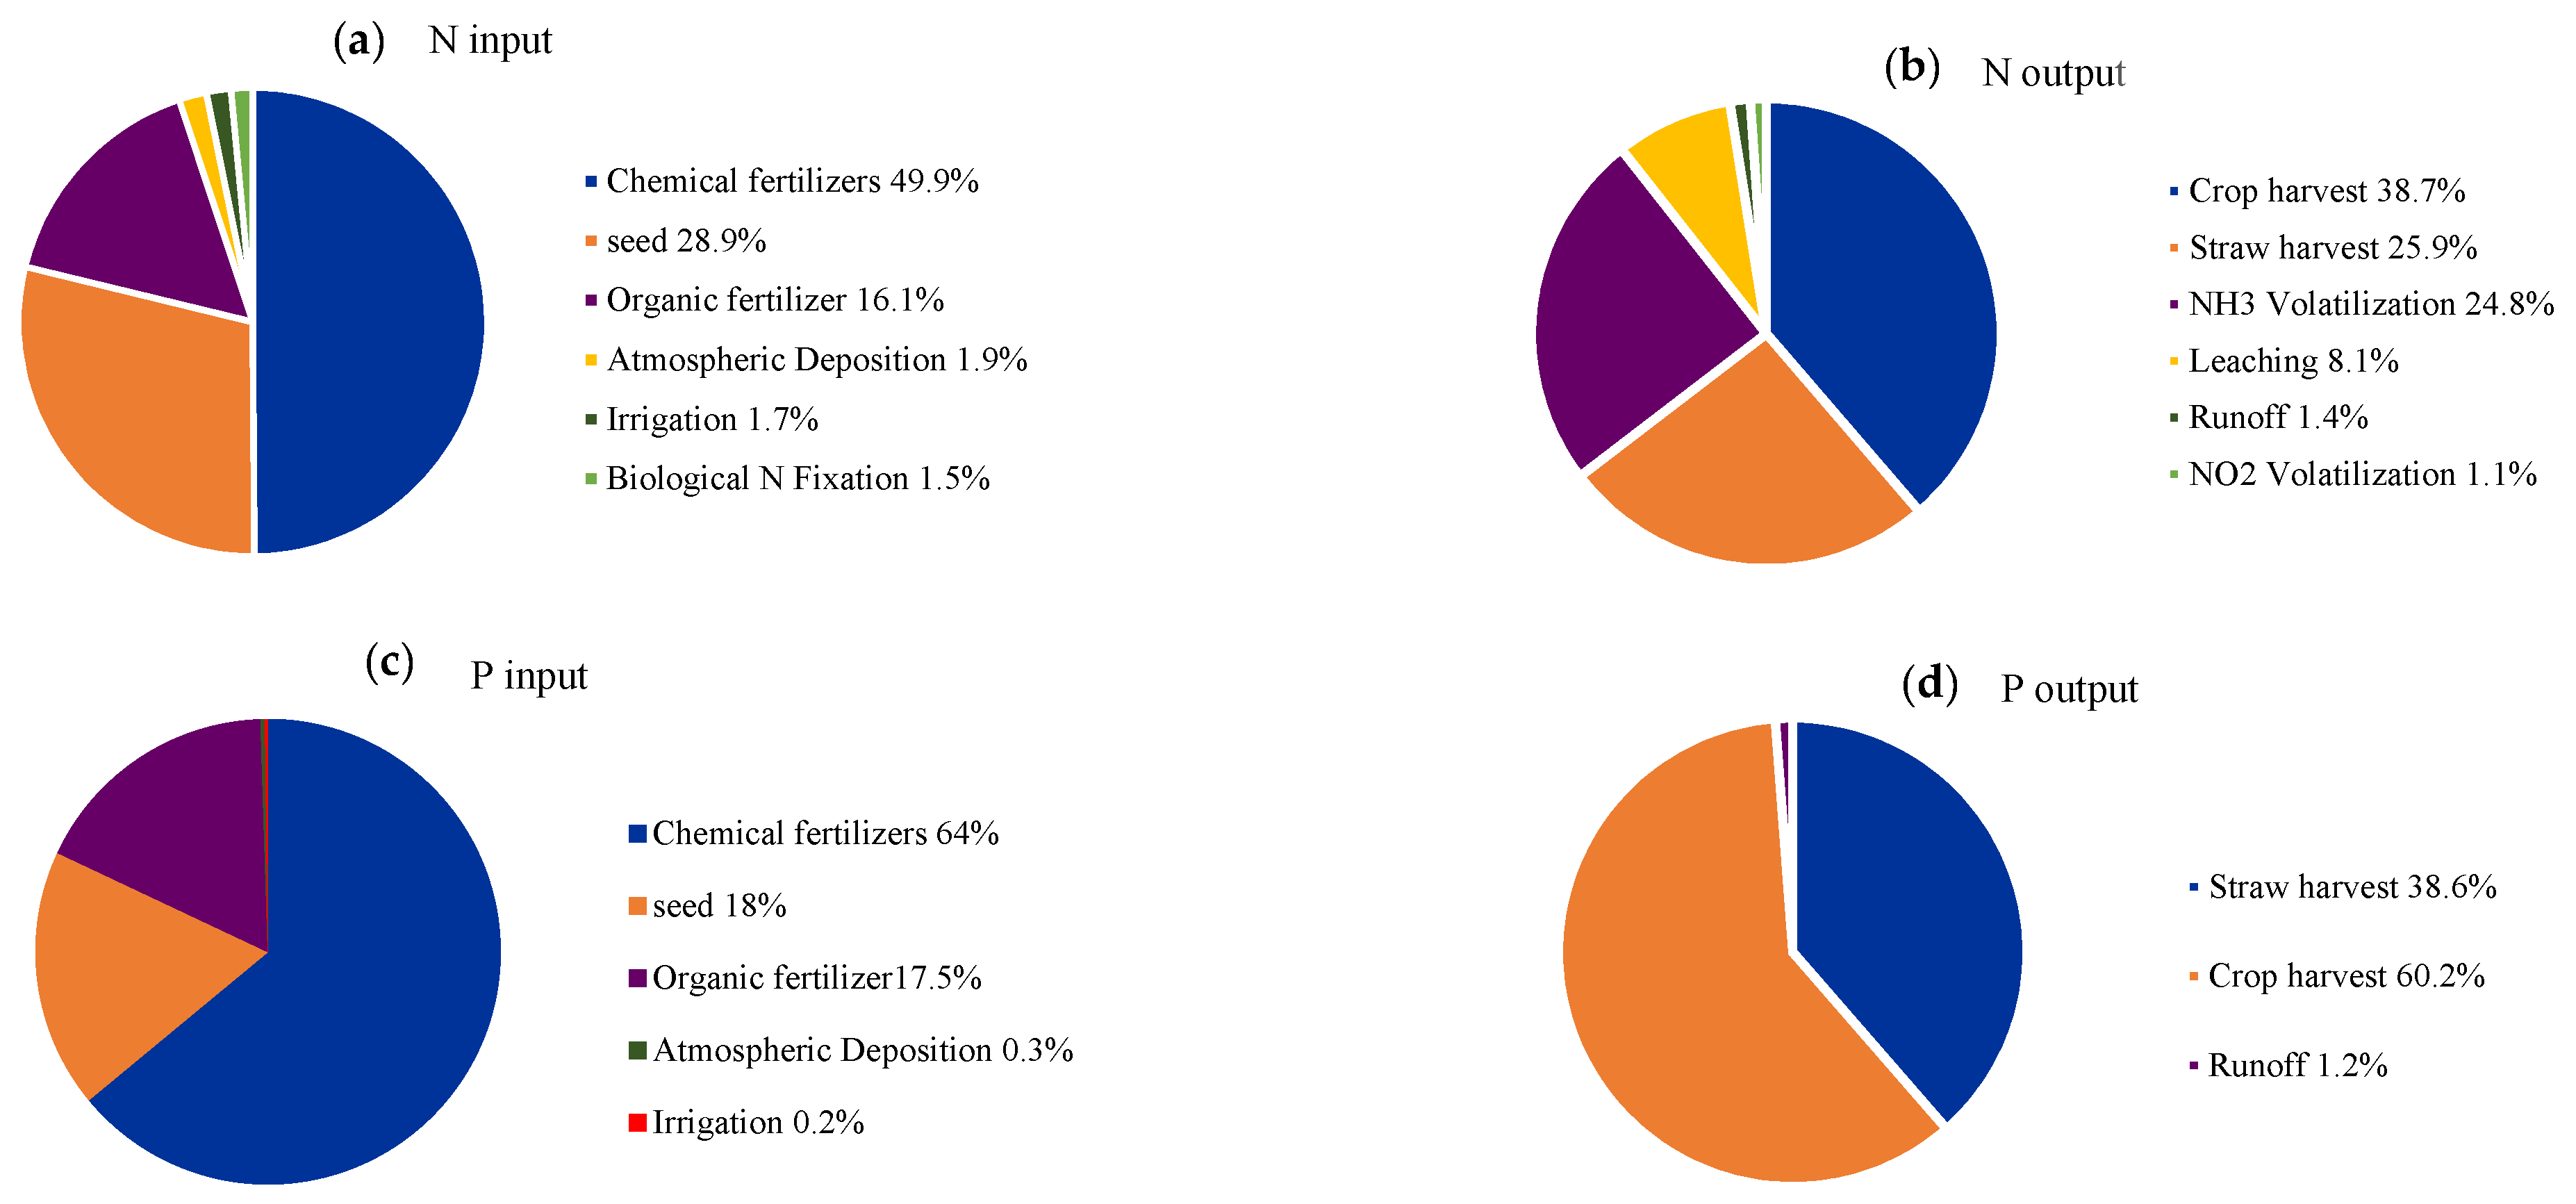
3.3.2. N and P Input–Output Component
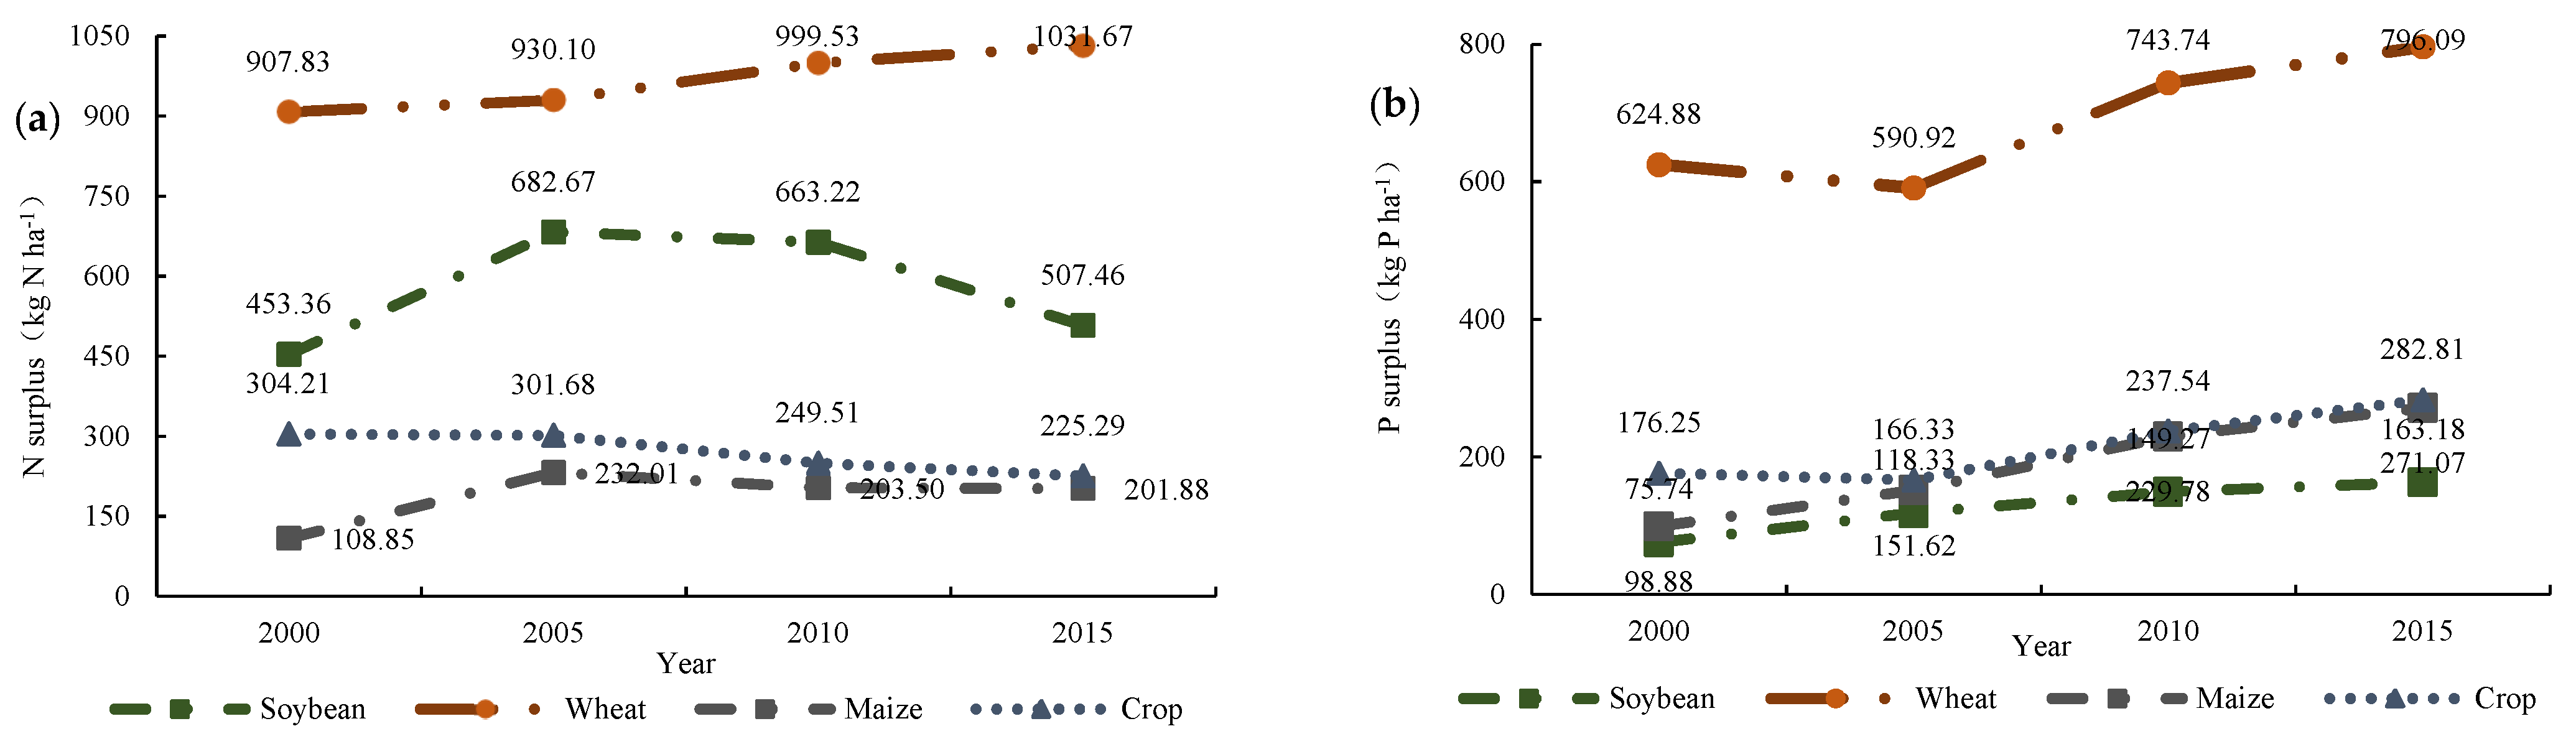
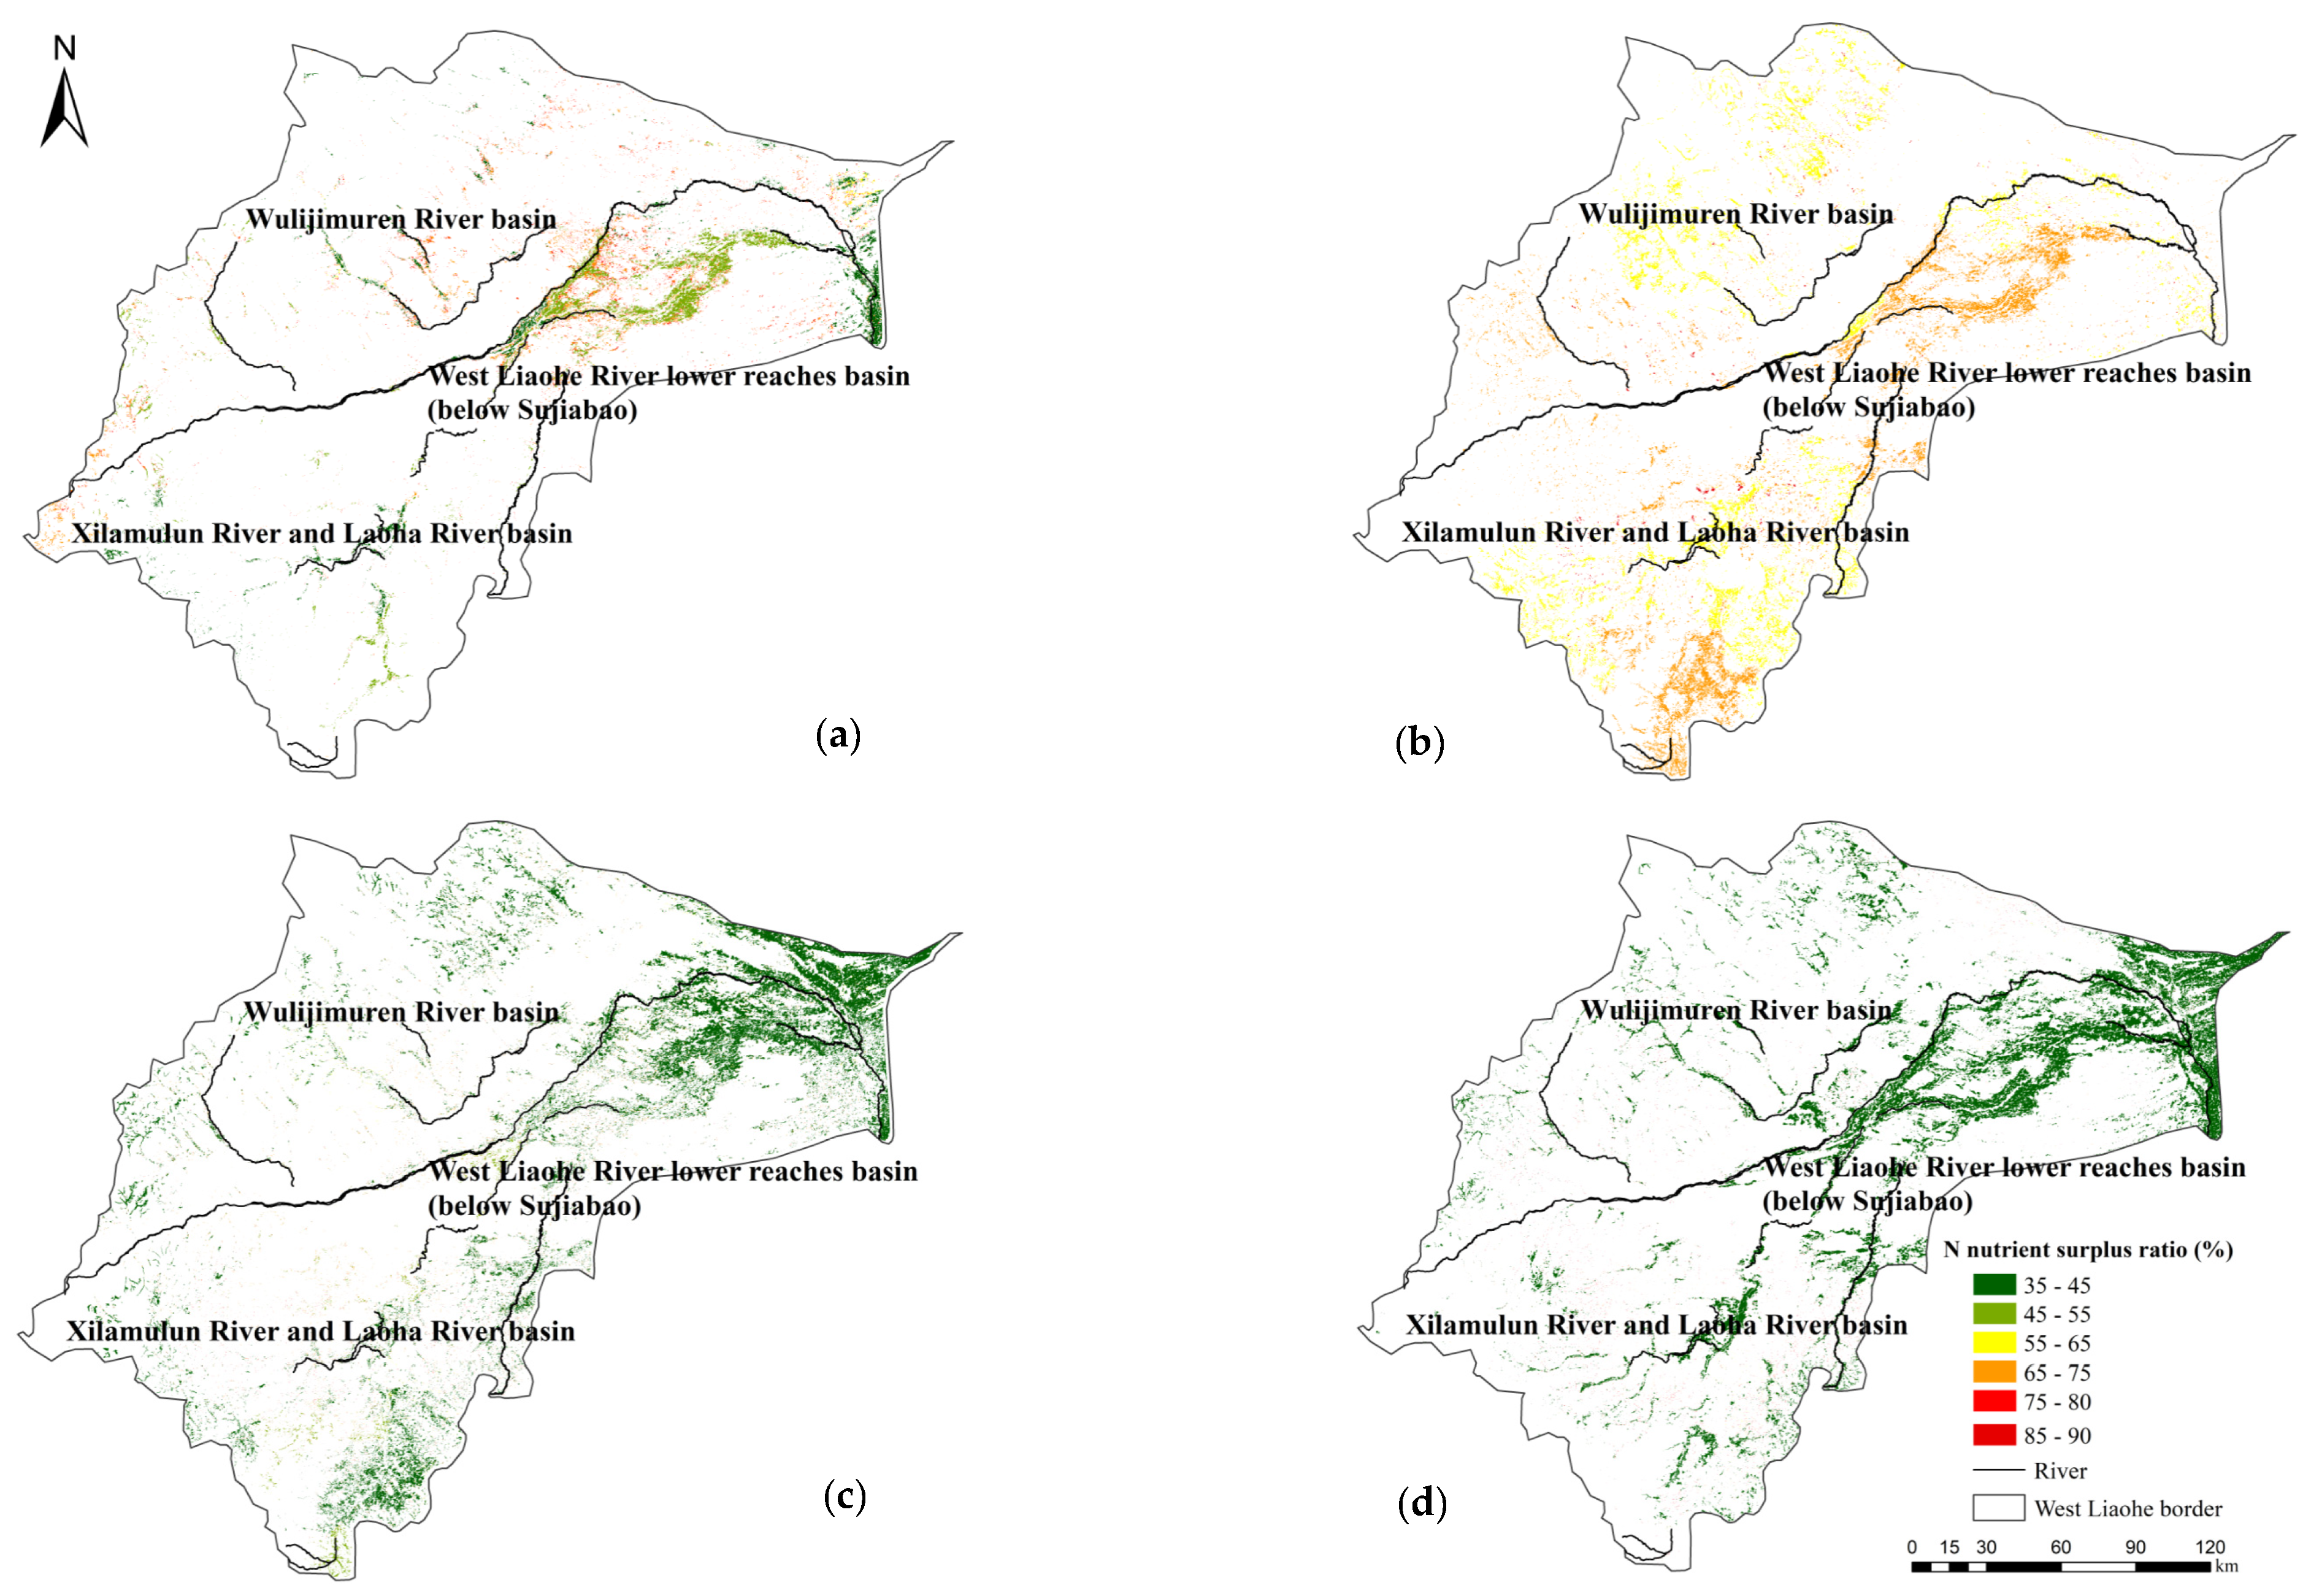
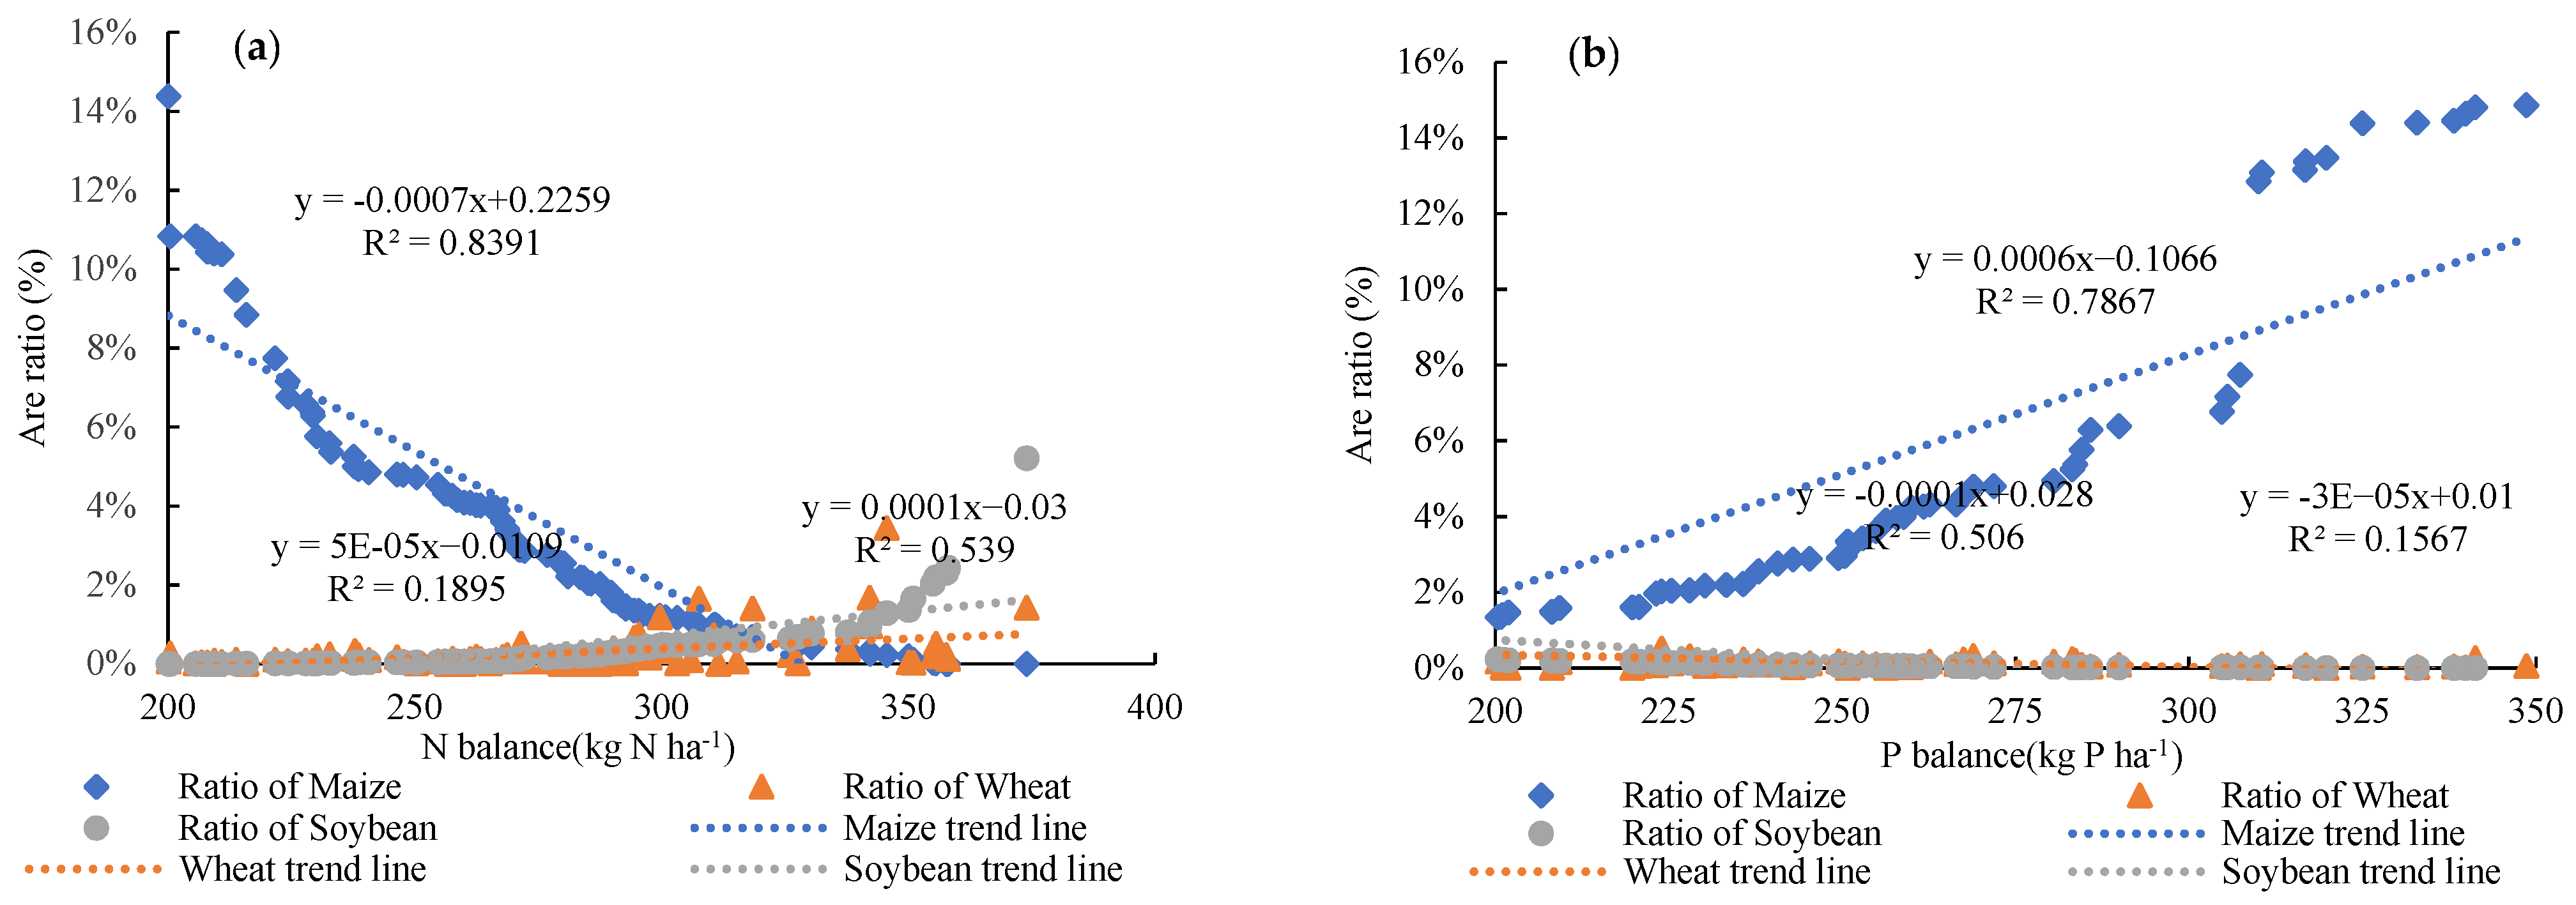
3.3.3. N and P Balance
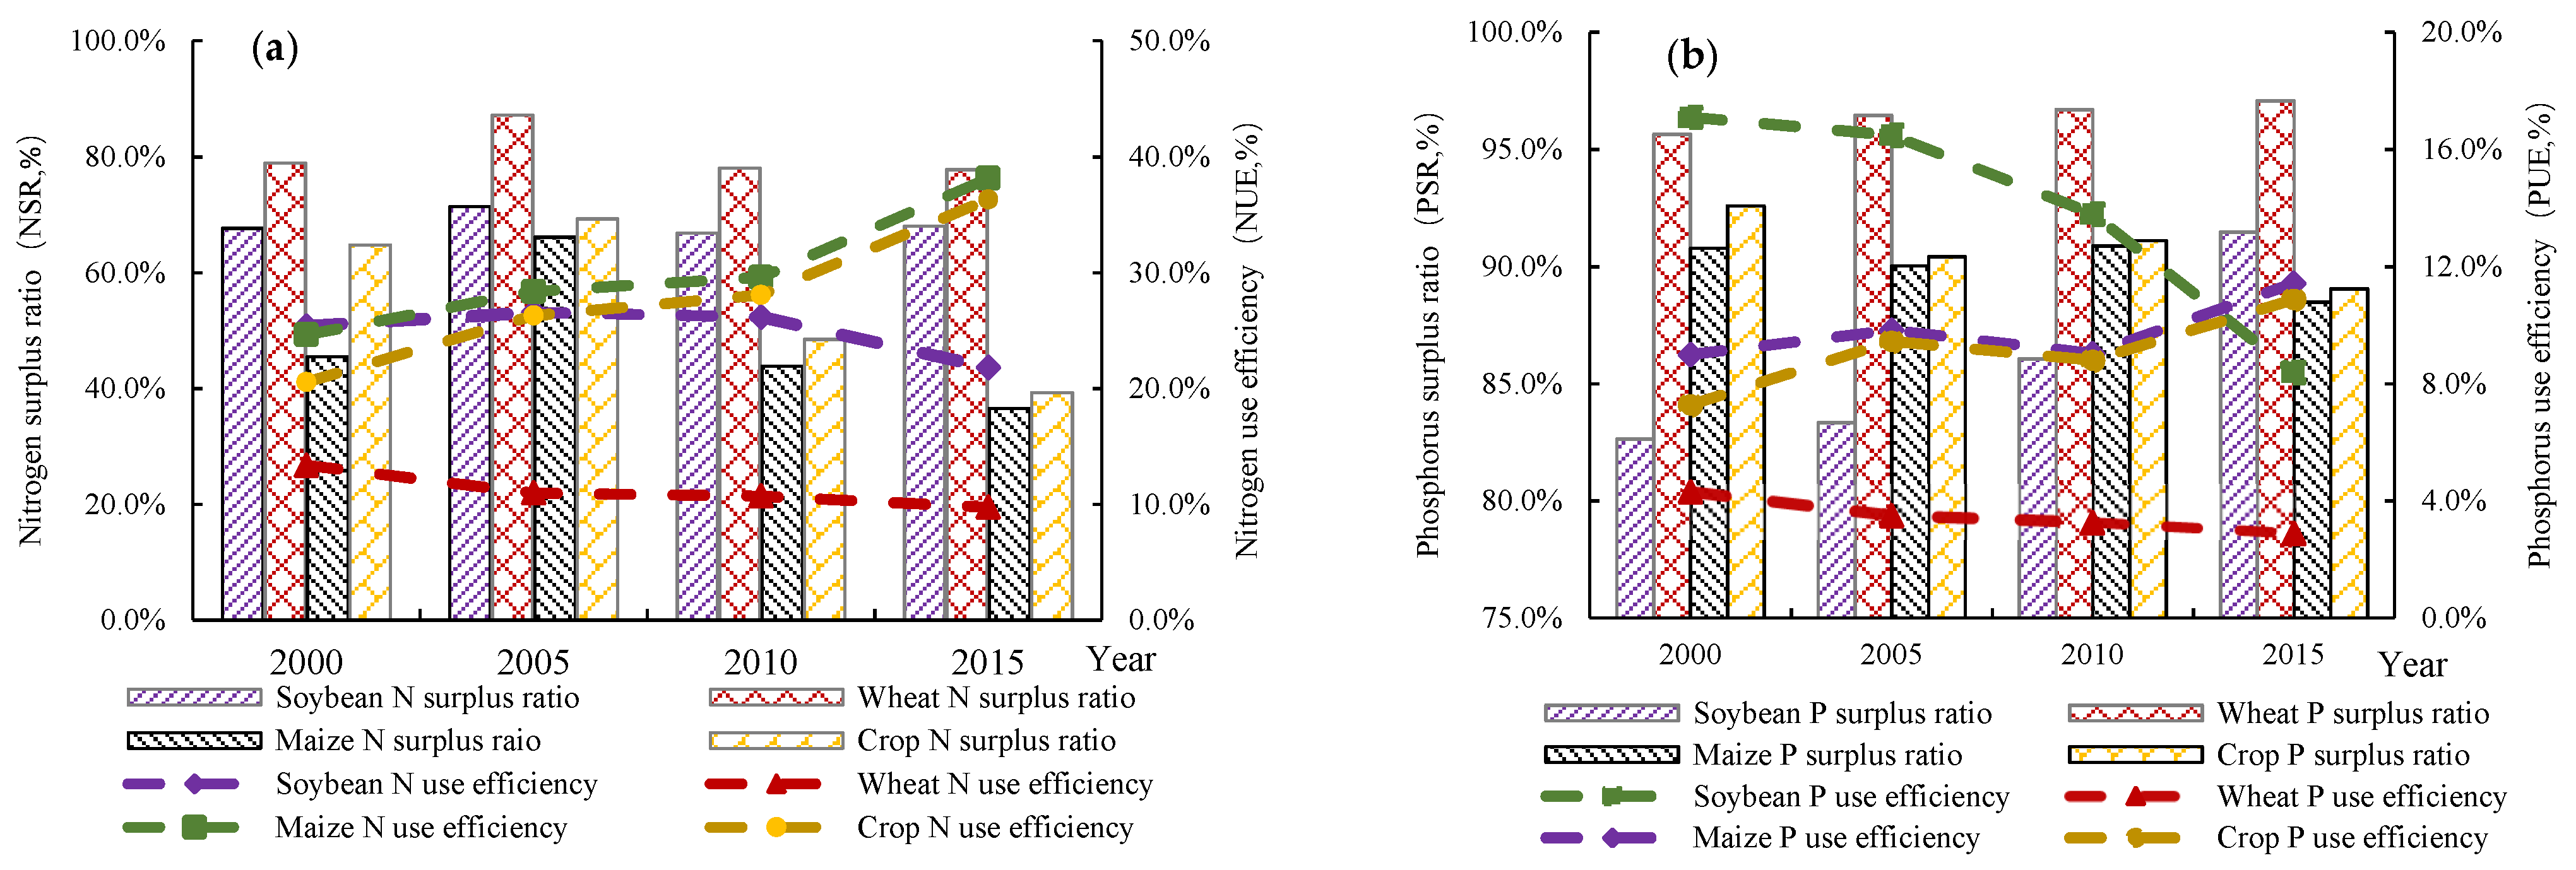
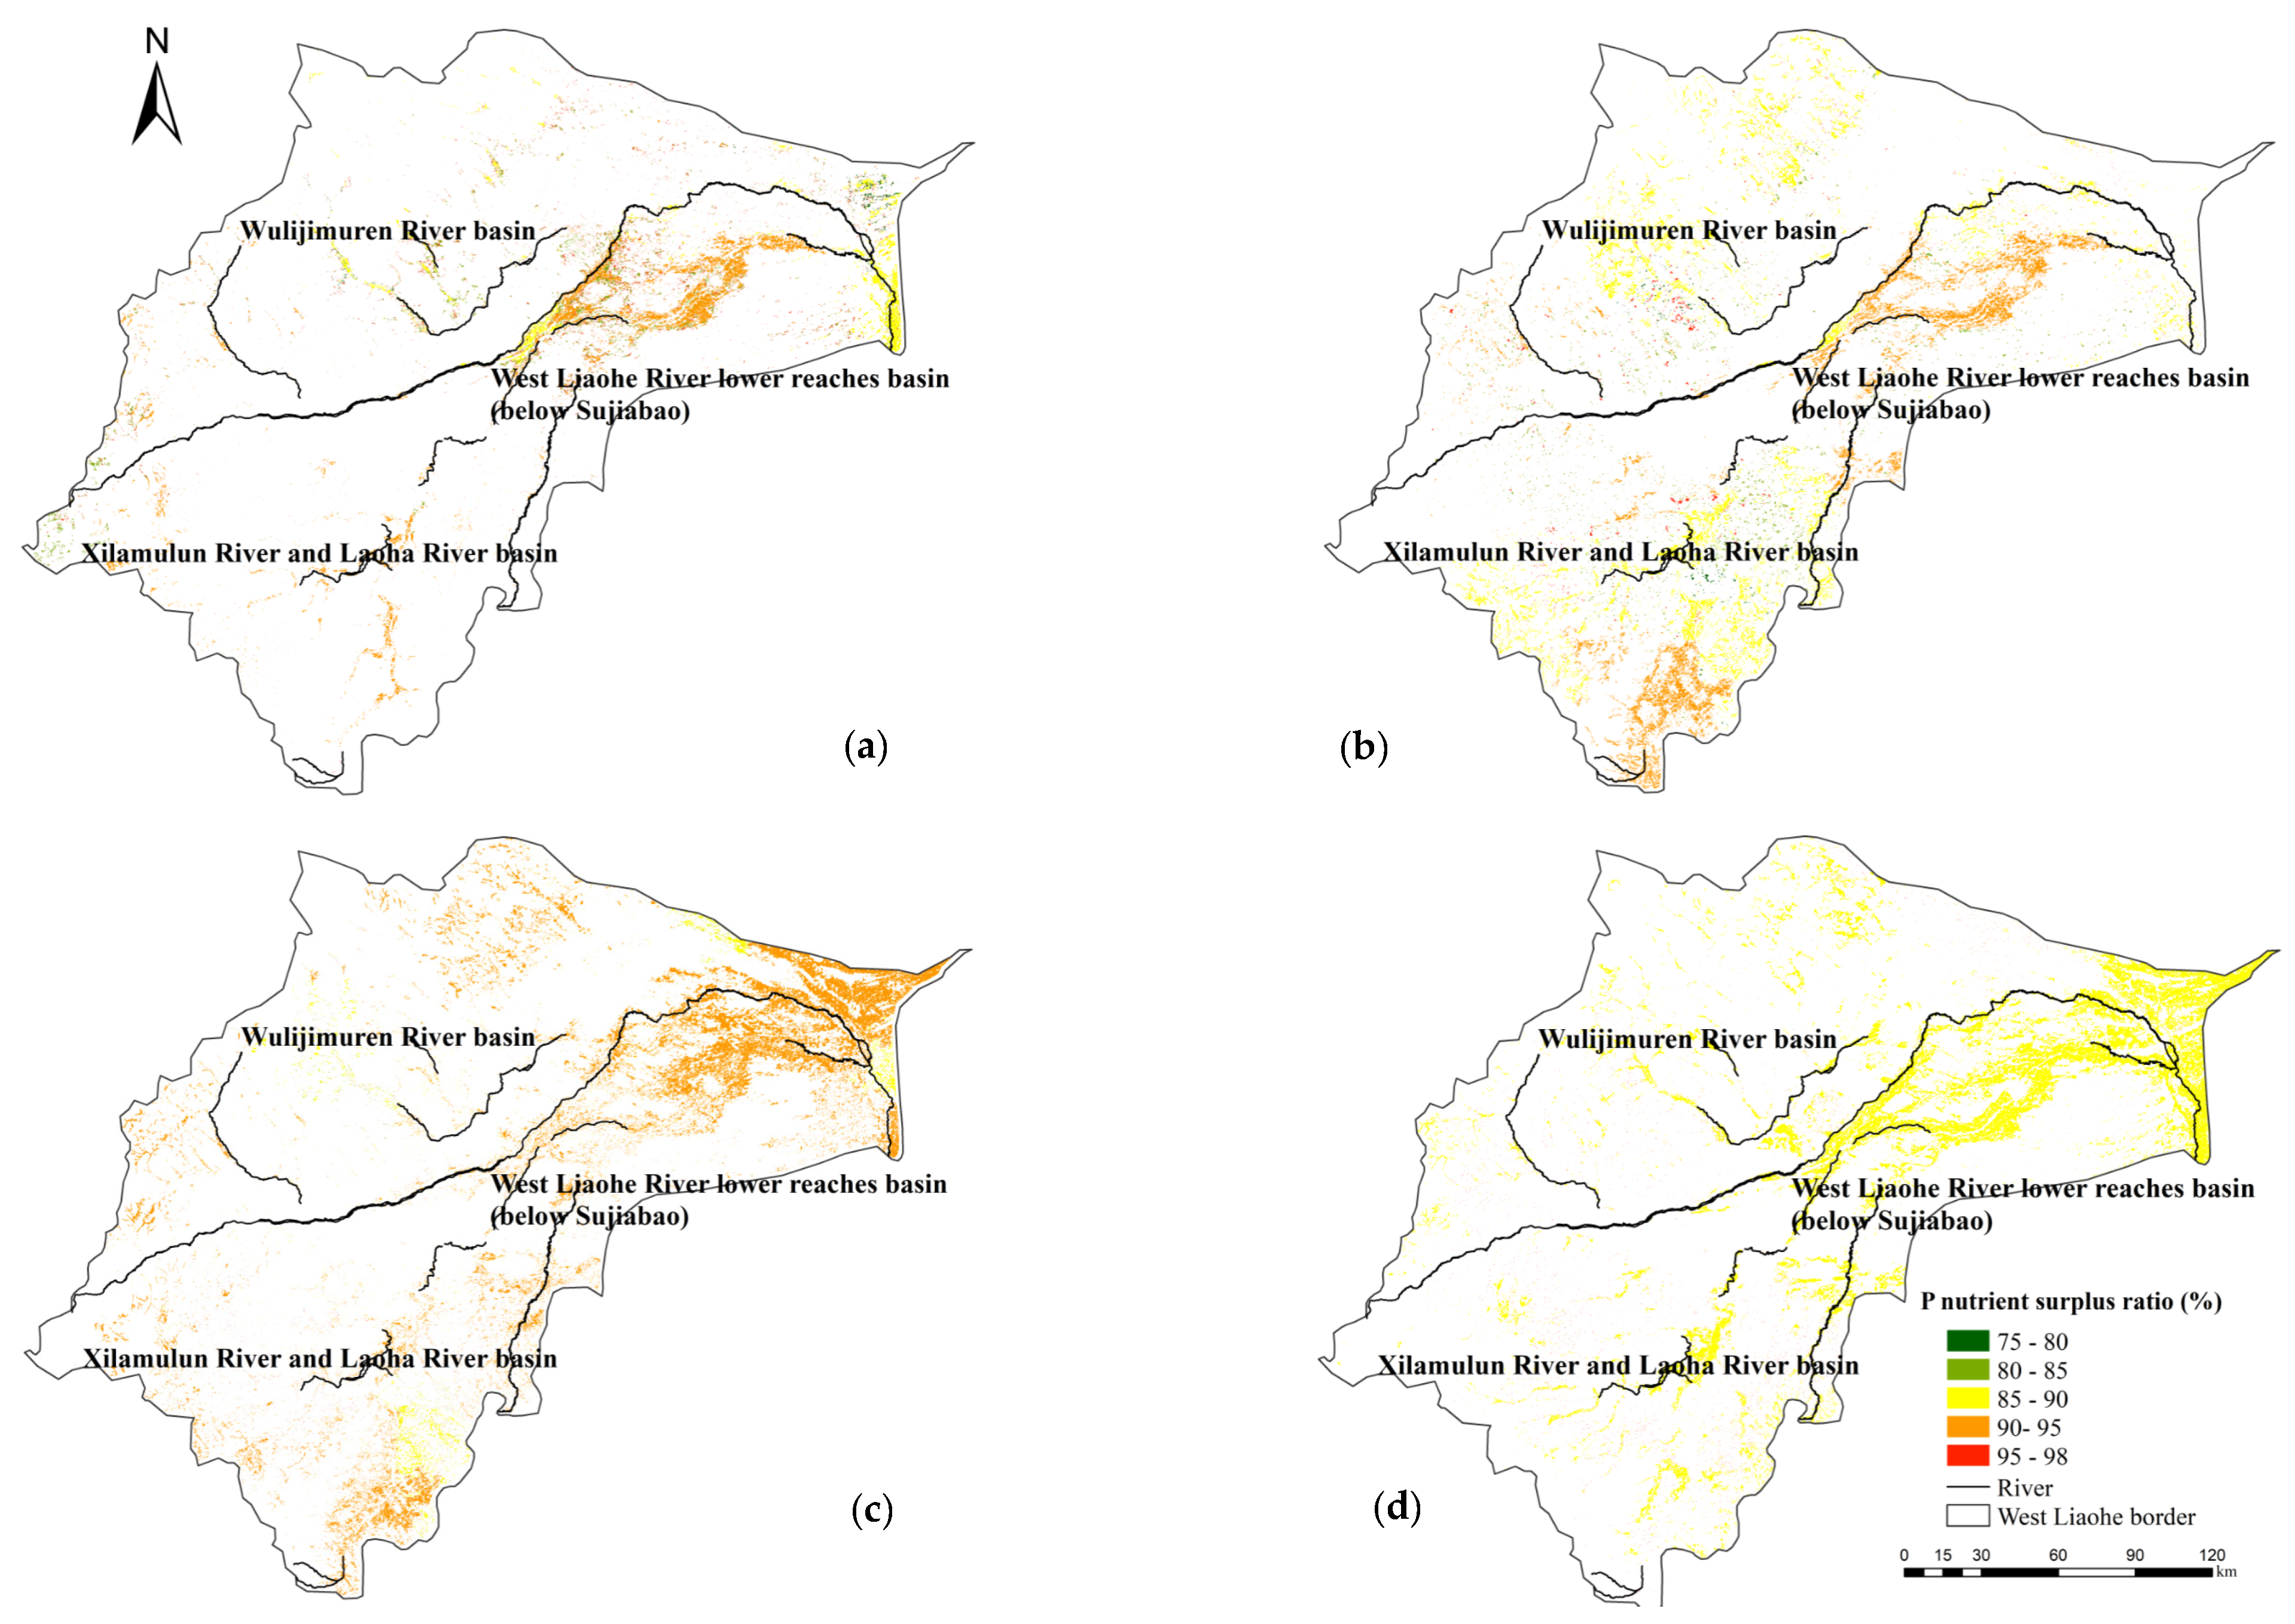
3.4. N and P Use Efficiencies and Surplus Ratios
4. Discussion
4.1. Crop Layout, Inner Mongolia Agricultural Policy, and Impact on N and P Balance
4.2. N and P Surplus and Non-Point Source Pollution
4.3. Future Potential Steps and Research Needs
5. Conclusions
Author Contributions
Funding
Institutional Review Board Statement
Informed Consent Statement
Data Availability Statement
Acknowledgments
Conflicts of Interest
References
- Damien, A.; Milton, J.; Margareth, S.P.M.; Vincent, D. Classification of MODIS EVI time series for crop mapping in the state of Mato Grosso, Brazil. Int. J. Remote Sens. 2011, 32, 7847–7871. [Google Scholar]
- Chen, X.; Cui, Z.; Fan, M.; Vitousek, P.; Zhao, M.; Ma, W.; Wang, Z.; Zhang, W.; Yan, X.; Yang, J.; et al. Producing more grain with lower environmental costs. Nature 2014, 514, 486–489. [Google Scholar] [CrossRef] [PubMed]
- Tilman, D.; Fargione, J.; Wolff, B.; D’Antonio, C.; Dobson, A.; Howarth, R.; Schindler, D.; Schlesinger, W.H.; Simberloff, D.; Swackhamer, D. Forecasting agriculturally driven global environmental change. Science 2001, 292, 281–284. [Google Scholar] [CrossRef] [PubMed]
- Schultz, B. Contribution of water management and flood protection to food security and sustainable development of coastal and deltaic areas. Irrig. Drain. 2018, 67, 123–135. [Google Scholar] [CrossRef]
- Steduto, P.; Schultz, B.; Unver, O.; Ota, S.; Vallee, D.; Kulkarni, S.; Garcia, M.D.A. Food security by optimal use of water. Synthesis of the 6th and 7th World Water Forums and developments since then. Irrig. Drain. 2018, 67, 327–344. [Google Scholar] [CrossRef]
- United Nations, Department of Economic and Social Affairs, Population Division. World Population Prospects, Medium Prognosis. The 2019 Revision; United Nations: New York, NY, USA, 2019. [Google Scholar]
- Wrachien, D.D.; Schultz, B.; Goli, M.B. Impacts of population growth and climate change on food production and irrigation and drainage needs: A world-wide view. Irrig. Drain. 2021, 1–15. [Google Scholar] [CrossRef]
- Guo, L.; Yang, R.; Wang, D. A study on the spatial difference of farmland nitrogen nutrient budget in the Bohai Rim region, China. J. Geogr. Sci. 2012, 22, 761–768. [Google Scholar] [CrossRef]
- Wang, W.S.; Yang, S.H.; Zhang, A.H.; Yang, Z.L. Synthesis of a slow-release fertilizer composite derived from waste straw that improves water retention and agricultural yield. Sci. Total Environ. 2021, 768, 144978. [Google Scholar] [CrossRef]
- Zhang, J.; Liu, Y.; Zheng, T.; Zhao, X.; Liu, H.; Zhang, Y. Nutrient and Stoichiometric Characteristics of Aggregates in a Sloping Farmland Area under Different Tillage Practices. Sustainability 2021, 13, 890. [Google Scholar] [CrossRef]
- Casadei, E.; Albert, J. Food and Agriculture Organization of the United Nations. Encycl. Food Sci. Nutr. 2003, 1, 2587–2593. [Google Scholar]
- Wang, J.; Fu, P.H.; Wang, F.; Fahad, S.; Pravat, K.; Mohapatra, P.K.; Chen, Y.T.; Zhang, C.D.; Peng, S.B.; Cui, K.H.; et al. Optimizing nitrogen management to balance rice yield and environmental risk in the Yangtze River’s middle reaches. Environ. Sci. Pollut. Res. 2019, 26, 901–4912. [Google Scholar] [CrossRef] [PubMed]
- Cui, S.; Shi, Y.; Groffman, P.M.; William, H.S.; Zhu, Y.J. Centennial-scale analysis of the creation and fate of reactive nitrogen in China (1910–2010). Proc. Natl. Acad. Sci. USA 2013, 110, 2052–2057. [Google Scholar] [CrossRef] [PubMed]
- Li, Z.Y.; Sun, X.T.; Huang, Z.H.; Zhang, X.C.; Wang, Z.H.; Li, S.Q.; Zheng, W.; Zhai, B.N. Changes in nutrient balance, environmental effects, and green development after returning farmland to forests: A case study in Ningxia, China. Sci. Total Environ. 2020, 735, 139370. [Google Scholar] [CrossRef] [PubMed]
- Liu, X.Y. Study on Nutrient Balance and Demand in Chinese Agricultural Production; Chinese Academy of Agricultural Sciences: Beijing, China, 2018. [Google Scholar]
- Lederer, J.; Karungi, J.; Ogwang, F. The potential of wastes to improve nutrient levels in agricultural soils: A material flow analysis case study from Busia District, Uganda. Agric. Ecosyst. Environ. 2015, 207, 26–39. [Google Scholar] [CrossRef]
- Tien, M.T.; Thu, M.T.; Thu, N.B.; Quang, B.L. Spatially Explicit Assessment of Nutrient Demands for Promoting Efficient Regional Fertilizer-use Management in Vietnam. Glob. Environ. Res. 2015, 19, 43–49. [Google Scholar]
- Hoang, V.N.; Alauddin, M. Assessing the eco-environmental performance of agricultural production in OECD countries: The use of nitrogen flows and balance. Nutr. Cycl. Agroecosyst. 2010, 87, 353–368. [Google Scholar] [CrossRef]
- Oenema, O.; Kros, H.; Vries, W.D. Approaches and uncertainties in nutrient budgets: Implications for nutrient management and environmental policies. Eur. J. Agron. 2003, 20, 3–16. [Google Scholar] [CrossRef]
- Harries, M.; Flower, K.C.; Scanlan, C.A. Sustainability of nutrient management in grain production systems of south-west Australia. Crop Pasture Sci. 2021, 72, 197–212. [Google Scholar] [CrossRef]
- Ouyang, W.J.; Li, Z.; Liu, J.; Guo, J.S.; Fang, F.; Xiao, Y.; Lu, L.H. Inventory of apparent nitrogen and phosphorus balance and risk of potential pollution in typical sloping cropland of purple soil in China—A case study in the Three Gorges. Reserv. Reg. Ecol. Eng. 2017, 106, 620–628. [Google Scholar] [CrossRef]
- Nikfar, S.; Farshchi, A.; Visser, R. Organization for Economic Cooperation and Development (OECD). Encycl. Toxicol. 2014, 4, 704–710. [Google Scholar]
- Zheng, M.M.; Zheng, H.; Wu, Y.X.; Xiao, Y.; Du, Y.H.; Xu, W.H.; Lu, F.; Wang, X.K.; Ouyang, Z.Y. Changes in nitrogen budget and potential risk to the environment over 20years (1990–2010) in the agroecosystems of the Haihe Basin, China. J. Environ. Sci. 2015, 28, 195–202. [Google Scholar] [CrossRef] [PubMed]
- Bedada, W.; Lemenih, M.; Karltun, E. Soil nutrient build-up, input interaction effects and plot level N and P balances under long-term addition of compost and NP fertilizer. Agric. Ecosyst. Environ. 2016, 218, 220–231. [Google Scholar] [CrossRef]
- Rahman, M.; Islam, M.; Jahiruddin, M.; Haque, M.Q. Management of Organic Manure and Inorganic Fertilizer in the Maize-Mungbean/Dhaincha-T. Aman Rice Cropping Pattern for Increased Crop Production. Bangladesh J. Agric. Res. 2012, 37, 225–234. [Google Scholar] [CrossRef]
- Guo-Dong, L.I.; Shi, G.F.; Dong-Xing, W.U. Research on energy balance of the typical winter wheat farmland ecosystem in the Huanghuaihai plain: A case study in Fengqiu region. J. Meteorol. Environ. 2017, 33, 93–100. [Google Scholar]
- Feng, Z.M.; Yang, L.; Yang, Y.Z. Temporal and Spatial Distribution Patterns of Grain Crops in the West Liaohe River Basin. J. Resour. Ecol. 2014, 3, 244–252. [Google Scholar]
- Holland, E.A.; Dentener, F.J.; Braswell, B.H.; Sulzman, J.M. Contemporary and pre-industrial global reactive nitrogen budgets. Biogeochemistry 1999, 46, 7–43. [Google Scholar] [CrossRef]
- Ahani, H.; Noshadi, M. Application of Cadastre Maps, Agricultural Database and MODIS Satellite Images for Monitoring Cultivated Areas. Iran J. Sci. Technol. Trans. Civ. Eng. 2019, 43, 179–192. [Google Scholar] [CrossRef]
- Li, R.Y.; Xu, M.Q.; Chen, Z.Y.; Gao, B.B.; Cai, J.; Shen, F.X.; He, X.L.; Zhuang, Y.; Chen, D.L. Phenology-based classification of crop species and rotation types using fused MODIS and Landsat data: The comparison of a random-forest-based model and a decision-rule-based mode. Soil Tillage Res. 2021, 206, 104838. [Google Scholar] [CrossRef]
- Ren, S.J.; Guo, B.; Wu, X.; Zhang, L.G.; Ji, M.; Wang, J. Winter wheat planted area monitoring and yield modeling using MODIS data in the Huang-Huai-Hai Plain, China. Comput. Electron. Agric. 2021, 183, 106049. [Google Scholar] [CrossRef]
- Gao, M.X.; Zhang, Z.; Zhao, G.X.; Li, J.H. Monitoring and regulation management system of water, nutrient and salinity in farmland based on WebGIS. Trans. Chin. Soc. Agric. Eng. 2018, 34, 89–99. [Google Scholar]
- Cai, Z.J.; Wang, B.R.; Zhang, L.; Wen, S.L.; Xu, M.G.; Tom, H.M.; Alison, M. Carswell, Suduan Gao. Striking a balance between N sources: Mitigating soil acidification and accumulation of phosphorous and heavy metals from manure. Sci. Total Environ. 2021, 754, 142189. [Google Scholar] [CrossRef] [PubMed]
- Yang, C.X.; Zheng, H.; Huang, B.B.; Li, R.N.; Ouyang, Z.Y.; Li, C. Crop Structure Changes Altered the Cropland Nitrogen Balance between 2005 and 2015 on the Sanjiang Plain, China. Sustainability 2018, 10, 4011. [Google Scholar] [CrossRef]
- Wang, Y.; Cao, Y.; Feng, G.Z.; Li, X.Y.; Li, X.R.; Coulter, J.A.; Gao, Q. Integrated Soil–Crop System Management with Organic Fertilizer Achieves Sustainable High Maize Yield and Nitrogen Use Efficiency in Northeast China Based on an 11-Year Field Study. Agronomy 2020, 10, 1078. [Google Scholar] [CrossRef]
- Yan, L.; Wang, Y.; Deng, W.; Li, D.L. Dynamic Change and Influence Factor Analysis of Vegetation Community of West Liaohe River Plain. IOP Conf. Ser. Earth Environ. Sci. 2020, 545, 012007. [Google Scholar] [CrossRef]
- Yang, X.L.; Ren, L.L.; Jiao, D.L.; Yong, B.; Jiang, S.H.; Song, S.H. Estimation of Daily Actual Evapotranspiration from ETM+ and MODIS Data of the Headwaters of the West Liaohe Basin in the Semiarid Regions of China. J. Hydrol. Eng. 2013, 18, 1530–1538. [Google Scholar] [CrossRef]
- Oldoni, L.V.; Cattani, C.E.V.; Mercante, E.; Johann, J.A. Annual cropland mapping using data mining and OLI Landsat-8. Rev. Bras. Eng. Agrícola Ambient. 2019, 23, 952–958. [Google Scholar] [CrossRef]
- Lv, T.T.; Sun, X.Y.; Yu, B.H. Extraction of Forest Resources in Thailand based on MODIS Data. Resour. Ence 2008, 30, 1077–1083. [Google Scholar]
- Xiao, X.M.; Boles, S.; Frolking, S.; Li, C.S.; Babu, J.Y.; Salas, W.; Moore, B. Mapping paddy rice agriculture in South and Southeast Asia using multi-temporal MODIS images. Remote Sens. Environ. 2006, 100, 95–113. [Google Scholar] [CrossRef]
- Chang, J.; Hansen, M.C.; Pittman, K.; Carroll, M.; Di Miceli, C. Corn and soybean mapping in the united states using MODIS time-series data sets. Agron. J. 2007, 99, 1654–1664. [Google Scholar] [CrossRef]
- Chen, Y.L.; Lu, D.S.; Moran, E.; Batistella, M.; Dutra, L.V.; Sanches, I.D.; da Silva, R.F.B.; Huang, J.F. Mapping croplands, cropping patterns, and crop types using MODIS time-series data. Int. J. Appl. Earth Obs. Geoinf. 2018, 69, 133–147. [Google Scholar] [CrossRef]
- Onojeghuo, A.O.; Blackburn, G.A.; Wang, Q.M.; Atkinson, P.M.; Kindred, D.; Miao, Y.X. Rice crop phenology mapping at high spatial and temporal resolution using downscaled MODIS time-series. GI Sci. Remote Sens. 2018, 55, 659–677. [Google Scholar] [CrossRef]
- Zhu, X.F.; Xiao, G.F.; Zhang, D.J.; Guo, L.L. Mapping abandoned farmland in China using time series MODIS NDVI. Sci. Total Environ. 2021, 755, 142651. [Google Scholar] [CrossRef] [PubMed]
- Xu, X.M.; Conrad, C.; Doktor, D. Optimising Phenological Metrics Extraction for Different Crop Types in Germany Using the Moderate Resolution Imaging Spectrometer (MODIS). Remote Sens. 2017, 9, 254. [Google Scholar] [CrossRef]
- Sakamoto, T.; Gitelson, A.A.; Arkebauer, T.J. MODIS-based corn grain yield estimation model incorporating crop phenology information. Remote Sens. Environ. 2013, 131, 215–231. [Google Scholar] [CrossRef]
- Liu, J.H.; Zhu, W.Q.; Atzberger, C.; Zhao, A.Z.; Pan, Y.Z.; Huang, X. A Phenology-Based Method to Map Cropping Patterns under a Wheat-Maize Rotation Using Remotely Sensed Time-Series Data. Remote Sens. 2018, 10, 1203. [Google Scholar] [CrossRef]
- He, W.T.; Jiang, R.; He, P.; Yang, J.Y.; Zhou, W.; Ma, J.C.; Liu, Y.X. Estimating soil nitrogen balance at regional scale in China’s croplands from 1984 to 2014. Agric. Syst. 2018, 167, 125–135. [Google Scholar] [CrossRef]
- Chen, M.; Fu, S.; Shindo, J. China’s agricultural nitrogen flows in 2011: Environmental assessment and management scenarios. Resour. Conserv. Recycl. 2016, 111, 10–27. [Google Scholar] [CrossRef]
- Chuan, L.M.; He, P.; Zhao, T.K.; Zheng, H.G. Nitrogen cycling and balance for wheat in China. Chin. J. Appl. Ecol. 2015, 26, 76–86. [Google Scholar]
- Zhang, G.B.; Song, K.F.; Miao, X.; Huang, Q.; Ma, J.; Gong, H.; Zhang, Y.; Paustian, K.; Yan, X.Y.; Xu, H. Nitrous oxide emissions, ammonia volatilization, and grain-heavy metal levels during the wheat season: Effect of partial organic substitution for chemical fertilizer. Agric. Ecosyst. Environ. 2021, 311, 107340. [Google Scholar]
- Laouali, D.; Delon, C.; Adon, M.; Ndiaye, O.; Saneh, I.; Gardrat, E.; Dias-Alves, M.; Tagesson, T.; Fensohlt, R.; Galy-Lacaux, C. Source contributions in precipitation chemistry and analysis of atmospheric nitrogen deposition in a Sahelian dry savanna site in West Africa. Atmos. Res. 2020, 251, 105423. [Google Scholar] [CrossRef]
- Al-Shammari, D.; Fuentes, I.; Whelan, B.M.; Filippi, P.; Bishop, T.F.A. Mapping of Cotton Fields Within-Season Using Phenology-Based Metrics Derived from a Time Series of Landsat Imagery. Remote Sens. 2020, 12, 3038. [Google Scholar] [CrossRef]
- De Astarloa, D.A.D.; Pengue, W.A. Nutrients Metabolism of Agricultural Production in Argentina: NPK Input and Output Flows from 1961 to 2015. Ecol. Econ. 2018, 147, 74–83. [Google Scholar] [CrossRef]
- Run-Ping, S.; Sun, B.; Guo, Z.Q. Spatial and Temporal Variability of N, P and K Balances for Agroecosystems in China. Pedosphere 2005, 15, 347–355. [Google Scholar]
- Bai, Z.H.; Li, H.G.; Yang, X.Y.; Zhou, B.K.; Shi, X.J.; Wang, B.R.; Li, D.C.; Shen, J.B.; Chen, Q.; Qin, W. The critical soil P levels for crop yield, soil fertility and environmental safety in different soil types. Plant Soil 2013, 372, 27–37. [Google Scholar] [CrossRef]
- Wang, X.; Zhang, F. Analysis on Present Situation and Regional Disparity of Agricultural Chemical Fertilizer Input in China. Acta Agric. Jiangxi 2011, 23, 169–173. [Google Scholar]


| Data | Time Period | Scale | Source |
|---|---|---|---|
| MOD09Q1 | 2000, 2005, 2010, 2015 | 250 m | http://modis.gsfc.nasa.gov/ (accessed on 5 July 2015) |
| Landsat 8 OLI | 2000, 2005, 2010, 2015 | 30 m | https://earthexplorer.usgs.gov/ (accessed on 7 July 2015) |
| Statistical data of crop planting area | 2000, 2005, 2010, 2015 | Yearly | China County Statistical Yearbook |
| GPS sampling point data of crops | 2000, 2005, 2010, 2015 | - | Field survey in July 2010 and June 2015 |
| Farmland nutrient data | 2000, 2005, 2010, 2015 | - | China Agricultural Products Cost Benefit Compilation of information; field survey in July 2010 and June 2015 |
| Crop | April | May | June | July | August | September | |||||||||||
|---|---|---|---|---|---|---|---|---|---|---|---|---|---|---|---|---|---|
| 2 | 3 | 1 | 2 | 3 | 1 | 2 | 3 | 1 | 2 | 3 | 1 | 2 | 3 | 1 | 2 | 3 | |
| Maize | Sowing | Emerging | Emerging–Elongating | Tasseling | Tasseling–Milking | Harvesting | |||||||||||
| Wheat | Sowing | Sowing–Emerging | Tillering | Elongating–Milking | Harvesting | ||||||||||||
| Soybean | Sowing–Emerging | Elongating | Elongating–Flowering | Podding–Harvesting | |||||||||||||
| N and P Nutrient Input | N and P Nutrient Output |
|---|---|
| = (Nchemical + Nlive) × NO2Rate_i | |
| Nleach = Aeracrop × NLRate_i | |
| NPrunoff = Aeracrop × NPRRate_i | |
| NPatmo(dry + wet) = Aeracrop × DWRate_i | |
| NPbiol = AreaSoybean × NRate_i |
| Crop | Region | N Chemical Fertilizer (kg ha−1) | P Chemical Fertilizer (kg ha−1) | ||||||
|---|---|---|---|---|---|---|---|---|---|
| 2000 | 2005 | 2010 | 2015 | 2000 | 2005 | 2010 | 2015 | ||
| Soybean | 1 | 68.3 | 100.5 | 142.5 | 178.5 | 39.8 | 61.5 | 102.0 | 137.3 |
| 2 | 59.3 | 86.3 | 123.0 | 154.5 | 30.8 | 47.3 | 78.0 | 105.8 | |
| 3 | 59.3 | 87.0 | 123.0 | 154.5 | 24.0 | 36.8 | 60.8 | 81.8 | |
| Wheat | 1 | 171.0 | 250.5 | 356.3 | 446.3 | 90.0 | 139.5 | 230.3 | 310.5 |
| 2 | 183.0 | 268.5 | 381.0 | 477.8 | 98.3 | 152.3 | 251.3 | 339.0 | |
| 3 | 157.5 | 230.3 | 327.0 | 410.3 | 75.8 | 117.0 | 192.8 | 260.3 | |
| Maize | 1 | 142.5 | 208.5 | 296.3 | 372.0 | 75.0 | 116.3 | 191.3 | 258.8 |
| 2 | 153.0 | 223.5 | 317.3 | 398.3 | 82.5 | 126.8 | 209.3 | 282.8 | |
| 3 | 131.3 | 192.0 | 273.0 | 342.0 | 63.0 | 97.5 | 160.5 | 216.8 | |
| Crop | Region | N Livestock Fertilizer (kg ha−1) | P Livestock Fertilizer (kg ha−1) | ||||||
|---|---|---|---|---|---|---|---|---|---|
| 2000 | 2005 | 2010 | 2015 | 2000 | 2005 | 2010 | 2015 | ||
| Soybean | 1 | 16.5 | 27.8 | 24.8 | 22.5 | 10.5 | 19.5 | 18.0 | 15.8 |
| 2 | 36.8 | 63.0 | 56.3 | 51.0 | 22.5 | 41.3 | 38.3 | 33.8 | |
| 3 | 28.5 | 48.8 | 43.5 | 39.8 | 18.8 | 33.8 | 31.5 | 27.8 | |
| Wheat | 1 | 54.8 | 93.8 | 84.8 | 75.8 | 36.0 | 65.3 | 60.8 | 53.3 |
| 2 | 84.0 | 143.3 | 129.0 | 115.5 | 51.0 | 91.5 | 85.5 | 75.0 | |
| 3 | 48.8 | 82.5 | 74.3 | 66.8 | 31.5 | 57.0 | 53.3 | 46.5 | |
| Maize | 1 | 28.5 | 48.8 | 43.5 | 39.8 | 18.8 | 33.8 | 31.5 | 27.8 |
| 2 | 46.5 | 79.5 | 71.3 | 63.8 | 27.8 | 49.5 | 46.5 | 40.5 | |
| 3 | 26.3 | 45.8 | 40.5 | 36.8 | 17.3 | 31.5 | 29.3 | 25.5 | |
| County | 2000 | 2005 | 2010 | 2015 | County | 2000 | 2005 | 2010 | 2015 |
|---|---|---|---|---|---|---|---|---|---|
| Weichang | 45.1 | 43.5 | 44.4 | 46.1 | HexingtenQi | 20.6 | 19.5 | 19.7 | 19.5 |
| Chifeng | 63.8 | 63.9 | 66.0 | 71.2 | OngniudQi | 41.8 | 41.6 | 41.3 | 43.5 |
| Ar Horqin Qi | 26.3 | 25.7 | 24.0 | 25.9 | KarqinQi | 32.9 | 33.0 | 30.6 | 30.9 |
| Aohan | 52.5 | 53.3 | 53.1 | 54.0 | Ningcheng | 52.3 | 52.9 | 52.3 | 53.9 |
| Horqin Zuoyi Houqi | 42.6 | 40.3 | 41.6 | 40.3 | Tongliao | 37.0 | 37.0 | 37.9 | 38.4 |
| HorqinZuoyiZhongqi | 31.2 | 28.7 | 27.7 | 28.3 | Kailu | 31.7 | 30.6 | 26.5 | 26.7 |
| Hure Qi | 13.2 | 12.0 | 11.1 | 14.0 | Naiman | 35.4 | 33.1 | 31.0 | 32.2 |
| Jarud Qi | 22.3 | 19.9 | 19.4 | 20.7 | BairinZuoi | 31.0 | 31.5 | 30.0 | 29.6 |
| HorqinYouyiZhongqi | 17.9 | 17.9 | 17.9 | 18.0 | Jianping | 47.0 | 46.1 | 45.7 | 45.4 |
| Pingquan | 40.1 | 33.8 | 34.2 | 42.3 | Shuangliao | 17.7 | 25.3 | 27.7 | 23.2 |
| Bairin Youqi | 13.2 | 11.9 | 12.7 | 13.1 | Tongyu | 11.3 | 22.8 | 24.9 | 24.5 |
| Linxi | 19.5 | 18.1 | 18.1 | 18.4 |
| Crop | Region | 2000 | 2005 | 2010 | 2015 |
|---|---|---|---|---|---|
| Soybean | 1 | 414.0 | 326.9 | 376.3 | 360.4 |
| 2 | 415.6 | 328.2 | 377.7 | 361.8 | |
| 3 | 384.6 | 303.7 | 349.5 | 334.8 | |
| Wheat | 1 | 90.0 | 134.6 | 136.2 | 84.5 |
| 2 | 90.0 | 134.7 | 136.3 | 84.5 | |
| 3 | 74.0 | 110.7 | 112.0 | 69.5 | |
| Maize | 1 | 12.4 | 21.0 | 28.8 | 44.2 |
| 2 | 12.4 | 21.0 | 28.8 | 44.3 | |
| 3 | 13.7 | 23.2 | 31.9 | 49.0 |
| Crop | Ratio of Straw to Grains | N in Straw (%) | P in Straw (%) | Proportions Returned to Field (%) |
|---|---|---|---|---|
| Soybean | 1.6 | 17 | 0.20 | 17 |
| Wheat | 1.1 | 0.65 | 0.08 | 40 |
| Maize | 2 | 0.92 | 0.15 | 32 |
| Crop | Region | 2000 | 2005 | 2010 | 2015 |
|---|---|---|---|---|---|
| Soybean | 1 | 2069.1 | 3094.2 | 3131.7 | 1942.7 |
| 2 | 2060.4 | 3081.2 | 3118.6 | 1934.6 | |
| 3 | 2475.9 | 3702.5 | 3747.4 | 2324.6 | |
| Wheat | 1 | 6264.9 | 4947.2 | 5693.9 | 5453.7 |
| 2 | 6260.7 | 4943.8 | 5690.0 | 5450.0 | |
| 3 | 4171.3 | 3293.9 | 3791.1 | 3631.1 | |
| Maize | 1 | 2074.0 | 3514.4 | 4831.2 | 7419.0 |
| 2 | 2077.1 | 3519.7 | 4838.5 | 7430.3 | |
| 3 | 1959.5 | 3320.4 | 4564.5 | 7009.5 |
| Crop | N in Seeds (kg ha−1) | P in Seeds (kg ha−1) |
|---|---|---|
| Soybean | 5.3 | 0.14 |
| Wheat | 2.1 | 1.24 |
| Maize | 1.6 | 0.15 |
| Crop | N in Grain (%) | P in Grain (%) |
|---|---|---|
| Soybean | 5.3 | 0.48 |
| Wheat | 2.1 | 0.41 |
| Maize | 1.6 | 0.27 |
| Years | Crop | Statistical Data (×104 ha) | Remote Sensing Data (×104 ha) | Area Precision (%) | Producer’s Accuracy (%) | User’s Accuracy (%) | Overall Accuracy (%) | Kappa |
|---|---|---|---|---|---|---|---|---|
| 2000 | Maize | 48.3 | 34.5 | 71.4 | 95.1 | 95.0 | 85.6 | 0.87 |
| Wheat | 10.7 | 8.0 | 74.9 | 81.2 | 83.3 | |||
| Soybean | 10.1 | 10.6 | 95.6 | 87.0 | 73.0 | |||
| 2005 | Maize | 70.5 | 74.7 | 94.0 | 96.0 | 87.0 | 88.2 | 0.87 |
| Wheat | 4.5 | 3.5 | 76.6 | 75.0 | 88.2 | |||
| Soybean | 8.6 | 7.9 | 91.6 | 95.0 | 90.0 | |||
| 2010 | Maize | 104.0 | 103.1 | 99.1 | 90.5 | 75.0 | 82.3 | 0.85 |
| Wheat | 3.9 | 2.7 | 70.0 | 86.0 | 82.9 | |||
| Soybean | 8.1 | 6.6 | 81.1 | 73.1 | 90.0 | |||
| 2015 | Maize | 131.2 | 143.6 | 90.5 | 89.5 | 73.9 | 83.6 | 0.78 |
| Wheat | 4.4 | 3.1 | 70.5 | 85.3 | 92.9 | |||
| Soybean | 1.6 | 1.3 | 79.7 | 96.5 | 82.9 |
Publisher’s Note: MDPI stays neutral with regard to jurisdictional claims in published maps and institutional affiliations. |
© 2021 by the authors. Licensee MDPI, Basel, Switzerland. This article is an open access article distributed under the terms and conditions of the Creative Commons Attribution (CC BY) license (https://creativecommons.org/licenses/by/4.0/).
Share and Cite
Zhao, Z.; Fan, B.; Liu, D. Evaluating the Impact of Crop Layout Changes on N and P Nutrient Balance: A Case Study in the West Liaohe River Basin, China. Sustainability 2021, 13, 7982. https://doi.org/10.3390/su13147982
Zhao Z, Fan B, Liu D. Evaluating the Impact of Crop Layout Changes on N and P Nutrient Balance: A Case Study in the West Liaohe River Basin, China. Sustainability. 2021; 13(14):7982. https://doi.org/10.3390/su13147982
Chicago/Turabian StyleZhao, Zijuan, Beilei Fan, and Dong Liu. 2021. "Evaluating the Impact of Crop Layout Changes on N and P Nutrient Balance: A Case Study in the West Liaohe River Basin, China" Sustainability 13, no. 14: 7982. https://doi.org/10.3390/su13147982
APA StyleZhao, Z., Fan, B., & Liu, D. (2021). Evaluating the Impact of Crop Layout Changes on N and P Nutrient Balance: A Case Study in the West Liaohe River Basin, China. Sustainability, 13(14), 7982. https://doi.org/10.3390/su13147982