Article

A Biomimetic Polynucleotides–Hyaluronic Acid Hydrogel Promotes Wound Healing in a Primary Gingival Fibroblast Model

Department of Medicine and Surgery, Histology and Embryology Lab, University of Parma, Via Volturno 39, 43126 Parma, Italy
*
Author to whom correspondence should be addressed.
Appl. Sci. 2021, 11(10), 4405; https://doi.org/10.3390/app11104405
Submission received: 25 April 2021 / Revised: 8 May 2021 / Accepted: 10 May 2021 / Published: 12 May 2021
(This article belongs to the Special Issue Application of Biomaterials for Tissue Engineering)

Abstract

:

Featured Application

The present study provides in vitro evidence supporting the use of a formulation of hyaluronic acid hydrogel enriched with polynucleotides to promote oral soft tissue healing.

Abstract

Polynucleotides (PN) have long been known as an effective supportive therapy for wound healing. The present study investigated whether a hydrogel formulation containing PN and hyaluronic acid (PN + HA) could promote wound healing in an in vitro model of gingival fibroblasts. PN promoted cell growth and viability as assessed by different assays, and PN + HA, though not significantly further increasing cell growth as compared to PN, supported the formation of dense multilayered cell nodules. PN promoted fibroblasts’ clonogenic efficiency and PN + HA further enhanced the formation of more numerous dense colonies. PN + HA appeared to significantly increase the expression of collagen 1a1 and 3a1, while not affecting proteoglycans deposition. Interestingly, when tested in a scratch assay, PN + HA achieved gap closure after 48 h, while cells in the comparison groups had not completely bridged the scratch even after 96 h. Taken together, these results demonstrate that PN + HA is a promising candidate for a supportive therapy to promote soft tissue healing in the oral cavity.

1. Introduction

Wound healing is one of the fundamental capabilities of living organisms, which allow them to withstand trauma and disease by regenerating or repairing lost tissue [1]. Unfortunately, several circumstances or conditions, such as wound extension or disease, can reduce the regenerative potential of tissues; supportive therapies are therefore needed to help tissues achieve their pristine continuity, aesthetic and function [2]. Dentistry and periodontics are examples of clinical fields where such therapies are sorely needed, as impaired healing may heavily impact oral function and patients’ well-being [3]. Most regenerative approaches are based on the use of a scaffold or matrix, which fills the gaps within the tissue, and offers a docking point and growth substrate to cell precursors [4]. Biomimetic approaches are of particular interest because they leverage the self-healing potential of tissues by relying on mechanisms that are already present in the organism [5]. Accordingly, scaffolds made of molecules that mimic the extracellular matrix are preferable, because they are somewhat already optimized for the task they have to accomplish [6]. One of such materials is hyaluronic acid, a biocompatible complex proteoglycan that is commonly found in human tissues, where it is responsible for maintaining tissue structure, volume and regulating the interactions of cells and bioactive cues in the extracellular matrix [7]. Hyaluronic acid has been long known and studied as a scaffold [8,9], because of its good tolerability and it ease of use [10], in different fields, including dentistry [11]. In the present work we combined hyaluronic acid with polynucleotides (PN), a mixture of double and single stranded deoxyribonucleotides of animal origin. PN are a natural polymer that binds water molecules, thus forming a 3-D gel. Clinically, when infiltrated, PN can moisturize and acquire pronounced viscoelastic properties that can be advantageously used at a tissue level. PN are then enzymatically cleaved and slowly release smaller oligonucleotides and water [12]. PN has been clinically used for almost 20 years in different class III medical devices because of its wound healing properties [13]. PNs have been shown to be effective in vitro in several cell models, ranging from dermal fibroblasts to chondrocytes and osteoblasts, and in vivo in many pre-clinical and clinical models, including skin grafts, surgical incision and ulcers [14]. PN have been shown to act in cells according to multiple pathways, including a salvage pathway, whereby cells are supplemented with an extra nucleotide supply that sustains an increase in cell growth [9,15]. Supplementing cells with polynucleotides actually recapitulate some of the molecular events that occur upon wound healing, as ATP and nucleotide strands are released from ruptured cells together with several other cellular components [16]. Such compounds have evolved to evoke appropriate tissue responses to the wound, with the goal of facilitating healing. A PN and HA-based hydrogel has yielded promising results in soft tissue [17] and intra-articular [18] applications. In the present paper we investigated the effects of a PN/Hyaluronic acid hydrogel on primary fibroblasts of gingival origin and assessed cell responses using assays that are relevant to wound healing.

2. Materials and Methods

2.1. Materials

Polynucleotides (PN, Mastelli s.r.l., Sanremo, Italy) are a DNA fraction of different lengths. Salmon trout gonads are the source used to extract PN through a processing that guarantees high DNA yields and chemical purity. All products used for the present study are commercially available as Class III medical devices: PN (7.5 mg/mL) and PN + HA (10 mg/mL PN and 10 mg/mL HA fixed combination with mannitol).

2.2. Cell Culture

Our study used HGF (Human primary fibroblasts; Normal, Human, Adult) of gingival origin from a commercial vendor (ATCC, LGC Standards S.R.L., Milan, Italy). Cells were routinely grown in complete Dulbecco modified MEM (DMEM, LifeTechnologies, Carlsbad, CA, USA) enriched with 10% Fetal Bovine Serum (FBS, LifeTechnologies, Carlsbad, CA, USA), 4 mM L-glutamine (Merck KGaA, Darmstadt, Germany), 100 IU/mL penicillin and 100 μg/mL streptomycin (PenStrep, Merck KGaA, Darmstadt, Germany), in a humidified atmosphere at 37 °C and 5% CO2. Cells were maintained in complete DMEM and monitored with a Nikon TMS inverted optical microscope (Nikon, Tokyo, Japan) in phase contrast. The microscope was equipped with a Nikon Digital Sight DS-2Mv acquisition system (Nikon, Tokyo, Japan) and NIS Elements F software (Nikon, Tokyo, Japan) for image analysis.
Once confluent, cells were detached using trypsin–EDTA (Merck KGaA, Darmstadt, Germany), counted and passaged onto new plates. This in vitro study comprised 3 experimental groups, namely the Control, PN and PN + HA groups. To perform the assays, cells were plated on plasticware and stimulated with either culture medium (Control) or 100 µg/mL PN or 100 µg/mL PN + HA 24 h after seeding.

2.3. Cell Count

To assess cell number, cells in the Control, PN and PN + HA groups were assayed after 96 h and 1 week from treatment. Briefly, cells were seeded in a 24-well plate at a density of 2 × 10⁴ cells/well, stimulated after 24 h and detached with trypsin-EDTA at the desired time point. Cells were resuspended in cold saline and counted with a Coulter Counter (Coulter Electronics Limited, Luton, UK). Counts were carried out in triplicate and supernatants were collected for ELISA assays.

2.4. Cell Viability

Cell viability was evaluated by MTT (Roche Applied Science, Monza, Italy) and CellTiter-Glo (Promega, Madison, WI, USA) assays 96 h and 1 week after stimulation. For each experiment, cells were seeded in a 96-well plate at a density of 8 × 10³ cells/well and stimulated 24 h after seeding.
The MTT assay was used according to the manufacturer’s indications. Briefly, cells were incubated for three hours with 0.5 mg/mL MTT labeling reagent and assayed by solving the formazane with a solubilization solution and then reading the sample’s absorbance at 570 nm by a microplate reader (Infinite F200 TECAN, Männedorf, Switzerland). For each sample, eight wells were assayed.
The CellTiter-Glo® assay was carried out following the manufacturer’s recommendations. Briefly, assay lysis buffer was added to the wells and mixed for 2 min, thus ensuring the release of intracellular ATP. The signal was stabilized by a 10 min RT incubation, and the samples were then read with a microplate reader (Infinite F200 TECAN, Männedorf, Switzerland). Control wells containing medium without cells were used to measure background luminescence. Four wells were assayed for each sample.

2.5. Clonogenic Efficiency Assay

Cells were seeded in a 6-well plate at final concentration of 150 cells/well. Twenty-four hours after seeding, cells were stimulated and incubated in a CO2-incubator at the saturated humidity conditions at 37 °C in 5% CO2 atmosphere for 2 weeks. Culture medium was renewed every three days. Thereafter, the culture plate with the pre-formed colonies was washed with PBS and fixed. Briefly, an equal volume of methanol/PBS for 2 min was added and then replaced with pure methanol for 10 more minutes. Alcohol residuals were then removed, and the colonies were stained with Giemsa (Merck KGaA, Darmstadt, Germany) for 2 min and observed with an inverted optical microscope with phase contrast to evaluate wound closure. The plates were thoroughly washed of excessive stain and dried at room temperature. All samples were observed with an inverted optical microscope (Nikon, Tokyo, Japan) as described above.
Only colonies that included more than 20 cells were included in the analysis and were ranked in three groups: dense, diffuse and mixed colonies, according to how densely packed cells appeared [19]. Fibroblast colony forming efficiency (ECO-f) was determined according to Fridenshtein’s equation for stromal progenitors: ECO-f = number of pre-formed colonies/number of seeded cells × 100%.

2.6. Protein Content

To quantify protein content, cells were seeded in triplicate in a 24-well plate at a density of 2 × 10⁴ cells/well for each experimental condition. Samples were stimulated 24 h after seeding and evaluated 96 h and 1 week after treatment. Briefly, samples were rinsed with PBS, dried and stirred for 1 h in 5% NaOH DOC (Sigma-Aldrich, St. Louis, MO, USA) for solubilization. Samples were stirred for 10 more minutes after addition of Lowry Reagent and then transferred to a sonicator. Folin and Ciocalteu’s Phenol Reagent Working Solution (Sigma-Aldrich, St. Louis, MO, USA) was added to the samples, which were mixed on orbital shaker for 1 h. Protein content was measured by a microplate reader (Infinite F200 TECAN, Männedorf, Switzerland) at 750 nm and a standard curve was used to compute the absolute amount of proteins in samples.

2.7. Extracellular Matrix Deposition

To assess extracellular deposition, cells were seeded in a 6-well plate at a density of 20 × 104 cells/well and stimulated after 24 h. Samples were fixed 21 days after stimulation and stained with Sirius-red F3B200 (Mobay Chemical Co., Pittsburgh, PA, USA) and Alcian Blue 8GS (Bio-Optica Milano s.p.a., Milano, Italy) to evaluate collagen and proteoglycan deposition, respectively. Briefly, samples were washed with PBS and Bouin’s fixative was added. The plate was incubated for 1 h at room temperature, Bouin’s solution was removed, and samples were rinsed with water and allowed to dry. For Collagen staining, after adding 0.1% Sirius red, the plate was incubated for 1 h and then washed with 0.1 N HCl and left to dry. For proteoglycan deposition, 1% Alcian Blue was added, the plate was incubated over-night at room temperature and washed with distilled water and left to dry. All samples were observed with an optical microscope Nikon Eclipse 80i (Nikon, Tokyo, Japan), equipped with a Nikon Digital Sight DS-2Mv camera and imaged with NIS Elements F control software (Nikon, Tokyo, Japan).
To quantify Collagen expression, the supernatants collected in the Control, PN and PN + HA groups (as described above) were assayed using Human Pro-Collagen I alpha 1SimpleStep ELISA Kit (Abcam, Cambridge, UK) and Human Collagen III Alpha (COL3A1) ELISA Kit (Abbkine, Wuhan, China), following the manufacturer’s recommendations and the experiments were performed in triplicate.
For Collagen I detection, after centrifugation, diluted supernatants, standard samples and the antibody cocktail were pipetted into the plate, which was incubated for 1 h at room temperature on an orbital shaker and then washed with 1× Wash Buffer PT. After adding TMB Development Solution, samples were incubated in the dark and a stop solution was then added. The Optical Density (O.D.) was recorded at 450 nm by a microplate reader, as described above.
For Collagen III detection, standard samples and diluted and centrifuged supernatants were added to testing wells, and then incubated at 37 °C for 45 min. The HRP-conjugated detection antibody was added to each well after a washing step. The plate was incubated for 30 min at 37 °C, samples were washed again, and chromogen solution A and chromogen solution B were then added. After gently mixing, the plate was incubated for 15 min at 37 °C, and the Stop Solution was added. The O.D. was read at 450 nm by a microplate reader, as described above.

2.8. In Vitro Scratch Assay

The effect of PN on cell spreading and migration was investigated by a scratch assay. Briefly, 20 × 104 cells were seeded into each well of a 12-well plate and, upon confluence, the cell monolayer was scratched with a 200 μL plastic pipette tip across the center of the well. Cells were rinsed with PBS and culture medium in the absence (control group) or in the presence of PN or PN + HA was added. Scratch closure was monitored with an inverted optical microscope in phase contrast and microphotographs were taken with a digital camera 48 and 96 h after stimuli were added.
Moreover, samples were fixed with methanol after 96 h and then stained with Giemsa solution for 2 min. The samples were then rinsed with tap water, dried and then observed with an inverted optical microscope as described above.

2.9. Statistical Analysis

For the statistical analysis, the collected data were analyzed using Prism X (GraphPad, La Jolla, CA, USA). The results are expressed as means ± standard deviation (mean ± SD) of repeated experiments. The statistical significance of the differences observed between groups was determined using ANOVA test and a p value smaller than 0.05 was considered a statistically significant difference.

3. Results

3.1. Polynucleotides Increase Cell Number

As a first step, we decided to assess the best PN dose for our cell model and thus stimulated primary gingival fibroblasts with increasing doses of PN, up to 100 μg/mL (Figure A1). After 96 h of stimulation, we observed that PN had significantly increased cell number in all treated groups vs. the vehicle-treated, control group, with the difference becoming more significant as the dose increased. Concentrations higher than 100 μg/mL did not cause further effects in cell number (data not shown).
The concentration of 100 μg/mL was therefore chosen for the subsequent experiments.
To investigate the effects of PN with or without HA, we stimulated primary gingival fibroblasts with vehicle or 100 μg/mL of PN in the absence or in the presence of HA for 96 h or 1 week of culture (Figure 1). We observed that PN significantly increased cell number as compared to control at both time points (p < 0.0001) and that addition of HA further increased cell number as compared to both control (p < 0.0001 both at 96 h and 1 week) and PN alone (p = 0.087 at 96 h and p = 0.0014 at 1 week), as shown in Figure 1A, and captured quite visibly also by the microphotographs of the transmission microscope (Figure 1E,G,I).
The microphotographs highlight that cells in the treated wells were more numerous, but that they also started to stack along multiple planes of growth in the presence of HA (Figure 1I). Though cells mostly exhibited a parallel or fan-like alignment in the control (Figure 1E) and PN-only groups (Figure 1G), they grew in orthogonal direction in the PN + HA group, and apparently superimposed onto one another (Figure 1I).
We also assessed cell growth by evaluating their viability using two commercially available assays, CellTiter-GLO, which measures cells’ ATP content, and MTT assay, which is based on cells’ redox capability (Figure 1B,C). Though both these assays confirmed that PN increased the assay signal in a visible and significant way, PN + HA failed to further increase cell growth as compared to PN alone, at all time-points with the only exception of 1 week of culture in the CellTiter assay (Figure 1B, p < 0.0001). Figure 1F,H,J show microphotographs obtained during the MTT assay and confirm the presence of nodules in the PN + HA group (Figure 1J).
We also observed that PN significantly increased protein content in the treated wells as compared to the control group (p = 0.0068 at 96 h and p = 0.0006 at 1 week) and that addition of HA further increased the significance level, to a p = 0.0023 at 96 h and p = 0.0003 at 1 week (Figure 1D).

3.2. Polynucleotides Increase Colony Forming Efficiency in Gingival Fibroblasts

To assess whether polynucleotides affected the clonogenic efficiency of gingival fibroblasts, we plated cells at low concentrations (150 cells/well), stimulated them with vehicle, PN or PN + HA and cultured them for 14 days. At such low density, most cells tended to attach quite far apart from one another on the plate and created colonies, whose number approximately thus corresponds to the number of cells which were able to divide. The difference in visible colonies between control and treated wells is quite striking (Figure 2A–C): though very few and faint colonies are visible in the vehicle-treated group, they are more numerous and more clearly visible in the presence of PN and even more so in the presence of PN + HA. Following Zorin et al. [19], colonies were divided into three types: diffused, when cells were sparse, dense, when formed by closely packed cells and mixed, with intermediate characteristics (Figure 2D–F).
The clonogenic efficiency of the system was calculated by computing the ratio of the number of colonies and the number of seeded cells. The efficiency was quite low in the control group, at about 5% (Figure 2G), and it was significantly lower than in the PN (p = 0.01) and PN + HA groups (p = 0.036), where it reached an average of 15%. A careful analysis of colony types, however, highlighted further differences. The highest number of dense colonies was found in the PN + HA group and it was significantly higher than in the vehicle group (p = 0.0098), where almost next to zero such colonies were observed (Figure 2G). The control group contained also a lower number of mixed colonies than the PN + HA group (p = 0.02), whereas most of the colonies in the control group fell within the diffused category, though they were still significantly fewer than in the PN group as an absolute number (p = 0.033).

3.3. Polynucleotides-Hyaluronic Hydrogel Promotes the Deposition of Extracellular Matrix

We then set off to investigate whether a hyaluronic acid-based polynucleotides hydrogel could promote matrix deposition. We therefore cultured gingival fibroblasts for 3 weeks in the presence of in the absence of PN or PN + HA.
After 21 days of culture, vehicle-treated fibroblasts had formed a continuous cell mono-layer, which stained quite homogeneously with Sirius-red, a histological dye that is known to possess affinity for collagen (Figure 3A). Cells treated with PN were still observed forming a mono-layer, though with a stronger red staining and a few nodules, i.e., areas of higher cell concentration (Figure 3B), started to appear. These areas were even more common in the presence of PN + HA and nodules displayed a visible staining reinforcement (Figure 3C). Cells in nodules were also aligned along concentric orbits, often on growing on multiple layers, with orthogonal alignment. These details were even clearer when Sirius-red stained plates were observed under a fluorescence microscope (Figure 3D–F), which highlighted the presence of multiple focal planes in PN+HA stimulated samples (Figure 3F).
We quantified collagen 1a1 and 3a1 deposition by ELISA (Figure 3G,H) after 96 h or 1 week of culture. The expression of Collagen 1 remained quite stable in the control group (Figure 3G), but it tended to increase in the PN group and increased significantly in the PN + HA samples (Figure 3G). A somewhat similar behavior was observed with Collagen 3a1, whose expression increased significantly only in the PN + HA group, whereas a decrease in expression was observed both in the control and PN groups (Figure 3H).

3.4. Polynucleotides-Hyaluronic Hydrogel Does Not Affect Proteoglycan Deposition

We also performed Alcian Blue staining on gingival fibroblast cultures stimulated with vehicle, PN or PN + HA, to reveal the deposition of proteoglycans after 21 days of culture (Figure 4). A diffuse slight blue staining, with occasional reinforcement around specific cells, was visible in all samples. No difference, however, was observed across the groups (Figure 4A–C).

3.5. Polynucleotides–Hyaluronic Hydrogel Promotes In Vitro Wound Healing

To investigate whether polynucleotides and hyaluronic acid biopolymer promoted wound healing, we adopted an in vitro scratch assay (Figure 5). Cells in the vehicle group significantly grew after the scratch, but were not able to bridge the gap, which was still very visible after 96 h of culture. Though several cells grew along the scratch, the margins were still mostly intact (Figure 5A). Cells stimulated with PN, however, appeared to close the gap more effectively (Figure 5B), though the overall difference was not significant. After addition of PN + HA hydrogel, the healing area was significantly higher than in the remaining groups already after 48 h and achieved complete closure along most of the scratch area by 96 h (Figure 5C,D)

4. Discussion

Regeneration is a potent capability of living organisms to recreate parts of tissue that have been lost and thus restore their own integrity [20]. However, several circumstances, such as defect extension or the presence of disease, may impair this process and call for adjunctive treatments [21]. Under such conditions, tools may be needed to improve cell growth and healing potential. Biomaterials, one of the mainstays of most regenerative strategies, have proved to be able to provide excellent support to healing tissues, although they often lack the capability to impart specific cues to obtained desired responses from cells [22]. Recently, biomimetic approaches have become object of in-depth investigation, as they rely on principles of activity that are physiologically found in organisms [5]. The present study reports on the responses of primary gingival fibroblasts to a hyaluronic acid biopolymer enriched with polynucleotides (PN + HA). PN is a compound containing a mixture of DNA fragments that has accrued a conspicuous body of evidence regarding its capability to enhance cell vitality in several in vitro and in vivo studies and can count on a long clinical experience of use as healing support therapy, especially for wounds or ulcers [14,15].
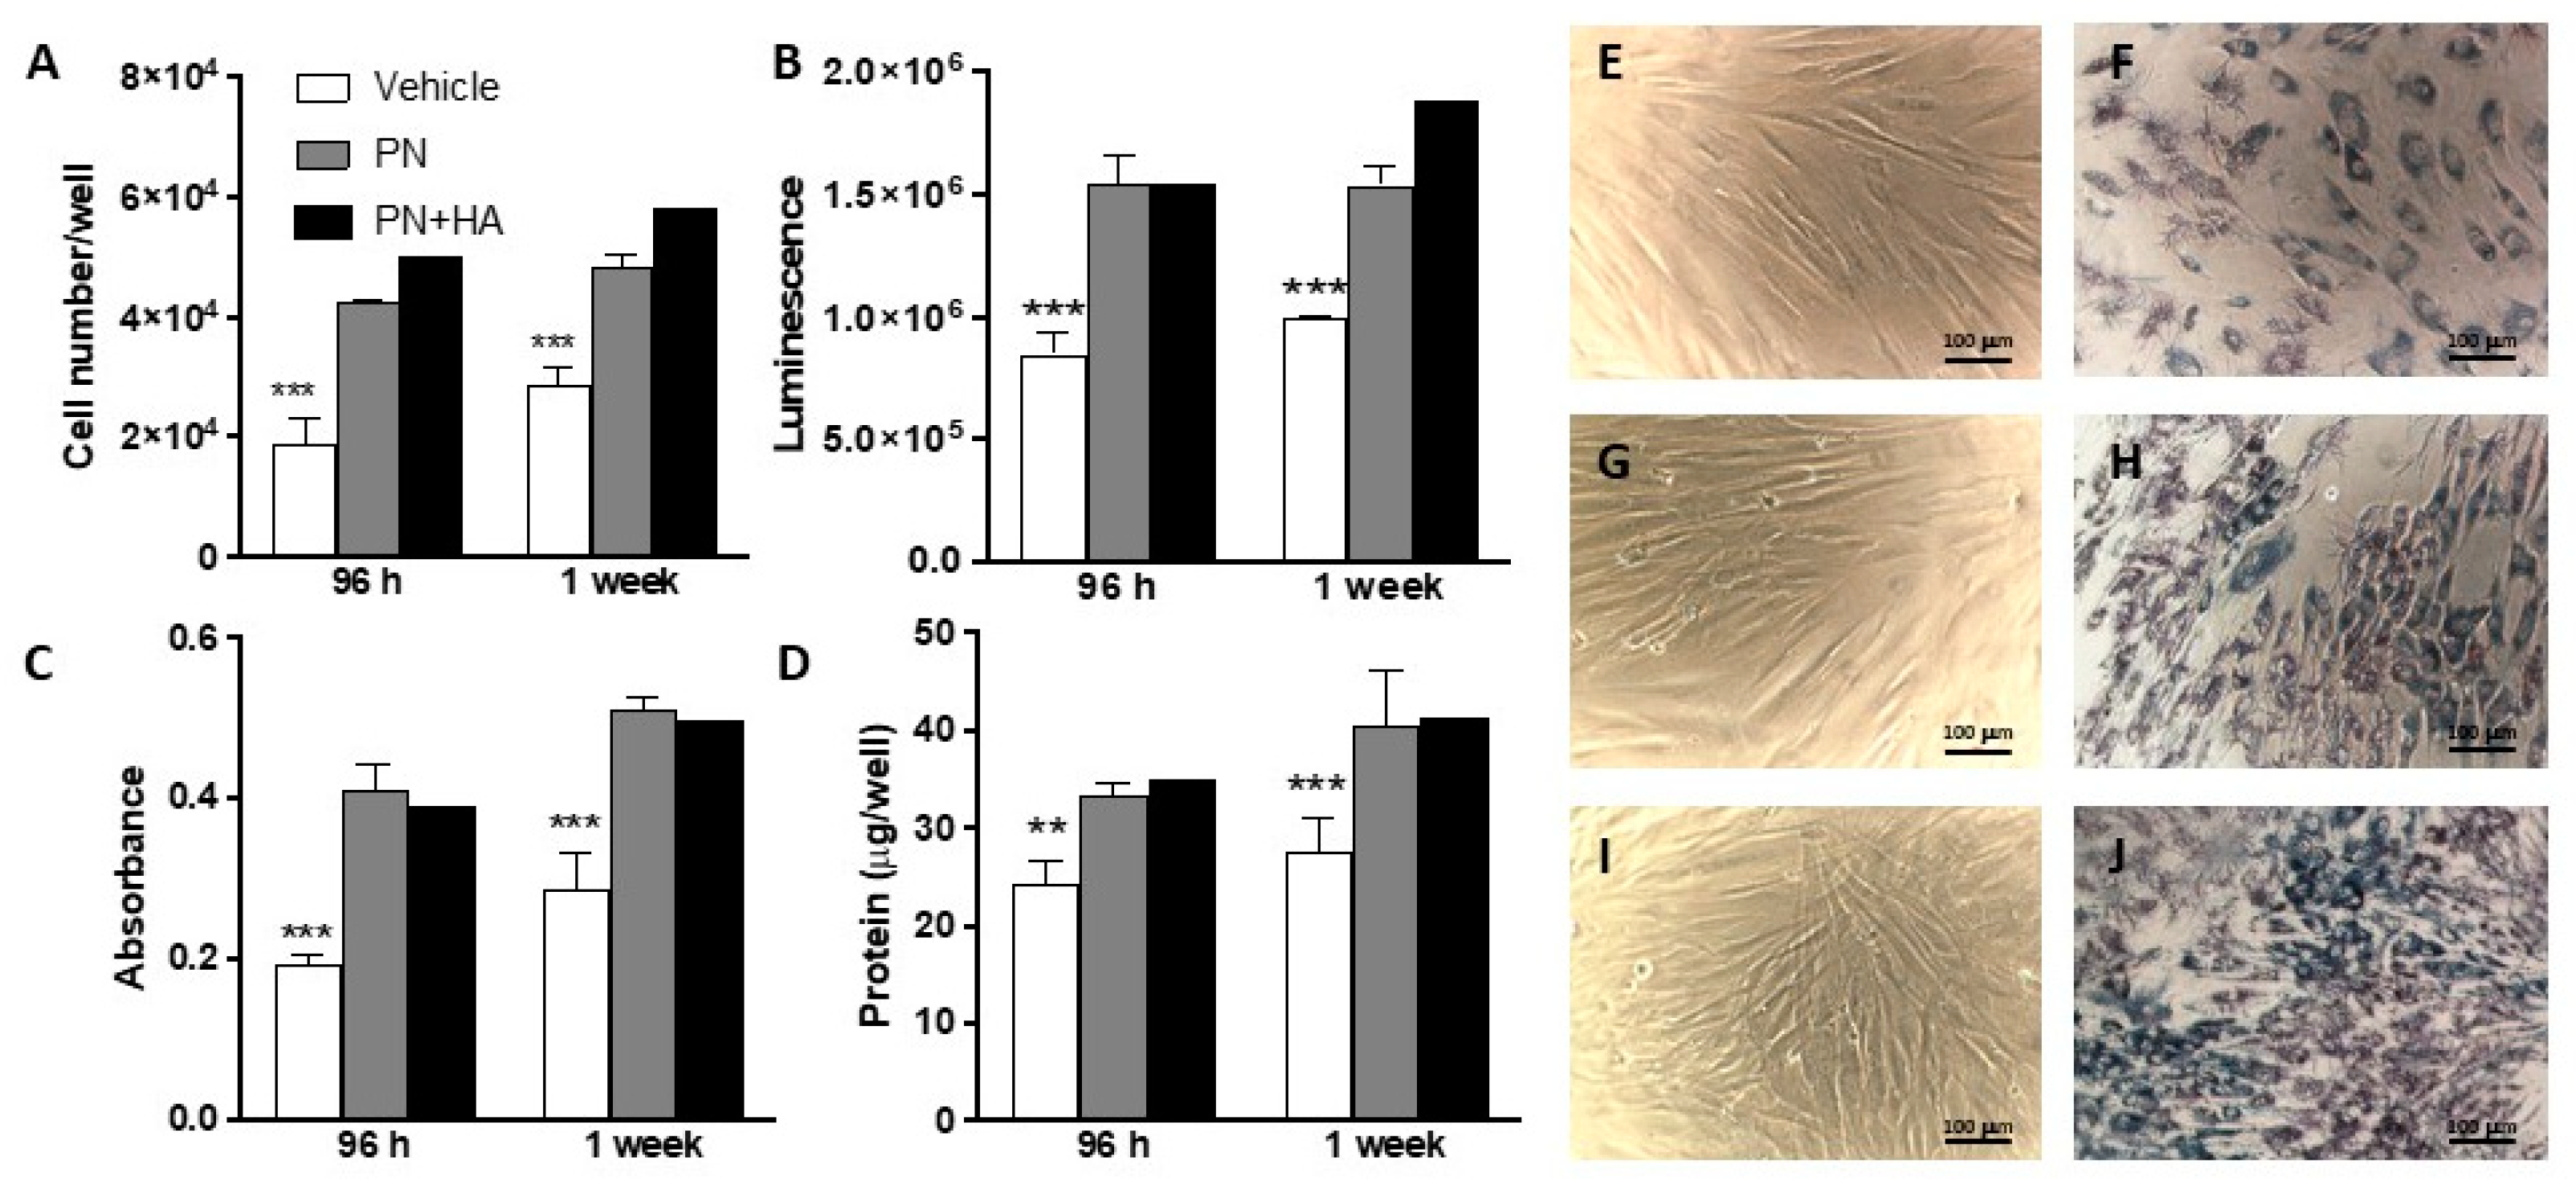
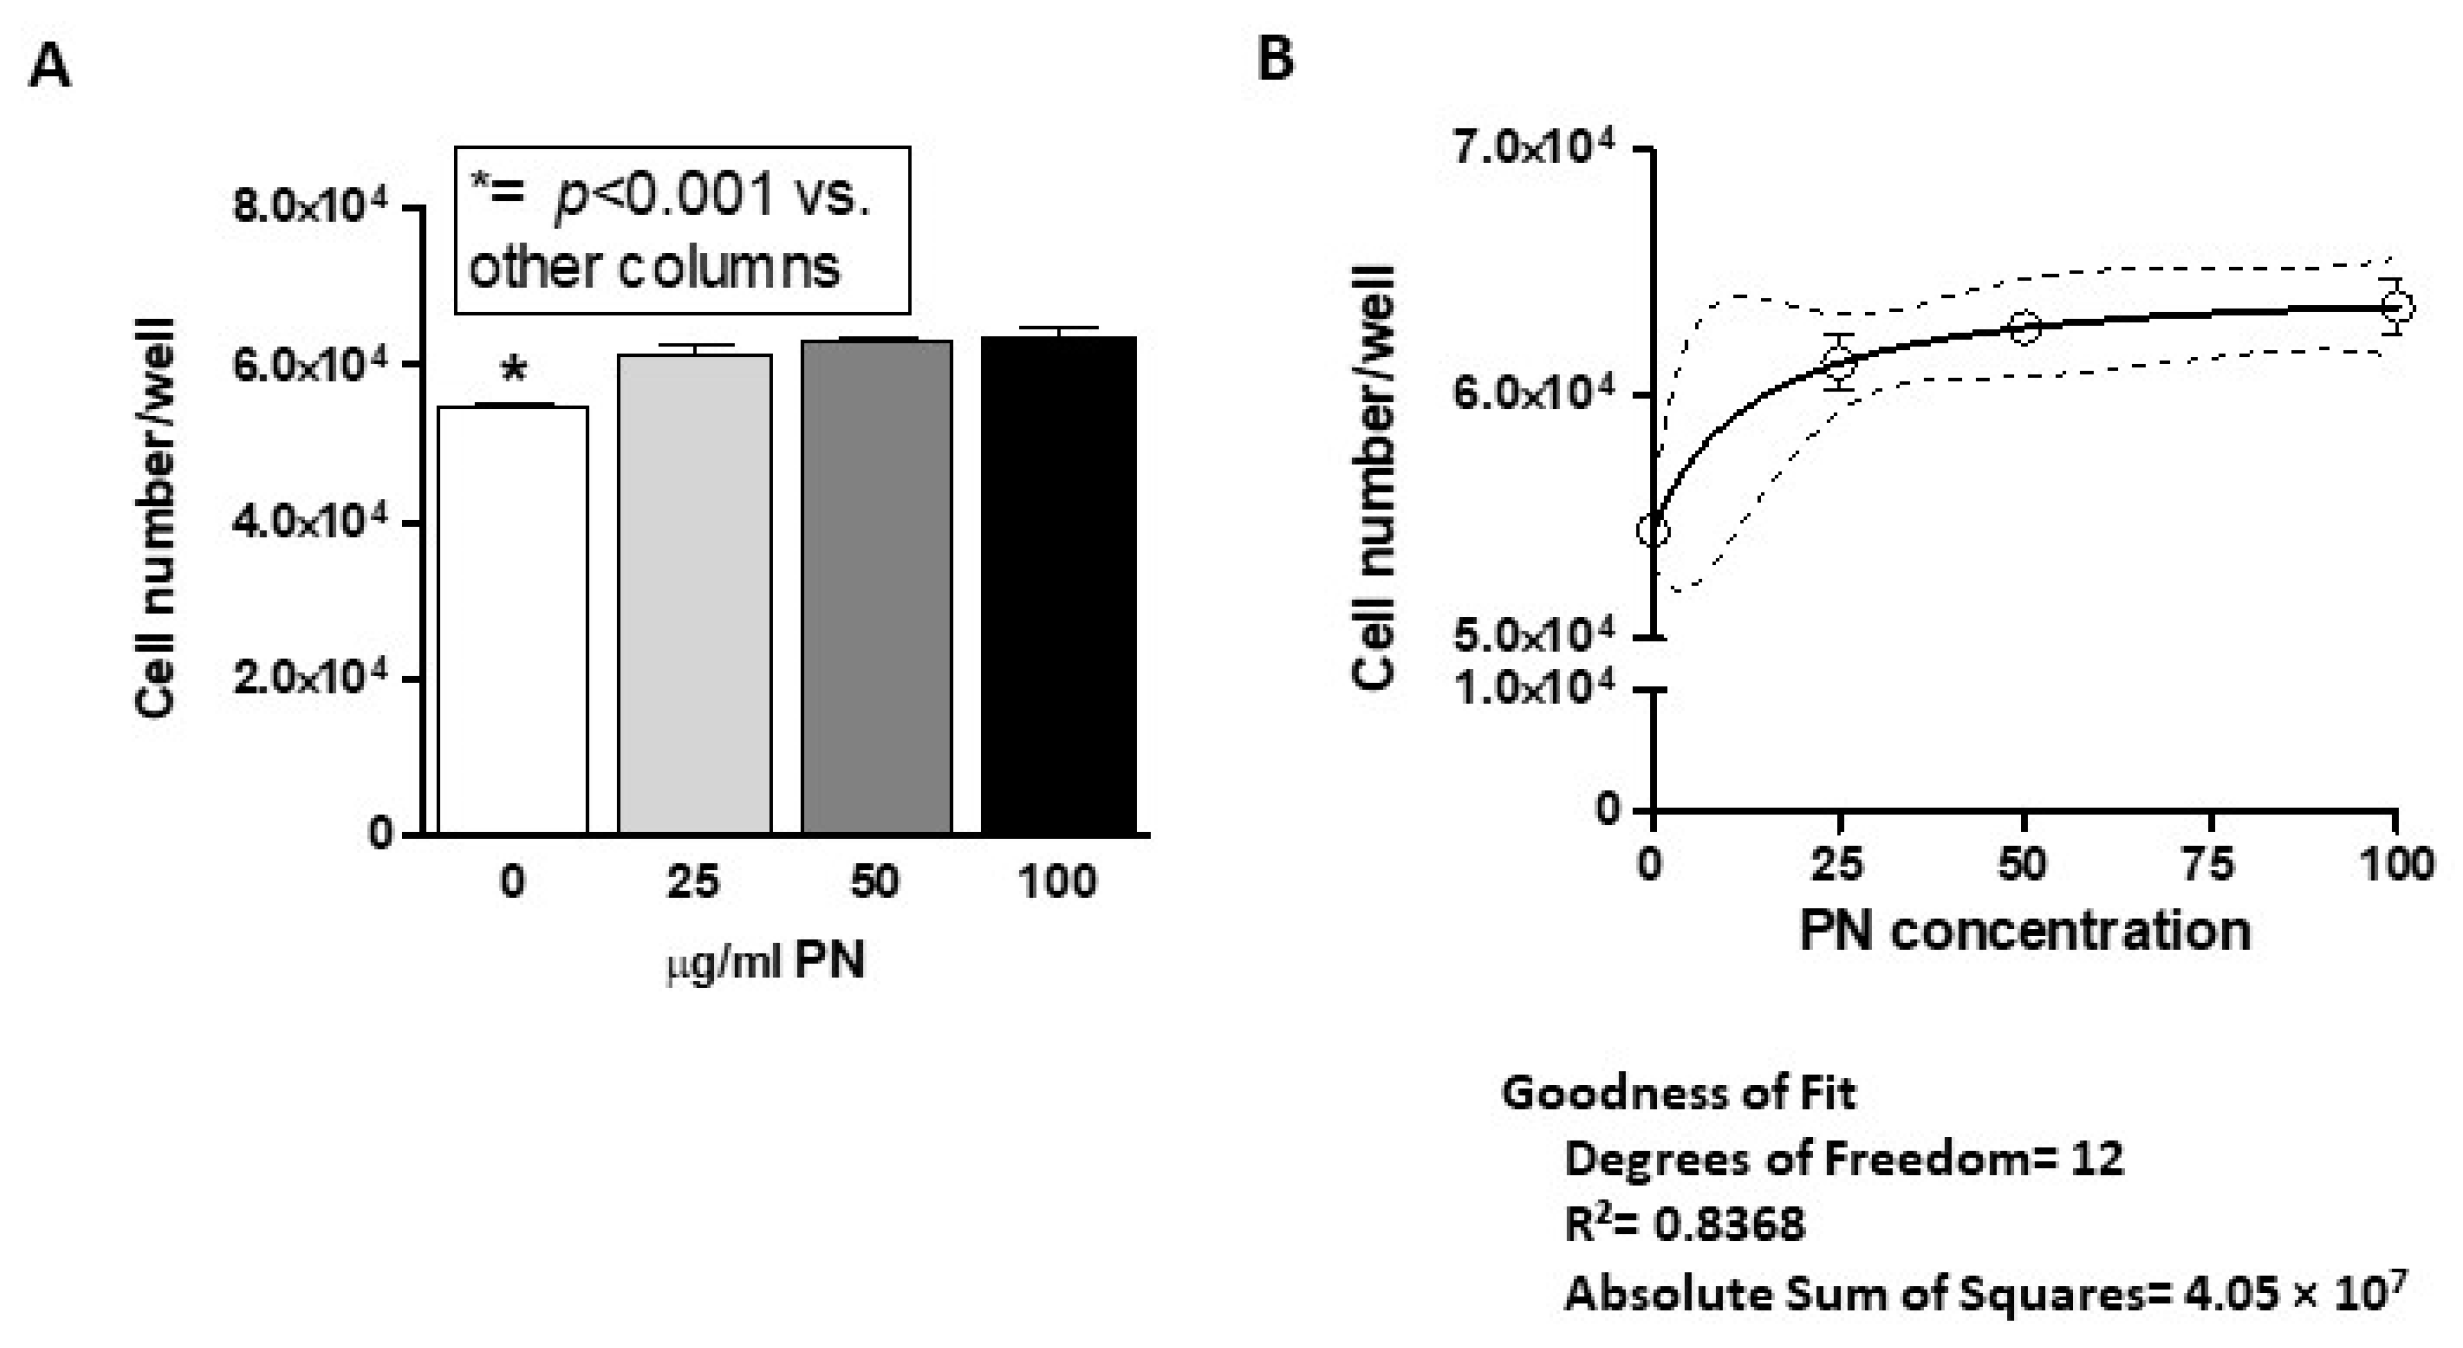
Our data confirmed that PN are effective in promoting cell growth in gingival fibroblasts (Figure 1), with consistent results across several assays. Addition of HA appeared to exert a marginal effect on growth, which was observed at direct count and, partially, at luminescence, although MTT noticeably failed to pick this up (Figure 1). Most of the available literature reports that 100 μg/mL is the optimal dose of polynucleotides for in vitro and in vivo applications and our data confirm that gingival fibroblasts too achieve their peak response at that concentration.
Microscopic observations confirmed the impression of a higher cellular density in the presence of PN + HA hydrogel than in the control group or with PN alone, consistently with direct count data. Microphotographs may also offer a clue as to why metabolic viability assays like MTT failed to observe a further increase in cell number in the PN + HA group.
MTT is a very common and well established cellular assay that is based on the conversion of MTT reagent to a blue compound formazan, which can then be quantified, and thus relies on the cellular metabolic activity [23]. Microphotographs show that cells in the PN + HA group tended to form nodules and to stack up to form multilayers. Although our cell model was a commercially available primary cell model that tended to grow in monolayers, it can be hypothesized that the presence of HA may have facilitated the formation of nodules, thanks to a more abundant biopolymer matrix, and thus of cell-rich areas that did not provide a linear MTT response.
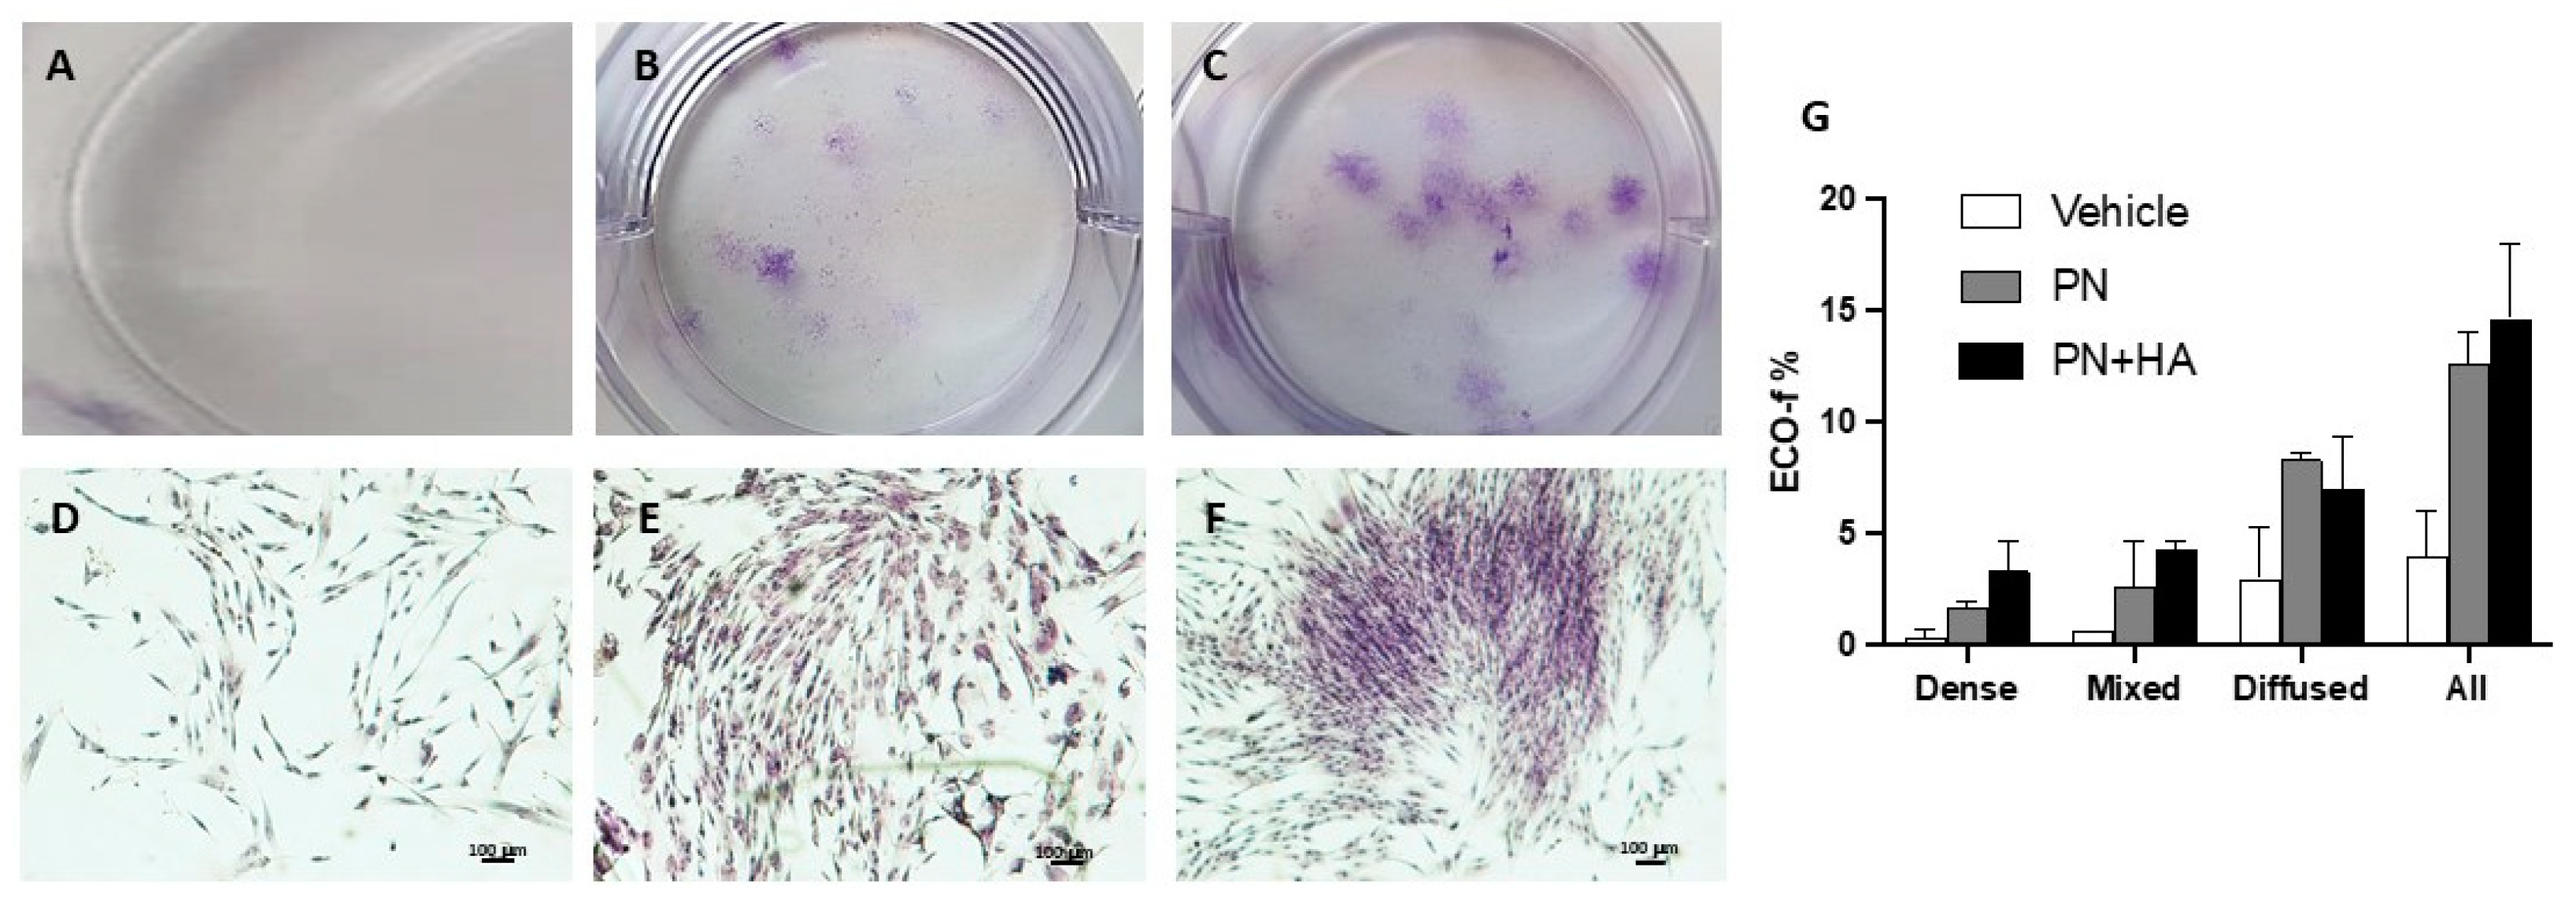
Indeed, our clonogenic assay showed that PN and PN + HA significantly improved colony number as compared to vehicle, which can be easily explained by their effects on cell growth (Figure 2), and which possibly became even more visible in a challenging situation for cells in CFU-assay. In a clonogenic assays, cells are seeded at very low density [19], where paracrine stimulation from neighboring cells is very poor and PN may have thus provided just enough stimulation to allow the formation of 3–4 times the number of colonies as in the control group. Moreover, though the overall number of colonies in the PN + HA group was not higher than in the PN alone group, the colony patter was distinctively different. Most colonies in the PN alone group were diffused, i.e., were formed by sparse cells, scattered quite far apart. On the contrary, PN + HA appeared to induce the formation of a higher number of dense or mixed colonies that control or PN alone, confirming that PN + HA, while possessing a pro-growth effect on cells, is also endowed with the capability to affect cell arrangement and alignment (Figure 2F,G).
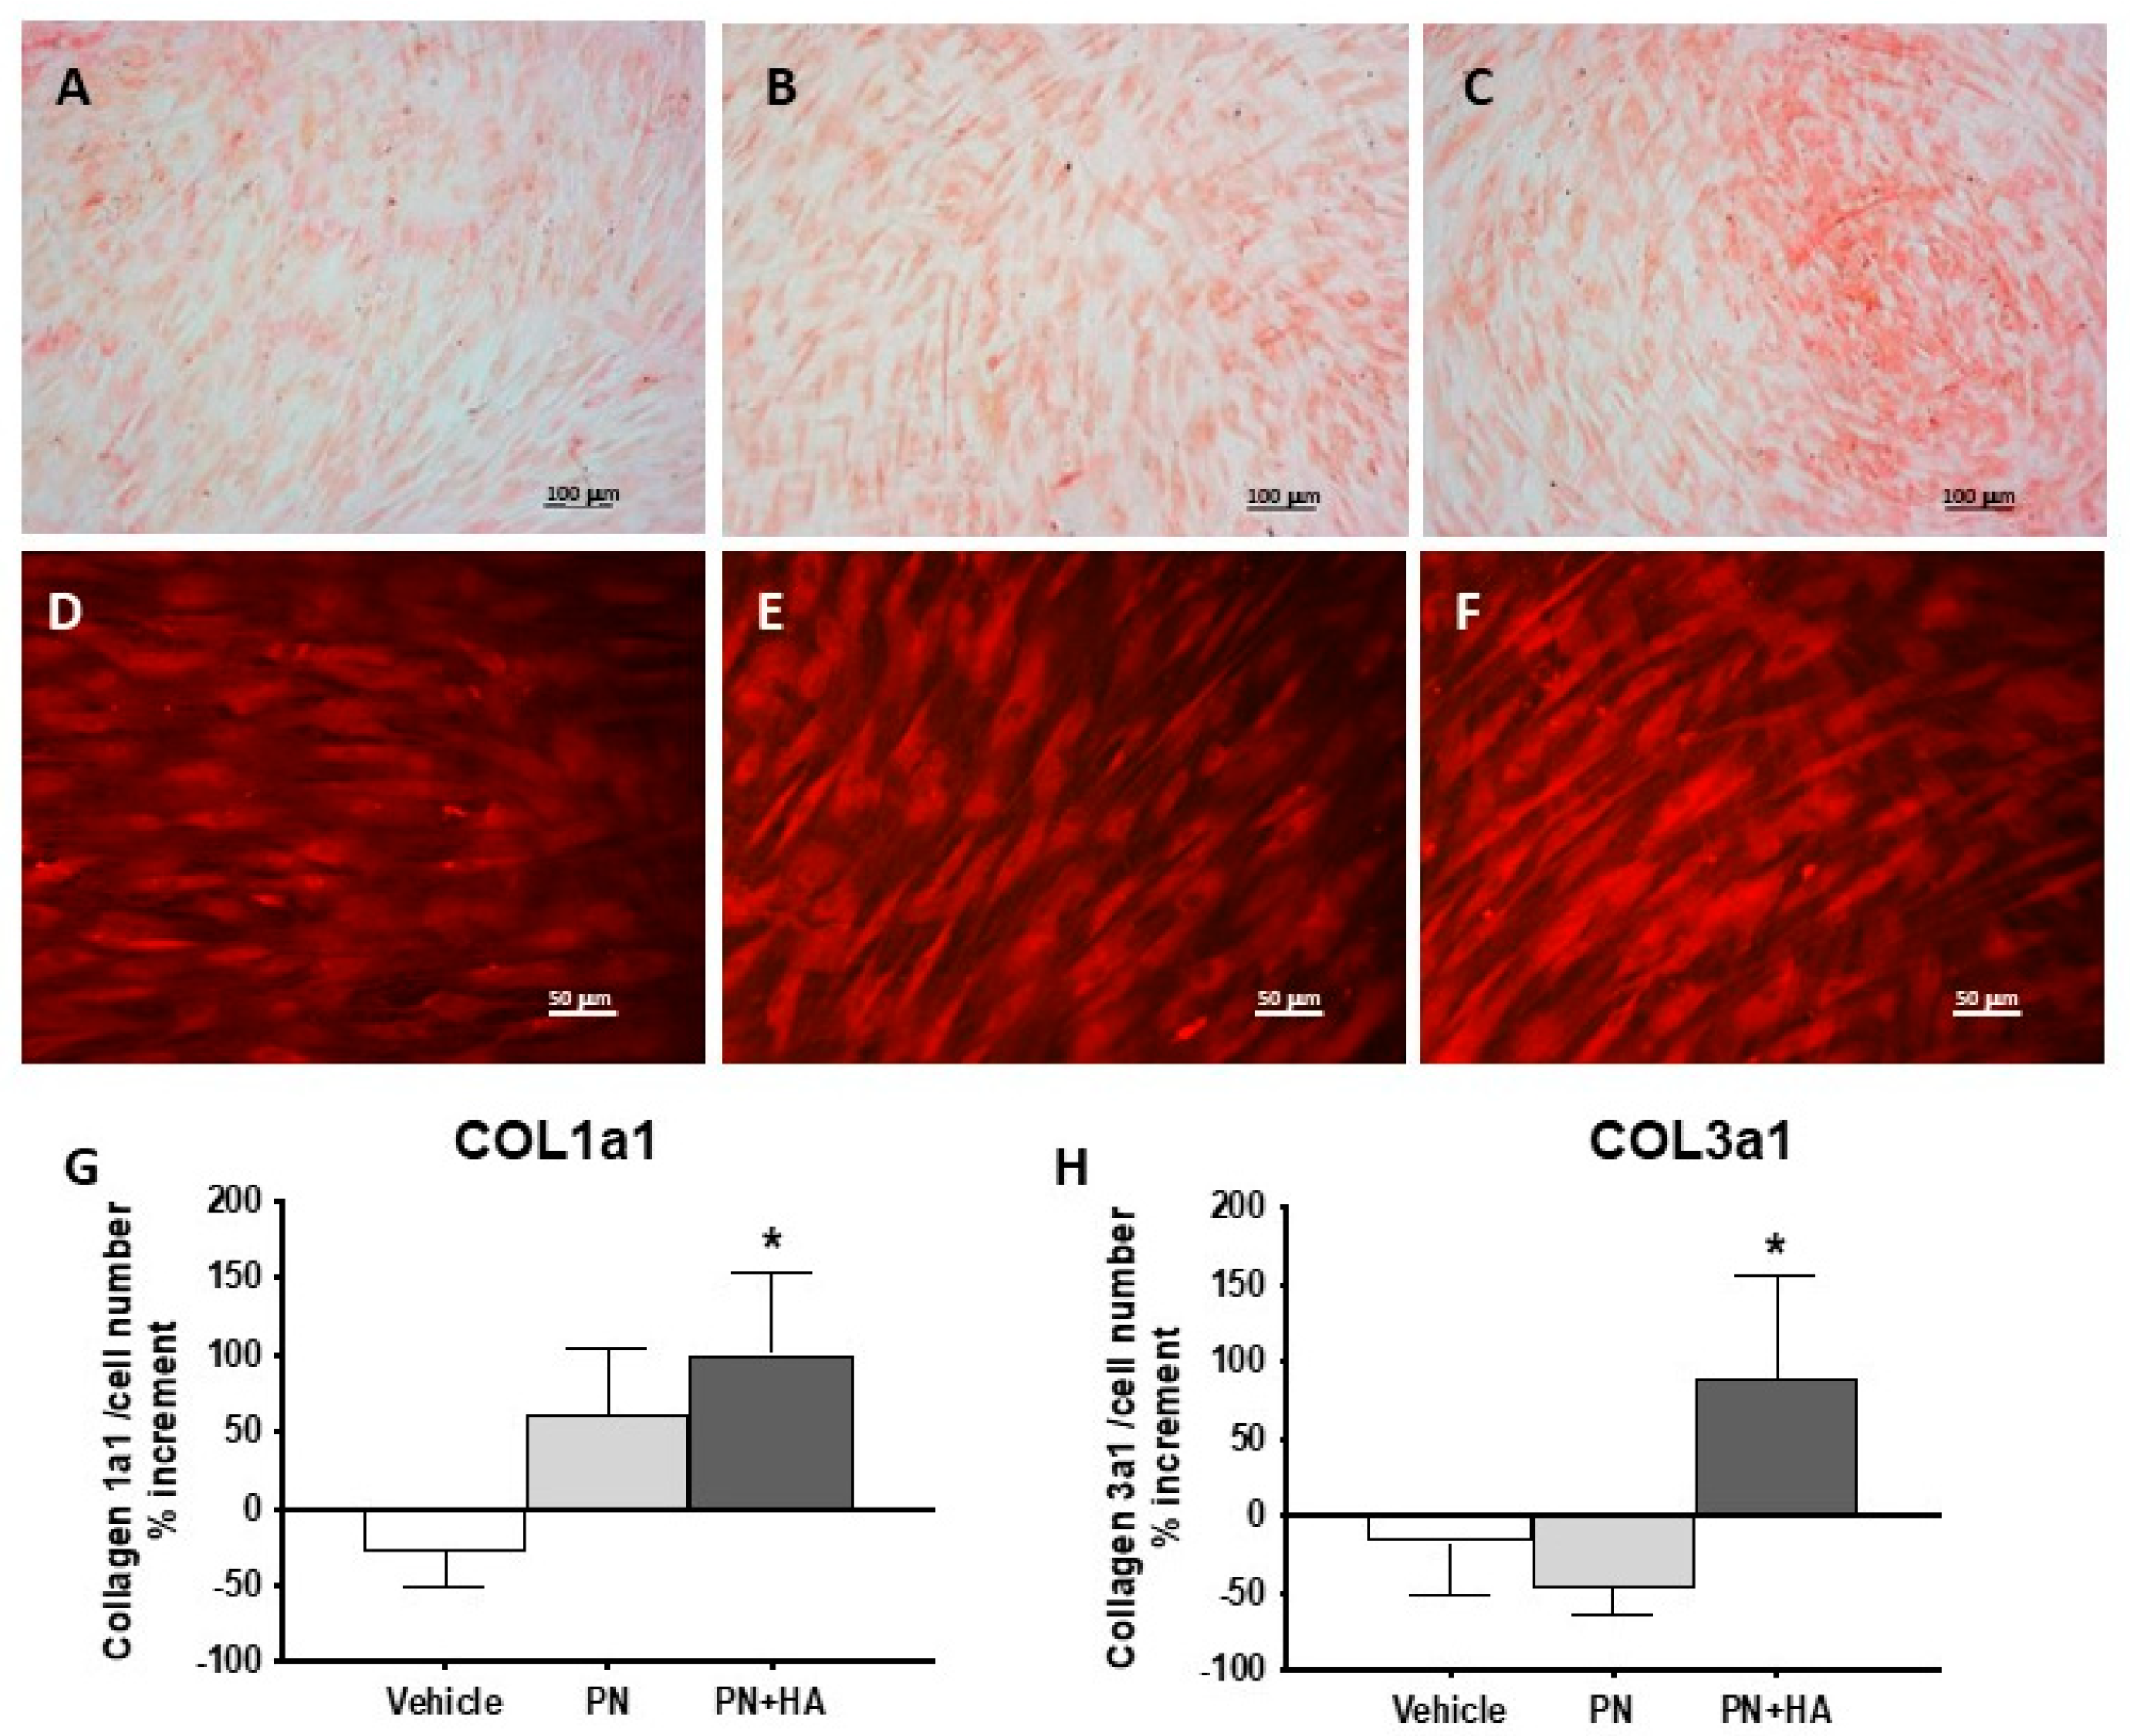
A further confirmation was obtained by Sirius red staining [24], which visualized collagen deposits (Figure 3A–C) and revealed that PN and PN + HA were able to progressively increase collagen deposition. PN + HA furthermore facilitated the formation of more numerous collagen-positive nodules with high cells density and multilayer cell stacking, which becomes visible at fluorescence microscopy (Figure 3F). It appears that, as expected, these high-density nodules were also centers of higher matrix formation. Though this may be in part due to the mere presence of more cells, we collected evidence that points at an increased production of collagen (Figure 3G,H). Even when adjusting by cell number, we observed an increased in collagen 1a1 expression by cells stimulated with PN and PN + HA, which in this latter case was also significantly higher than the control group, where no change in expression was measured. Moreover, if the expression of Collagen 3a1 did not appear to change in the control group or event tended to decrease in the PN group, there was a significant increased, adjusted by cell number, after stimulation with PN + HA (Figure 3H). This finding is of particular interest because Collagen 3a1 is an early product of wound healing and is known to play a role in orchestrating matrix assembly during regeneration [25]. It has actually been shown that an increased Collagen 1a1/3a1 ratio is conductive to healing impairment and keloid formation [26]. A sustained Collagen 3a1 production is therefore possibly predictive of reduced risk of abnormal wound healing.
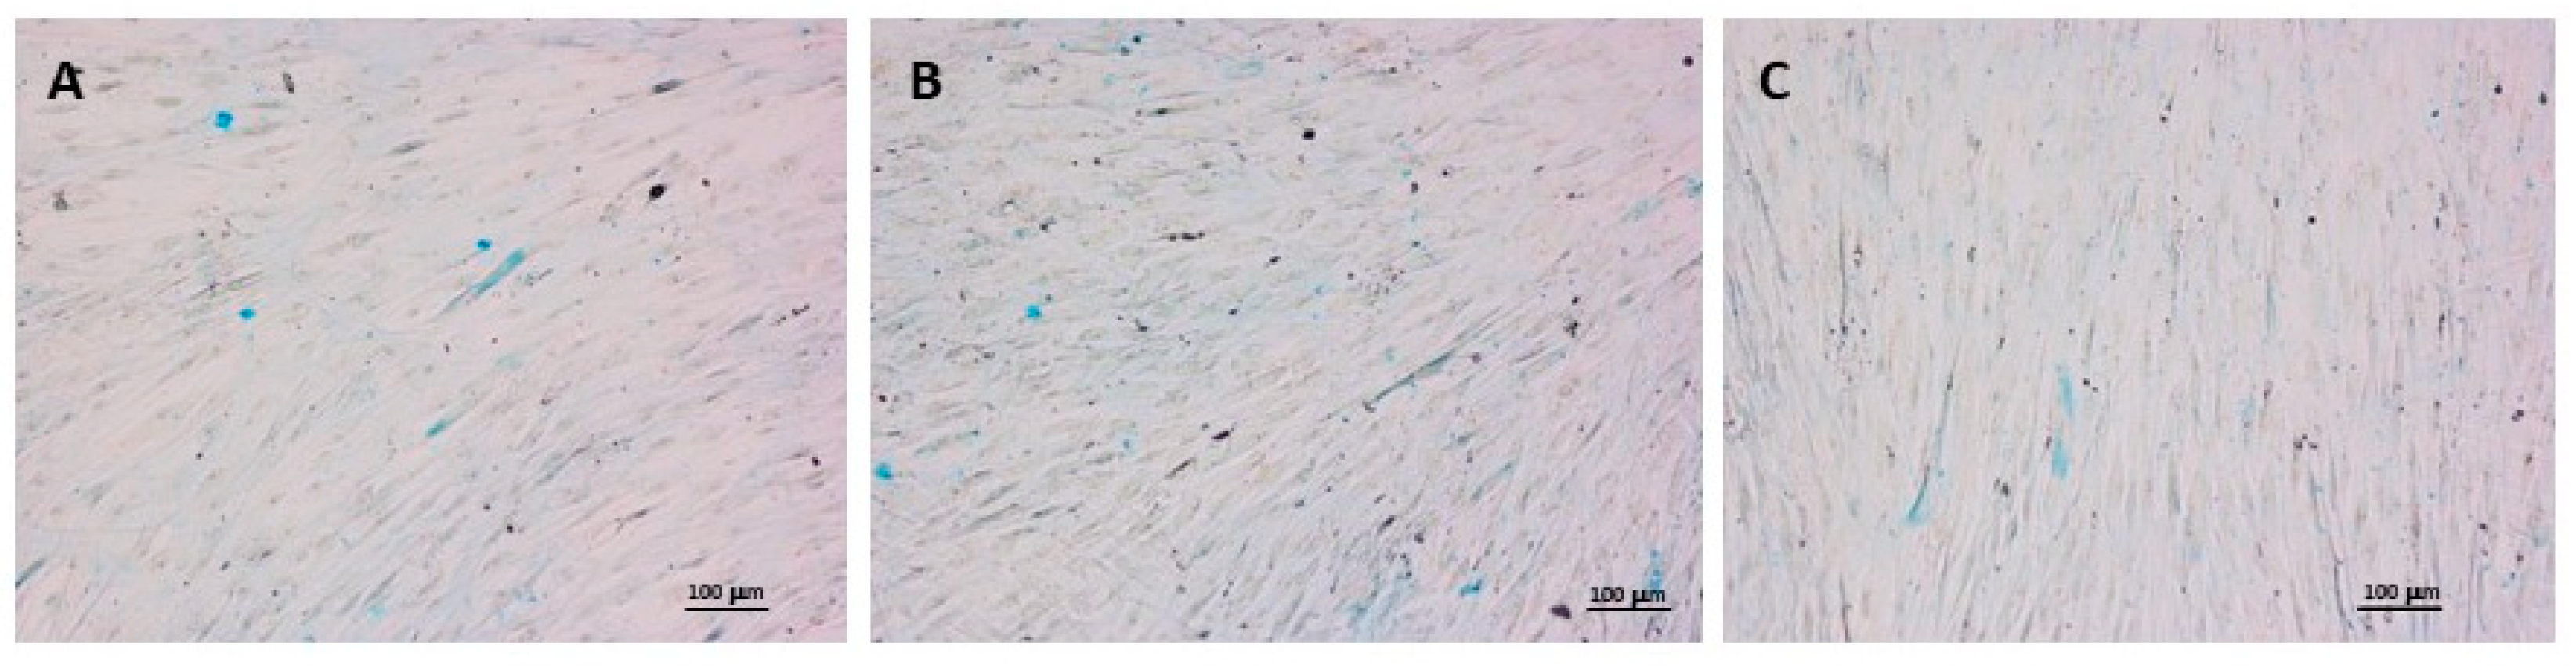
Furthermore, despite the presence of HA in the formulation, Alcian Blue staining did not show any suppression of proteoglycan production, as similar levels can be detected in control, PN and PN + HA groups (Figure 4). It cannot be excluded that some of the visible staining was actually obtained from exogenous HA from the hydrogel, but the net effect appears to be the presence of comparable levels of proteoglycans in the matrix.
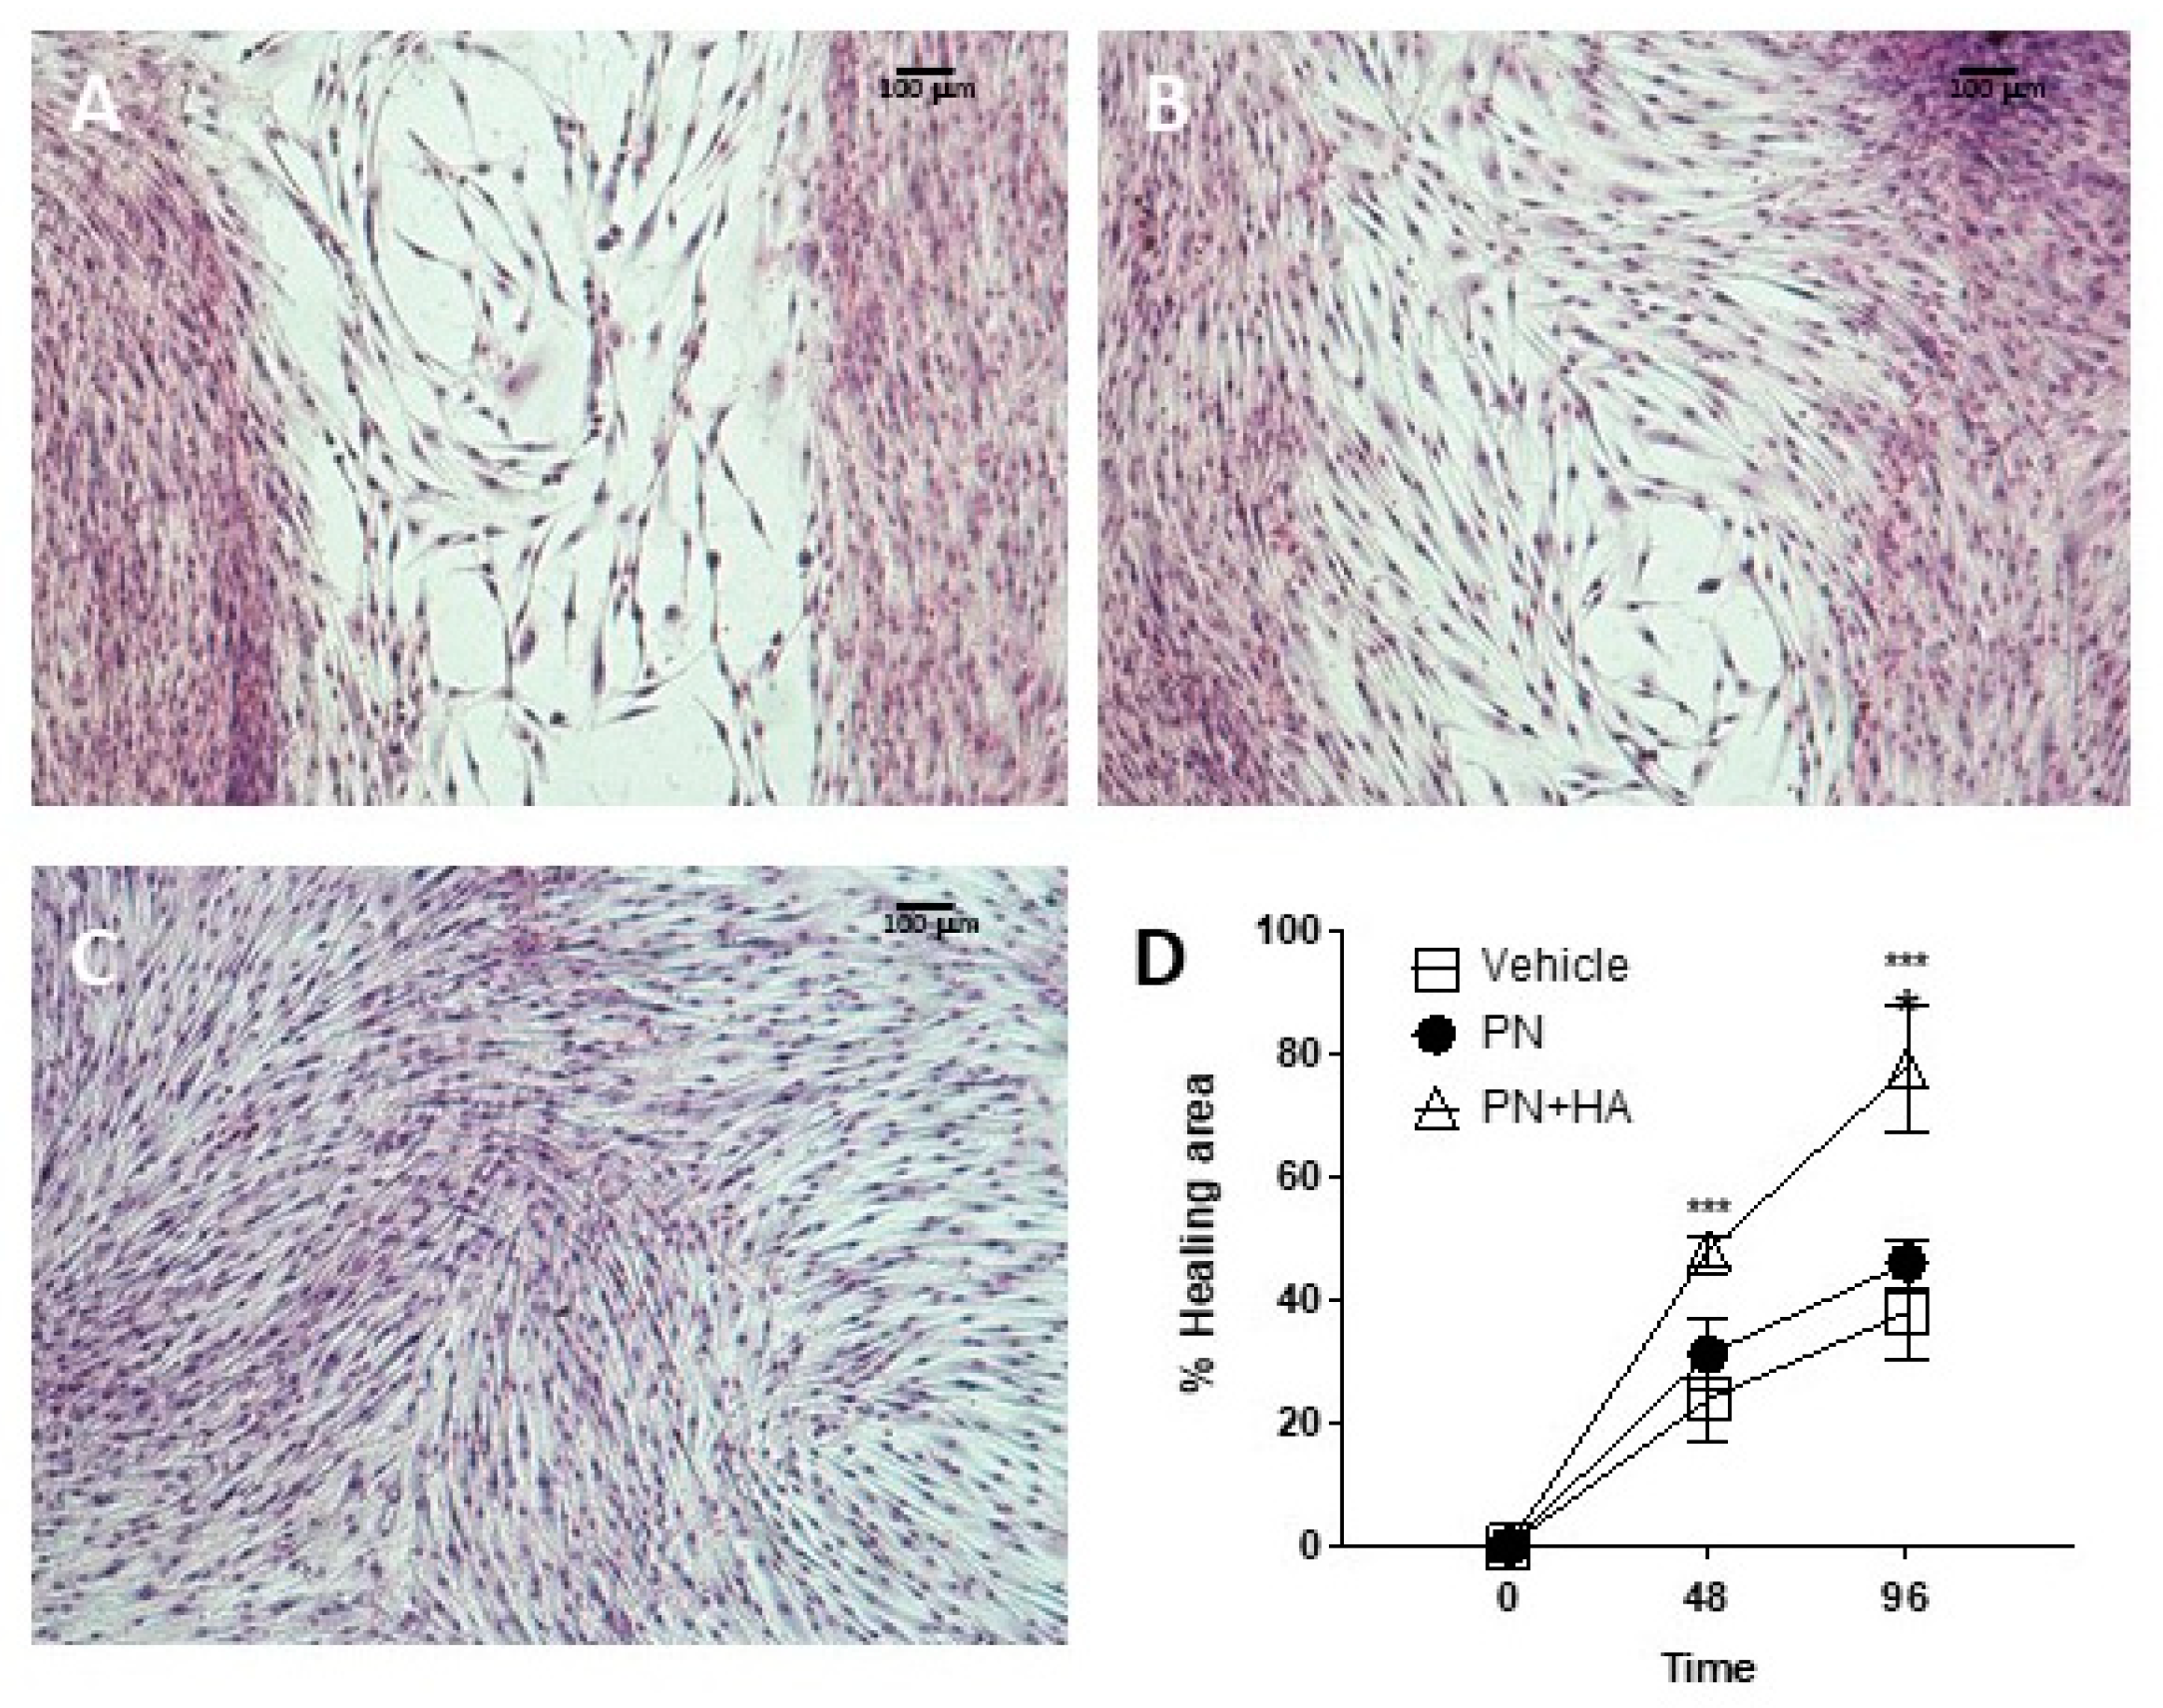
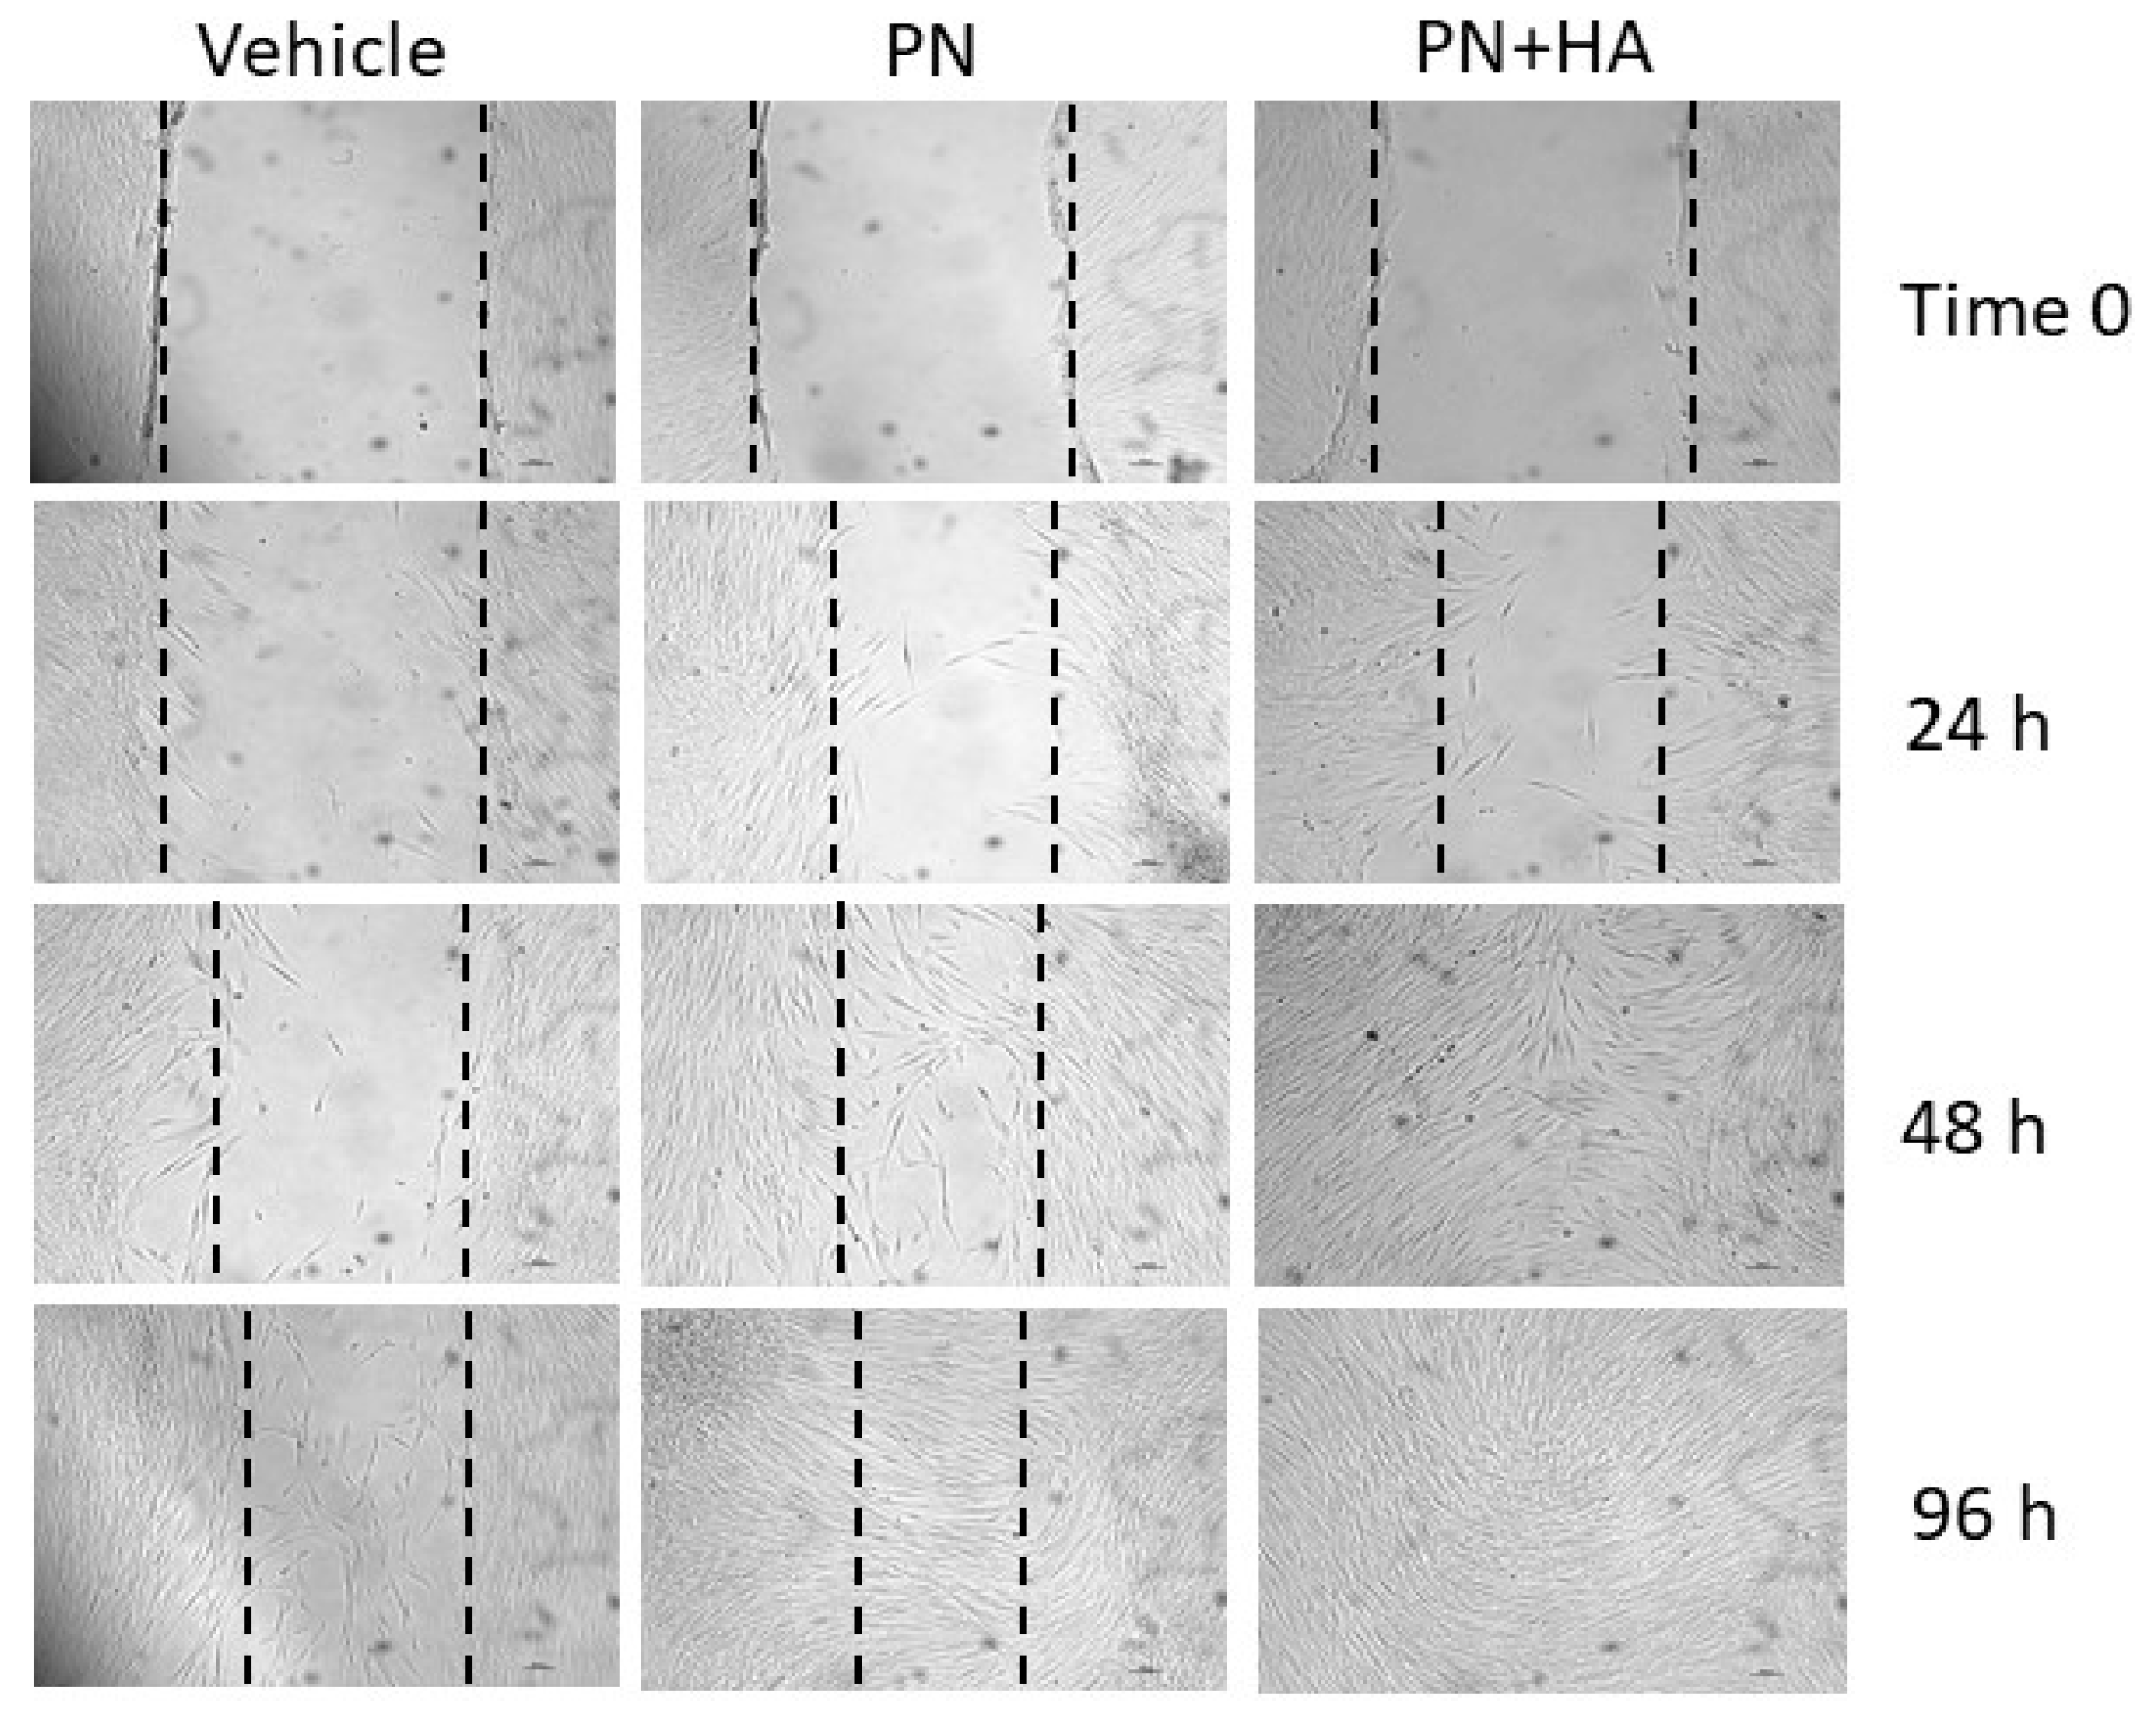
The effects of PN + HA biopolymer on wound healing can be gauged from the scratch assay (Figure 5), which is a well-established, simple test to assess the capability of an in vitro model to bridge an artificially induced gap in the cell layer [27]. An optimal wound closure requires a combination of a coordinated array of signals and cell activities, including cell growth and migration. Cells at the borders may well duplicate but will also need to migrate into the defect to adequately and quickly fill it. In an in vivo setting, a wound will cause the release of several mediated from the injured area, including molecules from damaged and ruptured cells [28]. Such compounds include ATPs and DNA from dying cells and these have been shown to act as important cues and stimulate wound repair. PN may be in part replicating this signaling, while also providing building blocks for duplicating cells, through a well-characterized salvage pathway. This alone appeared to improve scratch healing to a certain, albeit limited, extent, but the combination of PN and HA turned out to be critical to ensure a faster gap closure already after 48 h (Figure A2).
This suggests that cell migration may also be facilitated by PN + HA, possibly by the presence of HA, itself a normal component of granulation tissue in wounds, which provides a provisional matrix over the gap that fibroblast can more easily cross. Further studies will have to better characterize the growth vs. migration effects of this compound, to tune them according to actual clinical needs.

5. Conclusions

Polynucleotides appear effective at stimulating the growth of primary gingival fibroblasts and, in combination with Hyaluronic acid, can potently promote wound healing, as assessed in vitro, by stimulating cell growth/migration and promoting the synthesis of endogenous collagen extracellular matrix. A natural biopolymer based on polynucleotides may therefore represent a viable option as supportive therapy to facilitate the healing of periodontal tissues and promote their trophism, e.g., used inside periodontal pockets or administered by intra gingival injection with a thin needle (30–32 Gauge), or even applied on the gingival surface, as future studies will have to specifically determine.

Author Contributions

Conceptualization, C.G. and S.G.; methodology, S.B.; formal analysis, C.G.; investigation, M.T.C., S.B. and P.G.; resources, S.G.; data curation, C.G.; writing—original draft preparation, C.G. and M.T.C.; writing—review and editing, S.B. and S.G.; supervision, S.G.; funding acquisition, S.G. All authors have read and agreed to the published version of the manuscript.

Funding

This research received no external funding.

Institutional Review Board Statement

Not applicable.

Informed Consent Statement

Not applicable.

Data Availability Statement

The data presented in this study are available on request from the corresponding author.

Conflicts of Interest

The authors declare no conflict of interest.

Appendix A

Figure A1. (A) Dose–response assay of primary gingival fibroblast with increasing doses of PN after 48 h of culture. Cell number per culture well is reported on the y axis. (B) The curve fitted on the cell growth data shows that a plateau of effect is reached with 100 μg/mL.
Applsci 11 04405 g0a1

Appendix B

Figure A2. Microphotographs of gingival fibroblasts, after scratch, cultured with vehicle, PN or PN + HA immediately after scratch (Time 0) and after 24, 48 or 96 h, at phase interference microscopy. Magnification 4×. The vertical dashed lines represent the edges of the scratch.
Applsci 11 04405 g0a2

References

  1. Ding, X.; Kakanj, P.; Leptin, M.; Eming, S.A. Regulation of the Wound Healing Response during Aging. J. Invest. Dermatol. 2021, 141, 1063–1070. [Google Scholar] [CrossRef] [PubMed]
  2. Schwartzman, G.; Khachemoune, A. Surgical Site Infection after Dermatologic Procedures: Critical Reassessment of Risk Factors and Reappraisal of Rates and Causes. Am. J. Clin. Dermatol. 2021. [Google Scholar] [CrossRef] [PubMed]
  3. Hämmerle, C.H.F.; Giannobile, W.V. Biology of soft tissue wound healing and regeneration—Consensus Report of Group 1 of the 10th European Workshop on Periodontology. J. Clin. Periodontol. 2014, 41, S1–S5. [Google Scholar] [CrossRef] [Green Version]
  4. Reddy, M.S.B.; Ponnamma, D.; Choudhary, R.; Sadasivuni, K.K. A Comparative Review of Natural and Synthetic Biopolymer Composite Scaffolds. Polymers 2021, 13, 1105. [Google Scholar] [CrossRef]
  5. Upadhyay, A.; Pillai, S.; Khayambashi, P.; Sabri, H.; Lee, K.T.; Tarar, M.; Zhou, S.; Harb, I.; Tran, S.D. Biomimetic Aspects of Oral and Dentofacial Regeneration. Biomimetics 2020, 5, 51. [Google Scholar] [CrossRef]
  6. Kim, T.G.; Shin, H.; Lim, D.W. Biomimetic Scaffolds for Tissue Engineering. Adv. Funct. Mater. 2012, 22, 2446–2468. [Google Scholar] [CrossRef]
  7. Price, R.D.; Berry, M.G.; Navsaria, H.A. Hyaluronic acid: The scientific and clinical evidence. J. Plast. Reconstr. Aesthetic Surg. 2007, 60, 1110–1119. [Google Scholar] [CrossRef]
  8. Collins, M.N.; Birkinshaw, C. Hyaluronic acid based scaffolds for tissue engineering—A review. Carbohydr. Polym. 2013, 92, 1262–1279. [Google Scholar] [CrossRef]
  9. Guizzardi, S.; Uggeri, J.; Belletti, S.; Cattarini, G. Hyaluronate Increases Polynucleotides Effect on Human Cultured Fibroblasts. J. Cosmet. Dermatol. Sci. Appl. 2013, 3, 124–128. [Google Scholar] [CrossRef] [Green Version]
  10. Sodhi, H.; Panitch, A. Glycosaminoglycans in Tissue Engineering: A Review. Biomolecules 2020, 11, 29. [Google Scholar] [CrossRef]
  11. Mamajiwala, A.S.; Sethi, K.S.; Raut, C.P.; Karde, P.A.; Mamajiwala, B.S. Clinical and radiographic evaluation of 0.8% hyaluronic acid as an adjunct to open flap debridement in the treatment of periodontal intrabony defects: Randomized controlled clinical trial. Clin. Oral Investig. 2021. [Google Scholar] [CrossRef] [PubMed]
  12. Vanelli, R.; Costa, P.; Rossi, S.M.P.; Benazzo, F. Efficacy of intra-articular polynucleotides in the treatment of knee osteoarthritis: A randomized, double-blind clinical trial. Knee Surgery, Sport. Traumatol. Arthrosc. 2010, 18, 901–907. [Google Scholar] [CrossRef] [PubMed]
  13. Colangelo, M.T.; Govoni, P.; Belletti, S.; Squadrito, F.; Guizzardi, S.; Galli, C. Polynucleotide biogel enhances tissue repair, matrix deposition and organization. J. Biol. Regul. Homeost. Agents 2021, 35, 355–362. [Google Scholar]
  14. Colangelo, M.T.; Galli, C.; Guizzardi, S. The effects of polydeoxyribonucleotide on wound healing and tissue regeneration: A systematic review of the literature. Regen. Med. 2020, 15, 1801–1821. [Google Scholar] [CrossRef] [PubMed]
  15. Colangelo, M.T.; Galli, C.; Guizzardi, S. Polydeoxyribonucleotide Regulation of Inflammation. Adv. Wound Care 2020, 10, 576–589. [Google Scholar] [CrossRef]
  16. Pandolfi, F.; Altamura, S.; Frosali, S.; Conti, P. Key Role of DAMP in Inflammation, Cancer, and Tissue Repair. Clin. Ther. 2016, 38, 1017–1028. [Google Scholar] [CrossRef] [Green Version]
  17. Pia Palmieri, I.; Raichi, M. Biorevitalization of postmenopausal labia majora, the polynucleotide/hyaluronic acid option. Obstet. Gynecol. Reports 2019, 3, 1–5. [Google Scholar] [CrossRef]
  18. Dallari, D.; Sabbioni, G.; Del Piccolo, N.; Carubbi, C.; Veronesi, F.; Torricelli, P.; Fini, M. Efficacy of Intra-articular Polynucleotides Associated With Hyaluronic Acid Versus Hyaluronic Acid Alone in the Treatment of Knee Osteoarthritis. Clin. J. Sport Med. 2020, 30, 1–7. [Google Scholar] [CrossRef] [PubMed]
  19. Zorin, V.; Zorina, A.; Smetanina, N.; Kopnin, P.; Ozerov, I.V.; Leonov, S.; Isaev, A.; Klokov, D.; Osipov, A.N. Diffuse colonies of human skin fibroblasts in relation to cellular senescence and proliferation. Aging (Albany NY) 2017, 9, 1404–1413. [Google Scholar] [CrossRef] [Green Version]
  20. Midwood, K.S.; Williams, L.V.; Schwarzbauer, J.E. Tissue repair and the dynamics of the extracellular matrix. Int. J. Biochem. Cell Biol. 2004, 36, 1031–1037. [Google Scholar] [CrossRef]
  21. Menke, N.B.; Ward, K.R.; Witten, T.M.; Bonchev, D.G.; Diegelmann, R.F. Impaired wound healing. Clin. Dermatol. 2007, 25, 19–25. [Google Scholar] [CrossRef]
  22. Place, E.S.; Evans, N.D.; Stevens, M.M. Complexity in biomaterials for tissue engineering. Nat. Mater. 2009, 8, 457–470. [Google Scholar] [CrossRef] [PubMed]
  23. Van Meerloo, J.; Kaspers, G.J.L.; Cloos, J. Cell Sensitivity Assays: The MTT Assay. In Cancer Cell Culture; Humana Press: Totowa, NJ, USA, 2011; pp. 237–245. [Google Scholar]
  24. Malkusch, W.; Rehn, B.; Bruch, J. Advantages of Sirius Red Staining for Quantitative Morphometric Collagen Measurements in Lungs. Exp. Lung Res. 1995, 21, 67–77. [Google Scholar] [CrossRef]
  25. Volk, S.W.; Wang, Y.; Mauldin, E.A.; Liechty, K.W.; Adams, S.L. Diminished Type III Collagen Promotes Myofibroblast Differentiation and Increases Scar Deposition in Cutaneous Wound Healing. Cells Tissues Organs 2011, 194, 25–37. [Google Scholar] [CrossRef] [PubMed] [Green Version]
  26. Xue, M.; Jackson, C.J. Extracellular Matrix Reorganization during Wound Healing and Its Impact on Abnormal Scarring. Adv. Wound Care 2015, 4, 119–136. [Google Scholar] [CrossRef] [PubMed] [Green Version]
  27. Liang, C.C.; Park, A.Y.; Guan, J.L. In vitro scratch assay: A convenient and inexpensive method for analysis of cell migration in vitro. Nat. Protoc. 2007, 2, 329–333. [Google Scholar] [CrossRef] [Green Version]
  28. Vénéreau, E.; Ceriotti, C.; Bianchi, M.E. DAMPs from Cell Death to New Life. Front. Immunol. 2015, 6, 422. [Google Scholar] [CrossRef] [Green Version]
Figure 1. (A) A Coulter Counter was used to determine cell number at 96 h and 1 week of culture. PN and PN + HA significantly increased cell number (*** = p < 0.001 control vs. either stimulated group). (B) Cell Titer GLO assay was used to assay cell viability in the control, PN or PN + HA groups at 96 h and 1 week of culture. PN or PN + HA significantly increased viability vs. the control at both time-points. (*** = p < 0.001 control vs. PN and PN + HA). (C) MTT viability assay was carried out at 96 h and 1 week of culture. PN, with or without HA, significantly increased cell viability at 96 h and 1 week of culture. *** = p < 0.01 control vs. PN or PN + HA groups. (D) Lowry assay was also used to determine the protein control, PN or PN + HA groups after 96 h and 1 week of culture. Protein levels were significantly higher in the presence of PN or PN + HA at 96 h and 1 week of culture. ** = p = 0.0068 control vs. PN, p = 0.0023 control vs. PN + HA; *** = p = 0.0006 and p = 0003 control vs. PN and PN + HA, respectively. (E,G,I) Microphotographs of primary human fibroblasts at 1 week of culture in the control group (E) or in PN (G) or PN + HA (I) groups, at phase contrast microscopy. Magnification = 10× (Bar = 100 μm). (F,H,J) Microphotographs of primary human fibroblasts at 1 week of culture in control group (F) or in PN (H) or PN + HA (J) groups, after adding MTT, which generates blue needle-shape precipitates upon reduction to Formazan. Cells appeared more numerous in the presence of PN (G,H), but even more so with the addition of HA, where cells appear stacked in multi-layered nodules (I,J).
Applsci 11 04405 g001
Figure 2. (AC) Clonogenic efficiency assay, representative wells from the control (A), PN (B) and PN + HA (C) groups. Stained colonies appeared as diffused (D), mixed (E) or dense (F), according to how densely packed cells appeared. These microphotographs were taken at 4×magnification (Bar = 100 μm). (G) Clonogenic efficiency for control, PN and PN + HA groups, counting all colonies or dense, mixed and diffused colonies, separately, expressed as mean ± SD.
Applsci 11 04405 g002
Figure 3. (AC) Microphotographs of gingival fibroblasts at widefields cultured with vehicle (A), PN (B) or PN + HA (C) and stained with Sirius red. Bar = 100 µm. (DF) Microphotographs of fibroblasts stained with Sirius red, under a fluorescence microscope. Bar = 50 µm. (G,H) Collagen 1a1 (G) and Collagen 3a1 (H) expression in culture supernatants of fibroblasts in control group or in the presence of PN or PN + HA, expressed as % increase in Collagen production/% increase in cell number from 96 h to 1 week of culture. PN + HA hydrogel stimulated a higher expression of Collagen 1a1 and Collagen 3a1 adjusted by cell growth. * p = 0.023 for (G) and * p = 0.024 for (H).
Applsci 11 04405 g003
Figure 4. (AC) Microphotographs of gingival fibroblasts cultured with vehicle (A), PN (B) or PN + HA (C) and stained with Alcian Blue. Magnification 10×, Bar = 100 µm.
Applsci 11 04405 g004
Figure 5. (AC) Microphotographs of gingival fibroblasts, after scratch, cultured with vehicle (A), PN (B) or PN + HA (C) and stained with Giemsa. Magnification 4× (Bar = 100 μm). (D) Graph showing the amount of healing area (scratch area covered by cells) at time = and after 48 or 96 h. *** p < 0.001.
Applsci 11 04405 g005
Publisher’s Note: MDPI stays neutral with regard to jurisdictional claims in published maps and institutional affiliations.

