Article

Projected Changes in Extreme Temperature and Precipitation Indices Over CORDEX-MENA Domain

by
Tugba Ozturk
1,*,
F. Sibel Saygili-Araci
2,3 and
M. Levent Kurnaz
3,4
1
Department of Physics, Faculty of Arts and Sciences, Isik University, 34980 Istanbul, Turkey
2
Institute of Environmental Sciences, Bogazici University, 34342 Istanbul, Turkey
3
Center for Climate Change and Policy Studies (iklimBU), Bogazici University, 34342 Istanbul, Turkey
4
Department of Physics, Bogazici University, 34342 Istanbul, Turkey
*
Author to whom correspondence should be addressed.
Atmosphere 2021, 12(5), 622; https://doi.org/10.3390/atmos12050622
Submission received: 31 March 2021 / Revised: 5 May 2021 / Accepted: 6 May 2021 / Published: 12 May 2021

Abstract

:
In this study, projected changes in climate extreme indices defined by the Expert Team on Climate Change Detection and Indices were investigated over Middle East and North Africa. Changes in the daily maximum and minimum temperature- and precipitation- based extreme indices were analyzed for the end of the 21st century compared to the reference period 1971–2000 using regional climate model simulations. Regional climate model, RegCM4.4 was used to downscale two different global climate model outputs to 50 km resolution under RCP4.5 and RCP8.5 scenarios. Results generally indicate an intensification of temperature- and precipitation- based extreme indices with increasing radiative forcing. In particular, an increase in annual minimum of daily minimum temperatures is more pronounced over the northern part of Mediterranean Basin and tropics. High increase in warm nights and warm spell duration all over the region with a pronounced increase in tropics are projected for the period of 2071–2100 together with decrease or no change in cold extremes. According to the results, a decrease in total wet-day precipitation and increase in dry spells are expected for the end of the century.

1. Introduction

The need for robust future projections of extreme climate events has increased rapidly during the recent decades since extreme climate events affect society and ecosystems with their potentially severe impacts [1,2,3]. The Special Report on Extreme Events of the Intergovernmental Panel on Climate Change (IPCC) states there is evidence from the gathered observations since 1950 that climate extremes are changing, and some extremes have changed due to the anthropogenic influences [4]. Since extreme events are rare, there are only few pieces of data to make assessments on their frequency or severity and the rarer the event, the more challenging to identify or analyze the changes [4]. Moreover, as with many climate phenomena, extreme events are also multifaceted and are extremely difficult to monitor [5]. Therefore, there have been international coordinated efforts to enable and ease the research on observed and projected changes also to encourage the comparison of observations and modeled data of climate extreme events, especially for temperature and precipitation extremes. One such effort was by the Expert Team on Climate Change Detection and Indices (ETCCDI) (https://www.clivar.org/organization/etccdi, accessed on 20 April 2021) who have defined a set of climate change indices focusing on extreme events based on daily temperature and precipitation data [6,7]. These indices enabled the development of regional and global gridded datasets in a comparable way [8] such as HadEX [9] and the updated version HadEX2 [10].
Most of the indices defined by the ETCCDI, simply referred to as indices hereafter, describe moderate extreme events that have a re-occurrence time of a year or less compared to more extreme events that have 20- year re-occurrence times [11,12]. Indices are derived from daily maximum and minimum of near surface temperature, daily precipitation data (TX, TN and PR, respectively) and they extract information from daily weather observations or model outputs to answer questions on the changes of climate extremes such as the heaviest daily precipitation event or the number of days below freezing [8]. The full set of the total 27 extreme indices can be viewed in the work of Sillmann et al. [12]. Detailed information on the indices can be found in the literature [7,8,9] and on the ETCCDI website. Sixteen of these indices are based on temperature and 11 are based on precipitation data. Since human activities are especially vulnerable to hydrological extreme events such as floods and droughts, changes in precipitation extremes have attracted more attention in the literature [11]. Here in this study a subset of the 27 indices were used and the selected indices give a broad and comprehensive overview of the future changes in temperature and precipitation extremes.
The indices are easy to interpret, give robust results therefore they have many applications in climate research and other related areas [2]. They have been used to investigate and monitor global changes in extreme events with observational data [9,10,13,14], with projected future data [2,11,15,16,17] or to evaluate model performance [12,18]. The indices also enable regional analyses of extreme event changes therefore model performance evaluated also regionally [19] and the regional changes in temperature and precipitation extreme events have been assessed for many parts of the world during the recent decades, such as in Australia [20], North America [21,22], the United States [23], the Mediterranean Basin [24], countries of Western Indian Ocean [25], the Arab Region [26], China [5,27,28], Iran [29], Egypt [30], Central and South Asia [31], East Asia [32], Ethiopia [33,34,35], Saudi Arabia [36]. Various detection and attribution studies also used indices [37,38,39].
Collaborative studies on the climate extreme events detected that intensity of extreme precipitation increases in the future under global warming in many parts of the world, even in the regions where mean precipitation decreases [40,41,42,43,44]. The increases in heavy precipitation in the future together with the reductions in the probability of wet-days indicate more extreme climate with higher probabilities of drought as well as more heavy precipitation events [11]. Changes in temperature extreme events are generally in accordance with the mean temperature changes for many parts of the world. Nonetheless, as a result of sea ice and snow melting due to the global warming, cold temperature extremes are found to be warming faster than warm temperature extremes [40,41]. Summertime temperature variability is reported to be increasing over land, which means potentially larger relative increases in warm extremes than in mean summertime temperature [11,41,45].
As a complementary study to the work of Sillmann et al. [2], the aim of this study is to investigate the projected changes in climate extreme indices defined by ETCCDI over Coordinated Regional Climate Downscaling Experiment (CORDEX) Region 13 that is Middle East and North Africa (MENA) for the end of the 21st century. The primary tools for studying possible future changes in climate mean, variability and climate extremes are the simulations with global coupled ocean-atmosphere general circulation models (CGCMs) [11,14]. Since the CGCMs have coarse resolution (100–300 km) and they have no topographic information at finer scales, they are not suitable for generating detailed results [46]. To obtain more detailed climatic conditions over a specific region, Regional Climate Models (RCMs) are considered to be the best tools for downscaling the outputs of CGCMs [47,48,49]. Here in this study, RegCM4.4 is used as an RCM with two different CGCMs, that are HadGEM2-ES and MPI-ESM-MR both of which are recommended to be used for MENA region together with RegCM4.4 [49,50,51]. According to Ozturk et al. [50], RegCM outputs driven by MPI-ESM-MR show better agreement than the results of RegCM driven by HadGEM2-ES global model with respect to the observational dataset. MPI-ESM-MR, as well as that of the HadGEM2-ES is discussed to be relatively better than other CGCMs for the MENA region [50,52]. Moreover, RegCM4 has been found to be well suited to conduct long-term high-resolution projection of climate for the CORDEX-MENA domain [53]. To be able to generate future simulations, CGCMs are forced with representative greenhouse gas and aerosol emission scenarios. Representative Concentration Pathways (RCPs) are the greenhouse gas concentration trajectories adopted by IPCC and these trajectories describe possible climate futures depending on the amount of greenhouse gas emissions until 2100. Two of the RCPs used in this study are the intermediate level emission scenario RCP4.5 which foresees a 4.5 W/m 2 of radiative forcing at the end of the century and the worst- case emission scenario RCP8.5, which is also referred as the ’business- as- usual scenario’ meaning the society would not make any effort to cut greenhouse gas emissions at all, foresees an 8.5 W/m 2 of radiative forcing at the end of the century [54]. These radiative forcing levels were defined as ±5% of the stated level relative to the pre-industrial levels. The different radiative forcing amounts in two scenarios can lead to different average temperature responses and it is expected in this study that this difference will also be evident in seasonal and annual temperature and precipitation extremes [55].
The region that is the subject of this study, MENA is evidently the world’s most water scarce region and of all the challenges the region faces, it is the least prepared for increased future water crises [56,57]. The region has well-recognized high vulnerability to adverse climate effects [58] and the growing population brings an increasing demand on water resources [59]. The Fifth Assessment Report (AR5) of IPCC shows about a 50% decrease in precipitation in the rainy season with the “business- as- usual” scenario, RCP8.5 by the end of the century (2021–2100) with respect to 1986–2005 [60]. Various regions in MENA have already been experiencing severe droughts for decades [61]. With the effect of climate change, heavy downpours of rain are expected as well as longer lasting droughts [62] and therefore floods also pose a great danger for MENA [56]. Despite their highly arid and semi-arid climatic conditions with generally dry and hot summers and mild winters [26], many cities in MENA have been experiencing costly flash floods for many years [63]. A study by Zhang et al. [64] employing climate extreme indices for 1950–2003 at 52 stations covering 15 countries in the Middle East found increasing trends in the annual maximum of daily maximum and minimum temperature, the annual minimum of daily maximum and minimum temperature, the number of summer nights, and the number of days where daily temperature was higher than its 90th percentile; and decreasing trends in the number of days where daily temperature was lower than its 10th percentile. Trends in precipitation indices were found to be weak in general and they did not show spatial coherence [64]. Coupled Model Intercomparison Project (CMIP) Phase 5 climate model projections under RCP4.5 and RCP8.5 showed that climate warming is strongest in summer in MENA while in the rest of the world it is typically stronger in winter, and the summertime warming extends the thermal low at the surface from South Asia across MENA while the hot desert climate intensifies and becomes more extreme [65].
Almazroui et al. [66] projected the change in temperature and precipitation over the African continent with 27 global climate models from CMIP6 under the Shared Socioeconomic Pathways (SSPs) which are a set of five storylines on possible trajectories for human development and global environmental change until the end of the century [67]. These SSPs consist of a set of baselines that provides a description of future developments in the absence of new climate policies as well as mitigation scenarios that explore the climate change mitigation policies [68]. The SSP5 scenario foresees a rapid economic growth, very high levels of fossil fuel use, a doubling of food demand, a tripling of energy demand with greenhouse gas emissions until the end of the century, which is in line with the energy and resource intensive business- as- usual RCP8.5 scenario [69], therefore these two scenarios are evaluated together. In the study of Almazroui et al. [66] the mean annual temperature over Africa for the 2070–2099 period is projected to increase by 1.4 C under weak forcing scenario SSP1-2.6, by 2.3 C under moderate forcing scenario SSP2-4.5 and 4.4 C under strong forcing scenario SSP5-8.5. The projections show that the Sahara will have the largest increase in mean annual temperature with 5.6 C, while Central East Africa will have the smallest increase with 3.5 C under the SSP5-8.5 scenario. Although showing a mixed spatial pattern, precipitation is projected to decrease in general over Northern Africa and increase in general over the central parts of Africa.
The study of Driouech et al. [70] assessing future changes of climate extreme events in MENA using another regional climate model called ALADIN-Climate reported that projected changes for MENA indicate the intensification of heat waves number, duration and magnitude, and contrasted precipitation changes. North- West MENA is projected to get become drier while North- East MENA along with the Mediterranean side of the region is projected to get become wetter. Regional warming is projected to be at a rate between 0.2 to 0.5 C/decade over land depending on the scenario used. The findings of the study show that drought is expected to increase in the Northern MENA independent from which index is used, however, if the index accounts for both the effect of precipitation and temperature changes, then the increase of drought will be at a higher rate [71]. It is reported that the Regional Climate Model ALADIN-Climate results corroborate previous studies projecting the MENA region [70].
Another study by Zittis et al. [72] employing Heat Wave Magnitude Index with a comprehensive ensemble of regional climate projections to simulate future hot spells in MENA reports that business- as- usual emission scenario will lead to super and ultra-extreme heatwaves in MENA. Especially in the second half of the 21st century, MENA will face potentially life-threatening excessively high temperatures (up to 56 C and higher) with extended duration (several weeks). It is stated that by the end of the 21st century about half of the MENA population who live in urban centers will be exposed to annually recurring super- and ultra-extreme heatwaves, and among other socioeconomic sectors, agriculture, the water and energy nexus, as well as the labor productivity, biodiversity and livestock in MENA will be negatively affected by these heatwaves. Therefore, to assess regional impacts, underpin mitigation and adaptation measures, robust information from climate downscaling studies has crucial importance for the region [72].

2. Materials and Methods

This study is aimed to determine the future changes of the intensity and frequency of extreme events and to provide an early warning system for the countries in MENA to better prepare for the possible severe impacts of climate change. Therefore, first the outputs of MPI-ESM-MR global climate model of the Max Planck Institute for Meteorology and HadGEM2-ES global climate model of the MET Office Hadley Centre were downscaled to 50 km for the MENA region using the Regional Climate Model (RegCM4.4) of the Abdus Salam International Centre for Theoretical Physics [73]. To make the future projections for the 21st century with respect to the 1971–2000 reference period, two emission scenarios RCP4.5 and RCP8.5 were used. Thereafter, a subset of the 27 ETCCDI indices were chosen to assess various aspects of a changing global climate which include changes in intensity, frequency and duration of extreme temperature and precipitation events. In Table 1 the indices that are used in this study are given with their definitions and units.
The selected indices can be classified roughly in four categories for both the temperature indices and the precipitation indices [2]: (1) Absolute indices of temperature with the maximum of TX (TXx) and the minimum of TN (TNn) mainly describe the hottest or coldest day in a year, season or month.T. The annual temperature extreme indices are generally used in the literature to show the extreme temperature range in history [9,74] and in the projected future [11]. (2) Threshold indices for temperature such as frost days (FD) or tropical nights (TR) count the number of days when a previously fixed temperature is exceeded and in this study, FD and TR count the days when TN is below 0 C and above 20 C, respectively. Threshold indices for temperature are used in climate impact studies such as on agriculture [75] or human health [76]. Precipitation threshold index that is the heavy precipitation days index (R10mm) counts the days when the threshold of 10 mm precipitation exceeded, and this index is generally associated with wet days but not with extreme precipitation. (3) Percentile-based threshold indices represent the exceedance rates (in %) above or below a previously defined thresholds that is 10th or 90th percentile derived from 1971–2000 base period. In this study, percentile-based temperature threshold indices that are cold nights (TN10p) and warm nights (TN90p) describe the rate of days that the threshold exceeded where TN or TX is below the 10th or above the 90th percentile, respectively. Percentile-based precipitation threshold index that is very wet days (R95p) describes the accumulated annual precipitation amount in mm on days when daily precipitation amount exceeds the 95th percentile threshold of precipitation (PR > 1 mm) distribution derived from the 1971–2000 base period. (4) Duration indices for temperature that are the warm spell duration (WSDI) and cold spell duration (CSDI) characterize the length of warm and cold spells. They are calculated as in percentile indices, with the percentile thresholds of the base period 1971–2000. WSDI counts the days in a year when TX is above the 90th percentile for six or more consecutive days and CSDI counts the days in a year when TN is below the 10th percentile for six or more consecutive days. Duration index for precipitation is the consecutive dry-day index (CDD) which characterizes the length of the longest period of consecutive dry days in a year i.e., days with PR < 1 mm in a year. If a dry spell does not end in a year and continues for more than 1 year, then CDD is not reported for that year and the accumulated dry days are carried forward until the year when the spell ends. With this definition, intermitting dry spells where the dry season spans a period longer than 1 year is avoided [2]. There are other studies that define CDD where dry spells are terminated at the end of the year even if the dry spell does not end [74]. The method used in this study can result in very large values at some grid points for the regions where dry spells last for very long periods [12]. However, CDD is the only ETCCDI index to indicate lack of precipitation and meteorological drought only. Since drought is a complex phenomenon combining various factors, the use of CDD with other precipitation or drought indices is encouraged to interpret drought [16,74,77].
There is one more index that do not fit in any of the categories described above. The total wet-day precipitation index (PRCPTOT) is defined as the total annual amount of precipitation on wet days which are the days with more than 1 mm of precipitation. Although PRCPTOT is not directly related with climate extreme events, they provide practical information about the daily precipitation distribution and the relationship between the changes in extreme conditions such as R95p [2].

3. Results

The results are presented first for temperature indices and secondly for precipitation indices in terms of the spatial patterns of changes of extreme event indices for two different RCPs, RCP4.5 and RCP8.5. The changes are displayed for the time period 2071–2100 with respect to the reference period 1971–2000 for both of the models, MPI-ESM-MR and HadGEM2-ES. Future change in temperature and precipitation indices obtained from spatial averages for sub-regions are also presented in tTables. We divided MENA region into four sub-regions based on based on the criteria described by Giorgi and Francisco [78]. We have extended Mediterranean region to 49 degrees East in order toto include all parts of Turkey. Southern boundaries for East Africa and West Africa were limited according to data boundaries of MENA region. Temporal evolution of change in some of indices throughout the century is also presented (Supplementary Figures S1–S4).

3.1. Temperature Indices

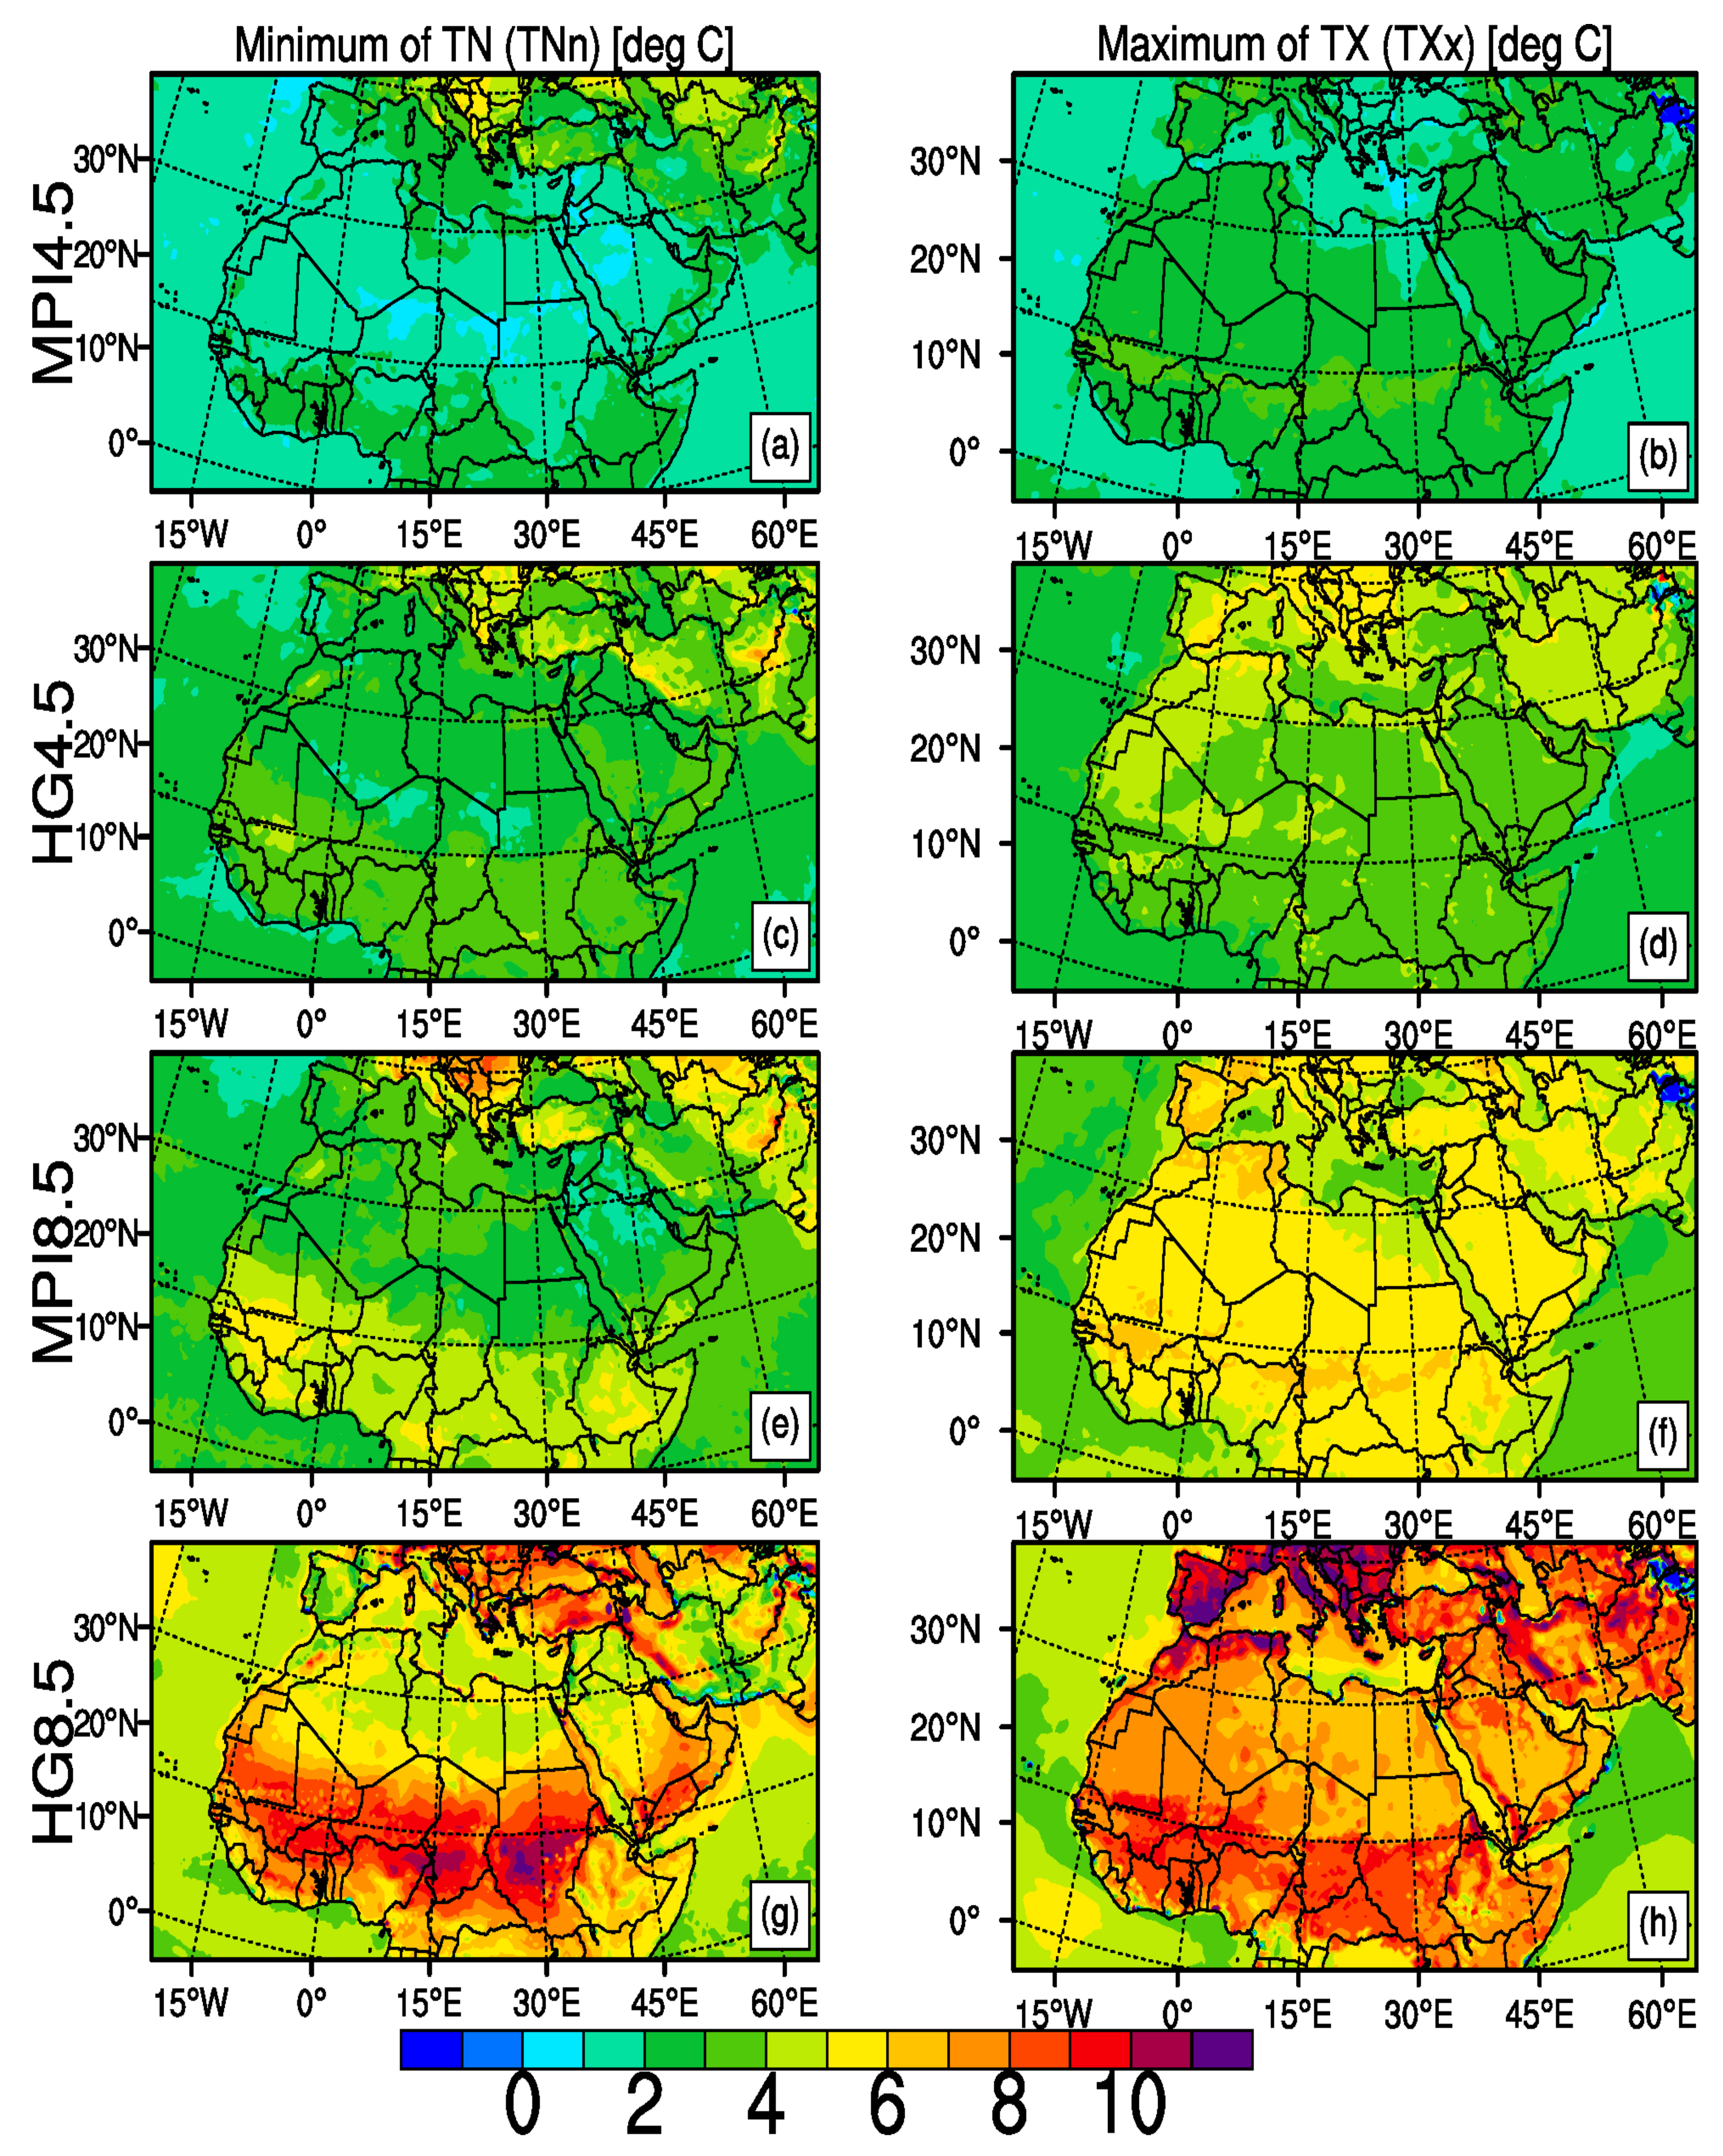
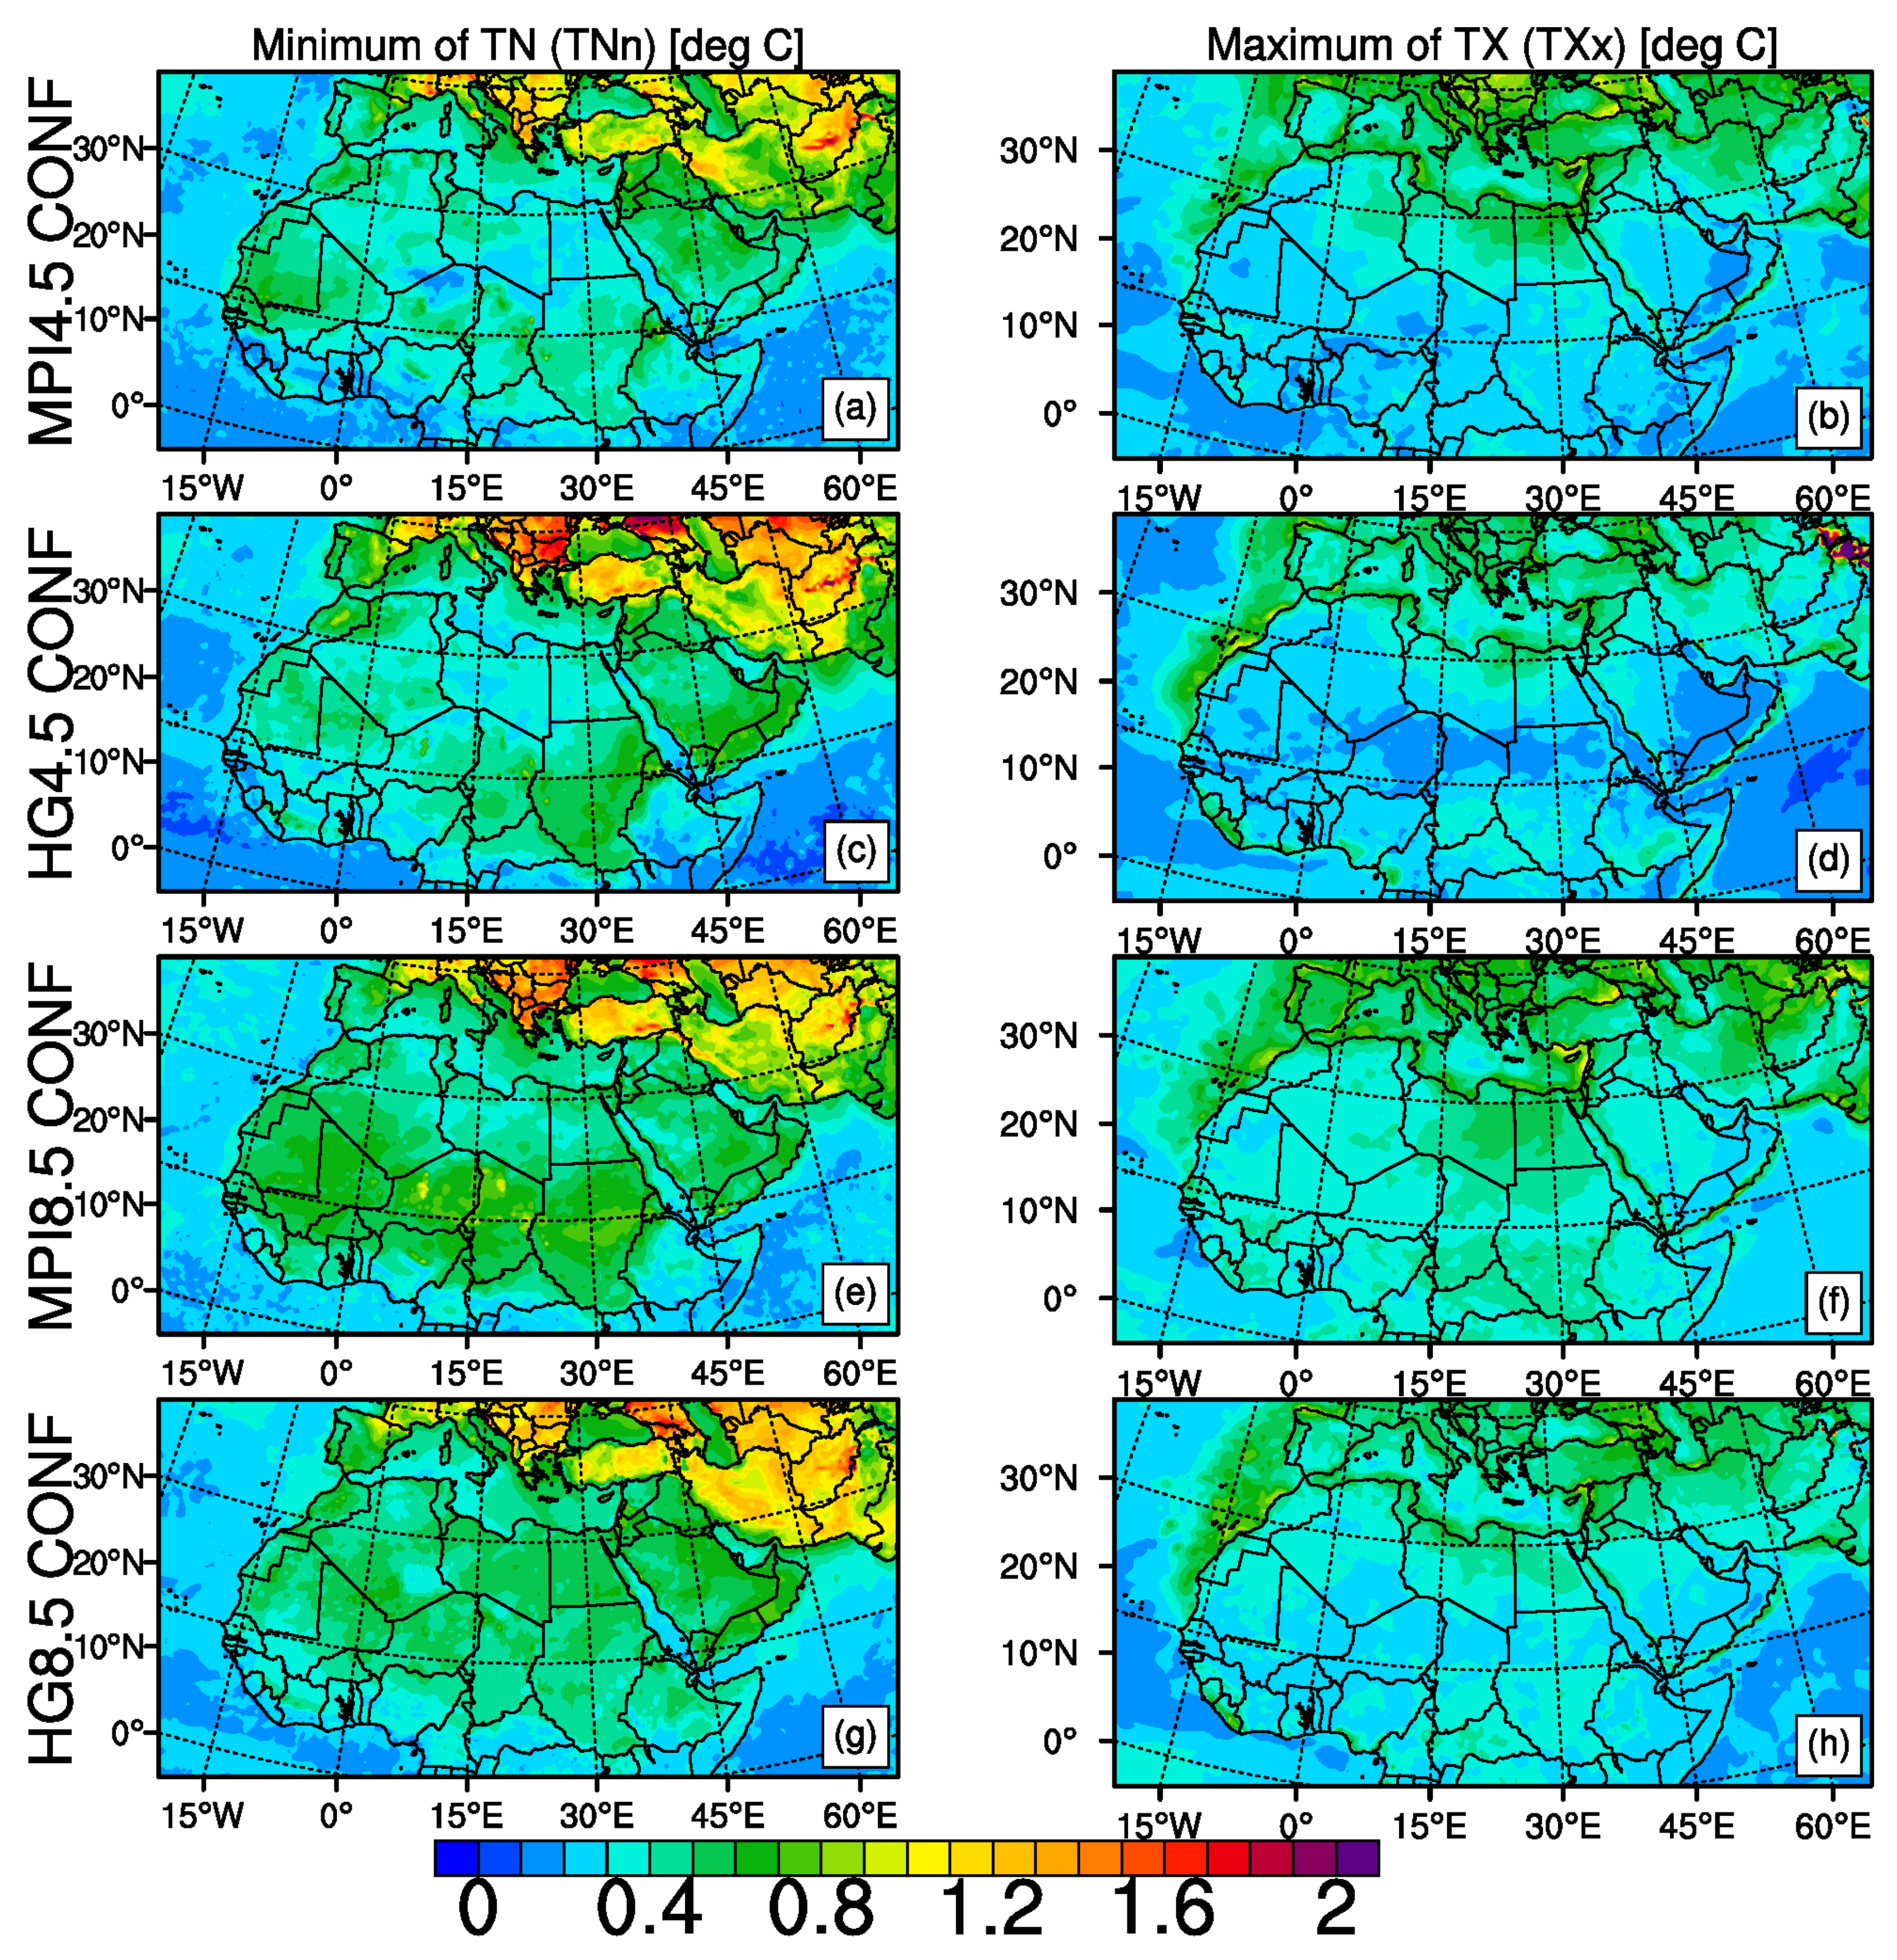
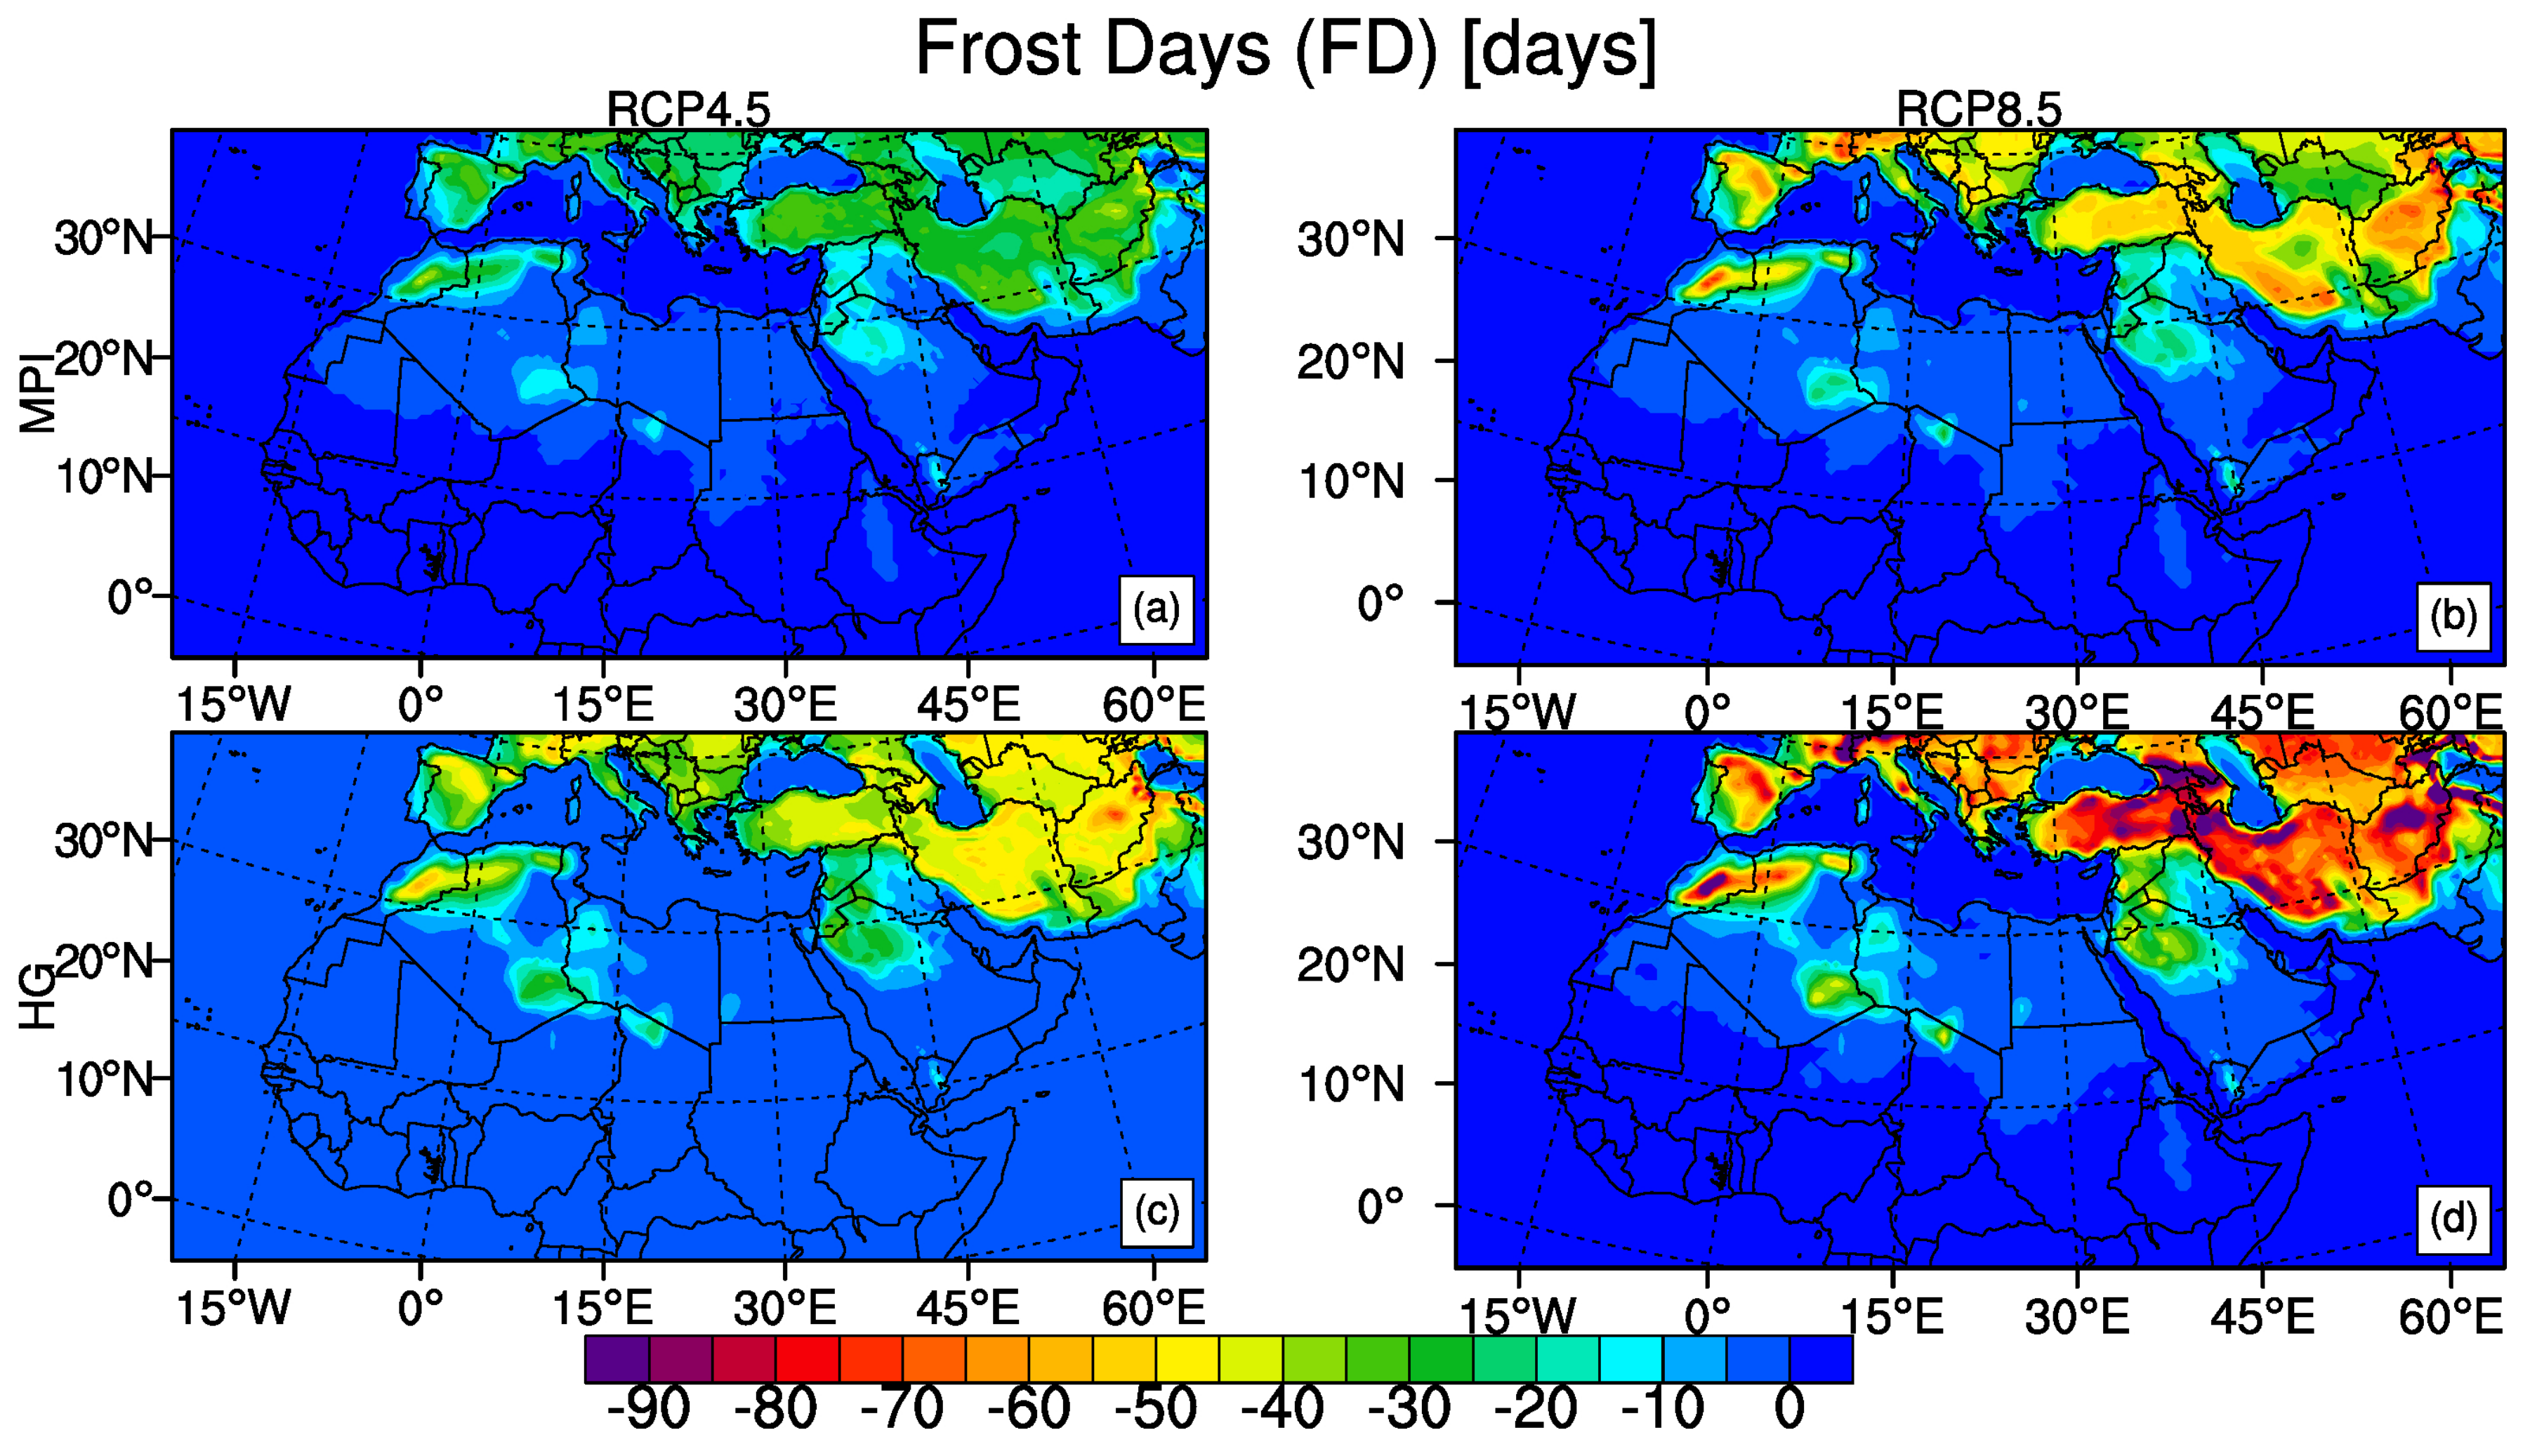
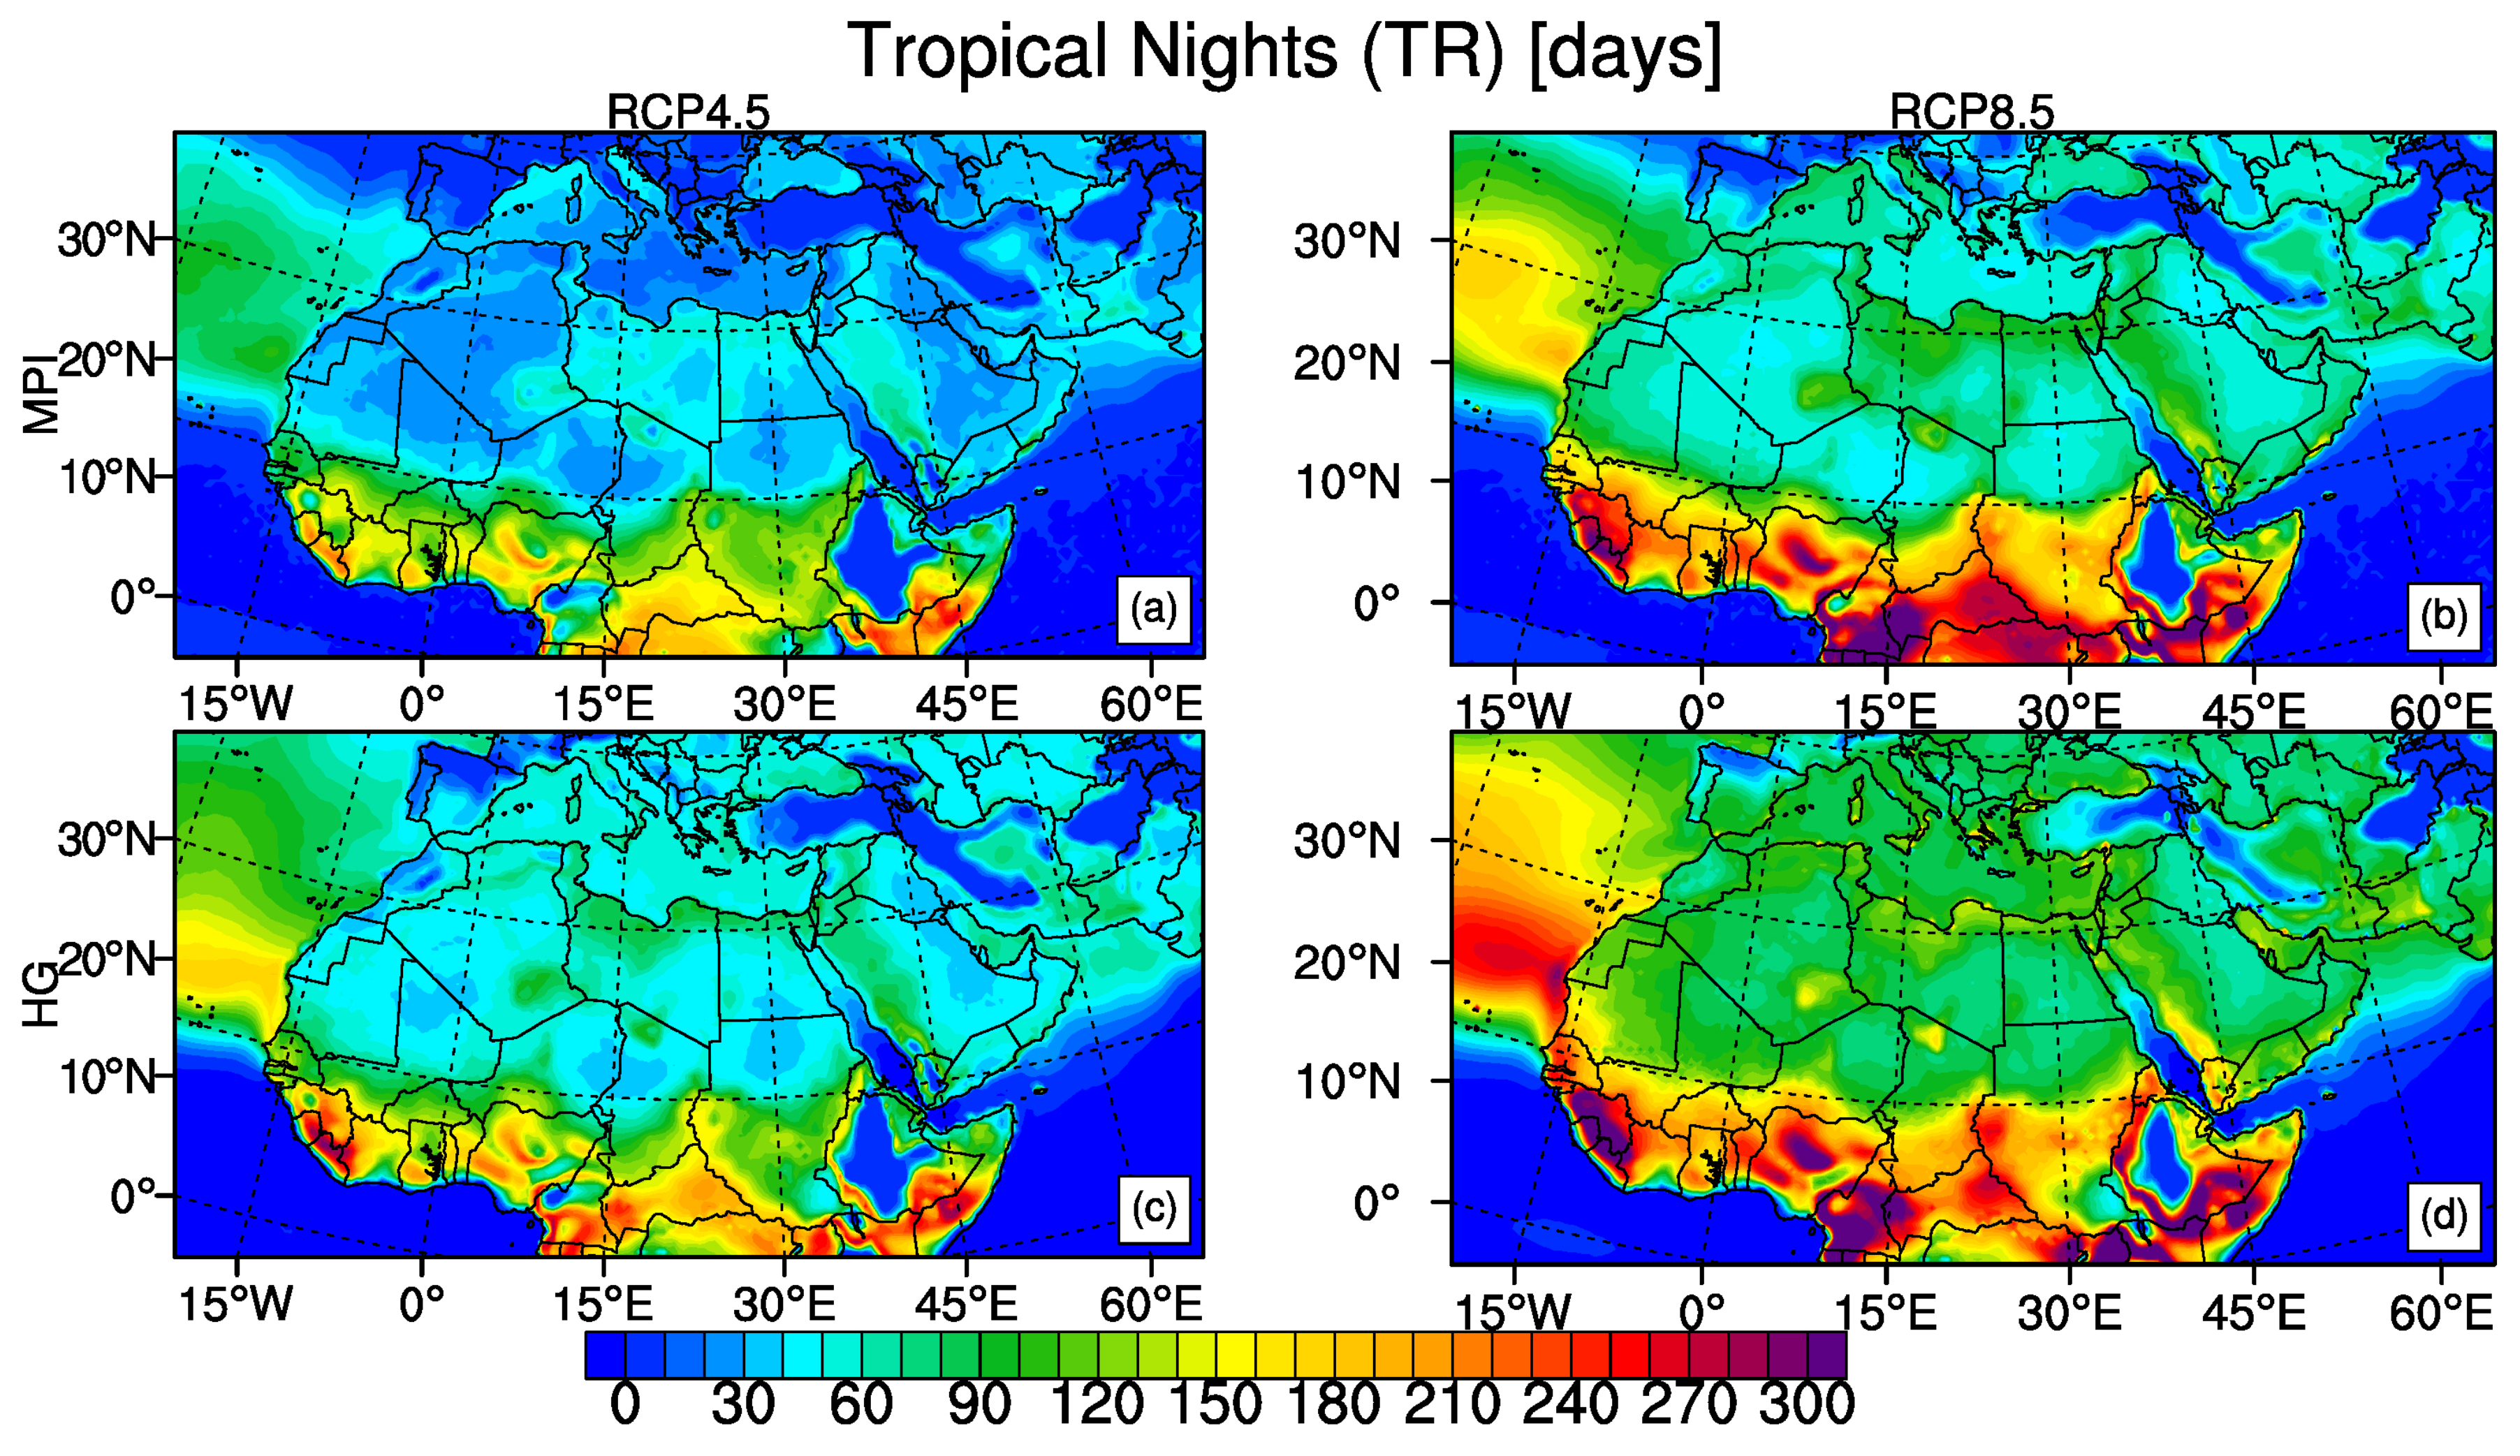
3.1.1. Absolute and Threshold Indices

Our analysis starts with the comparison of the TNn and TXx of the two model outputs together with the two emission scenarios, displayed in Figure 1. The 95-percentile confidence range values for the period of 2071–2100 with respect to period of 1971–2000 are also given in Figure 2. The ranges are the differences between the upper and lower confidence limits. Relative to the reference period 1971–2000, Figure 1 shows a general increase in the annual minimum of TN, and the annual maximum of TX over MENA for the end of the century. The increase in TXx is greater than the increase in TNn for both scenarios and for both models. The spatial patterns of change in TNn and TXx differ from each other and the increase in TXx is stronger than TNn between the latitudes of 10 N–30 N for both models but especially for the RCP8.5 scenario, except that HadGEM2-ES RCP4.5 scenario results show somewhat similar increase for both of the indices between these latitudes. HadGEM2-ES global model shows stronger increase in both TNn and TXx compared to MPI-ESM-MR global model for both scenarios, however, the change is even more pronounced with the RCP8.5 scenario. HadGEM2-ES global model driven results also show more warming in mean temperatures than that of MPI-ESM-MR global model for the period of 2070–2100 [50]. The greatest changes in TNn, exceeding 8 C, simulated in RCP8.5 and with HadGEM2-ES are in the west African monsoon region and Southern Europe. MPI-ESM-MR gives the greatest changes in TNn over the Southern Europe with RCP8.5, exceeding 7 C. The greatest change in TXx is seen with the HadGEM2-ES in RCP8.5 and almost the whole region shows an increase more than 6 C including the Mediterranean region, west African monsoon region more than 8 C and the higher latitudes of the region more than 10 C. These regions will face severe heat stress in summer with extreme temperatures if path of RCP8.5 is followed in the future. The 95 percentile confidence range values are in between 0 to 0.8 C for all domain, except for Northern Balkan region, Turkey and Iran for minimum temperature. In the Northern Balkan region, uncertainty range increases to 1.6 C. Our results show 95% confidence that the increase in TX by the end of the century will be between 9 ± 0.8 C in the Mediterranean region. Results of this uncertainty for temperature change signal indicate that all changes can be considered robust. Our TXx results show a decrease of about 1 C around Tajikistan, however, other studies in the literature revealed cold biases of climate models over the region [50,79,80,81,82]. In contrast to HadGEM2-ES, MPI-ESM-MR projects TXx to warm more uniformly for both scenarios. For both models and for both scenarios, in terms of hot extremes, both TNn and TXx are projected to increase in the end of the 21st century.
Spatial averages over the sub-regions of the domain show the highest increase of 8.1 C in TXx over the Mediterranean region. The greatest increase of 6.8 C and 6.7 C in TNn is expected over East Africa and West Africa at the end of the century respectively (Table 2). Projected warming is increasing with time and most of the warming will be during the end of the century over all the domains. Our results are in line with the findings of Almazroui [49], stating that RCP8.5 clearly simulates higher temperatures with larger standard deviations as compared to the RCP4.5 especially for the 1970–2100 period. According to the study of Almazroui [49], all increasing trends in temperature and in hot day numbers are also statistically significant at the 95% level.
In Figure 3, the temporally averaged changes of FD for the period 2071–2100 relative to the reference period 1971–2000 for both models and in two emission scenarios are displayed. Both MPI-ESM-MR and HadGEM2-ES global models in both concentration pathways exhibit decrease in FD for the northern part of the region. As in the case of TNn and TXx, HadGEM2-ES shows stronger decrease for both RCPs and as expected, RCP8.5 results show less frost days compared to RCP4.5 results for the Mediterranean. The greatest decrease in FD with reductions exceeding 70 frost days, is displayed in red in Figure 3 and obtained with HadGEM2-ES in RCP8.5 for regions such as the Mediterranean coasts of France, Northern Italy, Russian lands between the Caspian Sea and the Black Sea. Mediterranean sub-region has the greatest decrease of 28.6 days in frost days on average while other sub-regions have very low decrease in number of frost days (Table 2). Equatorial region of MENA between the latitudes 10 N and 10 S shows almost no difference in FD for MPI-ESM-MR in both scenarios and shows only about reductions of 5 days for HadGEM2-ES RCP4.5. The region, especially East Africa and West Africa sub-regions have already very low number of frost days. The similar pattern of regional changes is seen for all cases, the most pronounced decreases being in the business-as-usual emission scenario.
Figure 4 shows the change in TR based on the fixed 20 C threshold. Both models and both scenarios agree on an increasing trend throughout the region. Eastern Turkey and North- Eastern MENA show less increase in TR for the end of the 21st century for both models and scenarios compared to other parts of the domain. The strongest increase is in the tropical regions exceeding 150 days which is in compliance with the findings of Sillmann et al. [2]. Again, the results of HadGEM2-ES model are stronger compared to MPI-ESM-MR for both scenarios. For the worst-case emission scenario, North- Western MENA, including Canary Islands of Spain, Atlantic coasts of Morocco, Western Sahara and Mauritania as well as the Arabian Sea coast of India exhibit an increase that is more than 100 days. Central part of the MENA region shows an increase at least 60 days with both models under RCP8.5 which means nighttime temperatures in most of summer will be above 20 C threshold. Tropical nights will be expected to increase mostly over East Africa sub-region that is up to 150 days at the end of the century (Supplementary Figure S3). West Africa is also expected to have tropical nights of more than 120 days for the scenario RCP8.5. Mediterranean and Sahara region will have 83 and 98 days with nighttime temperatures greater than 20 C respectively (Table 2). Combined with the strong increase in TXx, MENA would face severe heat stress and extreme temperatures under the worst-case emission scenario RCP8.5.

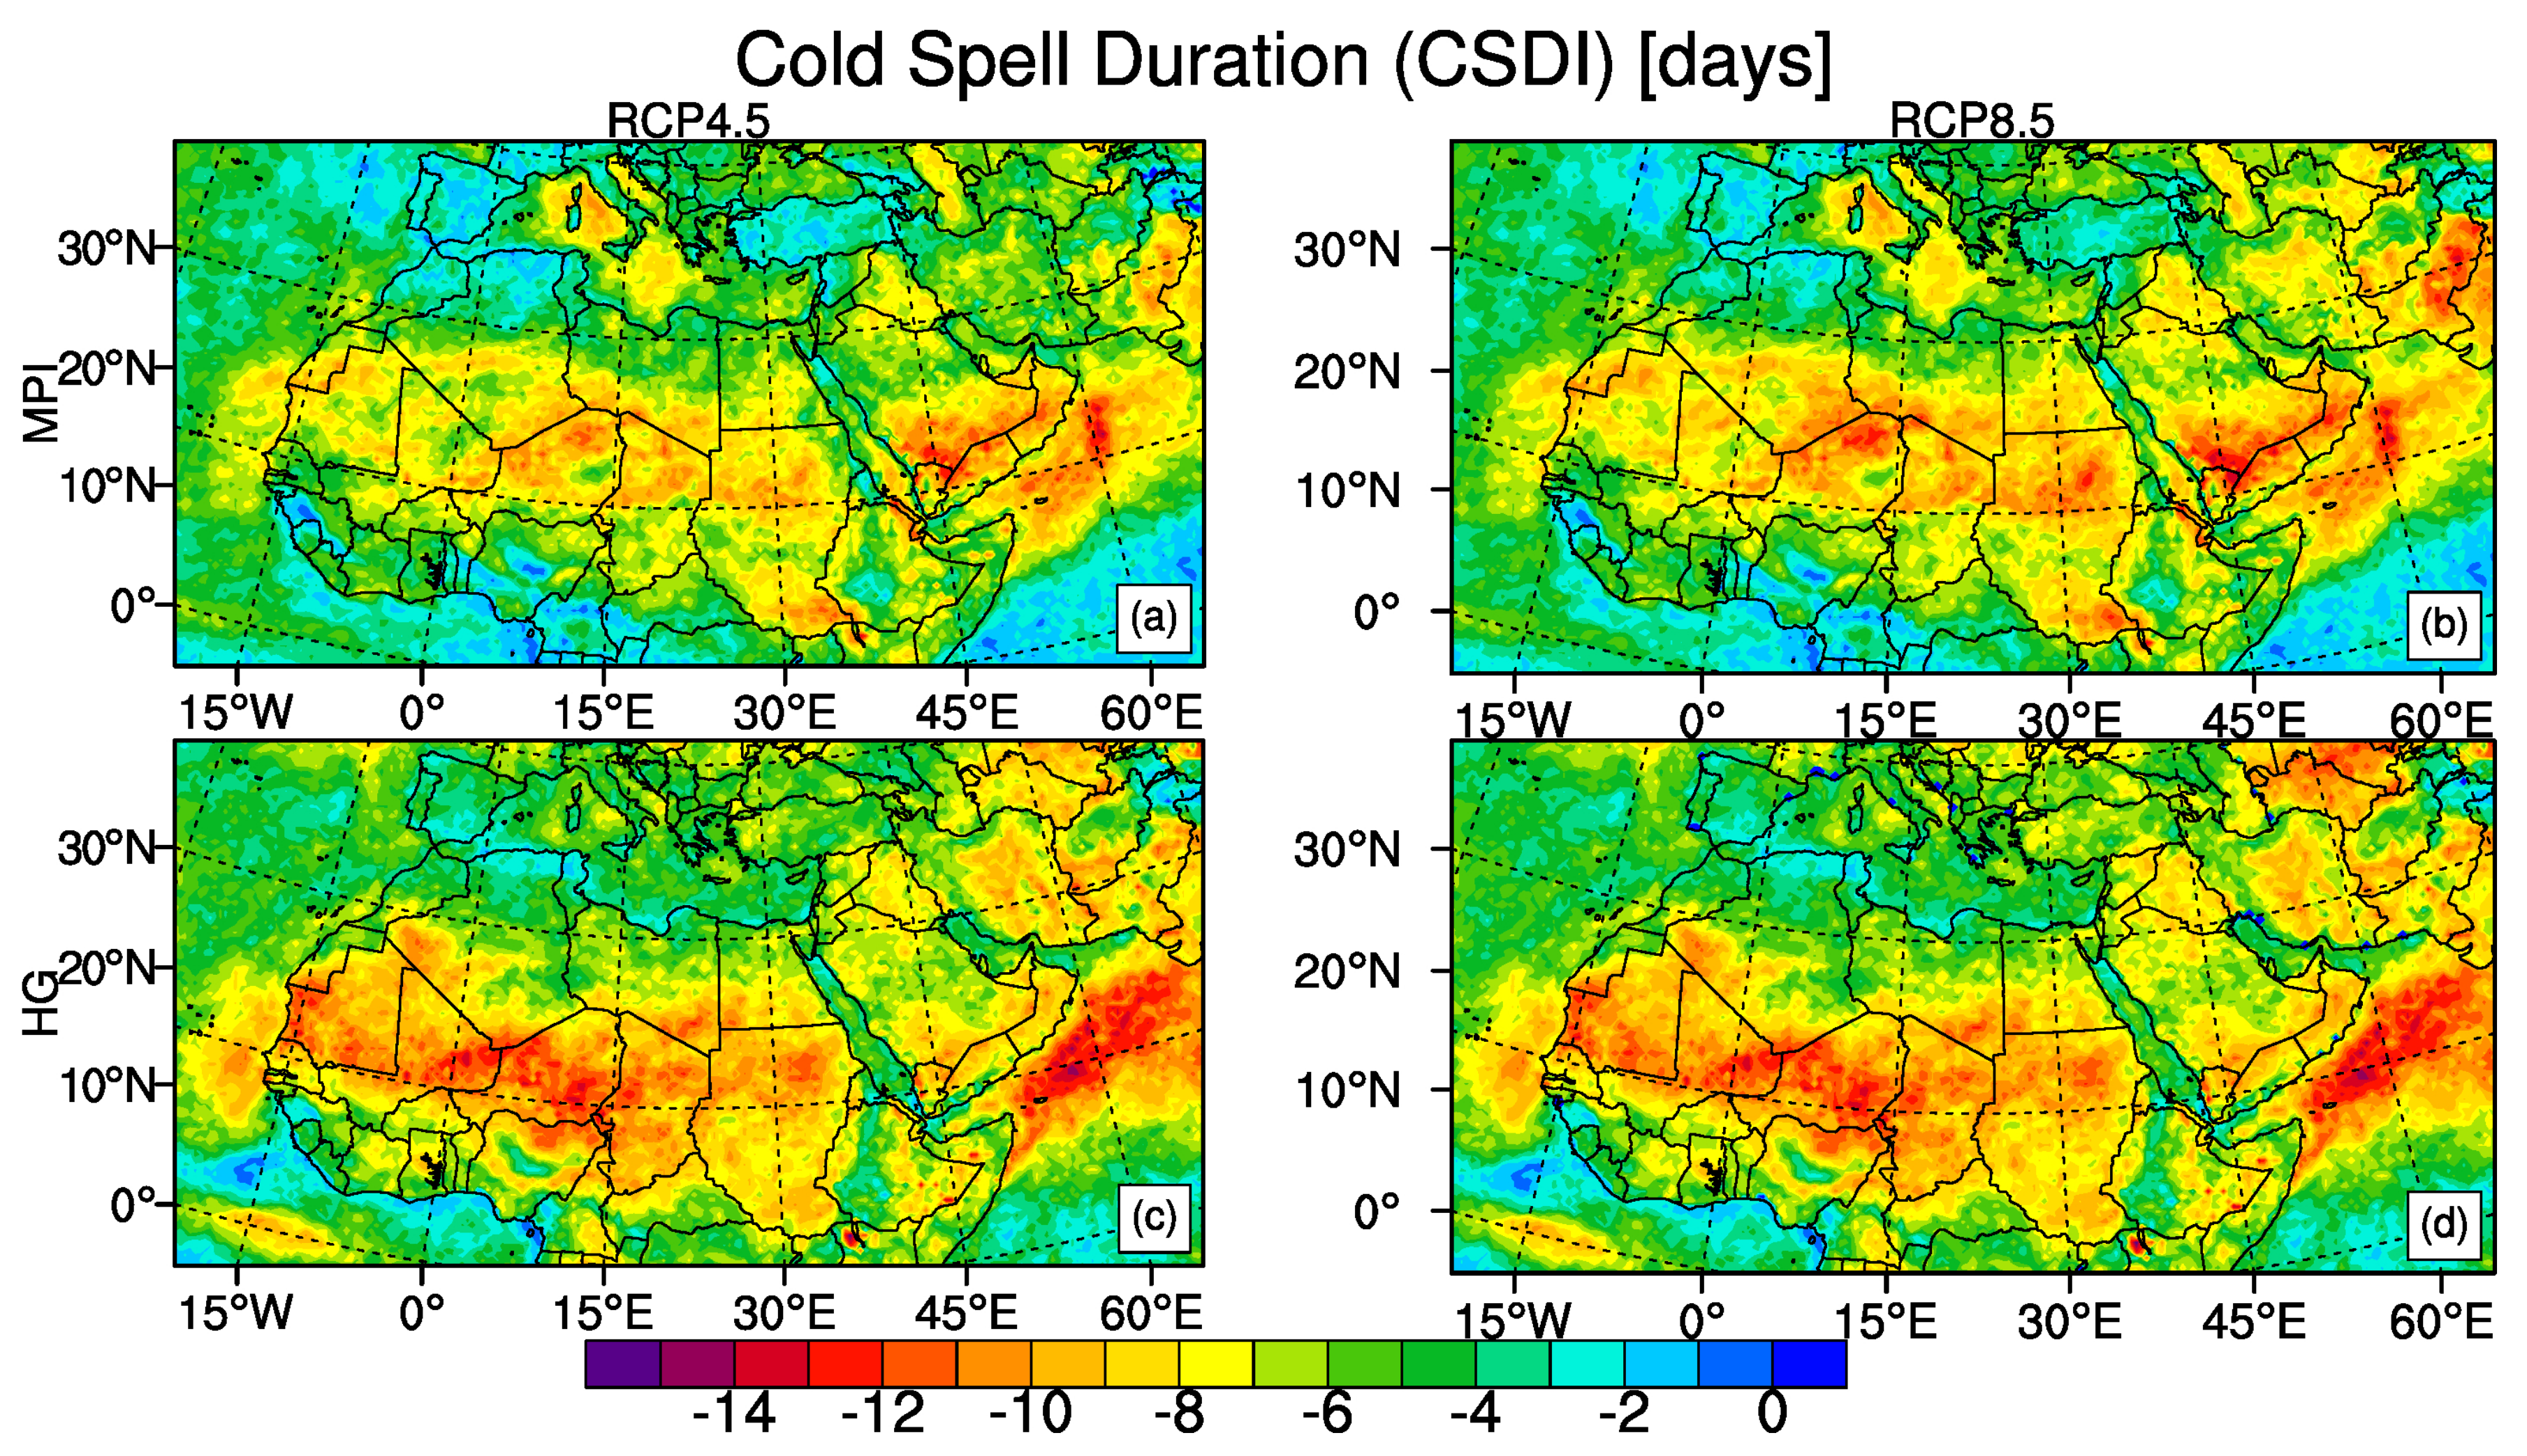
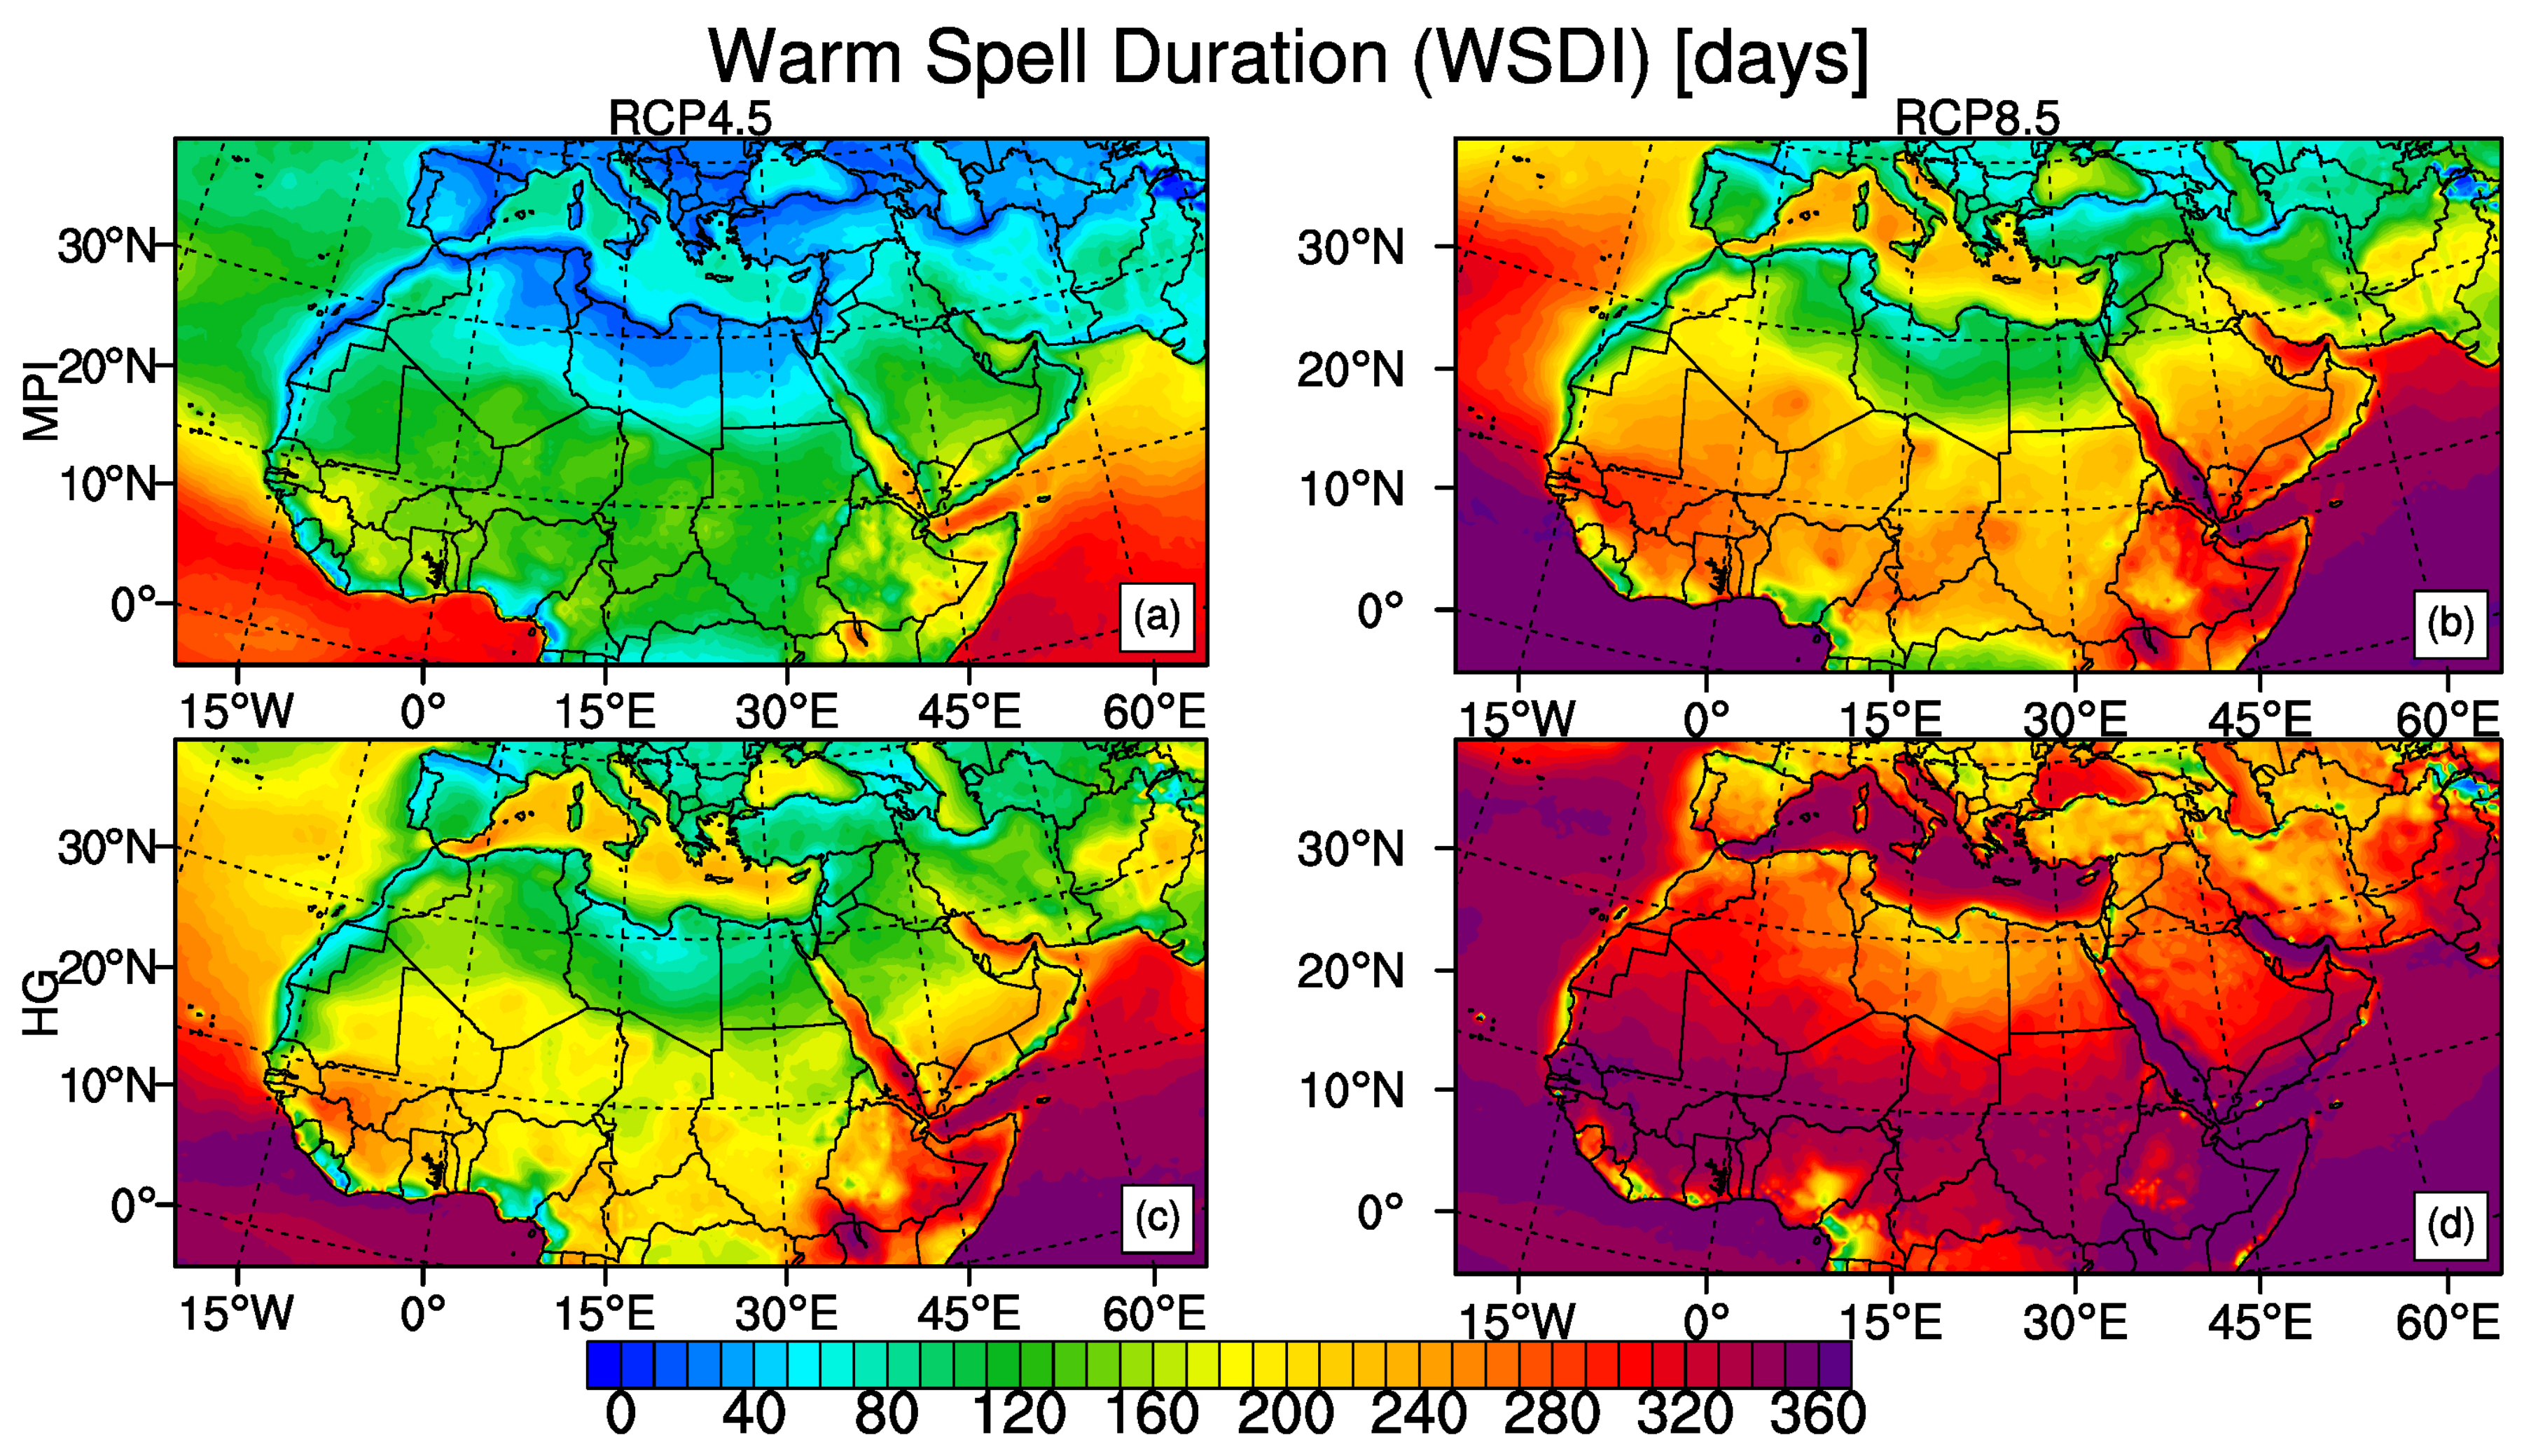
3.1.2. Duration Indices

In accordance with the temperature changes at the end of the 21st century with respect to the reference period of 1971–2000, Figure 5 shows a decrease in CSDI whereas Figure 6 shows an increase in WSDI. The strongest decrease in CSDI is in central part of the region between the equator and the latitude 20 N with the reductions of 6 days and more. HadGEM2-ES model shows similar outputs under both scenarios while there is a more pronounced difference between the MPI-ESM-MR results of RCP4.5 and RCP8.5. The strongest increases in WSDI are in the tropical regions which is related to the small change in mean temperature compared to the low short-term temperature variability since WSDI and CSDI are found to be sensitive to the climatological temperature variability of the respective region [2,83]. HadGEM2-ES model under RCP8.5 projects the most drastic results of WSDI exceeding 200 days for the whole region. MPI-ESM-MR model outputs under RCP8.5 and HadGEM2-ES model outputs under RCP4.5 are comparable for regions such as northern part of the region, the Mediterranean, horn of Africa. Sahara, East Africa and West Africa sub-regions are expected to have more than 300 days with a greater maximum temperature than 90th percentile of reference period according to the result of HadGEM2-ES model under RCP8.5 (Table 3). MPI-ESM-MR model under RCP8.5 also project more than 260 days increase in WSDI over East Africa and West Africa sub-regions.

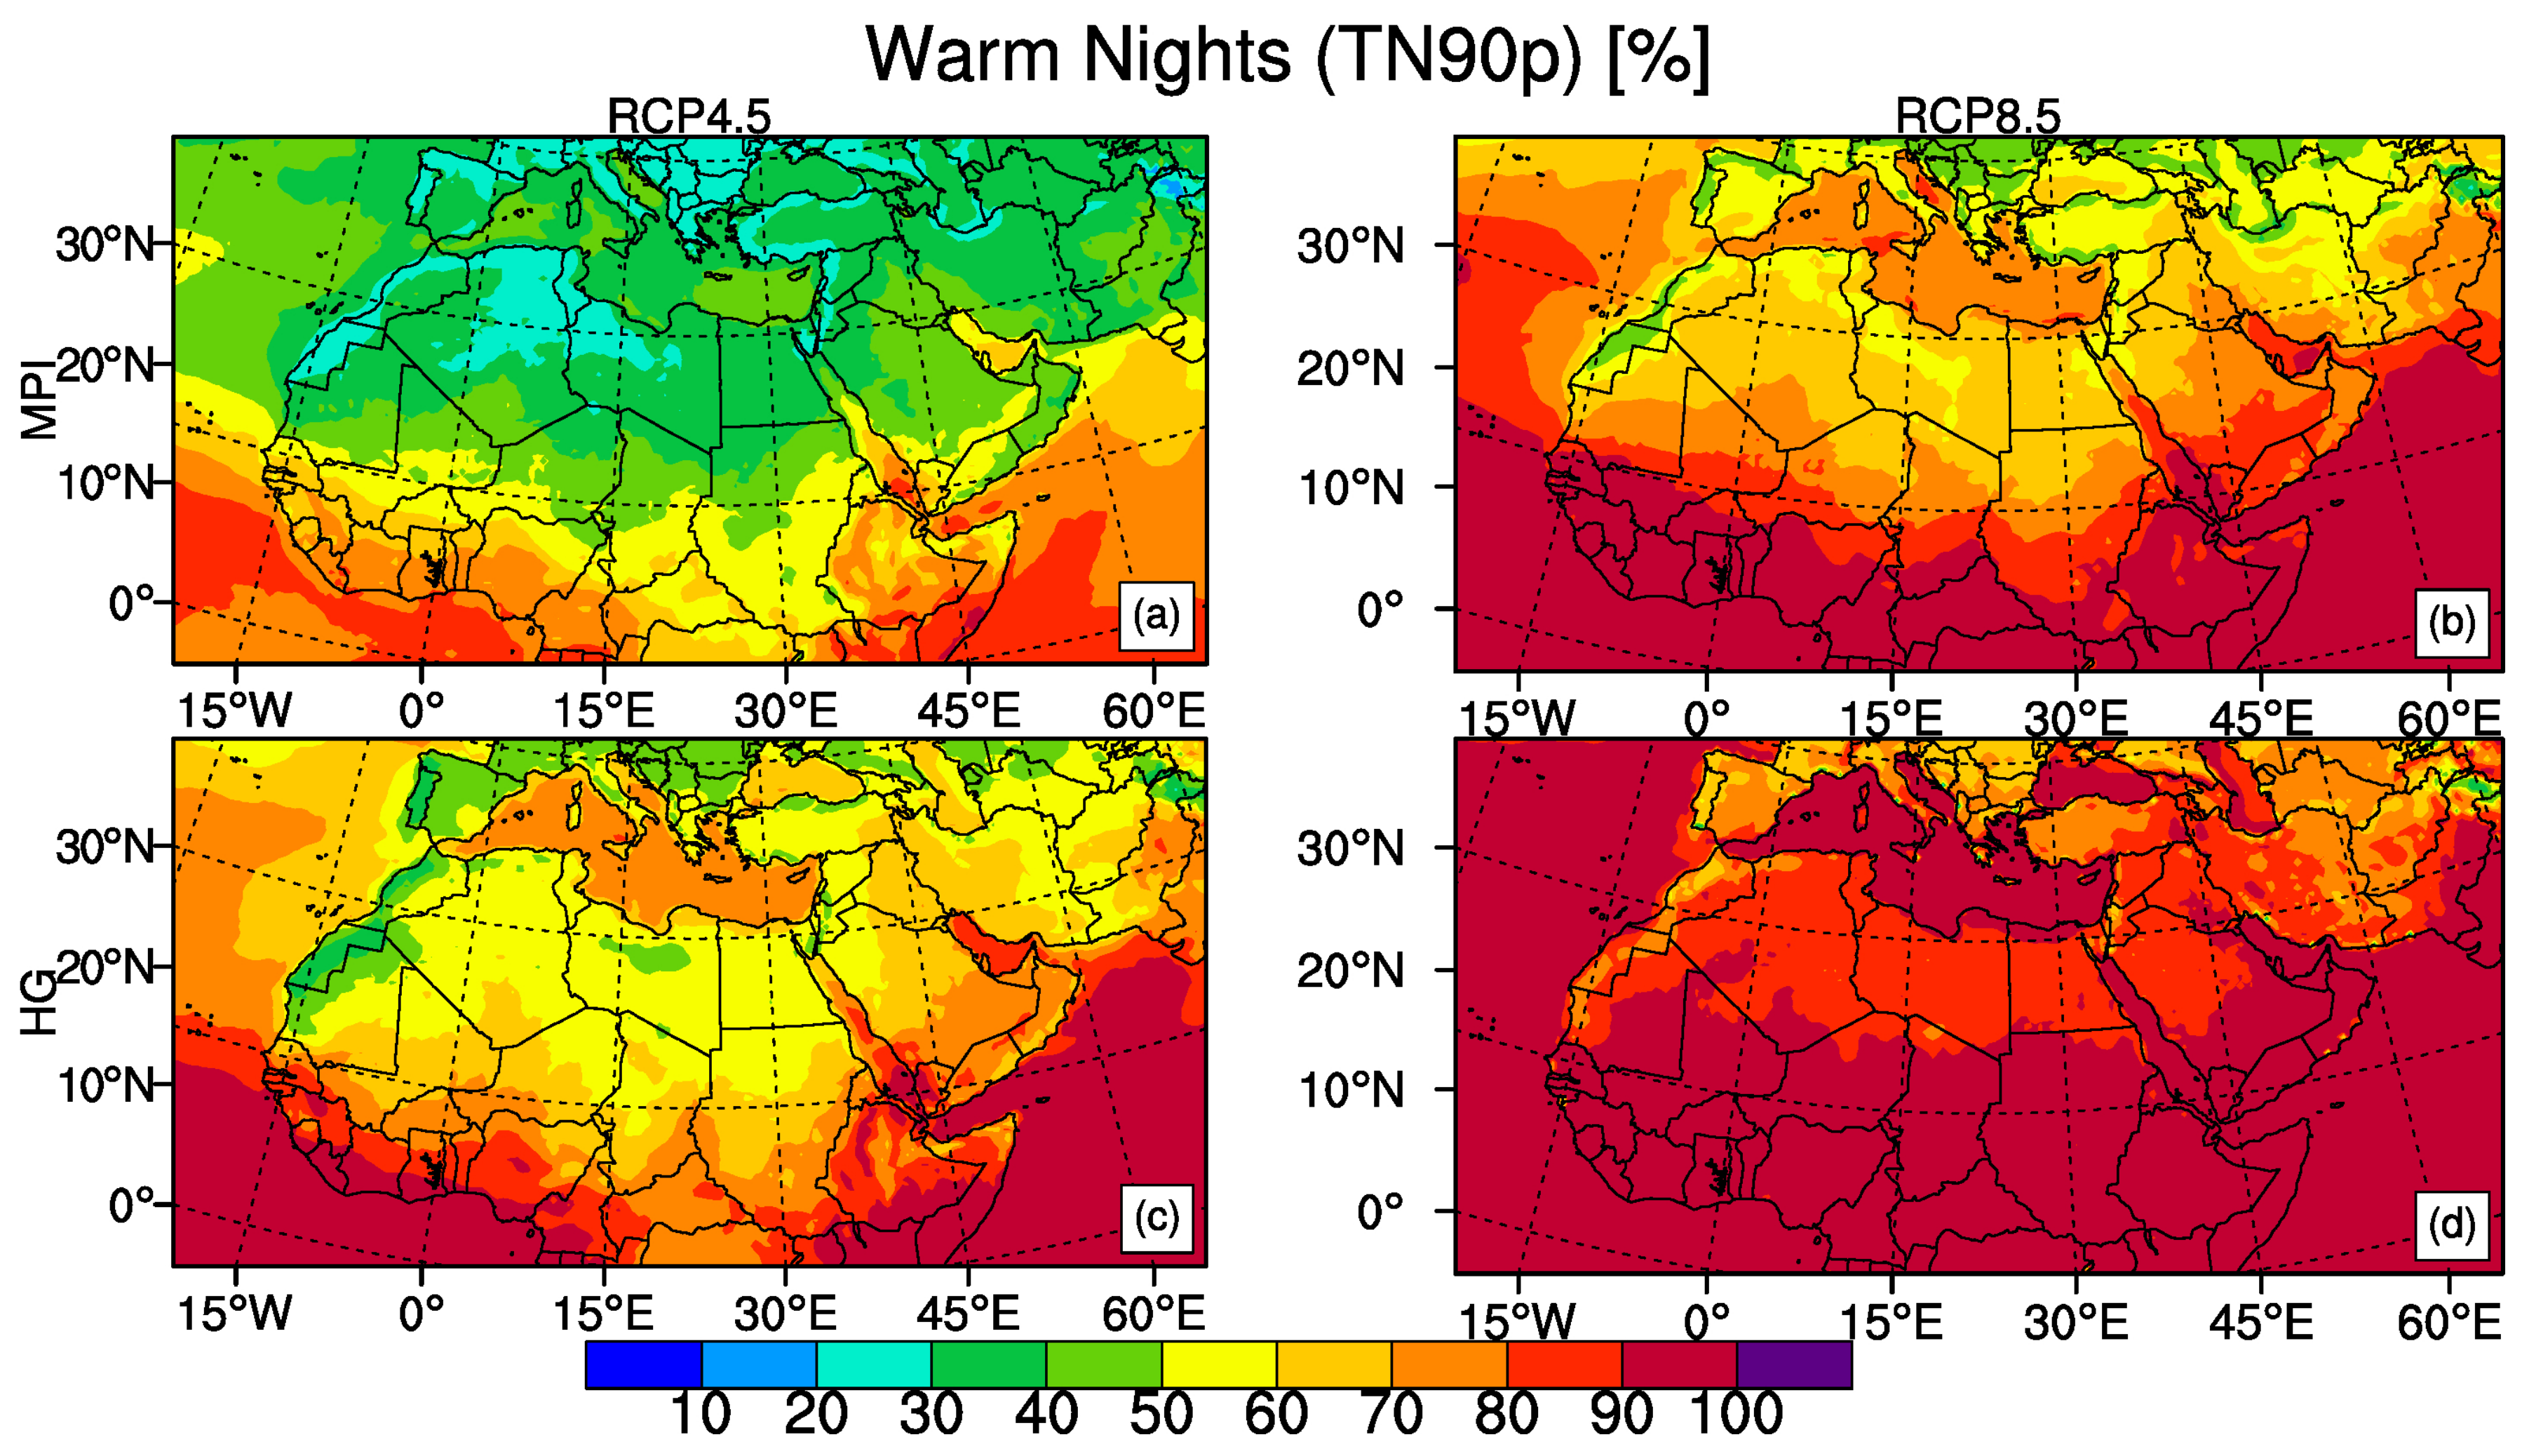
3.1.3. Percentile Indices

Percentile indices, by definition, represent the exceedance rates (in %) relative to the reference period of this study 1971–2000, during which their mean is approximately 10%, which serves as the baseline for projected future changes. Therefore, as in the work of Sillmann et al. [2], the future changes of percentile indices are given in absolute values, not in differences relative to the reference period as in the case of aforementioned temperature indices.
Figure 7 shows the projected changes in the annual frequency of TN10p in absolute terms for the period of 2071–2100 with respect to the 1971–2000 reference period. MPI-ESM-MR model under RCP4.5 shows that TN10p decreases from about 10% in 1971–2000 to somewhere between 4% to 2.5% for northern part of MENA domain and to somewhere between 1.5% to 0% for southern part. MPI-ESM-MR model outputs under RCP8.5 and HadGEM2-ES model outputs under RCP4.5 show similar patterns and these results are in between MPI-ESM-MR with RCP4.5 and HadGEM2-ES with RCP8.5 in terms of stronger reduction of TN10p. HadGEM2-ES projection under RCP8.5 scenario shows the most severe results with almost a uniform percentage in cold nights with the values between 1% to 0% which means there will be virtually no cold nights in MENA as defined for the reference period of 1971–2000. Values close to 0% for cold nights will be observed starting from around 2020 over Sahara, East Africa and West Africa and around 2060 over Mediterranean sub-regions (Supplementary Figures S1–S4). Our results support previous studies [49,84], which found that the European and African regions show a decrease of cold nights (Tmin ≤ 5 C) for the far future period and a greater decrease is projected with RCP8.5 than with RCP4.5.
TN90p on the other hand, increase throughout the region with both models and under both scenarios as shown in Figure 8. MPI-ESM-MR projection with RCP4.5 give the most optimistic result for our study with an increase of about 20% to 50% for Northern part of MENA and 50% to 90% for Southern part of MENA from about 10% in 1971–2000. HadGEM2-ES projection with RCP8.5 scenario, again gives the most severe results with TN90p increasing from 10% in the reference period of 1971–2000 to about 60% for northern part of the region, 70–80% for Central and more than 90% for southern regions of MENA. The smallest changes in both TN10p and TN90p are projected to be in northern parts of MENA. Mediterranean has the least increase in warm nights compared to other sub-regions varying from 33% to 84% depending on the model and scenario. Nevertheless, 33% increase for optimistic scenario indicates that the minimum temperature will be above 90th percentile of reference period at most of the summer nights (Table 3).
Spatial patterns of change are different from those for the absolute index TNn and the largest decreases of cold nights together with the largest increases of warm nights are projected to be in tropical regions. That is due to the small day-to-day temperature variability of the tropical regions which means changes in mean temperature are related with comparatively larger changes of exceedance rates below the 10th and above the 90th percentile [2].

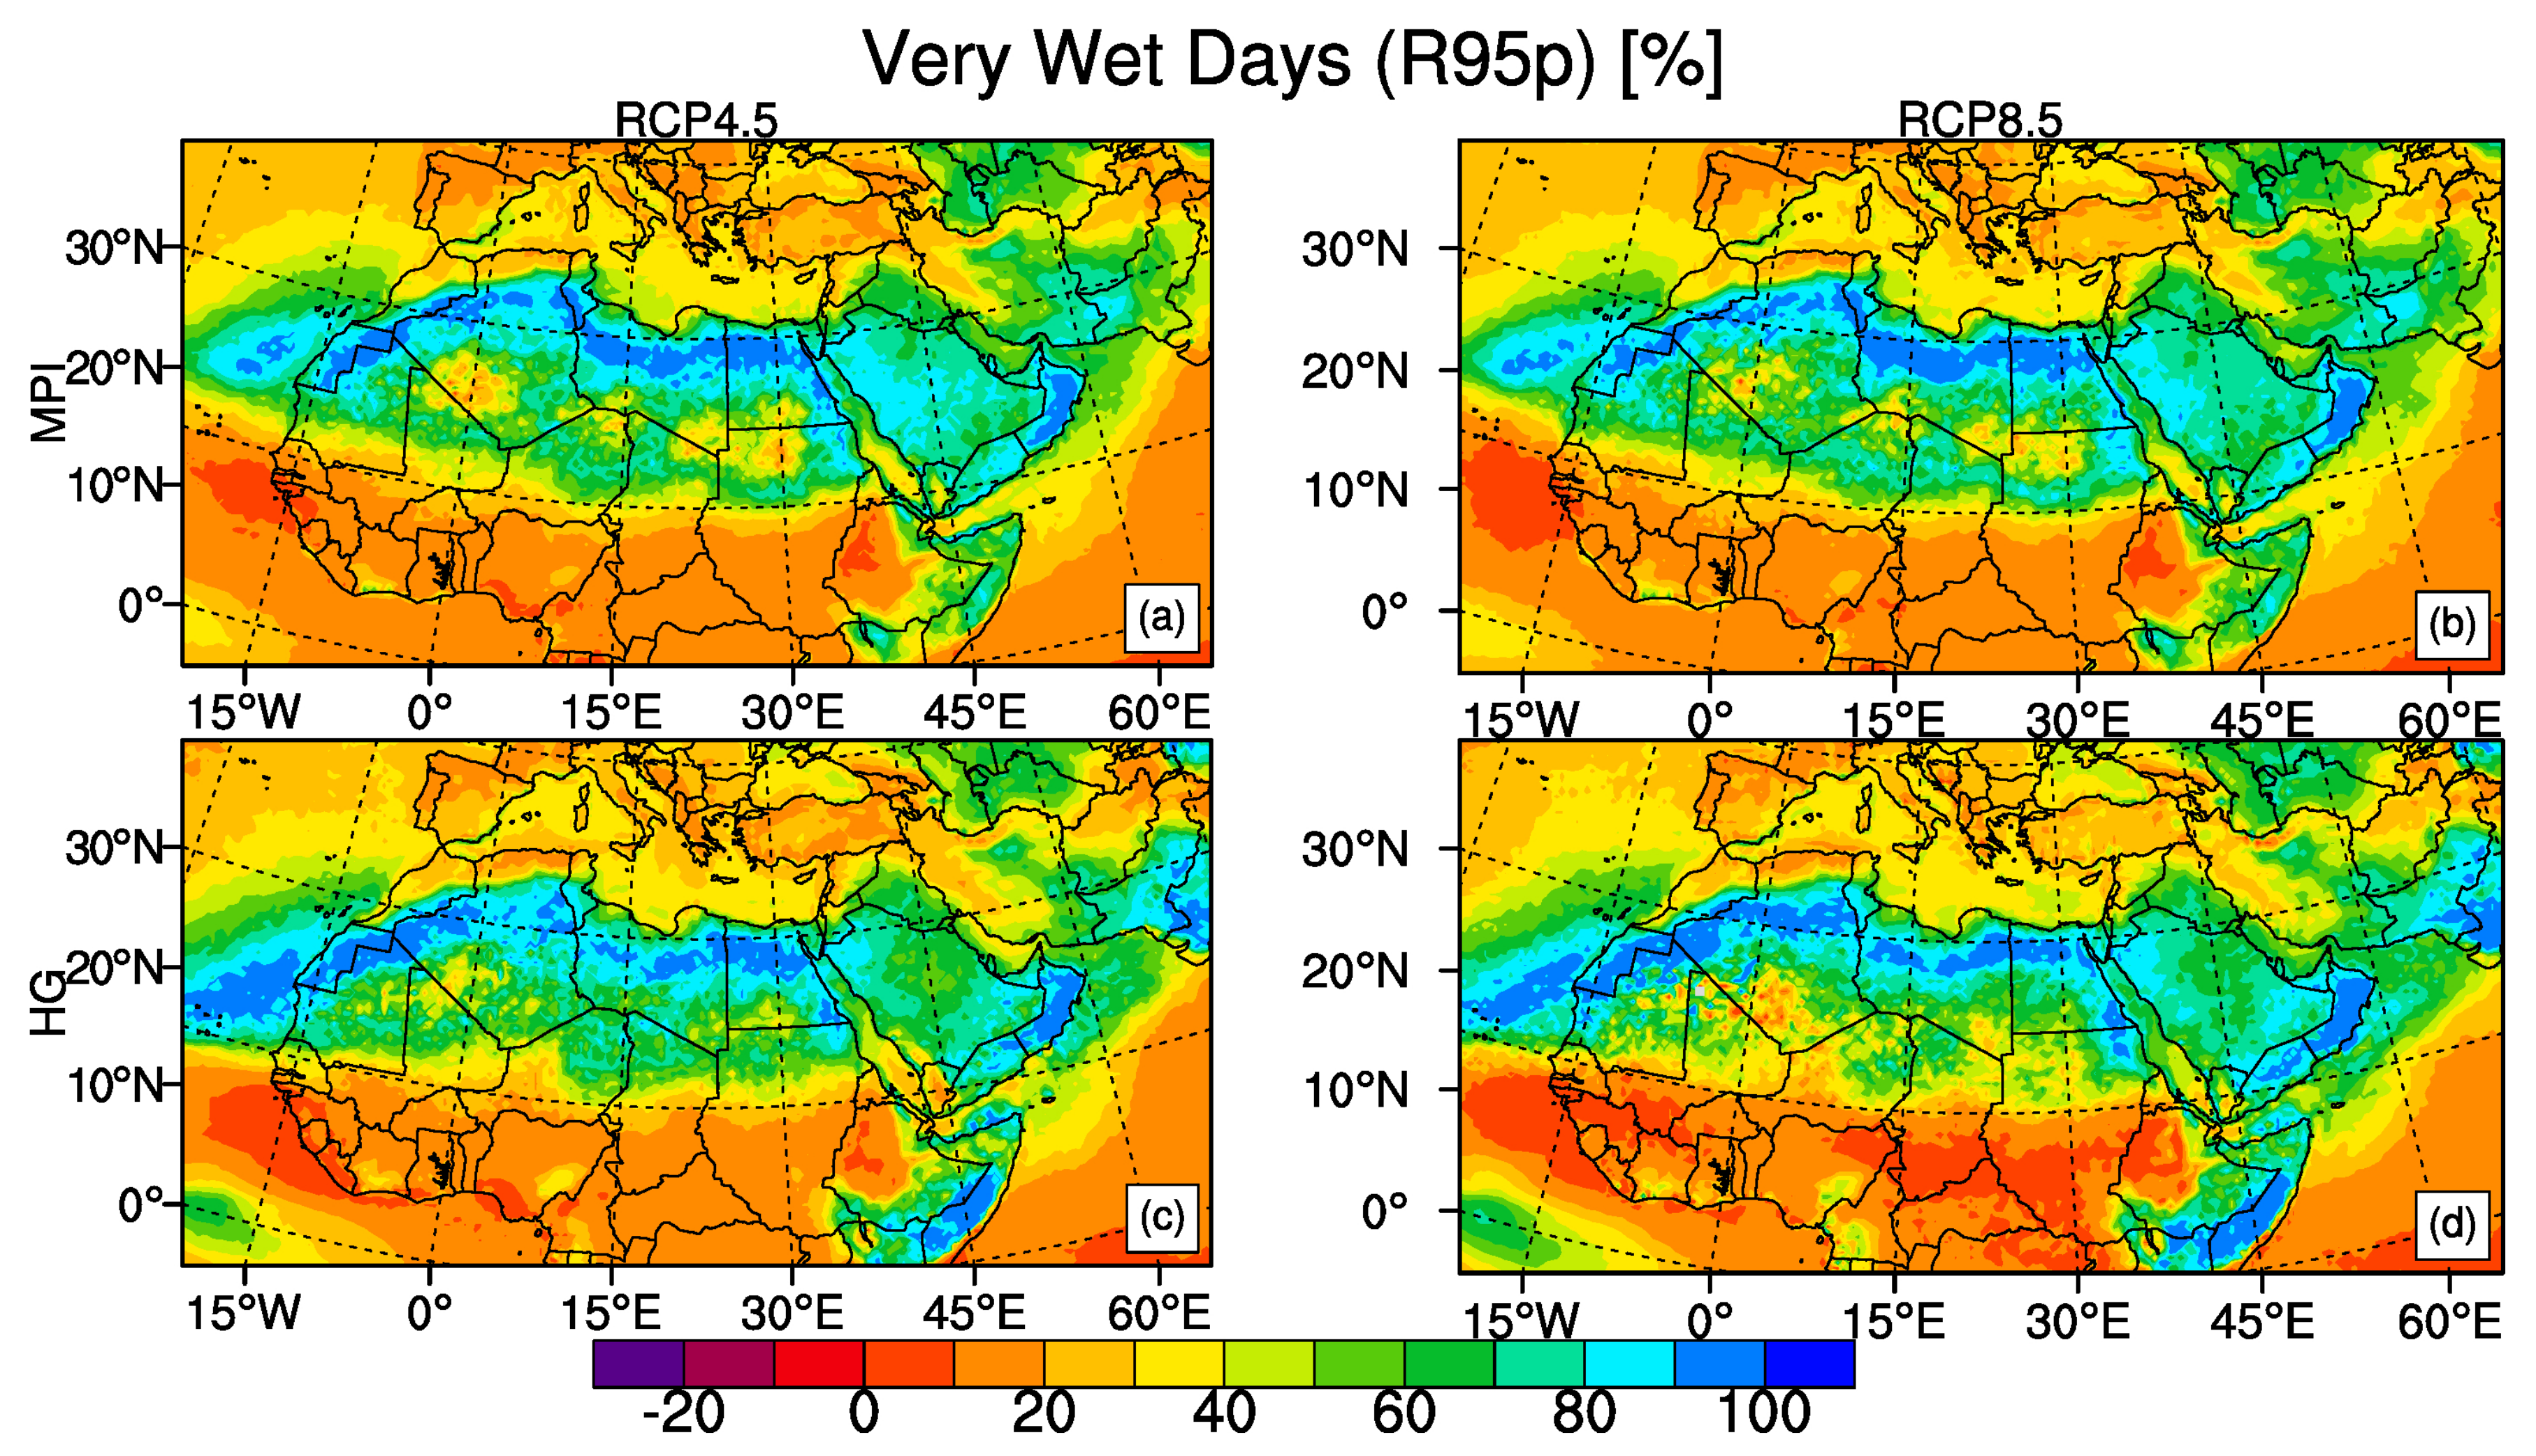
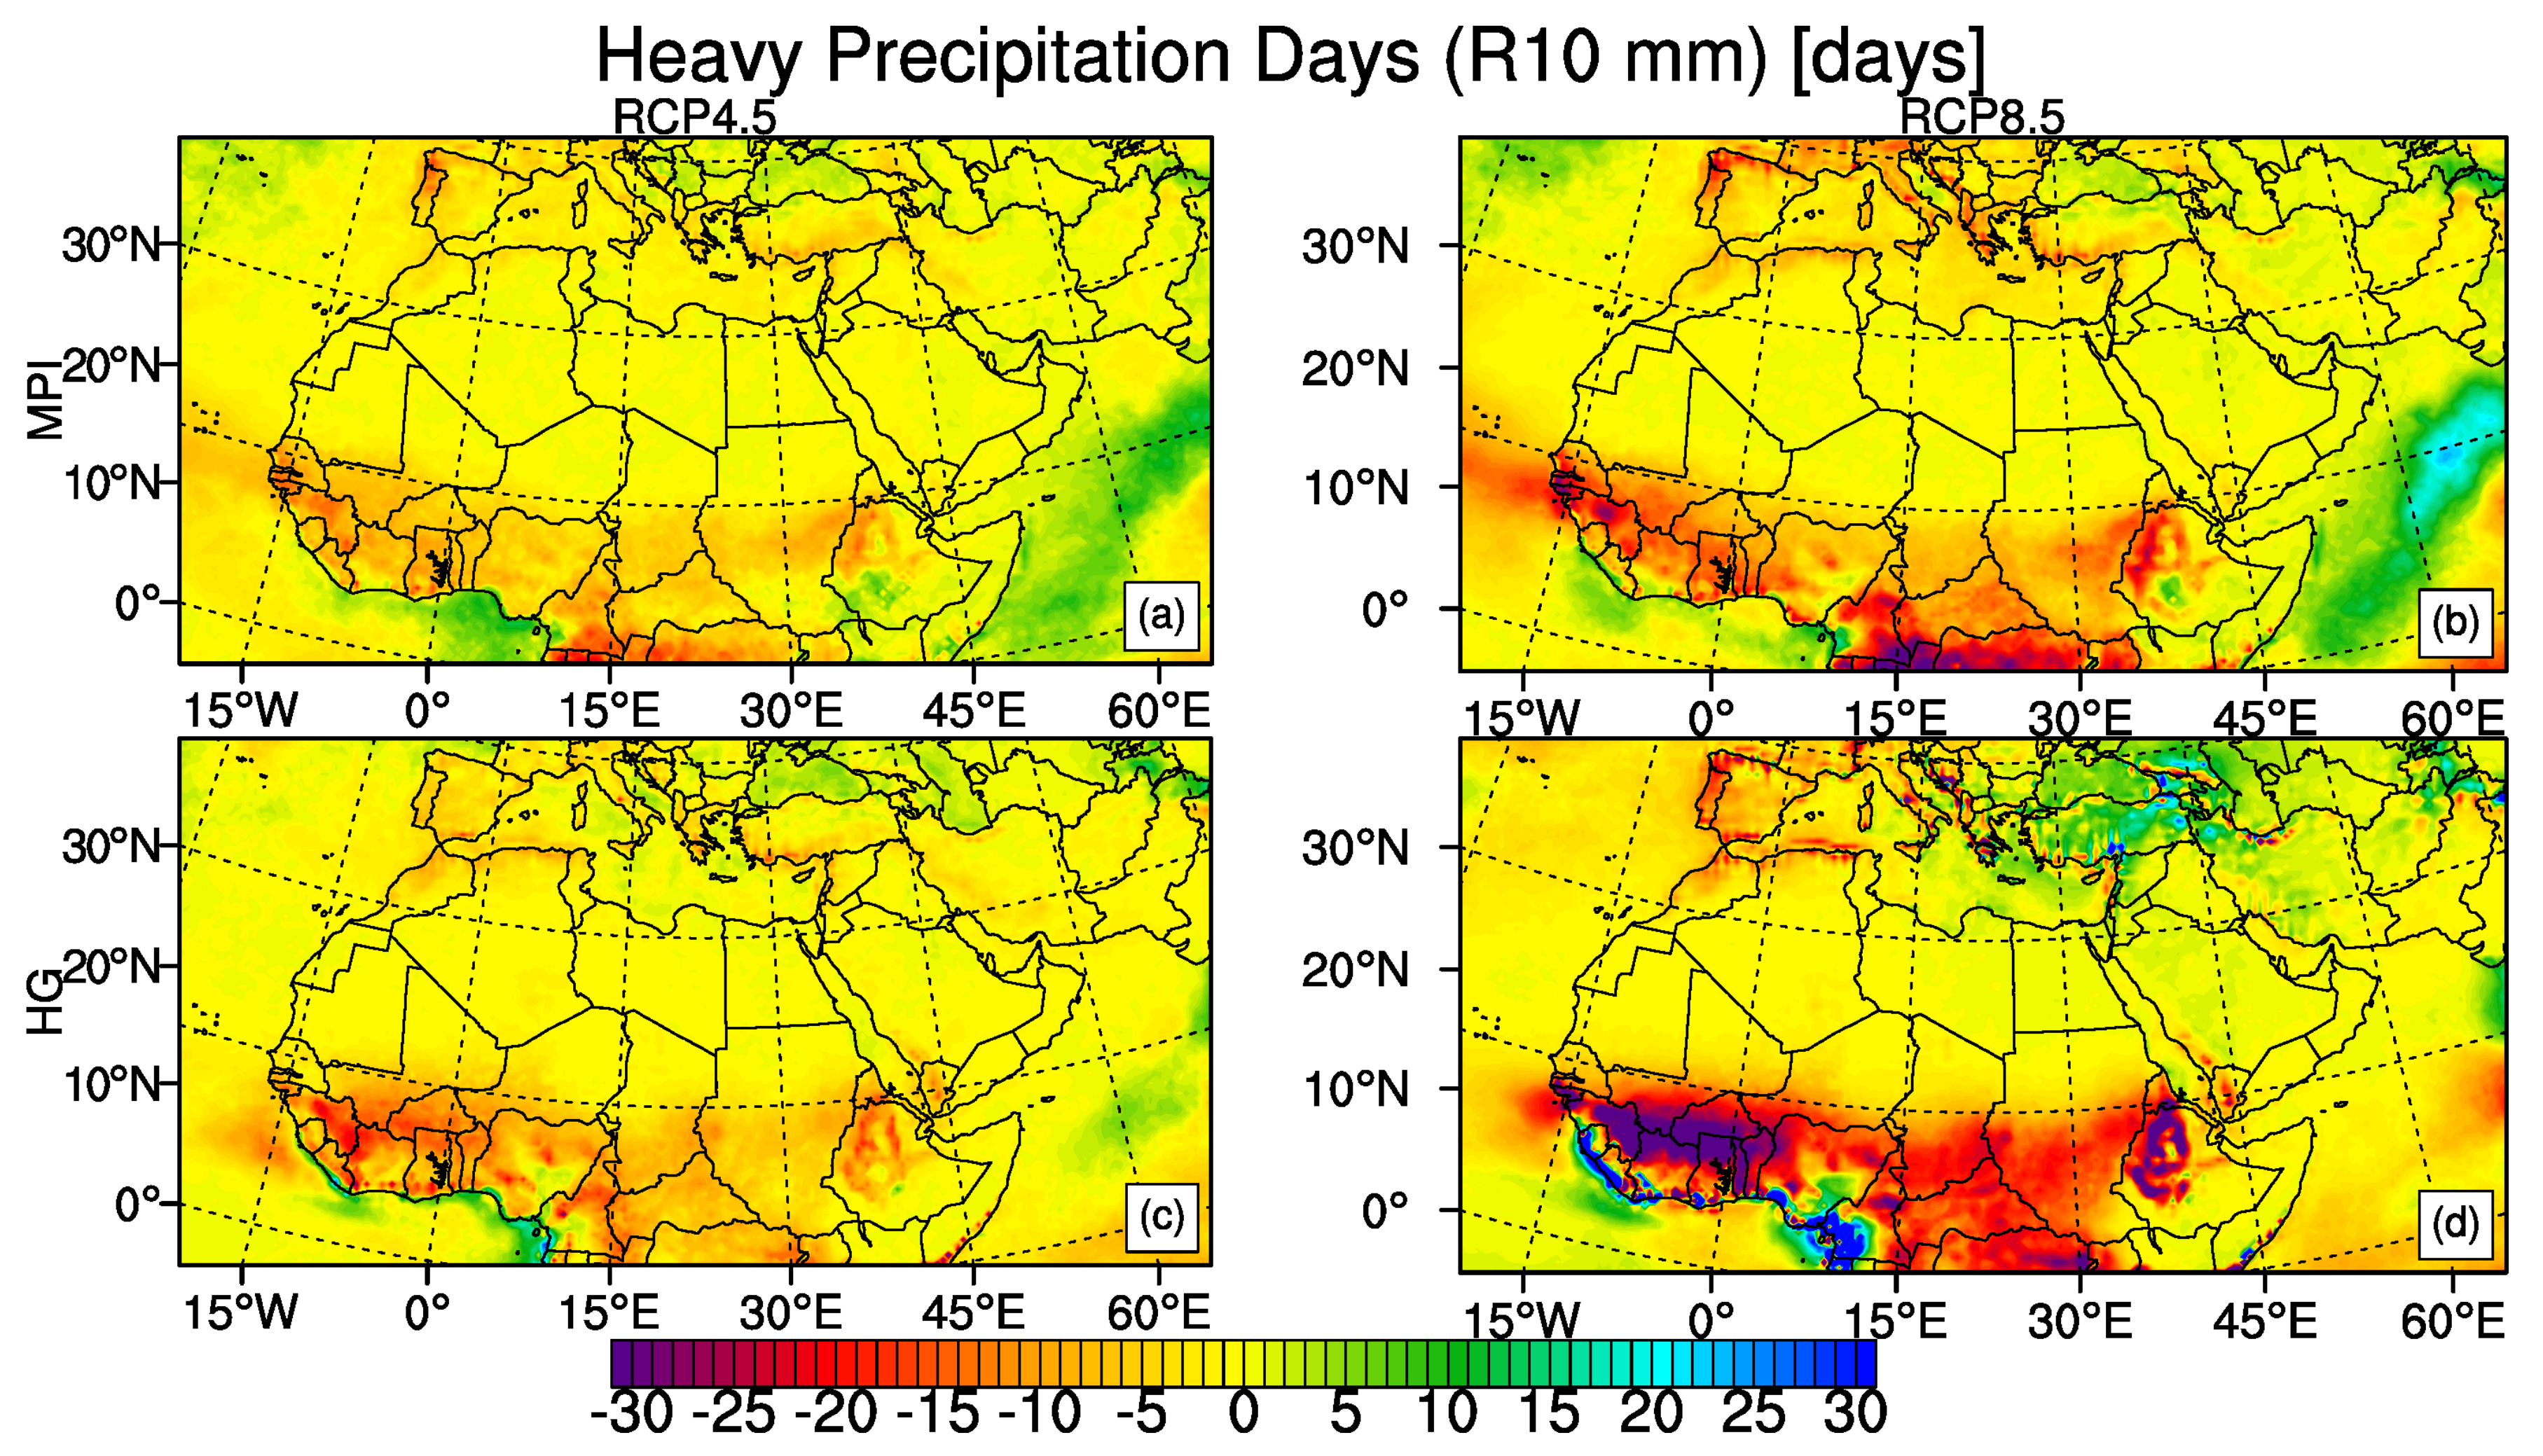
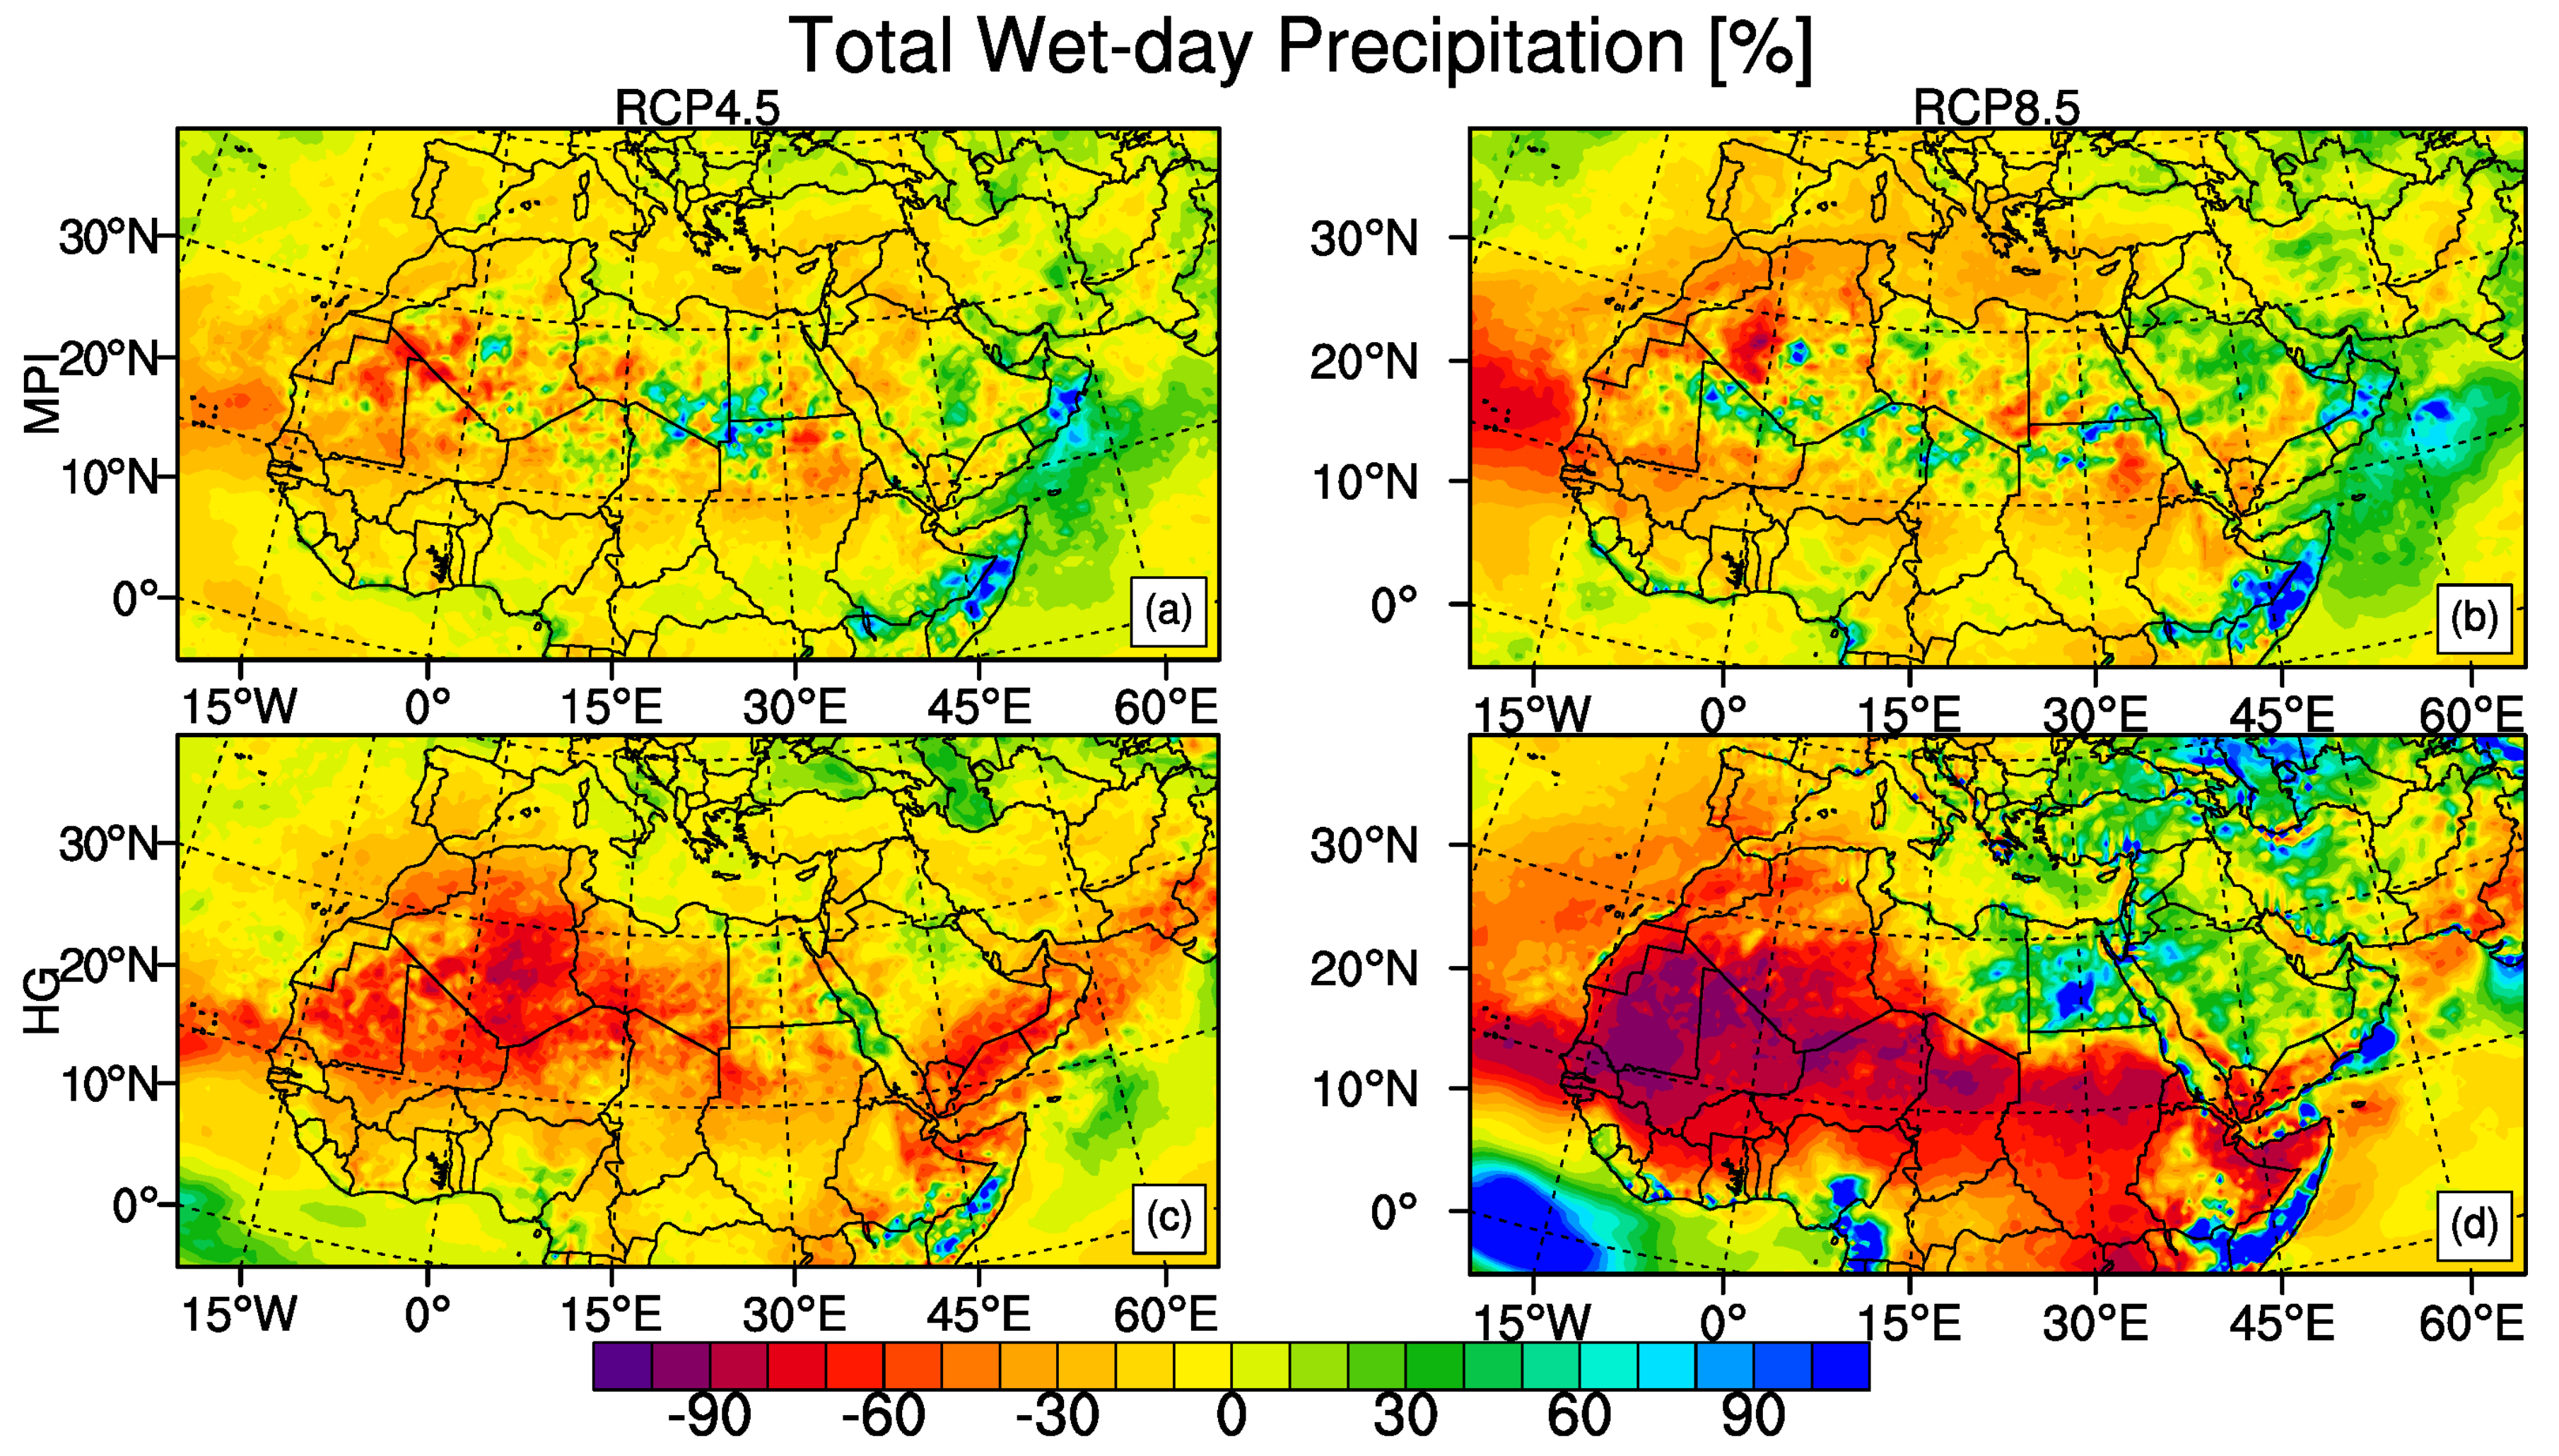
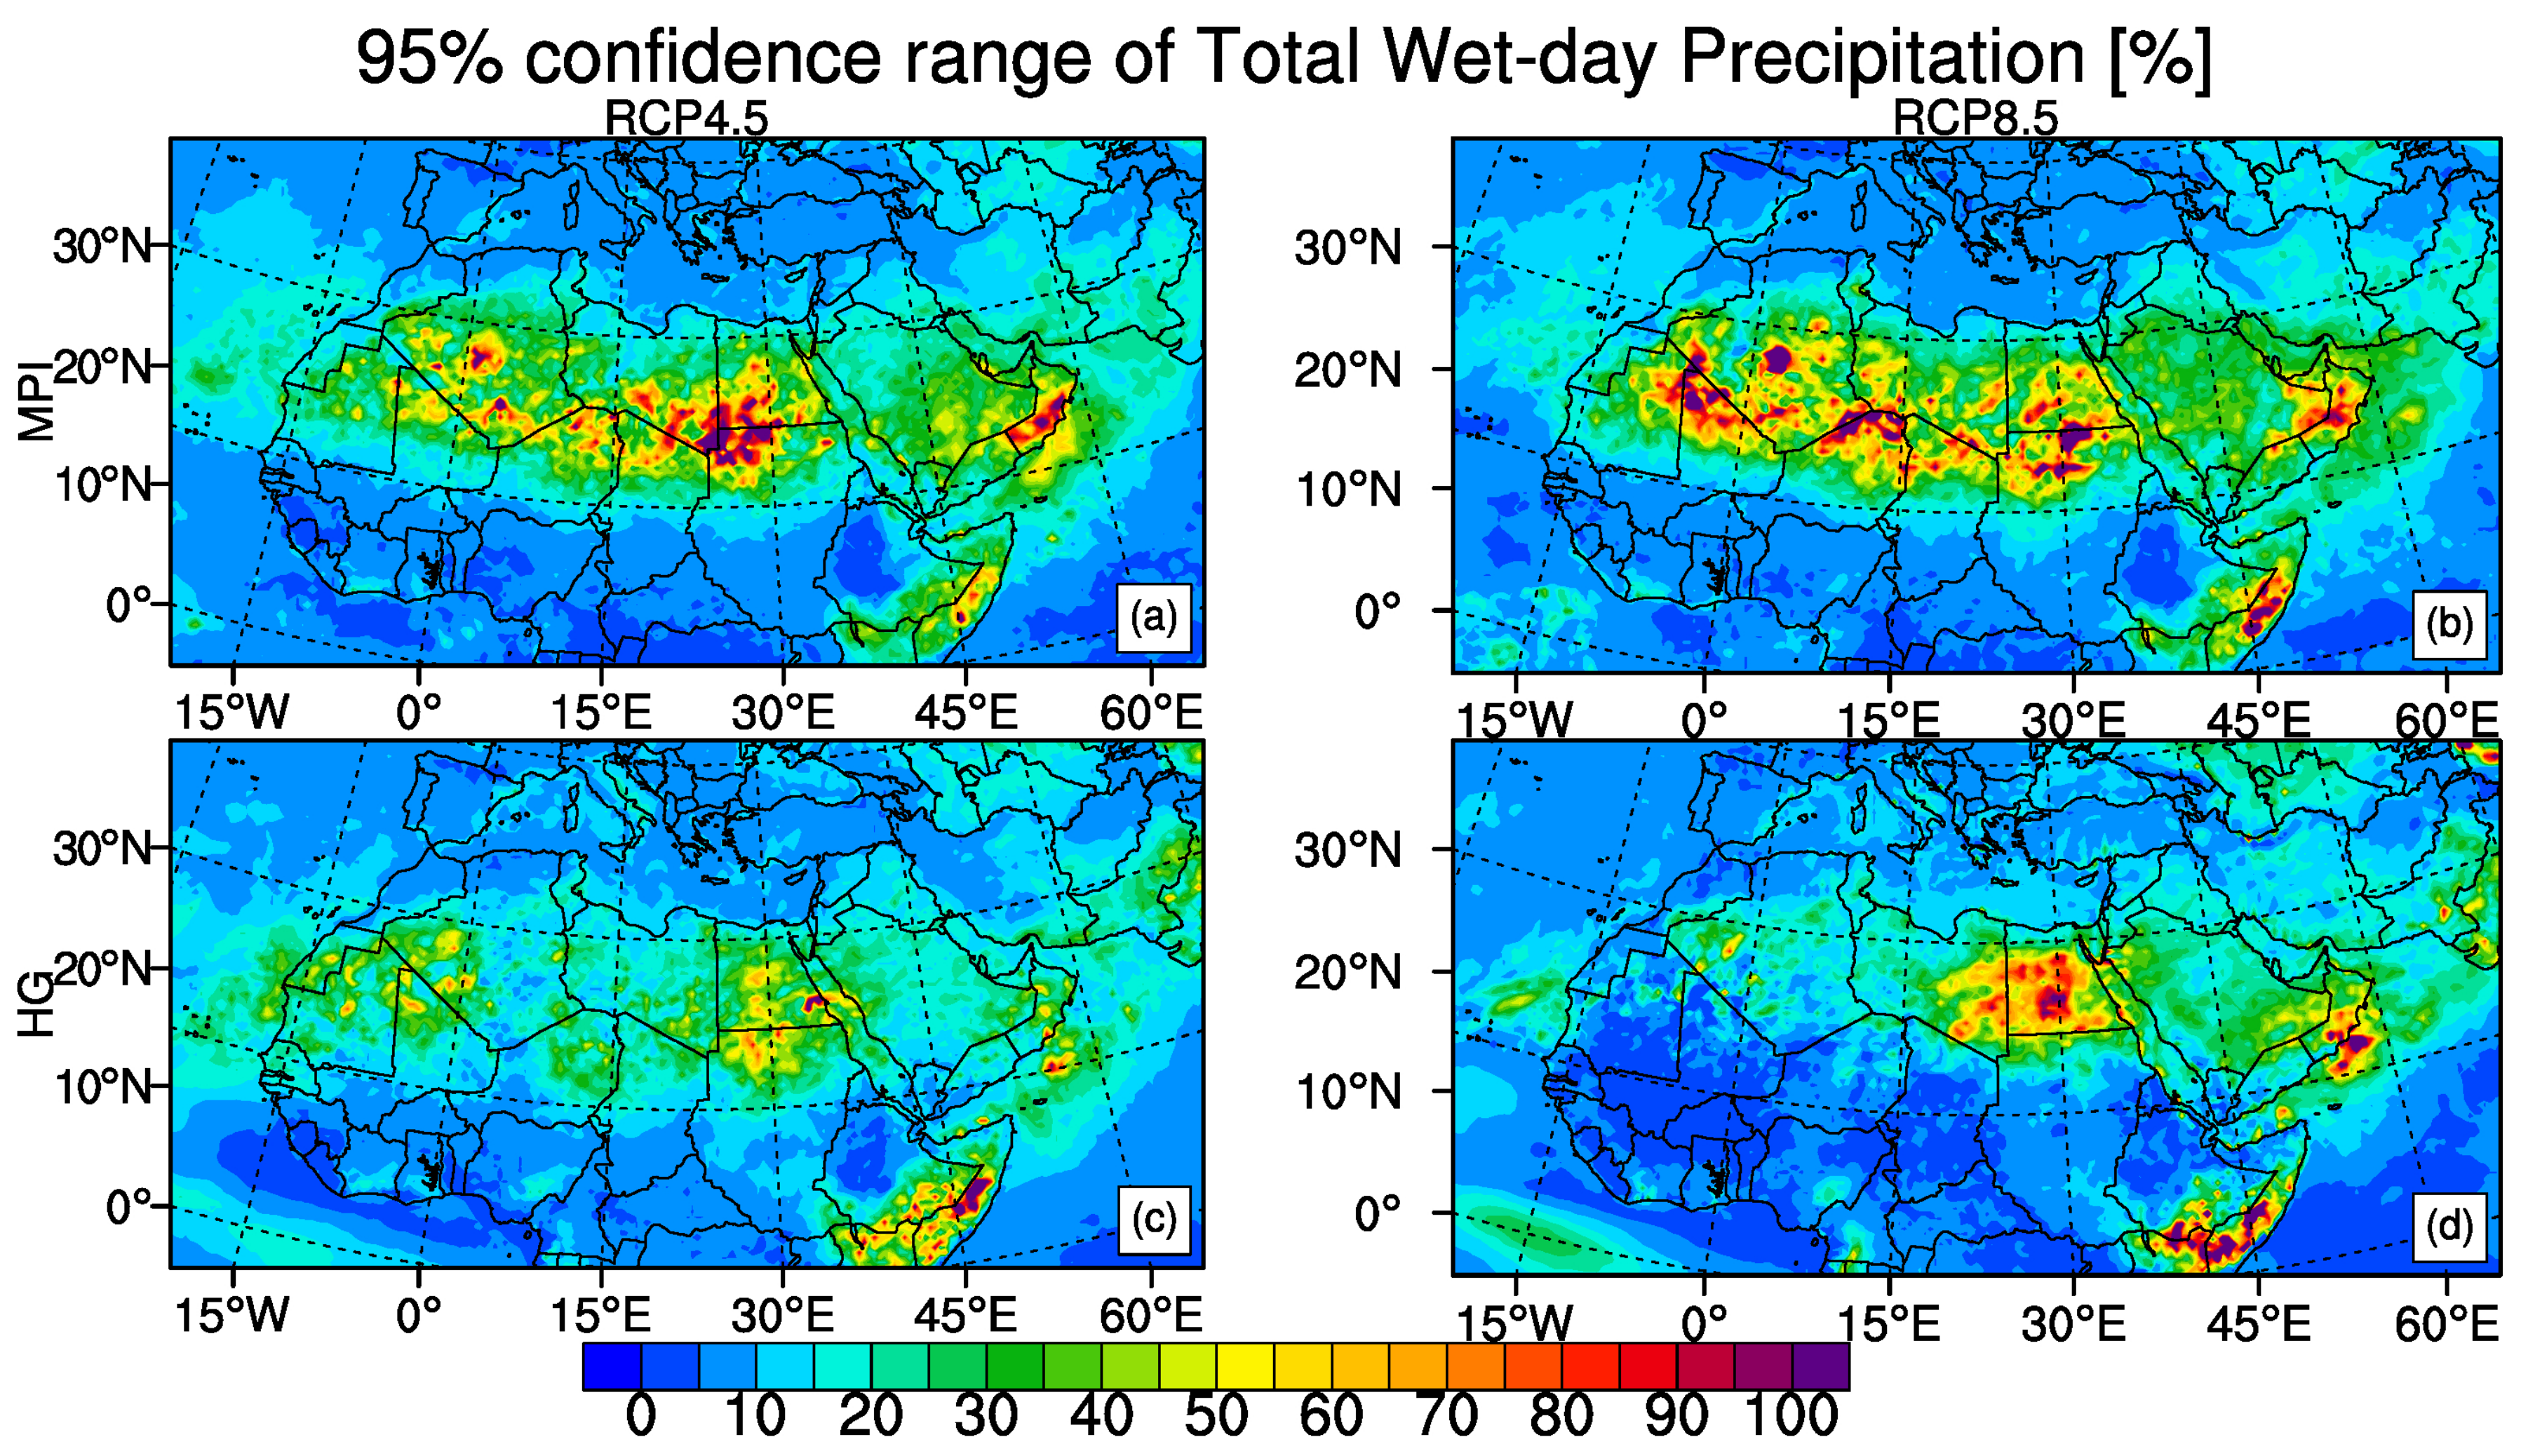
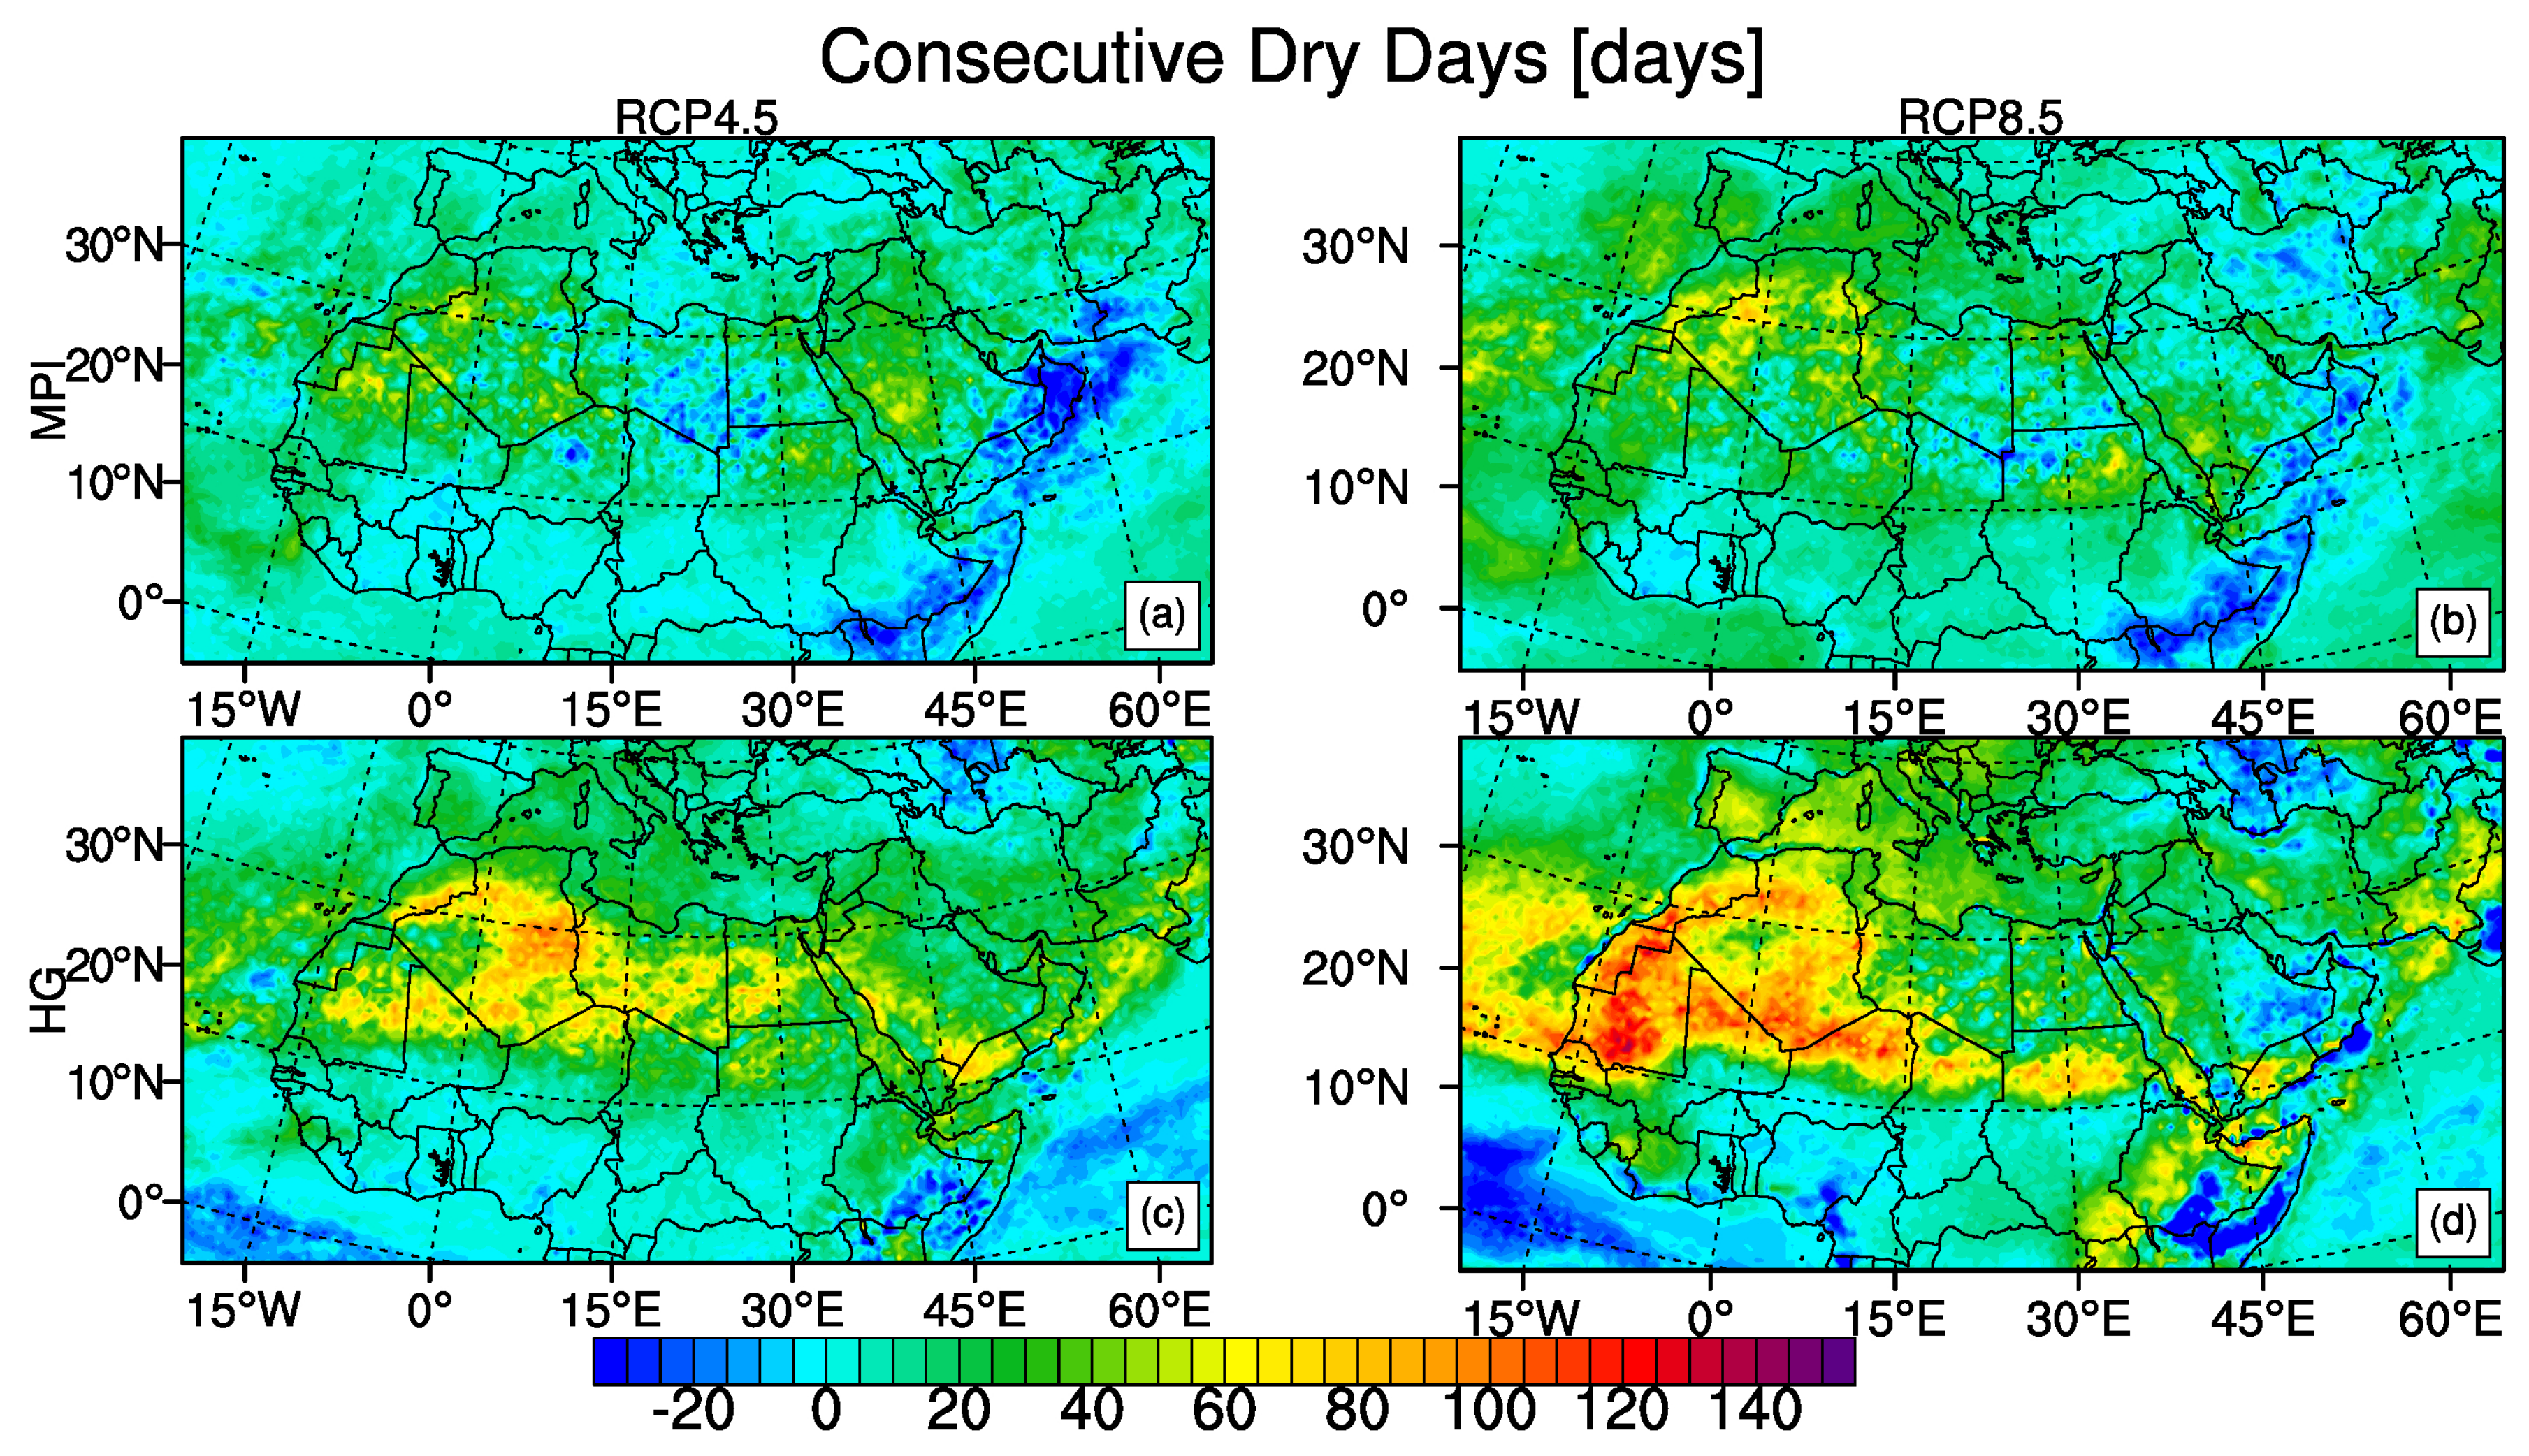
3.2. Precipitation Indices

Figure 9 shows the temporally averaged PRCPTOT for 2071–2100 period as percentage differences from the reference period of 1971–2000. The 95-percentile confidence ranges of change signal for the period of 2071–2100 with respect to period of 1971–2000 are also given in Figure 10. For both model projections under both scenarios PRCPTOT has a decreasing trend in MENA for the end of the century except only small parts (Table 4). The most nonuniform and greatest change in PRCPTOT is seen with the HadGEM2-ES RCP8.5 projection which shows PRCPTOT to decrease more than 60% compared to the reference period for the Central, Southern and Eastern parts of MENA region and to increase significantly, more than 60%, for different regions in the North- Eastern MENA such as the region around Caspian Sea, Arabian Sea coast of Pakistan and Oman and also the equatorial coasts. Other three projections show PRCPTOT in Mediterranean to decrease around 10% and South Africa between 10–20%. The 95 percentile confidence range values for precipitation change between 0 and 10% almost in all parts of the domain which indicates robust change in precipitation indices except for the Sahara especially for MPI-ESM-MR results (Figure 10). The small variations in precipitation values can be resulted in high percentage values since precipitation amount itself is very low over Sahara. Results over this region can be considered insignificant. The projections of the percentile-based precipitation threshold index R95p which describes the accumulated annual precipitation amount on days when daily precipitation amount exceeds the 95th percentile threshold of precipitation distribution of the 1971–2000 base period are shown in Figure 11. For R95p, all four projections exhibit somewhat similar results and R95p is projected to increase in East and North Africa between 60–100%. MPI-ESM-MR results under both scenarios show a moderate increase of about 20 to 40% for most parts of MENA while HadGEM2-ES results under RCP8.5 scenario show 0 to 30% increase for southern MENA. Sub-regions have similar increase in R95p no matter which scenario or model while Sahara has the greatest increase where results have no significance (Table 4).
Figure 12 displays the projections of maximum CDD. As can be expected, regional decreases in PRCPTOT usually synchronize with corresponding increases in CDD, which is the case in our study. The most significant change of CDD from the reference period is projected with the HadGEM2-ES under RCP8.5 scenario, where most of North Africa and the Mediterranean show consecutive dry days lasting longer than 25 days. Spatial averages over the sub-regions show an increase of 29 to 42 days in consecutive dry days over Sahara and Mediterranean respectively for RCP8.5 scenario with HadGEM2-ES CGCM (Table 4). The regions that are projected to have significant increase in PRCPTOT such as the region around Caspian Sea, Arabian Sea coast of Pakistan and Oman also the equatorial coasts, exhibit a decrease in CDD. These regions are projected to become wetter in the future. Due to the high unpredictability in the lengths of long dry spells spanning years, the large changes of CDD both increasing or decreasing in the Sahara region are considered to be not significant [2]. Figure 13 shows R10mm which counts the days when the threshold of 10 mm precipitation is exceeded. HadGEM2-ES results under RCP8.5 for CDD (Figure 12d) and R10mm (Figure 13d) exhibit an inverse relation between the two indices. Most of North Africa and the Mediterranean region showing zero or less heavy precipitation days with respect to the reference period of 1971–2000, and these regions having consecutive dry days lasting longer than 15 days in all four of the projections means that there will be an intensification of meteorological drought conditions in these regions in the future. With the HadGEM2-ES projection under RCP8.5, Turkey shows both an increase in CDD, which is more than 15 days, and increase in R10mm, which is between 4 to 12 days. The increase in CDD together with R10mm indicates an intensification of both wet and dry seasons which may cause problems for agricultural practices.

4. Discussion and Conclusions

In this study, we investigated future changes in extreme climate indices defined by ETCCDI using regional climate model simulations driven by two global climate models for CORDEX-MENA region under two different radiative forcing pathways RCP4.5 and RCP8.5. The 95 percentile confidence intervals are computed for minimum, maximum temperature and precipitation change since all indices are calculated using those variables. Spatial patterns of change in the indices are presented for the period of 2071–2100 compared to the reference period of 1971–2000 and results are analyzed over different sub-regions of MENA domain. Temporal evolution of change in indices is also investigated. Results show robust increase in intensity of extreme temperature indices with increased radiative forcing. Stronger warming in maximum of daily maximum temperatures is projected over all parts of the region, in particular over Mediterranean which is expected to be one of the most prominent climate change hot spots [85,86,87,88,89]. Extreme climate indices based on the minimum temperature (frost days, tropical nights, cold nights and warm nights) also show warmer conditions for the region. Projected changes in warm nights are remarkably up to 90% for the end of the century indicating that almost all nights will be exceeding the 90th percentile of the reference period for RCP8.5 emission scenario in agreement with previous studies [2,65]. Annual count of days with at least 6 consecutive days when maximum temperature is greater than 90th percentile of the reference period is projected to increase more than 200 days all over the region meaning that warm spells will be observed more than half of the year. On the other hand, cold spell duration, number of frost days and the exceedance rate of cold nights will be expected to either decrease or show no change.
The highest increases in warm spell duration and warm nights are expected in the tropical region where inter-annual temperature variability is small compared to other regions. Even though the change in temperature climatology is small, it leads to large changes in percentile indices compared to extra-tropical regions. Therefore, even small changes in extreme weather conditions can have an effect on tropical rainforests, ecosystems and relative abundances of species which are adapted to small variations in temperature [2,90].
Annual total precipitation is expected to decrease over almost all parts of the region associated with an increase in consecutive dry days. In the case of extreme precipitation, moderate increase of 40% is observed for most parts of the region in very wet days when total precipitation is greater than 95th percentile of the reference period, while there is a 100% increase over Sahara where total precipitation has already very low values. There is relatively less change in heavy precipitation days when total precipitation is greater than 10 mm over North Africa while there is a decrease for Southern Europe and tropical regions. Significant increases in consecutive dry days and decreases in heavy precipitation days over Mediterranean and North Africa particularly for RCP8.5 scenario indicate that more severe meteorological drought conditions will occur in these regions for the end of the century which is in concordance with previous works [70,71].
Our assessment also shows that the regional climate model results driven by HadGEM2-ES global climate model for MENA region is stronger and harsher compared to the results driven by MPI-ESM-MR global climate model [50]. HadGEM2-ES foresees a warmer future for MENA as well as more and prolonged droughts. RCP8.5 emission scenario gives more severe changes of climate extreme indices in the region compared to RCP4.5, which means that the underlying cause of the strong heating in the region and the transition to hotter and drier conditions is actually the intensification of the global warming due to the unabated anthropogenic emissions and land use changes.

Supplementary Materials

The following are available online at https://www.mdpi.com/article/10.3390/atmos12050622/s1, Figure S1: Temporal evolution of spatial averages of temperature indices over Mediterranean for MPI-ESM-MR RF (green line) and with RCP8.5 (purple line) and for HadGEM2-ES RF (orange line) and with RCP8.5 (red line) displayed as anomalies from the reference period 1971-2000. Time series are smoothed with a 5 year running mean filter. Figure S2: Same as Figure S1, but over Sahara. Figure S3: Same as Figure S1, but over East Africa. Figure S4: Same as Figure S1, but over West Africa. Figure S5: Temporal evolution of spatial averages of total wet-day precipitation for Mediterranean, Sahara, East Africa and West Africa sub-regions. Changes are displayed relative to the reference period 1971–2000 in %. Time series are smoothed with a 10 year running mean filter.

Author Contributions

T.O. conceived the idea, run the model, performed formal analysis and investigations and contributed review and editing. F.S.S.-A. contributed to the writing, review and editing. M.L.K. participated in discussions and contributed review and editing. All authors have read and agreed to the published version of the manuscript.

Funding

This research received no external funding.

Data Availability Statement

MENA-CORDEX dataset used in this study can be downloaded from the Earth System Grid Federation website (https://esgf-data.dkrz.de/projects/cordex-dkrz/, accessed on 11 May 2021).

Conflicts of Interest

The authors declare no conflict of interest.

References

  1. Nicholls, N.; Alexander, L. Has the climate become more variable or extreme? Progress 1992–2006. Prog. Phys. Geogr. 2007, 31, 77–87. [Google Scholar] [CrossRef]
  2. Sillmann, J.; Kharin, V.; Zwiers, F.; Zhang, X.; Bronaugh, D. Climate extremes indices in the CMIP5 multimodel ensemble: Part 2. Future climate projections. J. Geophys. Res. Atmos. 2013, 118, 2473–2493. [Google Scholar] [CrossRef]
  3. Zwiers, F.W.; Alexander, L.V.; Hegerl, G.C.; Knutson, T.R.; Kossin, J.; Naveau, P.; Nicholls, N.; Schar, C.; Seneviratne, S.I.; Zhang, X. Climate Extremes: Challenges in estimating and understanding recent changes in the frequency and intensity of extreme climate and weather events. In Climate Science for Serving Society: Research, Modelling and Prediction Priorities; Asrar, G.R., Hurrell, J.W., Eds.; Springer: Dordrecht, The Netherlands, 2013. [Google Scholar]
  4. IPCC. Managing the Risks of Extreme Events and Disasters to Advance Climate Change Adaptation. A Special Report of Working Groups I and II of the Intergovernmental Panel on Climate Change; Cambridge University Press: Cambridge, UK; New York, NY, USA, 2012; p. 582. [Google Scholar] [CrossRef]
  5. Chen, H.; Sun, J. Assessing model performance of climate extremes in China: An intercomparison between CMIP5 and CMIP3. Clim. Change 2015, 129, 197–211. [Google Scholar] [CrossRef]
  6. Karl, T.; Easterling, D. Climate extremes: Selected review and future research directions. Clim. Change 1999, 42, 309–325. [Google Scholar] [CrossRef]
  7. Klein Tank, A.M.G.; Zwiers, F.W.; Zhang, X. Guidelines on analysis of extremes in a changing climate in support of informed decisions for adaptation. In Climate Data and Monitoring WCDMP-No. 72, WMO-TD No. 1500; World Meteorological Organization: Geneva, Switzerland, 2009; p. 56. [Google Scholar]
  8. Zhang, X.; Alexander, L.; Hegerl, G.C.; Jones, P.; Tank, A.K.; Peterson, T.C.; Trewin, B.; Zwiers, F.W. Indices for monitoring changes in extremes based on daily temperature and precipitation data. Wiley Interdiscip. Rev. Clim. Chang. 2011, 2, 851–870. [Google Scholar] [CrossRef]
  9. Alexander, L.V.; Zhang, X.; Peterson, T.C.; Caesar, J.; Gleason, B.; Tank, A.M.G.K.; Haylock, M.; Collins, D.; Trewin, B.; Rahimzadeh, F.; et al. Global observed changes in daily climate extremes of temperature and precipitation. J. Geophys. Res. 2006, 111. [Google Scholar] [CrossRef] [Green Version]
  10. Donat, M.G.; Alexander, L.V.; Yang, H.; Durre, I.; Vose, R.; Dunn, R.J.H.; Willett, K.M.; Aguilar, E.; Brunet, M.; Caesar, J.; et al. Updated analyses of temperature and precipitation extreme indices since the beginning of the twentieth century: The HadEX2 dataset. J. Geophys. Res. Atmos. 2013, 118, 2098–2118. [Google Scholar] [CrossRef]
  11. Kharin, V.V.; Zwiers, F.W.; Zhang, X.; Hegerl, G.C. Changes in temperature and precipitation extremes in the IPCC ensemble of global coupled model simulations. J. Clim. 2007, 20, 1419–1444. [Google Scholar] [CrossRef] [Green Version]
  12. Sillmann, J.; Kharin, V.V.; Zhang, X.; Zwiers, F.W.; Bronaugh, D. Climate extremes indices in the CMIP5 multimodel ensemble: Part 1. Model evaluation in the present climate. J. Geophys. Res. Atmos. 2013, 118, 1716–1733. [Google Scholar] [CrossRef]
  13. Frich, P.; Alexander, L.; Della-Marta, P.; Gleason, B.; Haylock, M.; Klein Tank, A.; Peterson, T. Observed coherent changes in climate extremes during the second half of the twentieth century. Clim. Res. 2002, 19, 193–212. [Google Scholar] [CrossRef] [Green Version]
  14. Ntoumos, A.; Hadjinicolaou, P.; Zittis, G.; Lelieveld, J. Updated Assessment of Temperature Extremes over the Middle East–North Africa (MENA) Region from Observational and CMIP5 Data. Atmosphere 2020, 11, 813. [Google Scholar] [CrossRef]
  15. Sillmann, J.; Roeckner, E. Indices for extreme events in projections of anthropogenic climate change. Clim. Change 2008, 86, 83–104. [Google Scholar] [CrossRef] [Green Version]
  16. Orlowsky, B.; Seneviratne, S. Global changes in extremes events: Regional and seasonal dimension. Clim. Change 2012, 110, 669–696. [Google Scholar] [CrossRef] [Green Version]
  17. Chen, H.; Sun, J.Q. Projection and uncertainty analysis of global precipitation-related extremes using CMIP5 models. Int. J. Climatol. 2014, 34, 2730–2748. [Google Scholar] [CrossRef]
  18. Kharin, V.; Zwiers, F.; Zhang, X.; Wehner, M.F. Changes in temperature and precipitation extremes in the CMIP5 ensemble. Clim. Change 2013, 119, 345–357. [Google Scholar] [CrossRef]
  19. Chen, C.; Knutson, T. On the Verification and Comparison of Extreme Rainfall Indices from Climate Models. J. Clim. 2008, 21, 1605–1621. [Google Scholar] [CrossRef]
  20. Alexander, L.; Arblaster, J.M. Assessing trends in observed and modelled climate extremes over Australia in relation to future projections. Int. J. Clim. 2007, 29, 417–435. [Google Scholar] [CrossRef]
  21. Peterson, T.; Zhang, X.; Brunet-India, M.; Vázquez-Aguirre, J. Changes in North American extremes derived from daily weather data. J. Geophys. Res. 2008, 113. [Google Scholar] [CrossRef] [Green Version]
  22. Thibeault, J.M.; Seth, A. Changing climate extremes in the Northeast United States: Observations and projections from CMIP5. Clim. Change 2014, 127, 273–287. [Google Scholar] [CrossRef]
  23. Scherer, M.; Diffenbaugh, N. Transient twenty-first century changes in daily-scale temperature extremes in the United States. Clim. Dyn. 2013, 42, 1383–1404. [Google Scholar] [CrossRef]
  24. Gao, X.; Giorgi, F. Increased aridity in the Mefiterranean region under greenhouse gas forcing estimated from high resolution simulations with a regional climate model. Glob. Planet. Change 2008, 62, 195–209. [Google Scholar] [CrossRef]
  25. Vincent, L.A.; Aguilar, E.; Saindou, M.; Hassane, A.; Jumaux, G.; Roy, D.; Booneeady, P.; Virasami, R.; Randriamarolaza, L.; Faniriantsoa, F.R.; et al. Observed trends in indices of daily and extreme temperature and precipitation for the countries of the western Indian Ocean, 1961–2008. J. Geophys. Res. 2011, 116. [Google Scholar] [CrossRef]
  26. Donat, M.G.; Peterson, T.C.; Brunet, M.; King, A.D.; Almazroui, M.; Kolli, R.K.; Boucherf, D.; Al-Mulla, A.Y.; Nour, A.Y.; Aly, A.A.; et al. Changes in extreme temperature and precipitation in the Arab region: Long-term trends and variability related to ENSO and NAO. Int. J. Climatol. 2013. [Google Scholar] [CrossRef]
  27. You, Q.; Kang, S.; Aguilar, E.; Yan, Y. Changes in daily climate extremes in the eastern and central Tibetan Plateau during 1961–2005. J. Geophys. Res. 2008, 113. [Google Scholar] [CrossRef] [Green Version]
  28. Fan, X.; Wang, Q.; Wang, M. Changes in temperature and precipitation extremes during 1959–2008 in Shanxi, China. Theor. Appl. Climatol. 2012, 109, 283–303. [Google Scholar] [CrossRef]
  29. Soltani, M.; Laux, P.; Kunstmann, H.; Stan, K.; Sohrabi, M.M.; Molanejad, M.; Sabziparvar, A.A.; SaadatAbadi, A.R.; Ranjbar, F.; Rousta, I.; et al. Assessment of climate variations in temperature and precipitation extreme events over Iran. Theor. Appl. Climatol. 2015, 126, 775–795. [Google Scholar] [CrossRef] [Green Version]
  30. Roushdi, M.; Mostafa, H.; Kheireldin, K. Present and Future Climate Extreme Indices over Sinai Peninsula, Egypt. Int. J. Geol. Environ. Eng. 2016, 10, 85–90. [Google Scholar] [CrossRef]
  31. Tank, A.K.; Peterson, T.; Quadir, D.; Dorji, S.; Zou, X.; Tang, H.; Santhosh, K.; Joshi, U.; Jaswal, A.; Kolli, R.K.; et al. Changes in daily temperature and precipitation extremes in Central and South Asia. J. Geophys. Res. 2006, 111. [Google Scholar] [CrossRef]
  32. Lee, Y.; Paek, J.; Park, J.S.; Boo, K.O. Changes in temperature and rainfall extremes across East Asia in the CMIP5 ensemble. Theor. Appl. Climatol. 2020. [Google Scholar] [CrossRef]
  33. Berhane, A.; Hadgu, G.; Worku, W.E.A. Trends in extreme temperature and rainfall indices in the semi-arid areas of Western Tigray, Ethiopia. Environ. Syst. Res. 2020, 9. [Google Scholar] [CrossRef] [Green Version]
  34. Shawul, A.; Chakma, S. Trend of extreme precipitation indices and analysis of long-term climate variability in the Upper Awash basin, Ethiopia. Theor. Appl. Climatol. 2020, 140, 635–652. [Google Scholar] [CrossRef]
  35. Degefu, M.; Tadesse, Y.; Bewket, W. Observed changes in rainfall amount and extreme events in southeastern Ethiopia, 1955–2015. Theor. Appl. Climatol. 2021, 144, 967–983. [Google Scholar] [CrossRef]
  36. Islam, M.N.; Almazroui, M.; Dambul, R.; Jones, P.D.; Alamoudi, A.O. Long-term changes in seasonal temperature extremes over Saudi Arabia during 1981–2010. Int. J. Climatol. 2015, 35. [Google Scholar] [CrossRef]
  37. Min, S.K.; Zhang, X.; Zwiers, F.W.; Hegerl, G. Human contribution to more-intense precipitation extremes. Nature 2010, 470, 378–381. [Google Scholar] [CrossRef] [PubMed]
  38. Morak, S.; Hegerl, G.; Christidis, N. Detectable Changes in the Frequency of Temperature Extremes. J. Clim. 2013, 26, 1561–1574. [Google Scholar] [CrossRef] [Green Version]
  39. Fischer, E.; Knutti, R. Detection of spatially aggregated changes in temperature and precipitation extremes. Geophys. Res. Lett. 2014, 41, 547–554. [Google Scholar] [CrossRef]
  40. Kharin, V.V.; Zwiers, F.W. Changes in the extremes in an ensemble of transient climate simulations with a coupled atmosphere–ocean GCM. J. Clim. 2000, 13, 3760–3788. [Google Scholar] [CrossRef]
  41. Kharin, V.V.; Zwiers, F.W. Estimating extremes in transient climate change simulations. J. Clim. 2005, 18, 1156–1173. [Google Scholar] [CrossRef]
  42. Semenov, V.A.; Bengtsson, L. Secular trends in daily precipitation characteristics: Greenhouse gas simulation with a coupled AOGCM. Clim. Dyn. 2002, 19, 123–140. [Google Scholar]
  43. Voss, R.; May, W.; Roeckner, E. Enhanced resolution modelling study on anthropogenic climate change: Changes in extremes of the hydrological cycle. Int. J. Climatol. 2002, 22, 755–777. [Google Scholar] [CrossRef]
  44. Wilby, R.L.; Wigley, T.M.L. Future changes in the distribution of daily precipitation totals across North America. Geophys. Res. Lett. 2002, 29, 1135. [Google Scholar] [CrossRef]
  45. Lee, J.W.; Hong, S.Y.; Chang, E.C.; Suh, M.S.; Kang, H.S. Assessment of future climate change over East Asia due to the RCP scenarios downscaled by GRIMs-RMP. Clim. Dyn. 2014, 42, 733–747. [Google Scholar] [CrossRef]
  46. Murphy, J.M.; Mitchell, J.F.B. Transient response of the Hadley Centre coupled ocean-atmosphere model to increasing carbon dioxide. Part II: Spatial and temporal structure of response. J. Clim. 1995, 8, 57–80. [Google Scholar] [CrossRef] [Green Version]
  47. Giorgi, F.; Hewitson, B. Regional climate information–evaluation and projections. In Climate Change: The Scientific Basis, Contribution of Working Group I to the Third Assessment Report; Cambridge University Press: Cambridge, UK, 2001. [Google Scholar]
  48. Jones, R.G.; Noguer, M.; Hassell, D.C. Generating High–Resolution Climate Change Scenarios Using PRECIS; Met Office Hadley Centre: Exeter, UK, 2004. [Google Scholar]
  49. Almazroui, M. Temperature Changes over the CORDEX-MENA Domain in the 21st Century Using CMIP5 Data Downscaled with RegCM4: A Focus on the Arabian Peninsula. Clim. Dyn. 2019, 2019. [Google Scholar] [CrossRef] [Green Version]
  50. Ozturk, T.; Turp, M.; Türkeş, M.; Kurnaz, M. Future projections of temperature and precipitation climatology for CORDEX- MENA domain using RegCM4.4. Atmos. Res. 2018, 206, 87–107. [Google Scholar] [CrossRef]
  51. Demiroglu, O.C.; Saygili-Araci, F.S.; Pacal, A.; Hall, C.M.; Kurnaz, M.L. Future Holiday Climate Index (HCI) Performance of Urban and Beach Destinations in the Mediterranean. Atmosphere 2020, 11, 911. [Google Scholar] [CrossRef]
  52. Endris, H.S.; Lennard, C.; Hewitson, B.; Dosio, A.; Nikulin, G.; Panitz, H.J. Teleconnection responses in multi-GCM driven CORDEX RCMs over Eastern Africa. Clim. Dyn. 2015. [Google Scholar] [CrossRef]
  53. Almazroui, M.; Islam, M.N.; Alkhalaf, A.K.; Saeed, F.; Dambul, R.; Rahman, M.A. Simulation of temperature and precipitation climatology for the CORDEX-MENA/Arab domain using RegCM4. Arab. J. Geosci. 2016, 9. [Google Scholar] [CrossRef]
  54. Vuuren, D.; Edmonds, J.; Kainuma, M.; Riahi, K.; Thomson, A.; Hibbard, K.; Hurtt, G.; Kram, T.; Krey, V.; Lamarque, J.F.; et al. The representative concentration pathways: An overview. Clim. Change 2011, 109, 5–31. [Google Scholar] [CrossRef]
  55. Rogelj, J.; Meinshausen, M.; Knutti, R. Global warming under old and new scenarios using IPCC climate sensitivity range estimates. Nat. Clim. Change 2012, 2, 248–253. [Google Scholar] [CrossRef]
  56. World Bank. Water in the Arab world: From Droughts to Flood, Building Resilience Against Extremes. 2014. Available online: https://www.worldbank.org/en/news/feature/2014/03/20/floods-and-droughts-in-mena (accessed on 11 March 2021).
  57. World Bank. Beyond Scarcity: Water Security in the Middle East and North Africa. MENA Development Report. 2017. Available online: https://openknowledge.worldbank.org/bitstream/handle/10986/27659/211144ov.pdf (accessed on 11 March 2021).
  58. Waha, K.; Krummenauer, L.; Adams, S.; Aich, V.; Baarsch, F.; Coumou, D.; Fader, M.; Hoff, H.; Jobbins, G.; Marcus, R.; et al. Climate change impacts in the Middle East and Northern Africa (MENA) region and their implications for vulnerable population groups. Reg. Environ. Change 2017, 17, 1623–1638. [Google Scholar] [CrossRef]
  59. Najem, S.; Bitar, A.A.; Faour, G.; Jarlan, L.; Mhawej, M.; Fadel, A.; Zribi, M. Drought Assessment using Micro-Wave Timeseries of Precipitation and Soil Moisture Over the Mena Region. In Proceedings of the 2020 Mediterranean and Middle-East Geoscience and Remote Sensing Symposium (M2GARSS), Tunis, Tunisia, 9–11 March 2017. [Google Scholar] [CrossRef]
  60. Stocker, T.F.; Qin, D.; Plattner, G.-K.; Tignor, M.; Allen, S.K.; Boschung, J.; Nauels, A.; Xia, Y.; Bex, V.; Midgley, P.M. (Eds.) Climate Change 2013. The Physical Science Basis. Contribution of Working Group I to the Fifth Assessment Report of the Intergovernmental Panel on Climate Change; Cambridge University Press: Cambridge, UK; New York, NY, USA, 2014. [Google Scholar] [CrossRef] [Green Version]
  61. Cook, B.; Mankin, J.; Anchukaitis, K. Climate Change and Drought: From Past to Future. Curr. Clim. 2018, 4, 164–179. [Google Scholar] [CrossRef]
  62. Seneviratne, S.I.; Nicholls, N.; Easterling, D.R.; Goodess, C.M.; Kanae, S.; Kossin, J.P.; Luo, Y.; A Marengo, J.; McInnes, K.L.; Rahimi, M.; et al. Changes in climate extremes and their impacts on the natural physical environment. In Managing the Risks of Extreme Events and Disasters to Advance Climate Change Adaptation; Special Report of the Intergovernmental Panel on Climate Change; Cambridge University Press: Cambridge, UK; New York, NY, USA, 2002; pp. 109–230. [Google Scholar]
  63. Loudyi, D.; Kantoush, S. Flood risk management in the Middle East and North Africa (MENA) region. Urban Water J. 2020, 17, 379–380. [Google Scholar] [CrossRef]
  64. Zhang, X.; Aguilar, E.; Şensoy, S.; Melkonyan, H.; Tagiyeva, U.; Ahmed, N.M.; Kutaladze, N.; Rahimzadeh, F.; Taghipour, A.; Hantosh, T.H.; et al. Trends in Middle East climate extreme indices from 1950 to 2003. J. Geophys. Res. 2005, 110. [Google Scholar] [CrossRef]
  65. Lelieveld, J.; Proestos, Y.; Hadjinicolaou, P.; Tanarhte, M.; Tyrlis, E.; Zittis, G. Strongly increasing heat extremes in the Middle East and North Africa (MENA) in the 21st century. Clim. Change 2016, 137. [Google Scholar] [CrossRef] [Green Version]
  66. Almazroui, M.; Saeed, F.; Saeed, S.; Islam, M.N.; Ismail, M.; Klutse, N.A.B.; Siddiqui, M.H. Projected Change in Temperature and Precipitation Over Africa from CMIP6. Earth. Syst. Environ. 2020, 4. [Google Scholar] [CrossRef]
  67. Van Vuuren, D.P.; Riahi, K.; Calvin, K.; Dellink, R.; Emmerling, J.; Fujimori, S.; KC, S.; Kriegler, E.; O’Neill, B. The Shared Socio-economic Pathways: Trajectories for human development and global environmental change. Glob. Environ. Change 2017, 42, 148–152. [Google Scholar] [CrossRef] [Green Version]
  68. Riahi, K.; van Vuuren, D.P.; Kriegler, E.; Edmonds, J.; O’Neill, B.C.; Fujimori, S.; Bauer, N.; Calvin, K.; Dellink, R.; Fricko, O.; et al. The Shared Socioeconomic Pathways and their energy, land use, and greenhouse gas emissions implications: An overview. Glob. Environ. Change 2017, 42, 153–168. [Google Scholar] [CrossRef] [Green Version]
  69. Kriegler, E.; Bauer, N.; Popp, A.; Humpenöder, F.; Leimbach, M.; Strefler, J.; Baumstark, L.; Bodirsky, B.L.; Hilaire, J.; Klein, D.; et al. Fossil-fueled development (SSP5): An energy and resource intensive scenario for the 21st century. Glob. Environ. Change 2017, 42, 297–315. [Google Scholar] [CrossRef] [Green Version]
  70. Driouech, F.; ElRhaz, K.; Moufouma-Okia, W.; Arjdal, K.; Balhane, S. Assessing Future Changes of Climate Extreme Events in the CORDEX-MENA Region Using Regional Climate Model ALADIN-Climate. Earth Syst. Environ. 2020, 4, 477–492. [Google Scholar] [CrossRef]
  71. Spinoni, J.; Barbosa, P.; Bucchignani, E.; Cassano, J.; Cavazos, T.; Christensen, J.H.; Christensen, O.B.; Coppola, E.; Evans, J.; Geyer, B.; et al. Future Global Meteorological Drought Hot Spots: A Study Based on CORDEX Data. J. Clim. 2020, 33, 3635–3661. [Google Scholar] [CrossRef]
  72. Zittis, G.; Hadjinicolaou, P.; Almazroui, M.; Bucchignani, E.; Driouech, F.; El Rhaz, K.; Kurnaz, M.L.; Nikulin, G.; Ntoumos, A.; Ozturk, T.; et al. Business-as-usual will lead to super and ultra-extreme heatwaves in the Middle East and North Africa. NPJ Clim. Atmos. Sci. 2021, 4, 20. [Google Scholar] [CrossRef]
  73. Giorgi, F.; Coppola, E.; Solmon, F.; Mariotti, L.; Sylla, M.B.; Bi, X.; Elguindi, N.; Diro, G.T.; Nair, V.; Giuliani, G.; et al. RegCM4: Model description and preliminary tests over multiple CORDEX domains. Clim. Res. 2012, 52, 7–29. [Google Scholar] [CrossRef] [Green Version]
  74. Tebaldi, C.; Hayhoe, K.; Arblaster, J.; Meehl, G. Going to the extremes: An intercomparison of modelsimulated historical and future changes in extreme events. Clim. Change 2006, 79, 185–211. [Google Scholar] [CrossRef]
  75. Terando, A.; Keller, K.; Easterling, W.E. Probabilistic projections of agro-climate indices in North America. J. Geophys. Res. 2012, 117. [Google Scholar] [CrossRef] [Green Version]
  76. Patz, J.A.; Campbell-Lendrum, D.; Holloway, T.; Foley, J.A. Impact of regional climate change on human health. Nat. Rev. 2005, 438, 310–317. [Google Scholar] [CrossRef]
  77. Cardona, O.; van Aalst, M.; Birkmann, J.; Fordham, M.; McGregor, G.; Perez, R.; Pulwarty, R.; Schipper, E.; Sinh, B. Determinants of risk: Exposure and vulnerability. In Managing the Risks of Extreme Events and Disasters to Advance Climate Change Adaptation; A Special Report of Working Groups I and II of the Intergovernmental Panel on Climate Change (IPCC); Cambridge University Press: Cambridge, UK; New York, NY, USA, 2012; pp. 65–108. [Google Scholar]
  78. Giorgi, F.; Francisco, R. Uncertainties in regional climate change prediction: A regional analysis of ensemble simulations with the HADCM2 coupled AOGCM. Clim. Dyn. 2000, 16, 169–182. [Google Scholar] [CrossRef]
  79. Zittis, G.; Hadjinicolaou, P.; Lelieveld, J. Comparison of WRF model physics parameterizations over the MENA-CORDEX domain. Am. J. Clim. Change 2014, 3, 490–511. [Google Scholar] [CrossRef] [Green Version]
  80. Dike, V.N.; Shimizu, M.H.; Diallo, M.; Lin, Z.; Nwofor, O.K.; Chineke, T.C. Modelling present and future African climate using CMIP5 scenarios in HadGEM2-ES. Int. J. Clim. 2015, 35, 1784–1799. [Google Scholar] [CrossRef]
  81. Syed, F.; Latif, M.; Al-Maashi, A.; Ghulam, A. Regional climate model RCA4 simulations of temperature and precipitation over the Arabian Peninsula: Sensitivity to CORDEX domain and lateral boundary conditions. Clim. Dyn. 2019, 53, 7045–7064. [Google Scholar] [CrossRef]
  82. Constantinidou, K.; Hadjinicolaou, P.; Zittis, G.; Lelieveld, J. Performance of Land Surface Schemes in the WRF Model for Climate Simulations over the MENA-CORDEX Domain. Earth. Syst. Environ. 2020, 4, 647–665. [Google Scholar] [CrossRef]
  83. Radinović, D.; Ćurić, M. Criteria for heat and cold wave duration indexes. Theor. Appl. Climatol. 2012, 107, 505–510. [Google Scholar] [CrossRef]
  84. Almazroui, M.; Islam, M.N.; Saeed, F.; Alkhalaf, A.K.; Dambul, R. Assessing the robustness and uncertainties of projected changes in temperature and precipitation in AR5 Global Climate Models over the Arabian Peninsula. Atmos. Res. 2017, 194, 202–213. [Google Scholar] [CrossRef]
  85. Fischer, E.M.; Schaer, C. Consistent geographical patterns of changes in high-impact European heatwaves. Nat. Geosci. 2010, 3, 398–403. [Google Scholar] [CrossRef]
  86. Diffenbaugh, N.S.; Giorgi, F. Climate change hotspots in the CMIP5 global climate model ensemble. Clim. Change 2012, 114, 813–822. [Google Scholar] [CrossRef] [PubMed] [Green Version]
  87. Ozturk, T.; Ceber, Z.; Türkeş, M.; Kurnaz, M. Projections of climate change in the Mediterranean Basin by using downscaled global climate model outputs. Int. J. Climatol. 2015, 35, 4276–4292. [Google Scholar] [CrossRef]
  88. Zittis, G.; Hadjinicolaou, P.; Fnais, M.; Lelieveld, J. Projected changes in heat wave characteristics in the eastern Mediterranean and the Middle East. Reg. Environ. Change 2016, 16, 1863. [Google Scholar] [CrossRef]
  89. Lionello, P.; Scarascia, L. The relation between climate change in the Mediterranean region and global warming. Reg. Environ. Change 2018, 18, 1481–1493. [Google Scholar] [CrossRef]
  90. Corlett, R.T. Impacts of warming on tropical lowland rainforests. Trends Ecol. Evol. 2011, 26, 606–613. [Google Scholar] [CrossRef]
Figure 1. The temporally averaged changes in TNn (a,c,e,g) and TXx (b,d,f,h) for the period of 2071–2100 displayed as differences (in C) with respect to the reference period 1971–2000 for the model MPI-ESM-MR with RCP4.5 (a,b) and with RCP8.5 (e,f) and for the model HadGEM2-ES with RCP4.5 (c,d) and with RCP8.5 (g,h).
Atmosphere 12 00622 g001
Figure 2. The 95 percentile confidence ranges of temporally averaged changes in TNn (a,c,e,g) and TXx (b,d,f,h) for the period of 2071–2100 displayed as differences (in C) with respect to the reference period 1971–2000 for the model MPI-ESM-MR with RCP4.5 (a,b) and with RCP8.5 (e,f) and for the model HadGEM2-ES with RCP4.5 (c,d) and with RCP8.5 (g,h).
Atmosphere 12 00622 g002
Figure 3. The temporally averaged changes in FD for the period of 2071–2100 displayed as differences (in days) with respect to the reference period 1971–2000 for the model MPI-ESM-MR with RCP4.5 (a) and RCP8.5 (b) and for the model HadGEM2-ES with RCP4.5 (c) and RCP8.5 (d).
Atmosphere 12 00622 g003
Figure 4. The temporally averaged changes in TR for the period of 2071–2100 displayed as differences (in days) with respect to the reference period 1971–2000 for the model MPI-ESM-MR with RCP4.5 (a) and RCP8.5 (b) and for the model HadGEM2-ES with RCP4.5 (c) and RCP8.5 (d).
Atmosphere 12 00622 g004
Figure 5. The temporally averaged changes in CSDI for the period of 2071–2100 displayed as differences (in days) with respect to the reference period 1971–2000 for the model MPI-ESM-MR with RCP4.5 (a) and RCP8.5 (b) and for the model HadGEM2-ES with RCP4.5 (c) and RCP8.5 (d).
Atmosphere 12 00622 g005
Figure 6. The temporally averaged changes in WSDI for the period of 2071–2100 displayed as differences (in days) with respect to the reference period 1971–2000 for the model MPI-ESM-MR with RCP4.5 (a) and RCP8.5 (b) and for the model HadGEM2-ES with RCP4.5 (c) and RCP8.5 (d).
Atmosphere 12 00622 g006
Figure 7. Annual frequency of TN10p temporally averaged over the period of 2071–2100 as absolute values of the exceedance rate (in %) for the model MPI-ESM-MR with RCP4.5 (a) and RCP8.5 (b) and for the model HadGEM2-ES with RCP4.5 (c) and RCP8.5 (d). By definition the exceedance rate averages to approximately 10% over the reference period.
Atmosphere 12 00622 g007
Figure 8. Annual frequency of TN90p temporally averaged over the period of 2071–2100 as absolute values of the exceedance rate (in %) for the model MPI-ESM-MR with RCP4.5 (a) and RCP8.5 (b) and for the model HadGEM2-ES with RCP4.5 (c) and RCP8.5 (d). By definition, the exceedance rate averages to approximately 10% over the reference period.
Atmosphere 12 00622 g008
Figure 9. The temporally averaged changes in the total wet-day precipitation (PRCPTOT) for the period of 2071–2100 displayed as differences (in %) with respect to the reference period 1971–2000 for the model MPI-ESM-MR with RCP4.5 (a) and RCP8.5 (b) and for the model HadGEM2-ES with RCP4.5 (c) and RCP8.5 (d).
Atmosphere 12 00622 g009
Figure 10. The 95 percentile of temporally averaged changes in the total wet-day precipitation (PRCPTOT) for the period of 2071–2100 displayed as differences (in %) with respect to the reference period 1971–2000 for the model MPI-ESM-MR with RCP4.5 (a) and RCP8.5 (b) and for the model HadGEM2-ES with RCP4.5 (c) and RCP8.5 (d).
Atmosphere 12 00622 g010
Figure 11. The temporally averaged changes in R95p for the period of 2071–2100 displayed as differences (in %) with respect to the reference period 1971–2000 for the model MPI-ESM-MR with RCP4.5 (a) and RCP8.5 (b) and for the model HadGEM2-ES with RCP4.5 (c) and RCP8.5 (d).
Atmosphere 12 00622 g011
Figure 12. The temporally averaged changes in the consecutive dry days for the period of 2071–2100 displayed as differences (in days) with respect to the reference period 1971–2000 for the model MPI-ESM-MR with RCP4.5 (a) and RCP8.5 (b) and for the model HadGEM2-ES with RCP4.5 (c) and RCP8.5 (d).
Atmosphere 12 00622 g012
Figure 13. The temporally averaged changes in R10mm for the period of 2071–2100 displayed as differences (in days) with respect to the reference period 1971–2000 for the model MPI-ESM-MR with RCP4.5 (a) and RCP8.5 (b) and for the model HadGEM2-ES with RCP4.5 (c) and RCP8.5 (d).
Atmosphere 12 00622 g013
Table 1. A subset of the climate extreme event indices recommended by the ETCCDI that are used in this study. Adopted from the work of Sillmann et al. [12].
LabelIndex NameIndex DefinitionUnits
TN10pCold nights L e t T N i j be the daily minimum temperature on day i in period j and let T N i n 10 be the calendar day 10th percentile centered on a 5 day window. The percentage of days in a year is determined where T N i j < T N i n 10 %
TN90pWarm nightsLet T N i j be the daily minimum temperature on a day i in period j and let T N i n 90 be the calendar day 90th percentile centered on a 5 day window. The percentage of days in a year is determined where T N i j > T N i n 90 %
WSDIWarm spell duration L e t T X i j be the daily maximum temperature on a day i in period j and let T X i n 90 be the calendar day 90th percentile centered on a 5 day window for the base period 1971–2000. Then the number of days per period is summed where in intervals of at least 6 consecutive days: T X i j > T X i n 90 days
CSDICold spell duration L e t T N i j be the daily minimum temperature on a day i in period j and let T N i n 10 be the calendar day 10th percentile centered on a 5 day window for the base period 1971–2000. Then the number of days per period is summed where in intervals of at least 6 consecutive days: T N i j < T N i n 10 days
TXxMax TXLet TXx be the daily maximum temperature in month k, period j. The maximum daily maximum temperature each month is then: T X x k j = m a x ( T X x k j )   C
TNnMin TNLet TNn be the daily minimum temperature in month k, period j. The minimum daily minimum temperature each month is then: T N n k j = m a x ( T N n k j )   C
FDFrost daysLet TN be the daily minimum temperature on day i in period j. Count the number of days where T N i j < 0   Cdays
TRTropical nightsLet TN be the daily minimum temperature on day i in period j. Count the number of days where T N i j > 20   Cdays
R10mmHeavy precipitation days L e t P R i j be the daily precipitation amount on day i in period j. Count the number of days where P R i j > 10  mmdays
CDDConsecutive dry daysLet P R i j be the daily precipitation amount on day i in period j. Count the largest number of consecutive days where P R i j < 1 mmdays
R95pVery wet daysLet P R w j be the daily precipitation amount on a wet day day w (PR ≥ 1 mm) in period i and let P R w n 95 be the 95th percentile of precipitation on wet days in the 1970–2000 period. If W represents the number of wet days in the period, then: R 95 p j = w = 1 W P R w j , where P R w j > P R w n 95 mm
PRCPTOTTotal wet-day precipitationLet P R i j be the daily precipitation amount on day i in period j. If I represents the number of days in j, then P R C P T O T j = n = 1 I P R i j mm
Table 2. The temporally averaged changes in absolute and threshold temperature indices weighted over sub-regions of MENA for the period of 2071–2100 displayed as differences with respect to the reference period 1971–2000.
MediterraneanMinimum of TN (  C)Maximum of TX (  C)Frost Days (days)Tropical Nights (days)
MPI-ESM-MR RCP4.52.62.1−11.621.8
HadGEM2-ES RCP4.53.24.4−17.846.4
MPI-ESM-MR RCP8.53.85.1−19.249.7
HadGEM2-ES RCP8.56.28.1−28.682.9
Sahara
MPI-ESM-MR RCP4.51.52.3−2.038.2
HadGEM2-ES RCP4.52.63.7−4.356.3
MPI-ESM-MR RCP8.52.95.1−2.969.9
HadGEM2-ES RCP8.55.86.8−5.298.1
East Africa
MPI-ESM-MR RCP4.51.92.4−0.181.6
HadGEM2-ES RCP4.53.03.4−0.197.8
MPI-ESM-MR RCP8.54.05.1−0.1140.4
HadGEM2-ES RCP8.56.87.0−0.1148.8
West Africa
MPI-ESM-MR RCP4.51.82.50.075.1
HadGEM2-ES RCP4.53.03.20.083.0
MPI-ESM-MR RCP8.54.05.00.0120.4
HadGEM2-ES RCP8.56.76.70.0125.5
Table 3. The temporally averaged changes in cold spell and warm spell duration and cold nights and warm nights index weighted over sub-regions of MENA for the period of 2071–2100 displayed as differences with respect to the reference period 1971–2000.
MediterraneanCold Spell Duration (days)Warm Spell Duration (days)Cold Nights (%)Warm Nights (%)
MPI-ESM-MR RCP4.5−4.543.72.533.5
HadGEM2-ES RCP4.5−5.2124.11.058.5
MPI-ESM-MR RCP8.5−4.9126.50.761.2
HadGEM2-ES RCP8.5−5.4260.40.284.1
Sahara
MPI-ESM-MR RCP4.5−7.092.72.139.7
HadGEM2-ES RCP4.5−7.6164.70.460.9
MPI-ESM-MR RCP8.5−7.8200.50.470.0
HadGEM2-ES RCP8.5−7.6301.10.190.0
East Africa
MPI-ESM-MR RCP4.5−6.0156.50.666.6
HadGEM2-ES RCP4.5−6.8247.60.182.9
MPI-ESM-MR RCP8.5−6.3264.10.192.2
HadGEM2-ES RCP8.5−6.8341.40.098.8
West Africa
MPI-ESM-MR RCP4.5−4.7174.20.467.7
HadGEM2-ES RCP4.5−6.9241.50.183.0
MPI-ESM-MR RCP8.5−4.8267.10.093.1
HadGEM2-ES RCP8.5−6.9329.10.098.8
Table 4. The temporally averaged changes in precipitation indices weighted over sub-regions of MENA for the period of 2071–2100 displayed as differences with respect to the reference period 1971–2000.
MediterraneanTotal Wet-DayVery Wet Days (%)ConsecutiveHeavy Precipitation
Precipitation (%)Dry Days (days)Days (days)
MPI-ESM-MR RCP4.5−7.935.18.0−1.4
HadGEM2-ES RCP4.5−7.735.518.4−0.9
MPI-ESM-MR RCP8.5−15.135.715.5−3.0
HadGEM2-ES RCP8.5−1.338.028.9−0.6
Sahara
MPI-ESM-MR RCP4.5−6.769.312.8−0.1
HadGEM2-ES RCP4.5−33.769.638.3−0.5
MPI-ESM-MR RCP8.5−2.169.816.80.0
HadGEM2-ES RCP8.5−26.568.042.1−0.3
East Africa
MPI-ESM-MR RCP4.51.331.71.4−1.7
HadGEM2-ES RCP4.5−20.833.810.1−4.2
MPI-ESM-MR RCP8.5−2.532.45.6−5.6
HadGEM2-ES RCP8.5−38.434.518.4−10.0
West Africa
MPI-ESM-MR RCP4.5−10.419.35.9−3.9
HadGEM2-ES RCP4.5−13.621.13.8−4.2
MPI-ESM-MR RCP8.5−12.420.512.9−7.1
HadGEM2-ES RCP8.5−20.320.37.0−7.1
Publisher’s Note: MDPI stays neutral with regard to jurisdictional claims in published maps and institutional affiliations.

