Author Contributions
Conceptualization, Y.C., C.Y., Y.T. and X.Y.; methodology, Y.C. and C.Y.; software, Y.C.; validation, Y.C., C.Y. and Y.T.; formal analysis, Y.C. and C.Y.; investigation, Y.C. and Y.T.; resources, Y.T. and X.Y.; data curation, Y.C.; writing—original draft, Y.C. and C.Y.; writing—review and editing, Y.T. and X.Y.; visualization, Y.C. and C.Y.; supervision, X.Y.; project administration, Y.T. and X.Y.; funding acquisition, X.Y. All authors have read and agreed to the published version of the manuscript.
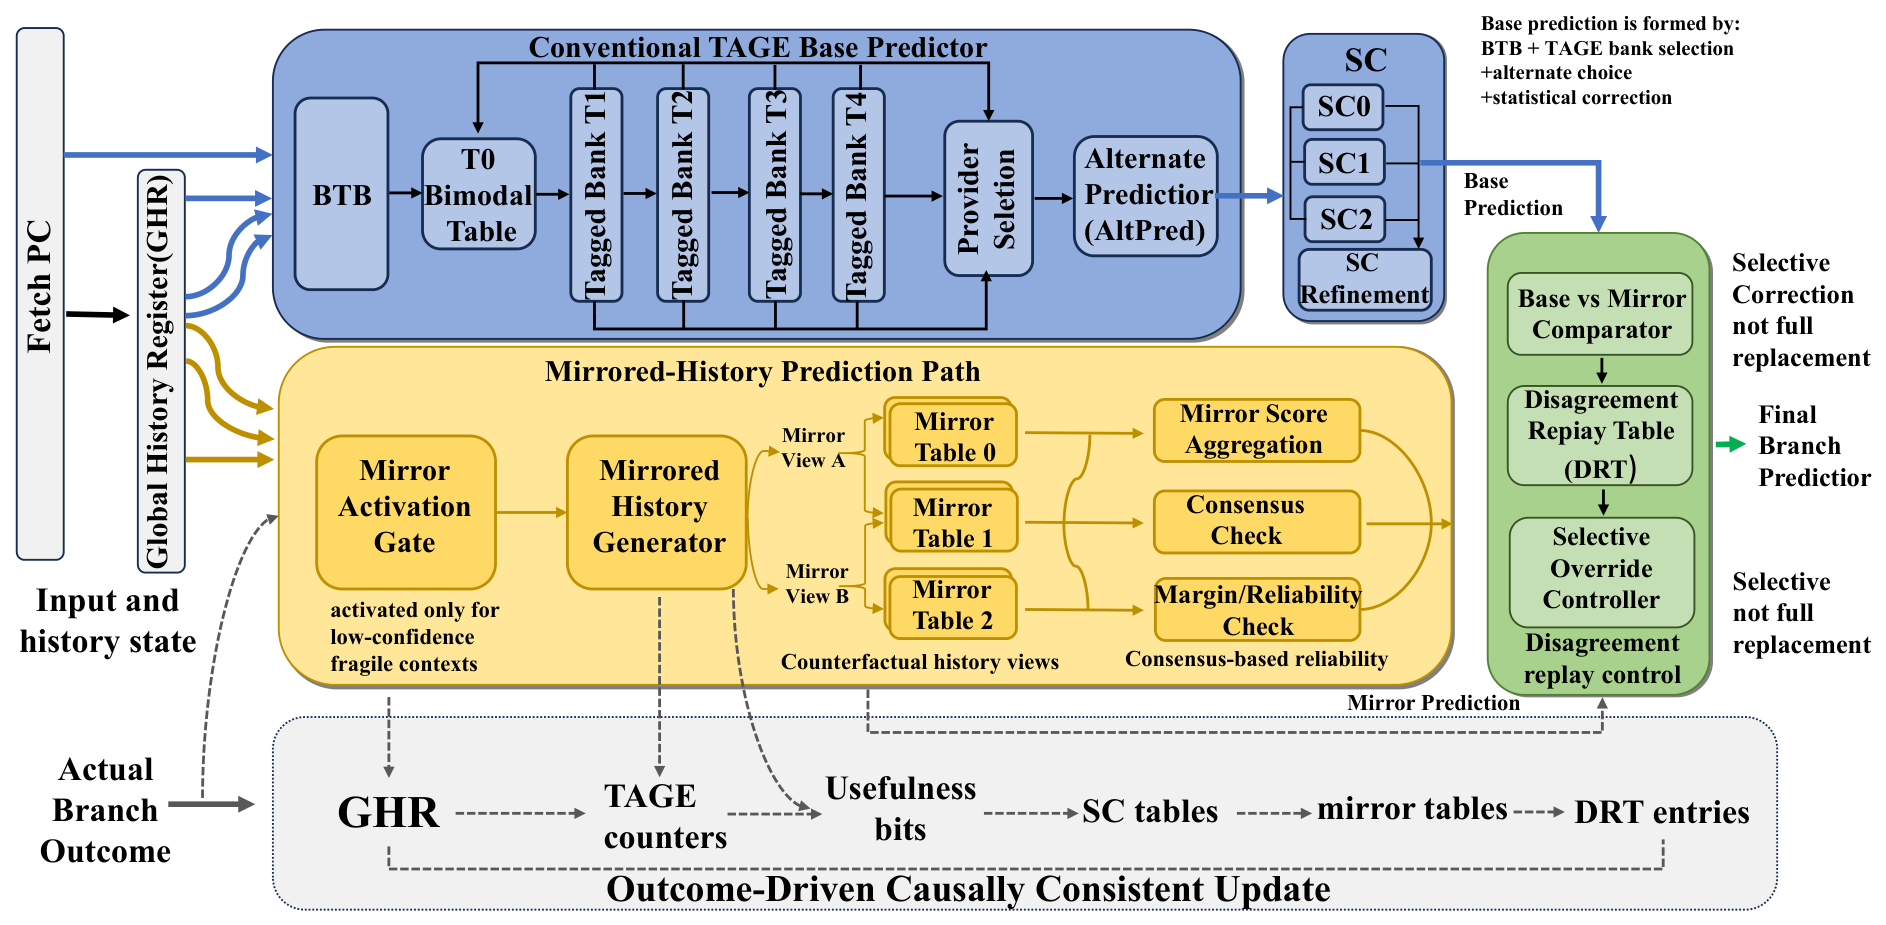
Figure 1.
Overall architecture of Mirror-TAGE comprising the factual TAGE-SC-L pipeline.
Figure 1.
Overall architecture of Mirror-TAGE comprising the factual TAGE-SC-L pipeline.
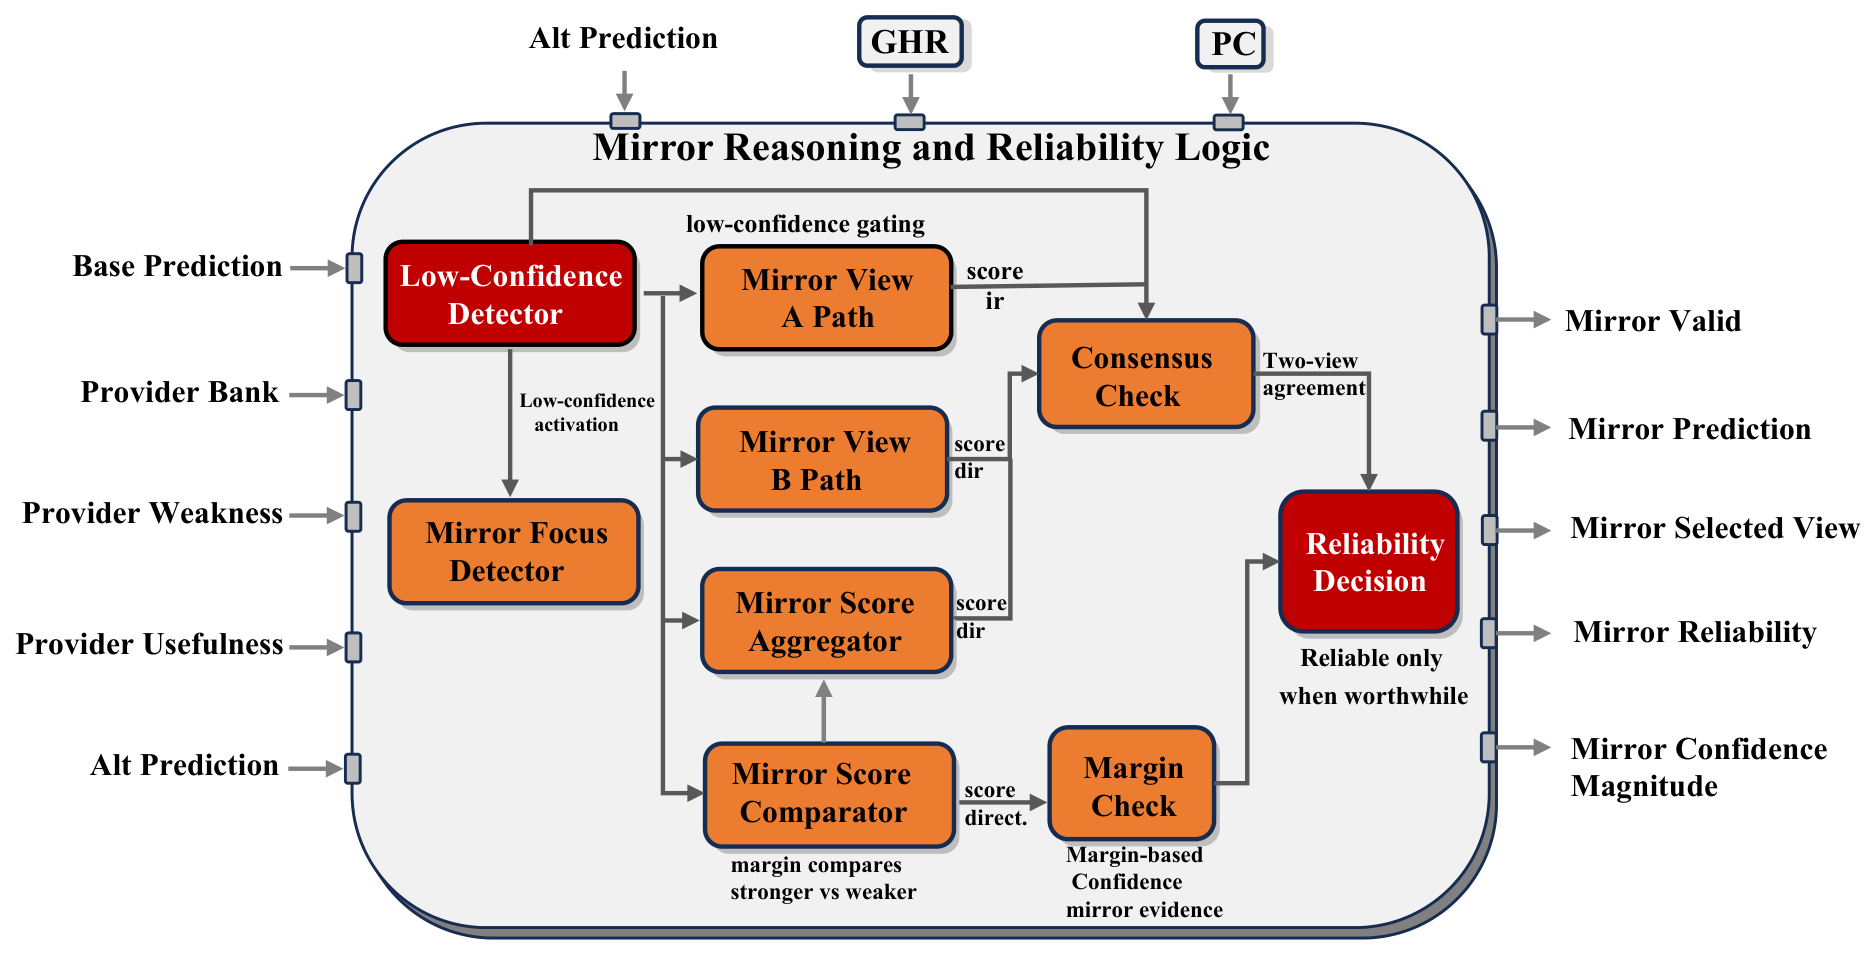
Figure 2.
Mirror reasoning and reliability logic datapath.
Figure 2.
Mirror reasoning and reliability logic datapath.
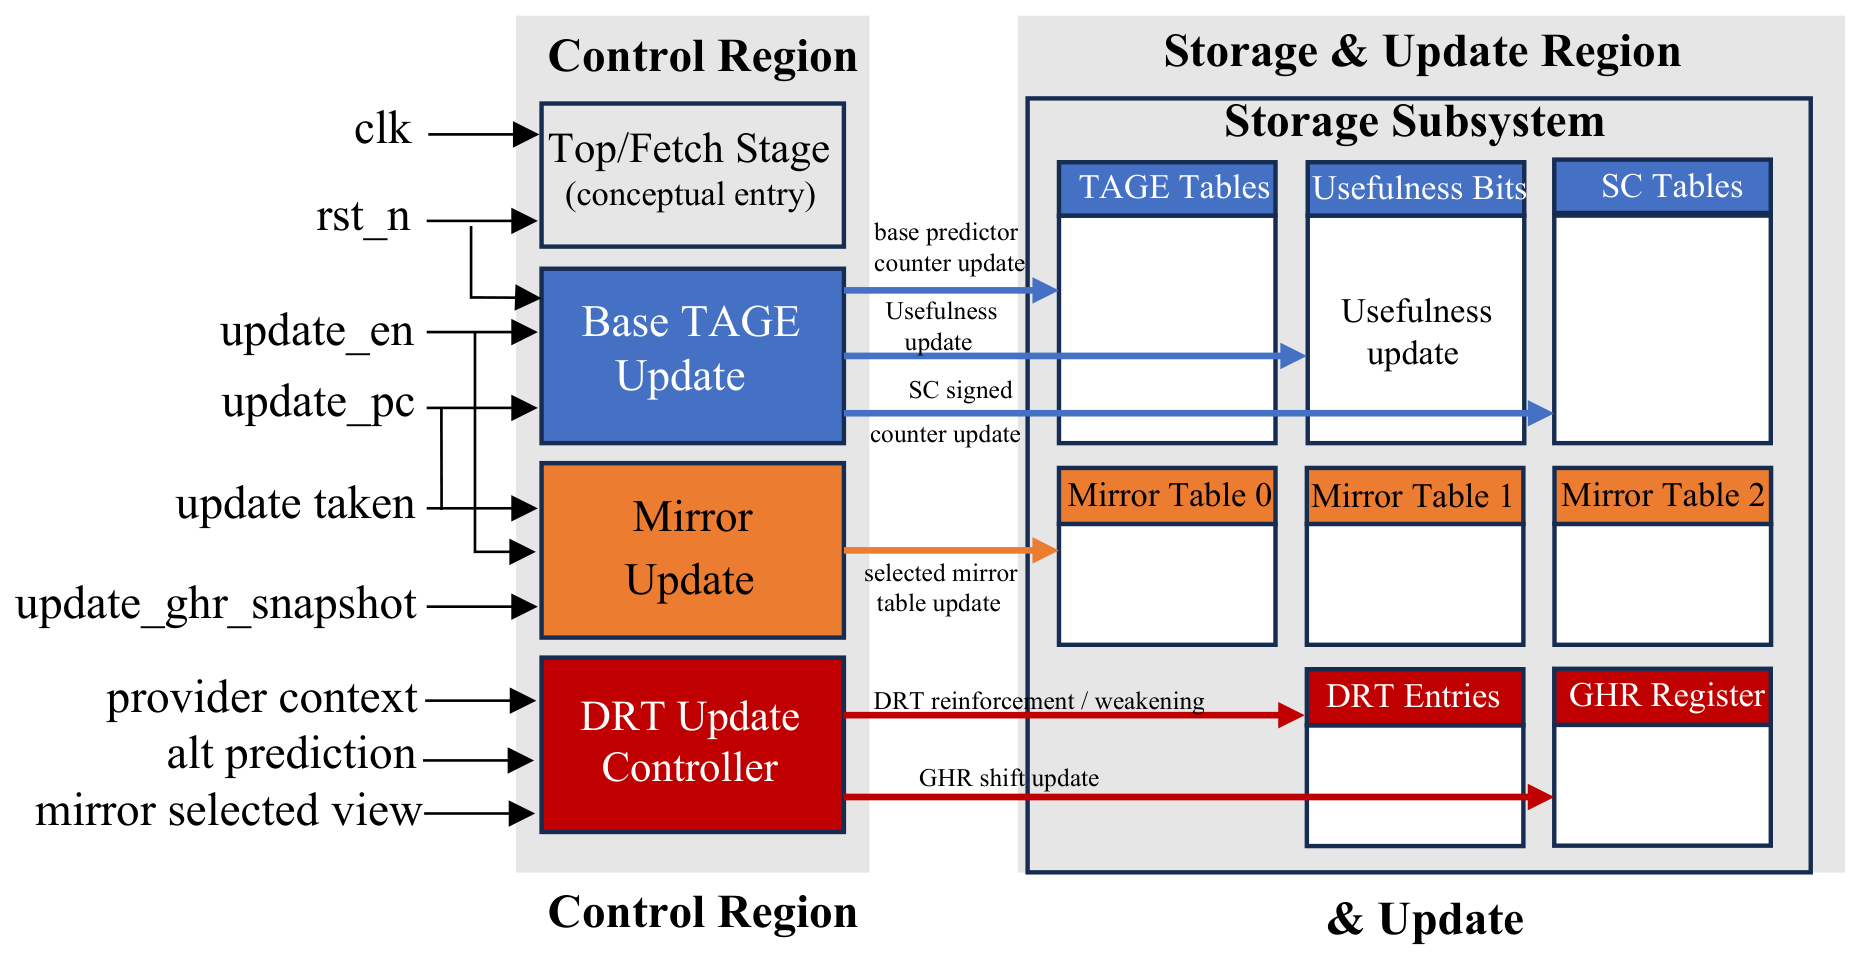
Figure 3.
Prediction and update datapath of Mirror-TAGE.
Figure 3.
Prediction and update datapath of Mirror-TAGE.
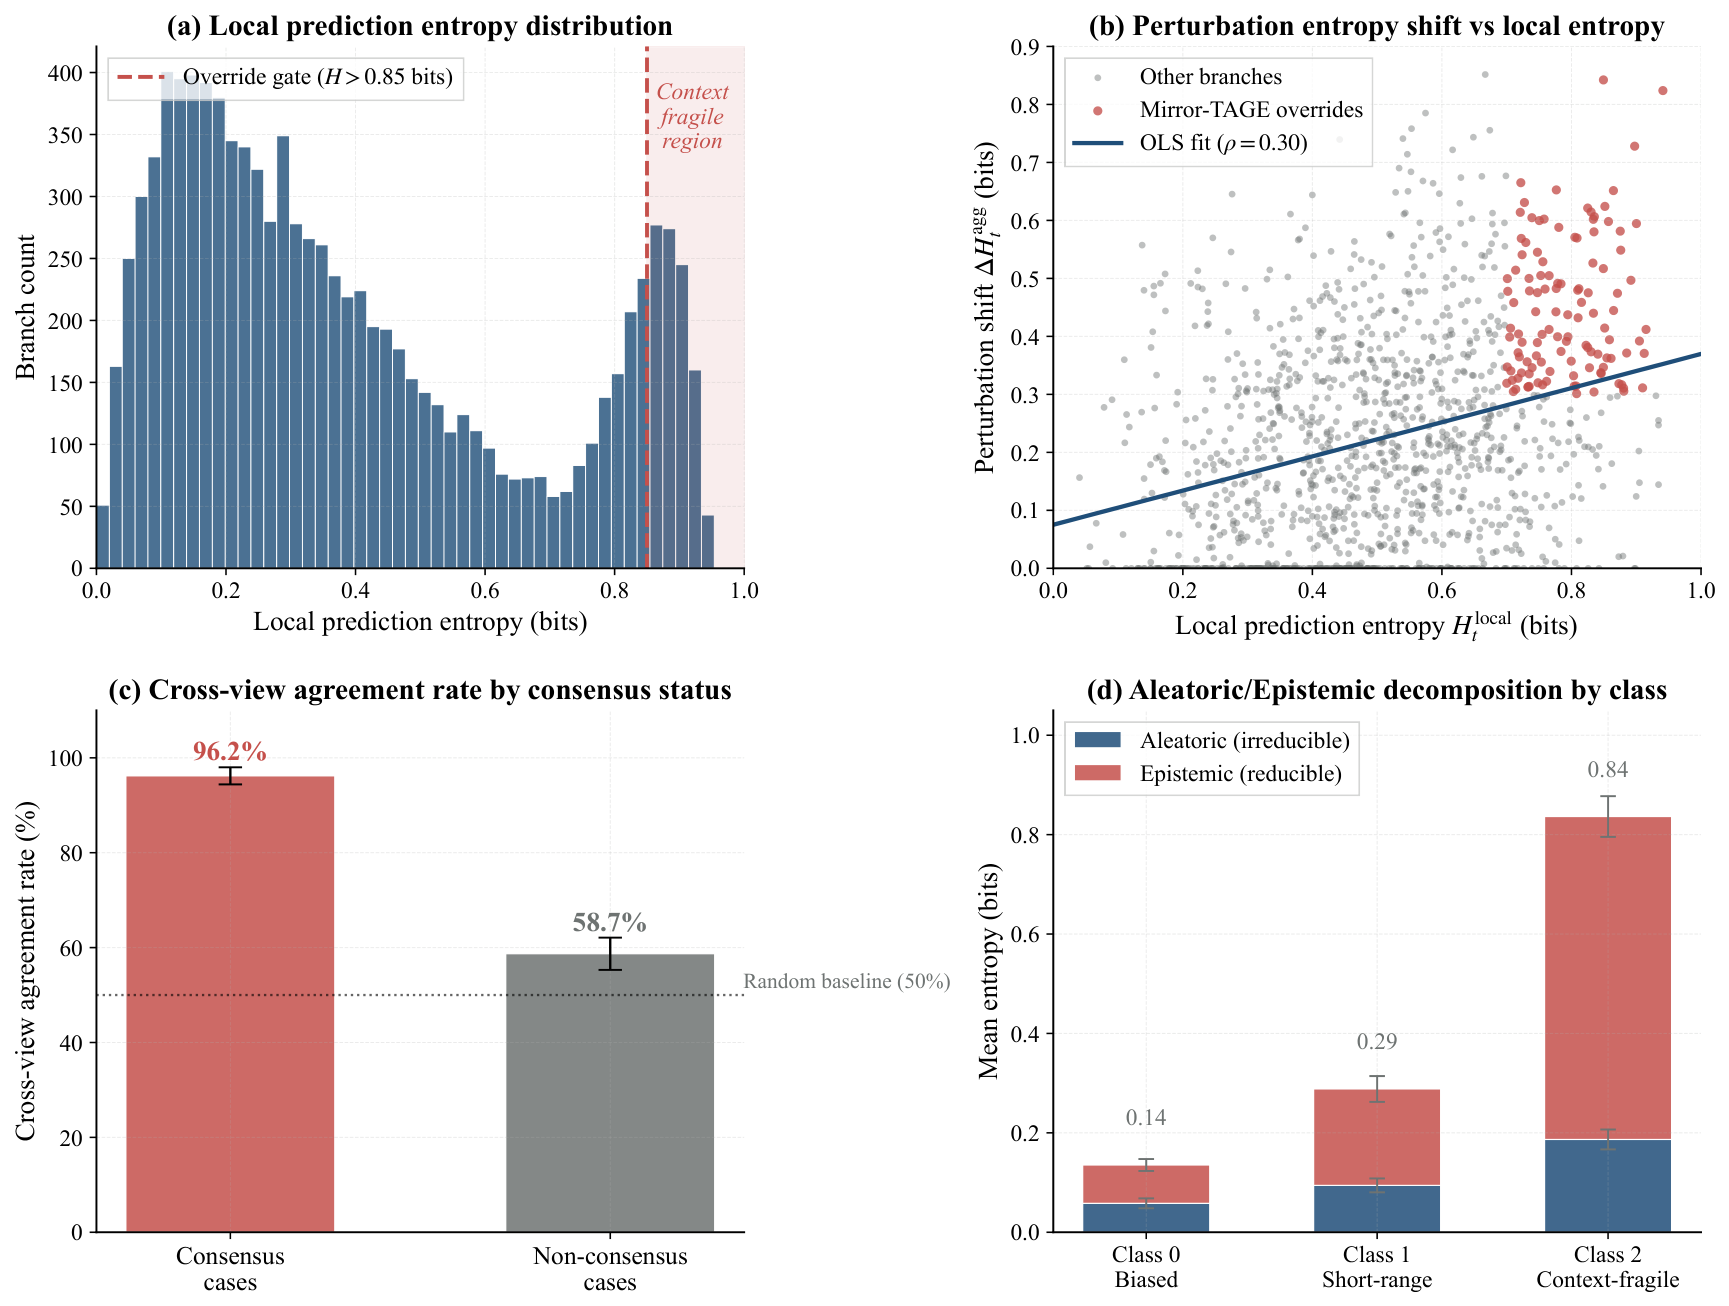
Figure 4.
Information-theoretic characterisation of prediction uncertainty in Mirror-TAGE.
Figure 4.
Information-theoretic characterisation of prediction uncertainty in Mirror-TAGE.
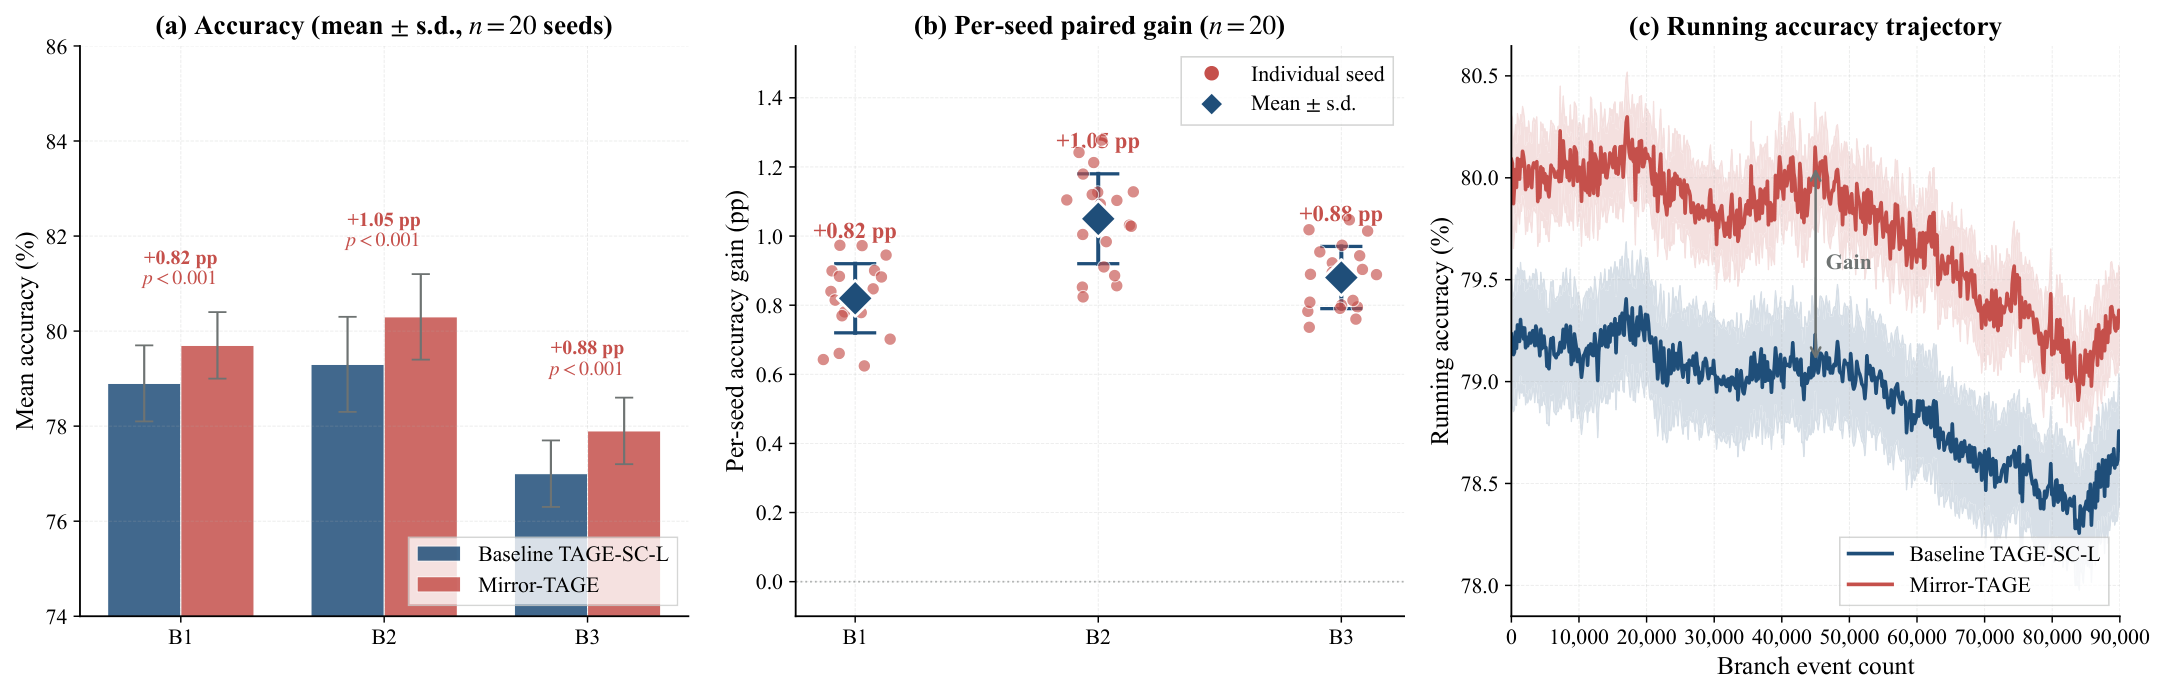
Figure 5.
Accuracy comparison of Mirror-TAGE versus the baseline TAGE-SC-L across the three workloads.
Figure 5.
Accuracy comparison of Mirror-TAGE versus the baseline TAGE-SC-L across the three workloads.
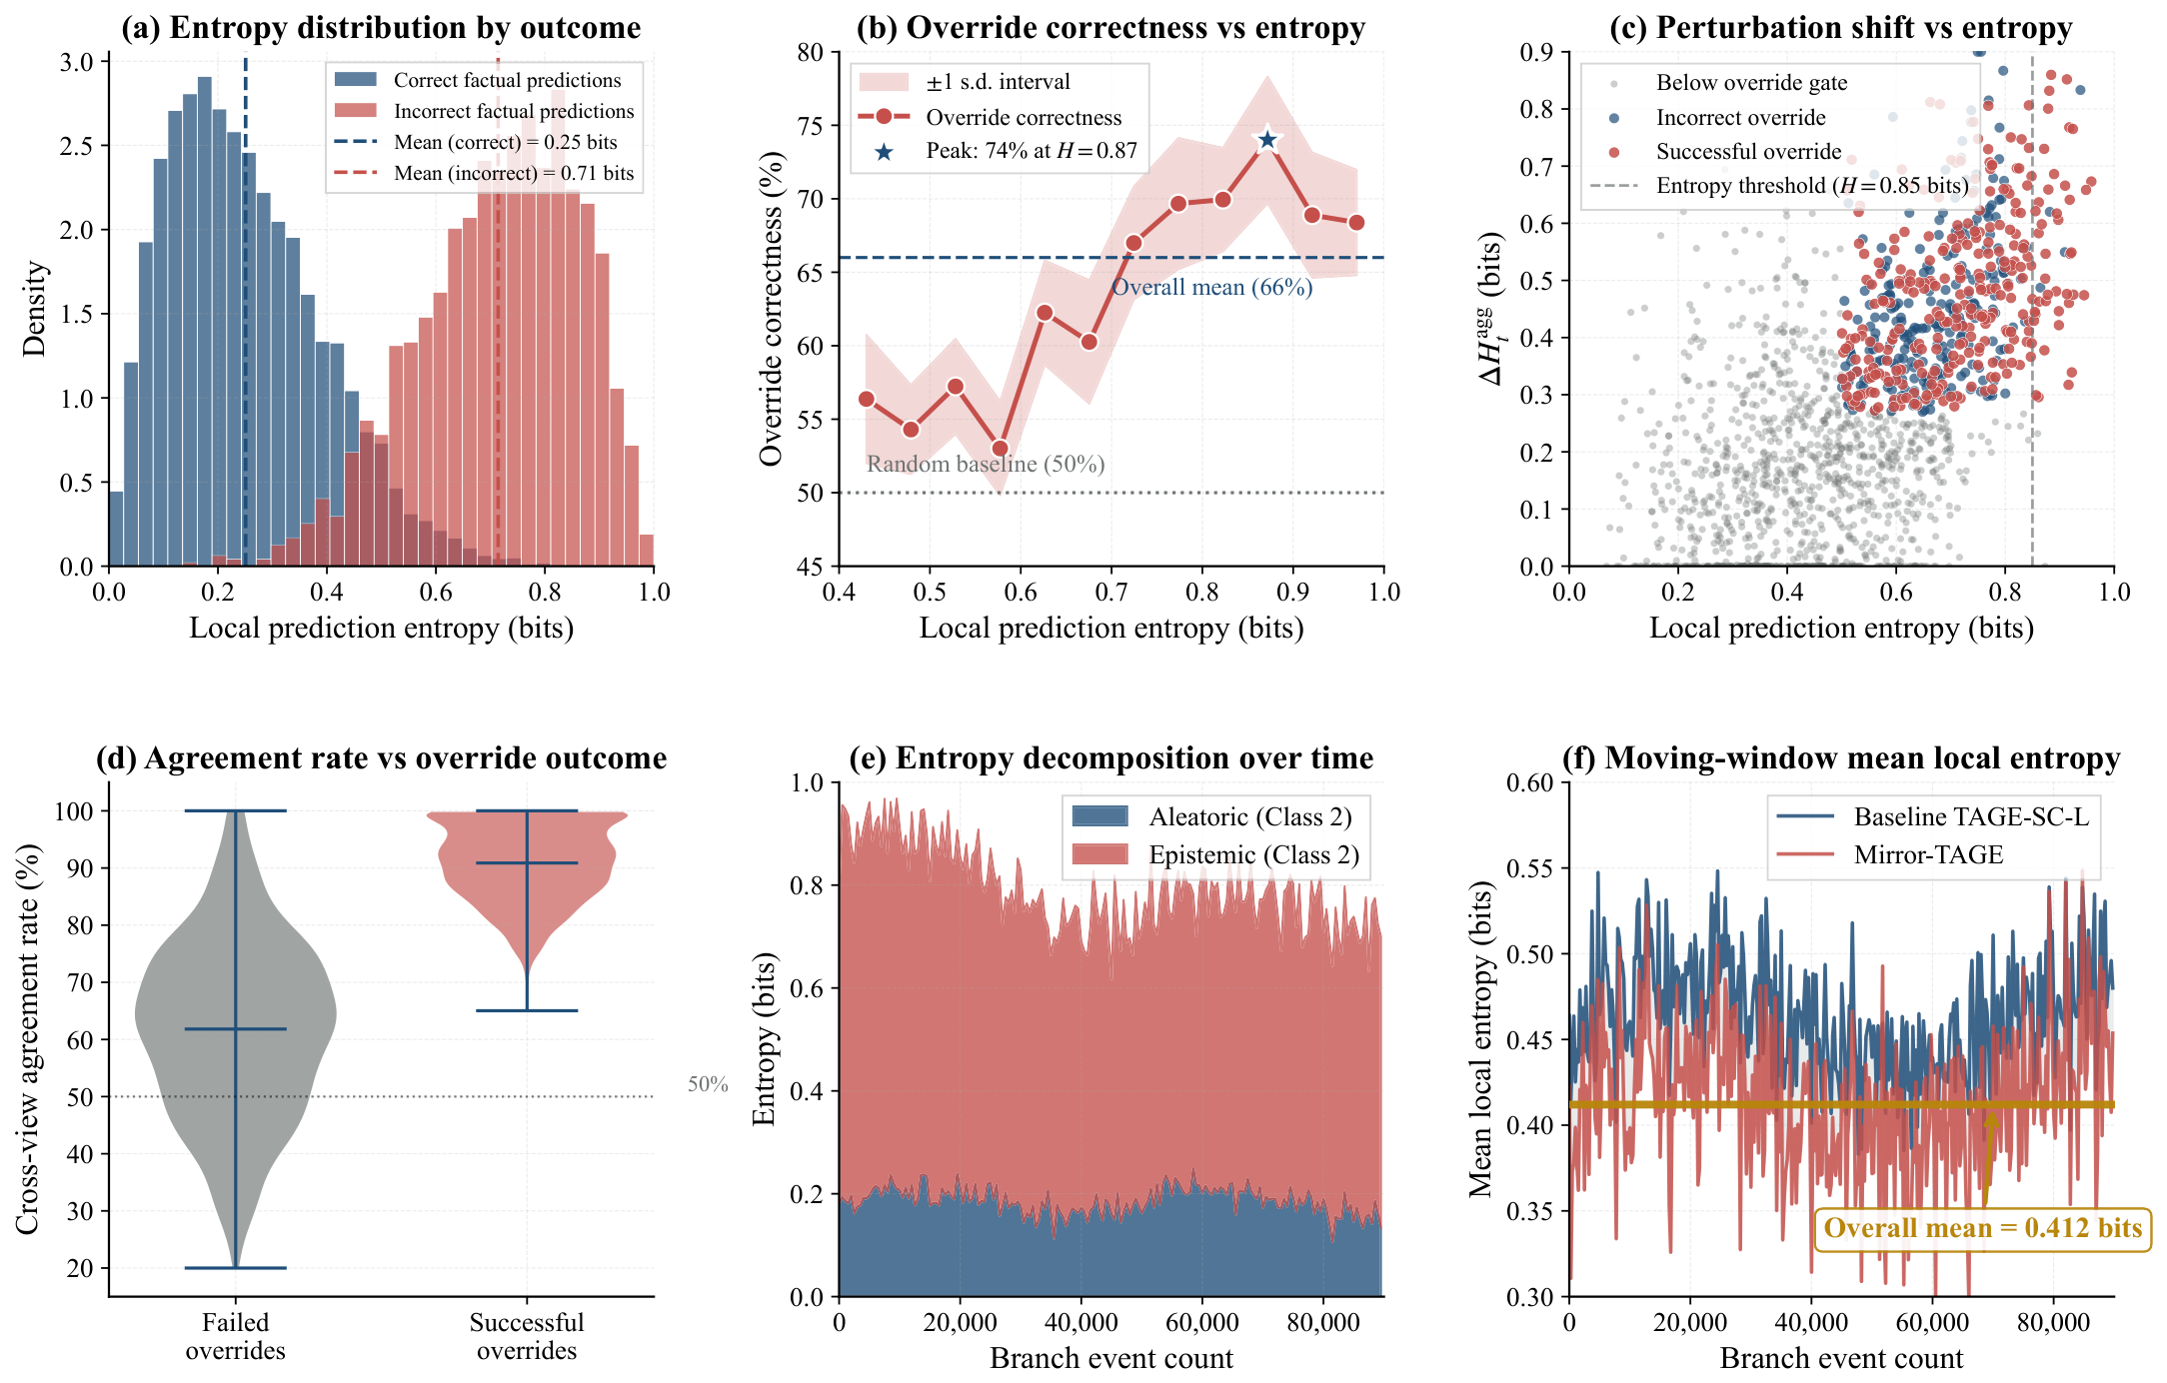
Figure 6.
Empirical characterisation of the entropy landscape for override events.
Figure 6.
Empirical characterisation of the entropy landscape for override events.
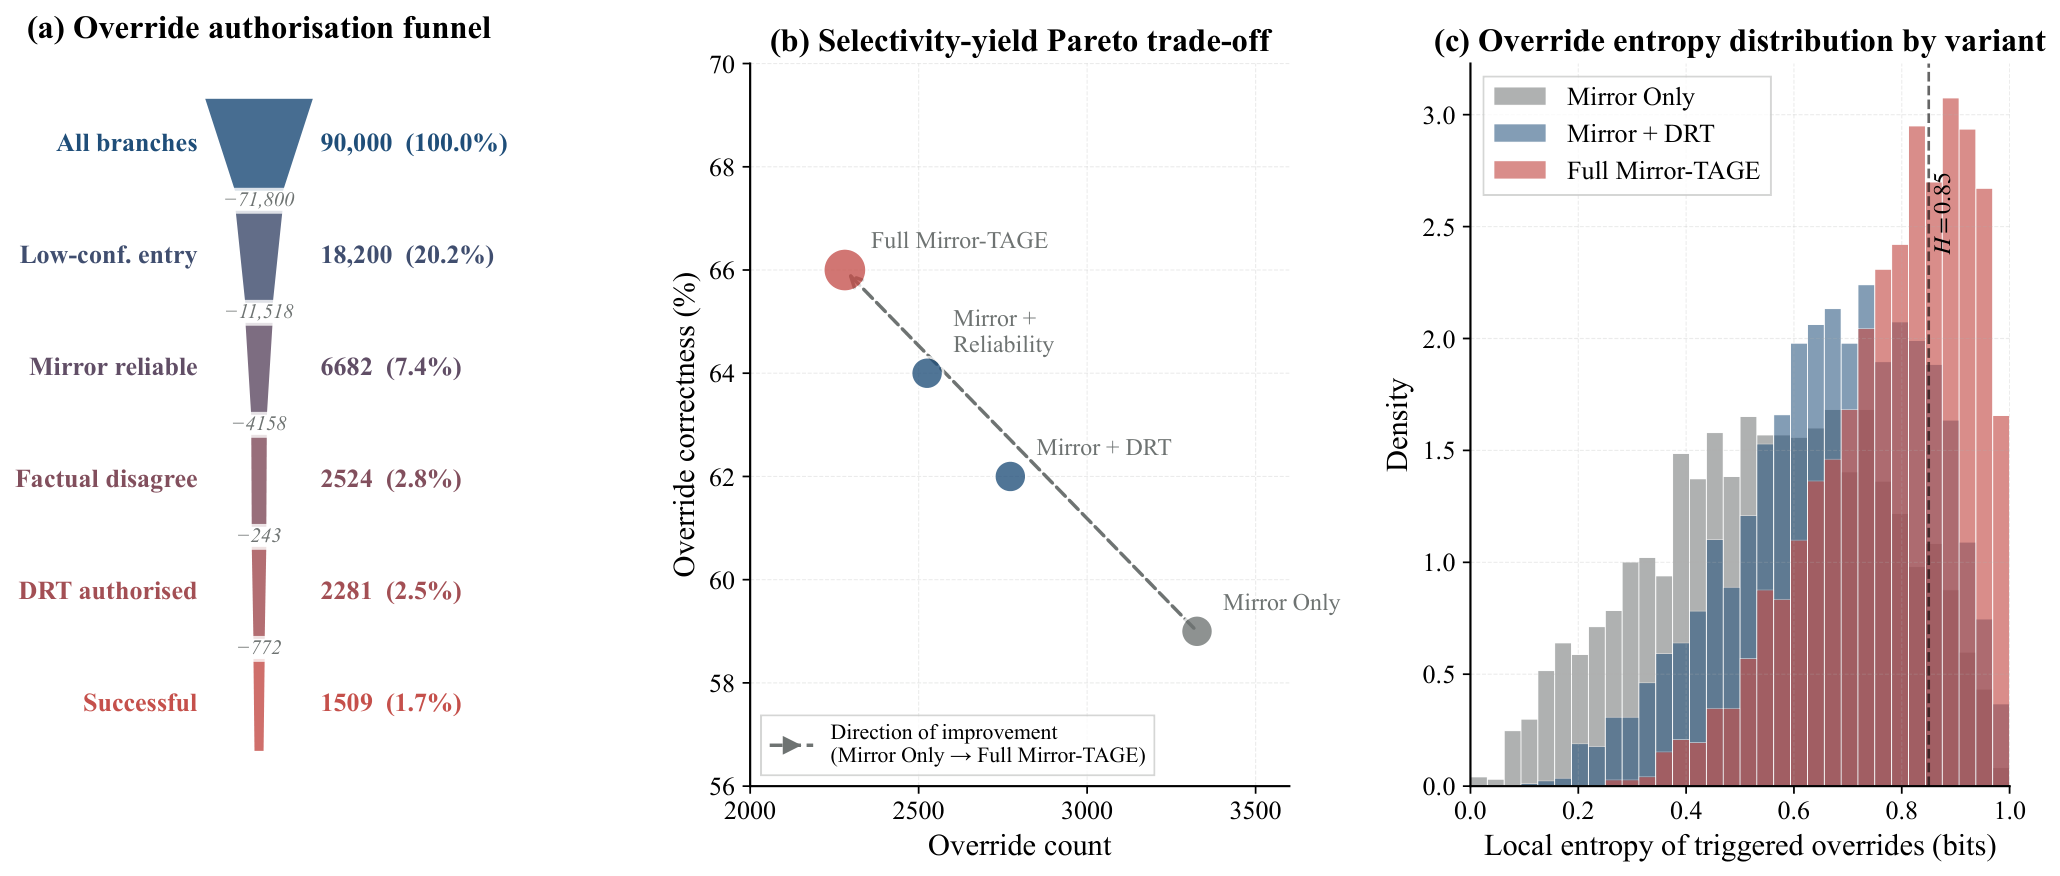
Figure 7.
Override authorisation funnel and selectivity–yield trade-off across ablation variants.
Figure 7.
Override authorisation funnel and selectivity–yield trade-off across ablation variants.
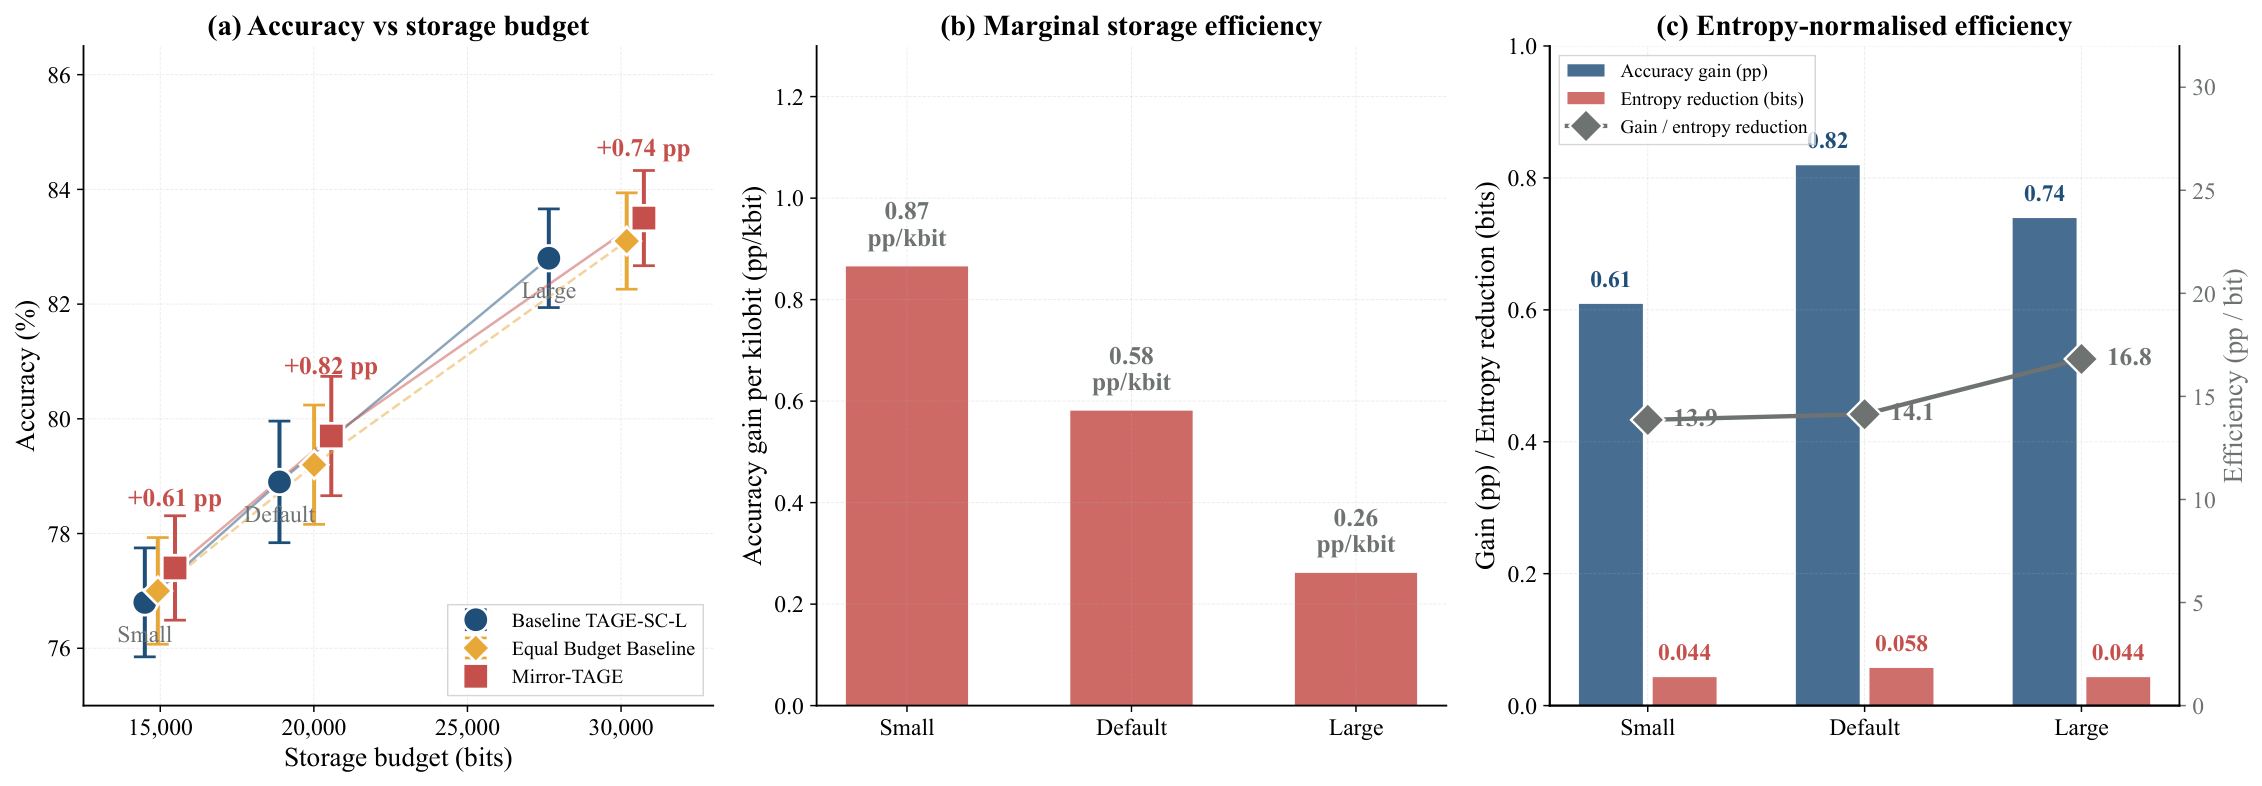
Figure 8.
Capacity–accuracy trade-off across small, default, and large storage budgets.
Figure 8.
Capacity–accuracy trade-off across small, default, and large storage budgets.
Figure 9.
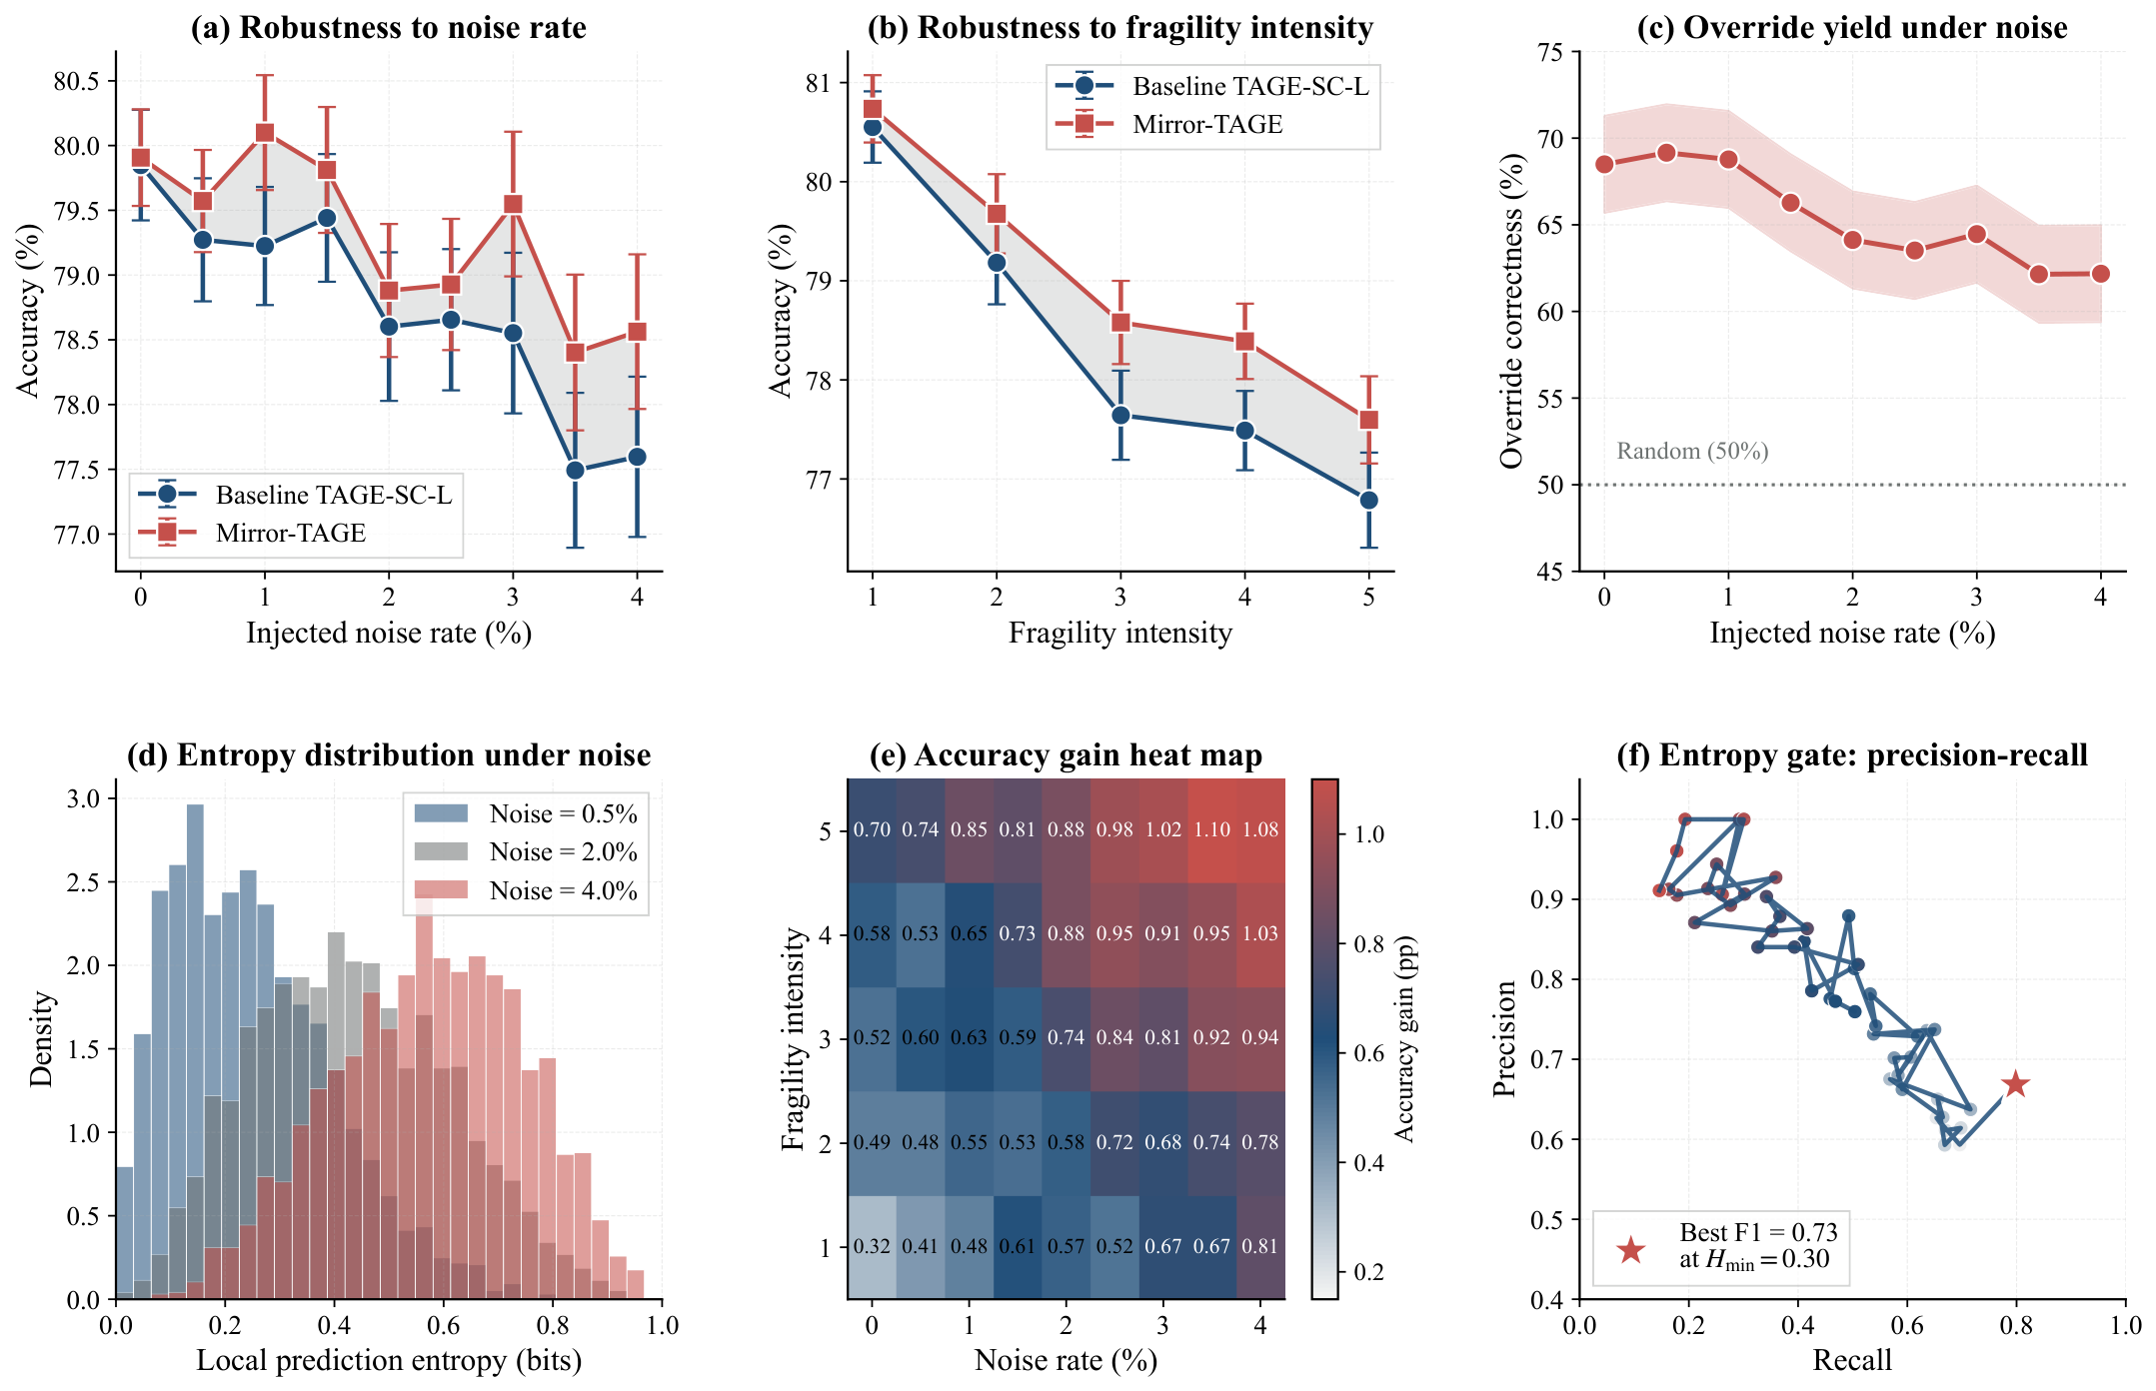
Robustness of Mirror-TAGE under increasing injected noise and fragility intensity. In subfigures (a,b), the gray shaded region denotes the accuracy gap between Mirror-TAGE and Baseline TAGE at each noise or fragility level. In subfigure (c), the red shaded band represents the 95% confidence interval of override correctness across repeated trials. In subfigure (f), the blue line traces the precision–recall curve as the entropy gate threshold varies, and the red star (★) marks the optimal operating point that maximises the F1 score.
Figure 9.
Robustness of Mirror-TAGE under increasing injected noise and fragility intensity. In subfigures (a,b), the gray shaded region denotes the accuracy gap between Mirror-TAGE and Baseline TAGE at each noise or fragility level. In subfigure (c), the red shaded band represents the 95% confidence interval of override correctness across repeated trials. In subfigure (f), the blue line traces the precision–recall curve as the entropy gate threshold varies, and the red star (★) marks the optimal operating point that maximises the F1 score.
Figure 10.
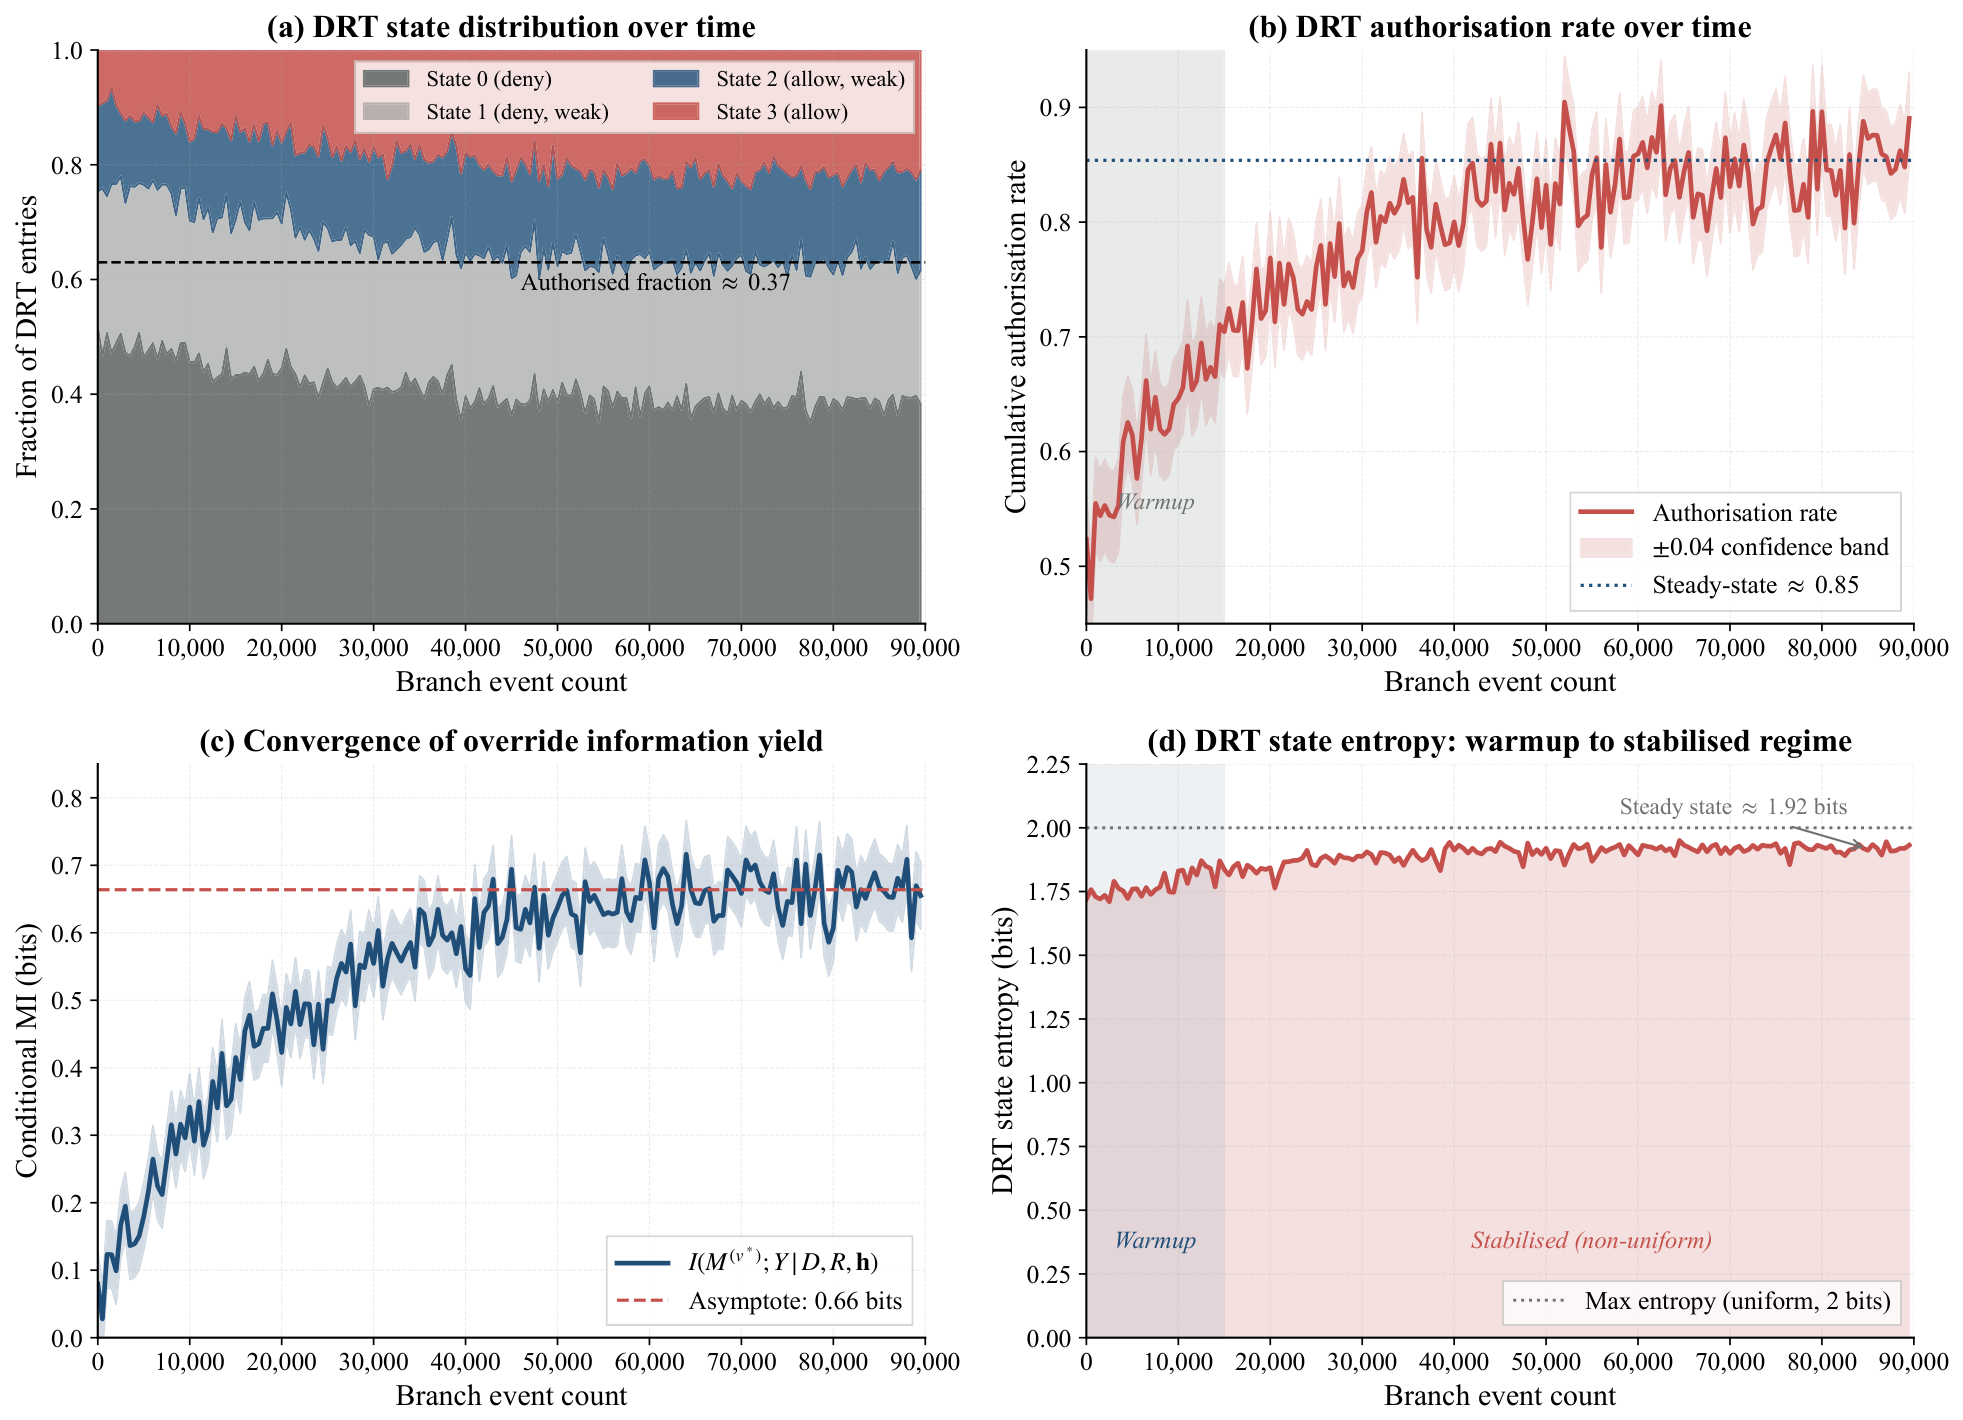
Learning dynamics of the Disagreement Replay Table over time. In subfigure (b), the red line represents the cumulative authorisation rate and the red shaded band denotes its ±0.04 confidence interval.
Figure 10.
Learning dynamics of the Disagreement Replay Table over time. In subfigure (b), the red line represents the cumulative authorisation rate and the red shaded band denotes its ±0.04 confidence interval.
Figure 11.
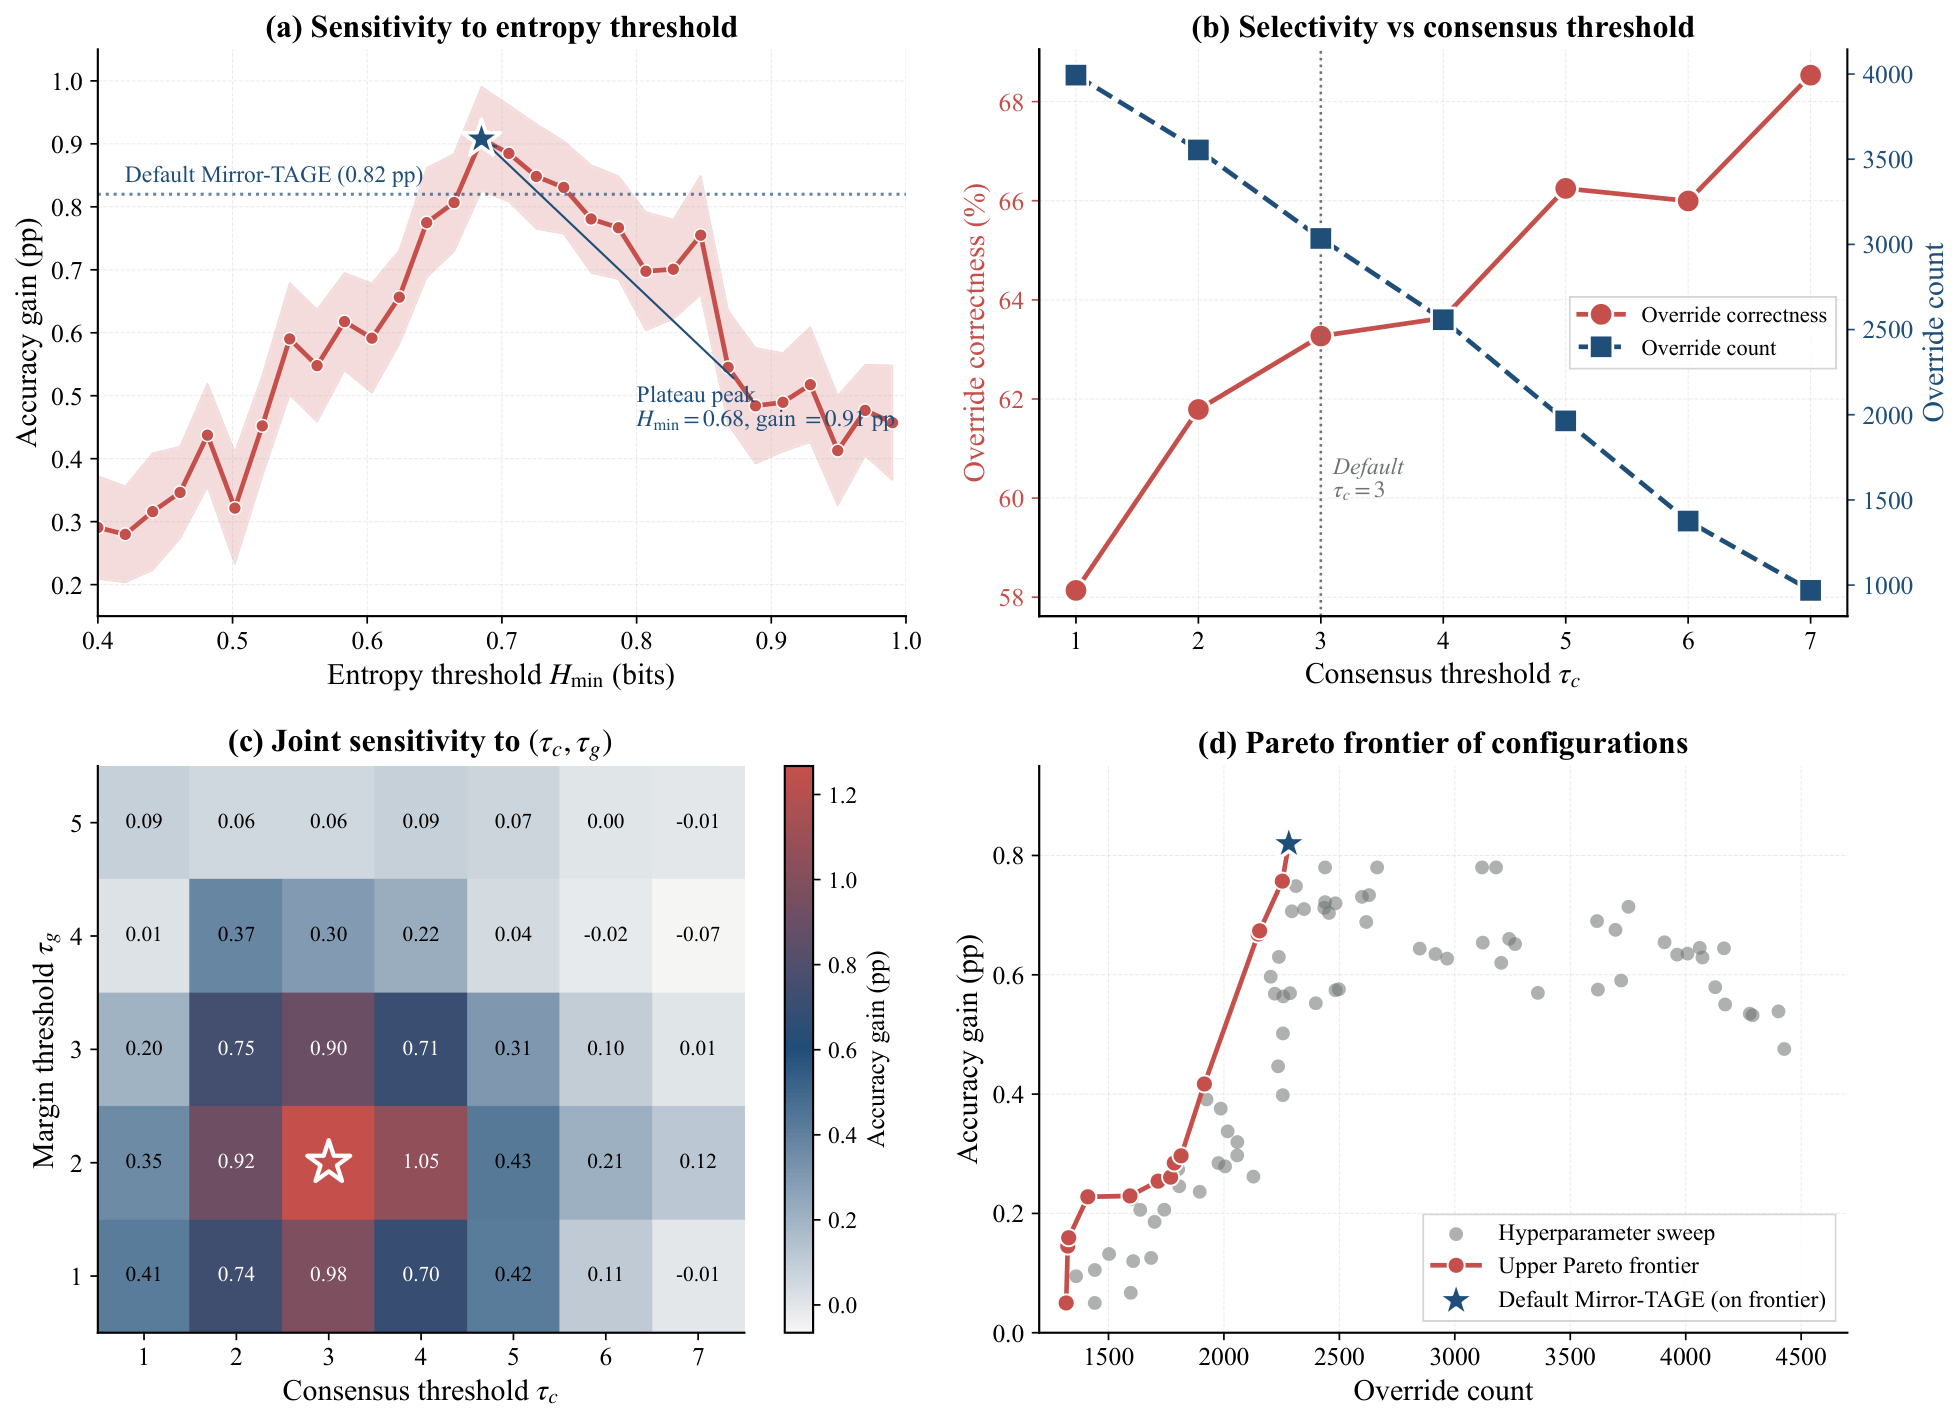
Sensitivity of Mirror-TAGE to the entropy and consensus thresholds and the resulting Pareto frontier of configurations. In subfigure (a), the pink shaded band denotes the 95% confidence interval of the accuracy gain; the blue dotted horizontal line indicates the default Mirror-TAGE performance; and the blue star (★) marks the plateau peak at . In subfigure (c), the white star (★) identifies the optimal joint configuration.
Figure 11.
Sensitivity of Mirror-TAGE to the entropy and consensus thresholds and the resulting Pareto frontier of configurations. In subfigure (a), the pink shaded band denotes the 95% confidence interval of the accuracy gain; the blue dotted horizontal line indicates the default Mirror-TAGE performance; and the blue star (★) marks the plateau peak at . In subfigure (c), the white star (★) identifies the optimal joint configuration.
Table 1.
Comparison with representative TAGE family predictors along dimensions relevant to counterfactual stability modelling.
Table 1.
Comparison with representative TAGE family predictors along dimensions relevant to counterfactual stability modelling.
| Predictor | Mixed History | Statistical | Counterfactual | Entropy | Selective | Information |
|---|
| | Views | Correction | Stability | Analysis | Override | Theoretic |
|---|
| L-TAGE [2] | Limited | No | No | No | No | No |
| GL-TAGE [6] | Yes | No | No | No | No | No |
| TAGE-SC-L [4,5] | Limited | Yes | No | No | No | No |
| MTAGE+SC [7] | Yes | Yes | No | No | No | No |
| Multiperspective Perceptron [8] | Yes | Yes | No | No | No | No |
| Mirror-TAGE (this work) | Yes | Yes | Yes | Yes | Yes | Yes |
Table 2.
Default predictor parameters.
Table 2.
Default predictor parameters.
| Component | Parameter | Value |
|---|
| Global history | GHR length | 64 bits |
| Base predictor | Base table size | 512 entries |
| Tagged path | Tagged banks | 4 |
| Tagged path | History lengths | 4, 8, 16, 32 |
| Tagged path | Entries per tagged bank | 256 |
| Tagged path | Tag width | 10 bits |
| Alternate choice logic | Use-alt table size | 128 entries |
| Statistical corrector | Tables/history lengths | 3/8, 16, 32 |
| Statistical corrector | Entries per SC table | 128 |
| Statistical corrector | Activation threshold | 5 |
| Mirror path | Mirror tables/history lengths | 3/4, 8, 16 |
| Mirror path | Entries per mirror table | 128 |
| Reliability control | Consensus threshold | 3 |
| Reliability control | Margin threshold | 2 |
| Reliability control | Gap threshold | 2 |
| Reliability control | High-confidence threshold | 9 |
| Replay control | DRT size | 128 entries |
| Replay control | DRT authorisation threshold | 2 |
Table 3.
Main workload configurations.
Table 3.
Main workload configurations.
| Workload | Class Mix | Noise | Fragile | Total | Warmup | Measured |
|---|
| | (C0/C1/C2) | Rate | Intensity | Events | | Events |
|---|
| B1 | 4/16/44 | 1.0% | 2 | 120,000 | 30,000 | 90,000 |
| B2 | 12/22/30 | 1.5% | 2 | 120,000 | 30,000 | 90,000 |
| B3 | 8/16/40 | 3.0% | 3 | 120,000 | 30,000 | 90,000 |
Table 4.
Main results across workloads (mean ± standard deviation, seeds).
Table 4.
Main results across workloads (mean ± standard deviation, seeds).
| Workload | Baseline | Mirror-TAGE | Absolute | p Value | Override | Override | 95% CI |
|---|
| | Accuracy | Accuracy | Gain | | Count | Correctness | (pp) |
|---|
| B1 | 78.9 ± 0.8% | 79.7 ± 0.7% | 0.82 pp | < | 2281 | 66.1% | [0.62, 1.01] |
| B2 | 79.3 ± 1.0% | 80.3 ± 0.9% | 1.05 pp | < | 2392 | 69.7% | [0.79, 1.30] |
| B3 | 77.0 ± 0.7% | 77.9 ± 0.7% | 0.88 pp | < | 2610 | 65.3% | [0.70, 1.06] |
Table 5.
Information entropy statistics on SAFE_TUNE_B1 (mean over twenty seeds, rounded to two significant figures).
Table 5.
Information entropy statistics on SAFE_TUNE_B1 (mean over twenty seeds, rounded to two significant figures).
| Metric | Value |
|---|
| Mean local prediction entropy (all branches) | 0.41 bits |
| Mean local entropy (override events only) | 0.89 bits |
| Mean local entropy (successful overrides) | 0.93 bits |
| Mean perturbation entropy shift | 0.23 bits |
| Cross-view agreement rate (consensus cases) | 96% |
| Cross-view agreement rate (non-consensus cases) | 59% |
| Fraction of overrides with bits | 78% |
| Aleatoric entropy (Class 2 mean) | 0.19 bits |
| Epistemic entropy (Class 2 mean) | 0.65 bits |
Table 6.
Class-wise accuracy on SAFE_TUNE_B1.
Table 6.
Class-wise accuracy on SAFE_TUNE_B1.
| Metric | Baseline | Mirror-TAGE | Gain |
|---|
| Class 0 accuracy (Biased) | 98.6% | 98.6% | 0.02 pp |
| Class 1 accuracy (Short-Range) | 88.2% | 88.4% | 0.2 pp |
| Class 2 accuracy (Context-Fragile) | 73.7% | 74.8% | 1.1 pp |
Table 7.
Ablation study on SAFE_TUNE_B1.
Table 7.
Ablation study on SAFE_TUNE_B1.
| Variant | Accuracy | Gain vs. Baseline | Override Count | Override Correctness |
|---|
| Baseline | 78.9% | – | 0 | – |
| Mirror Only | 79.6% | 0.67 pp | 3326 | 59.1% |
| Mirror + Reliability | 79.7% | 0.79 pp | 2525 | 64.1% |
| Mirror + DRT | 79.6% | 0.74 pp | 2772 | 61.9% |
| Full Mirror-TAGE | 79.7% | 0.82 pp | 2281 | 66.1% |
Table 8.
Capacity sensitivity on SAFE_TUNE_B1.
Table 8.
Capacity sensitivity on SAFE_TUNE_B1.
| Scale | Predictor | Accuracy | Storage Bits | Gain |
|---|
| Small | Baseline | 76.8% | 14,496 | – |
| Small | Equal Budget Baseline | 77.0% | 15,200 | 0.28 pp |
| Small | Mirror-TAGE | 77.4% | 15,200 | 0.61 pp |
| Default | Baseline | 78.9% | 18,880 | – |
| Default | Equal Budget Baseline | 79.2% | 20,288 | 0.28 pp |
| Default | Mirror-TAGE | 79.7% | 20,288 | 0.82 pp |
| Large | Baseline | 82.8% | 27,648 | – |
| Large | Equal Budget Baseline | 83.1% | 30,464 | 0.32 pp |
| Large | Mirror-TAGE | 83.5% | 30,464 | 0.74 pp |
Table 9.
Entry gate ablation on SAFE_TUNE_B1 (mean over twenty seeds).
Table 9.
Entry gate ablation on SAFE_TUNE_B1 (mean over twenty seeds).
| Metric | With Gate () | Without Gate |
|---|
| Total overrides | 2281 | 5840 |
| Overall override correctness | 66.1% | 54.2% |
| Fraction of overrides with bits | 78% | 41% |
| Override correctness at bits | 69.3% | 63.7% |
| Override correctness at bits | 52.1% | 47.6% |
| Net accuracy gain | 0.82 pp | 0.24 pp |
Table 10.
Preliminary results on SPEC CPU 2017 traces (mean ± standard deviation, seeds).
Table 10.
Preliminary results on SPEC CPU 2017 traces (mean ± standard deviation, seeds).
| Benchmark | Baseline | Mirror-TAGE | Absolute | Override | Override | Override |
|---|
| | Accuracy | Accuracy | Gain | Freq. (%) | Correctness | Count |
|---|
| perlbench | 96.4 ± 0.1% | 96.7 ± 0.1% | 0.26 pp | 1.4% | 61% | ∼1100 |
| gcc | 95.2 ± 0.1% | 95.6 ± 0.1% | 0.38 pp | 1.9% | 60% | ∼1500 |
| mcf | 93.7 ± 0.2% | 93.9 ± 0.1% | 0.21 pp | 1.6% | 57% | ∼1300 |
| deepsjeng | 97.8 ± 0.1% | 97.9 ± 0.1% | 0.04 pp | 0.8% | 55% | ∼640 |
| xalancbmk | 94.9 ± 0.1% | 95.2 ± 0.1% | 0.26 pp | 1.7% | 59% | ∼1400 |
| x264 | 97.2 ± 0.1% | 97.3 ± 0.1% | 0.13 pp | 1.1% | 57% | ∼880 |
| Mean | 95.9% | 96.1% | 0.21 pp | 1.4% | 58% | ∼1100 |