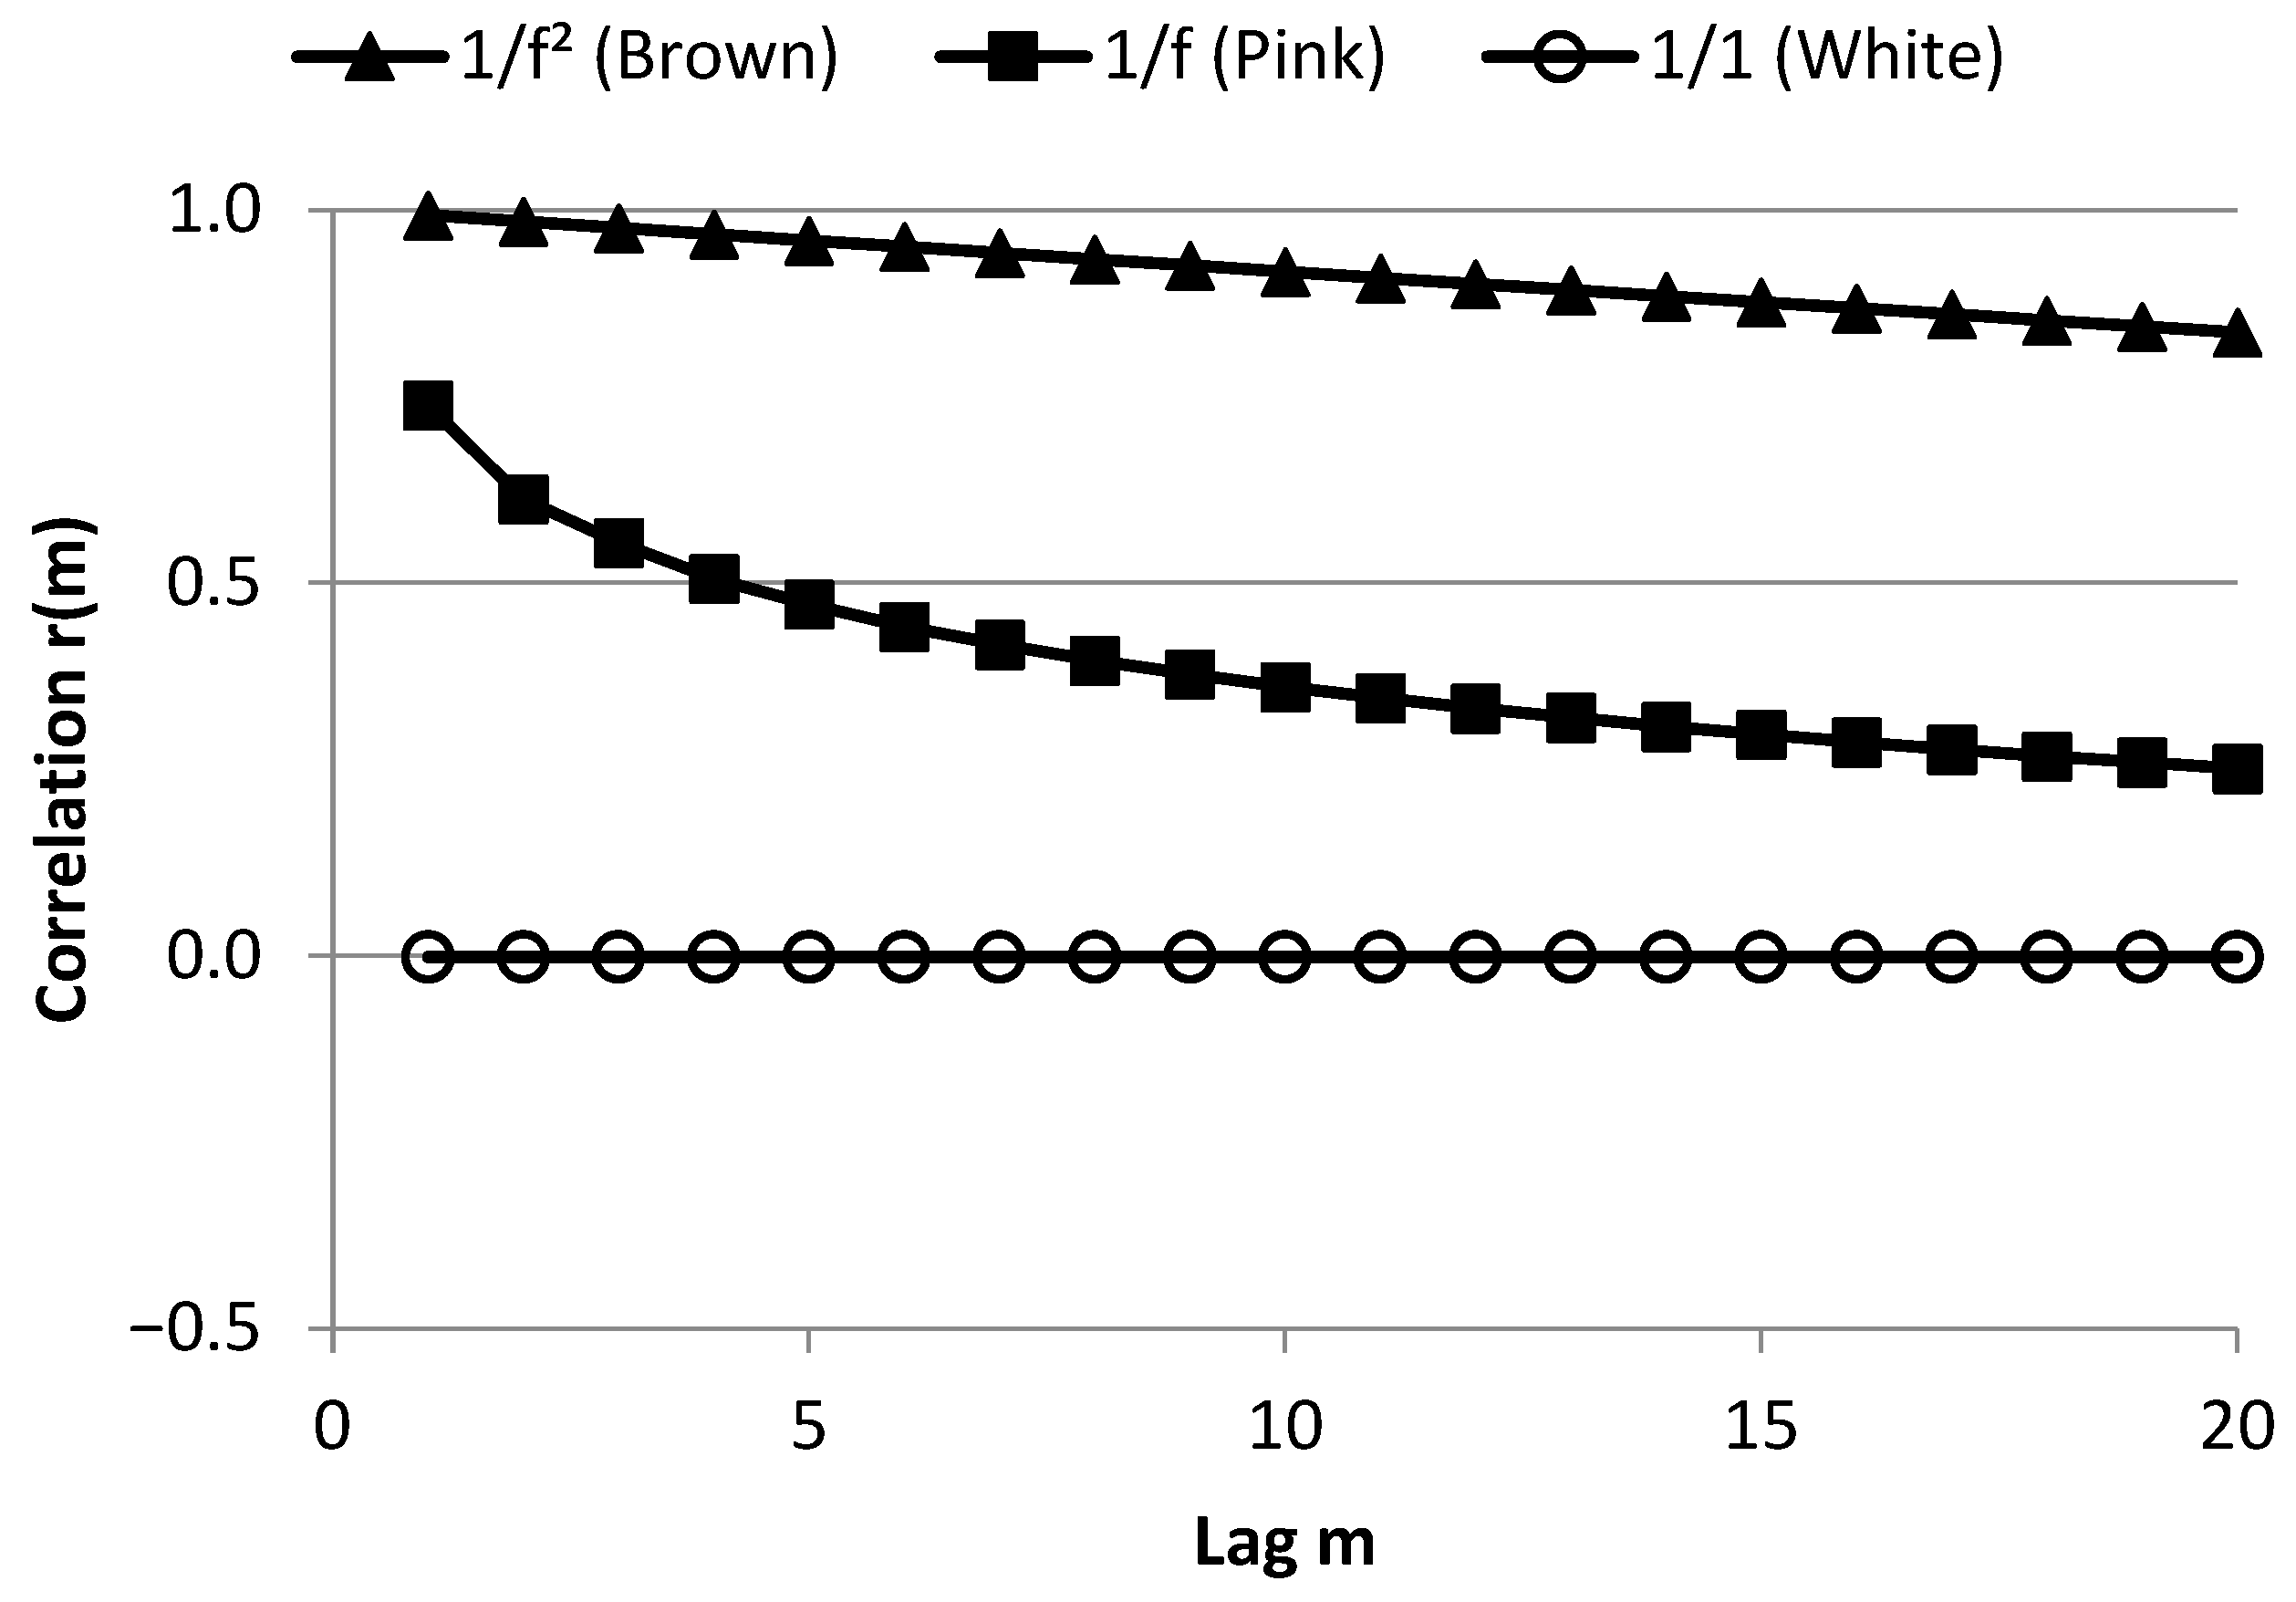
Overview of Mathematical Relations Between Poincaré Plot Measures and Time and Frequency Domain Measures of Heart Rate Variability
Abstract
1. Introduction
2. Materials and Methods
2.1. Tools for Part I: Time Domain
2.2. Tools for Part II: Frequency Domain
3. Results
3.1. Part I: Time Domain
3.1.1. The Expected Value Approach (Brennan’s Findings)
3.1.2. Relation RMSSD, SDSD, and SD1
3.1.3. Derived Measures SD1/SD2, SDSD/SDNN, and Ellipse Area
- For the ratio SDSD/SDNN, we find the following:
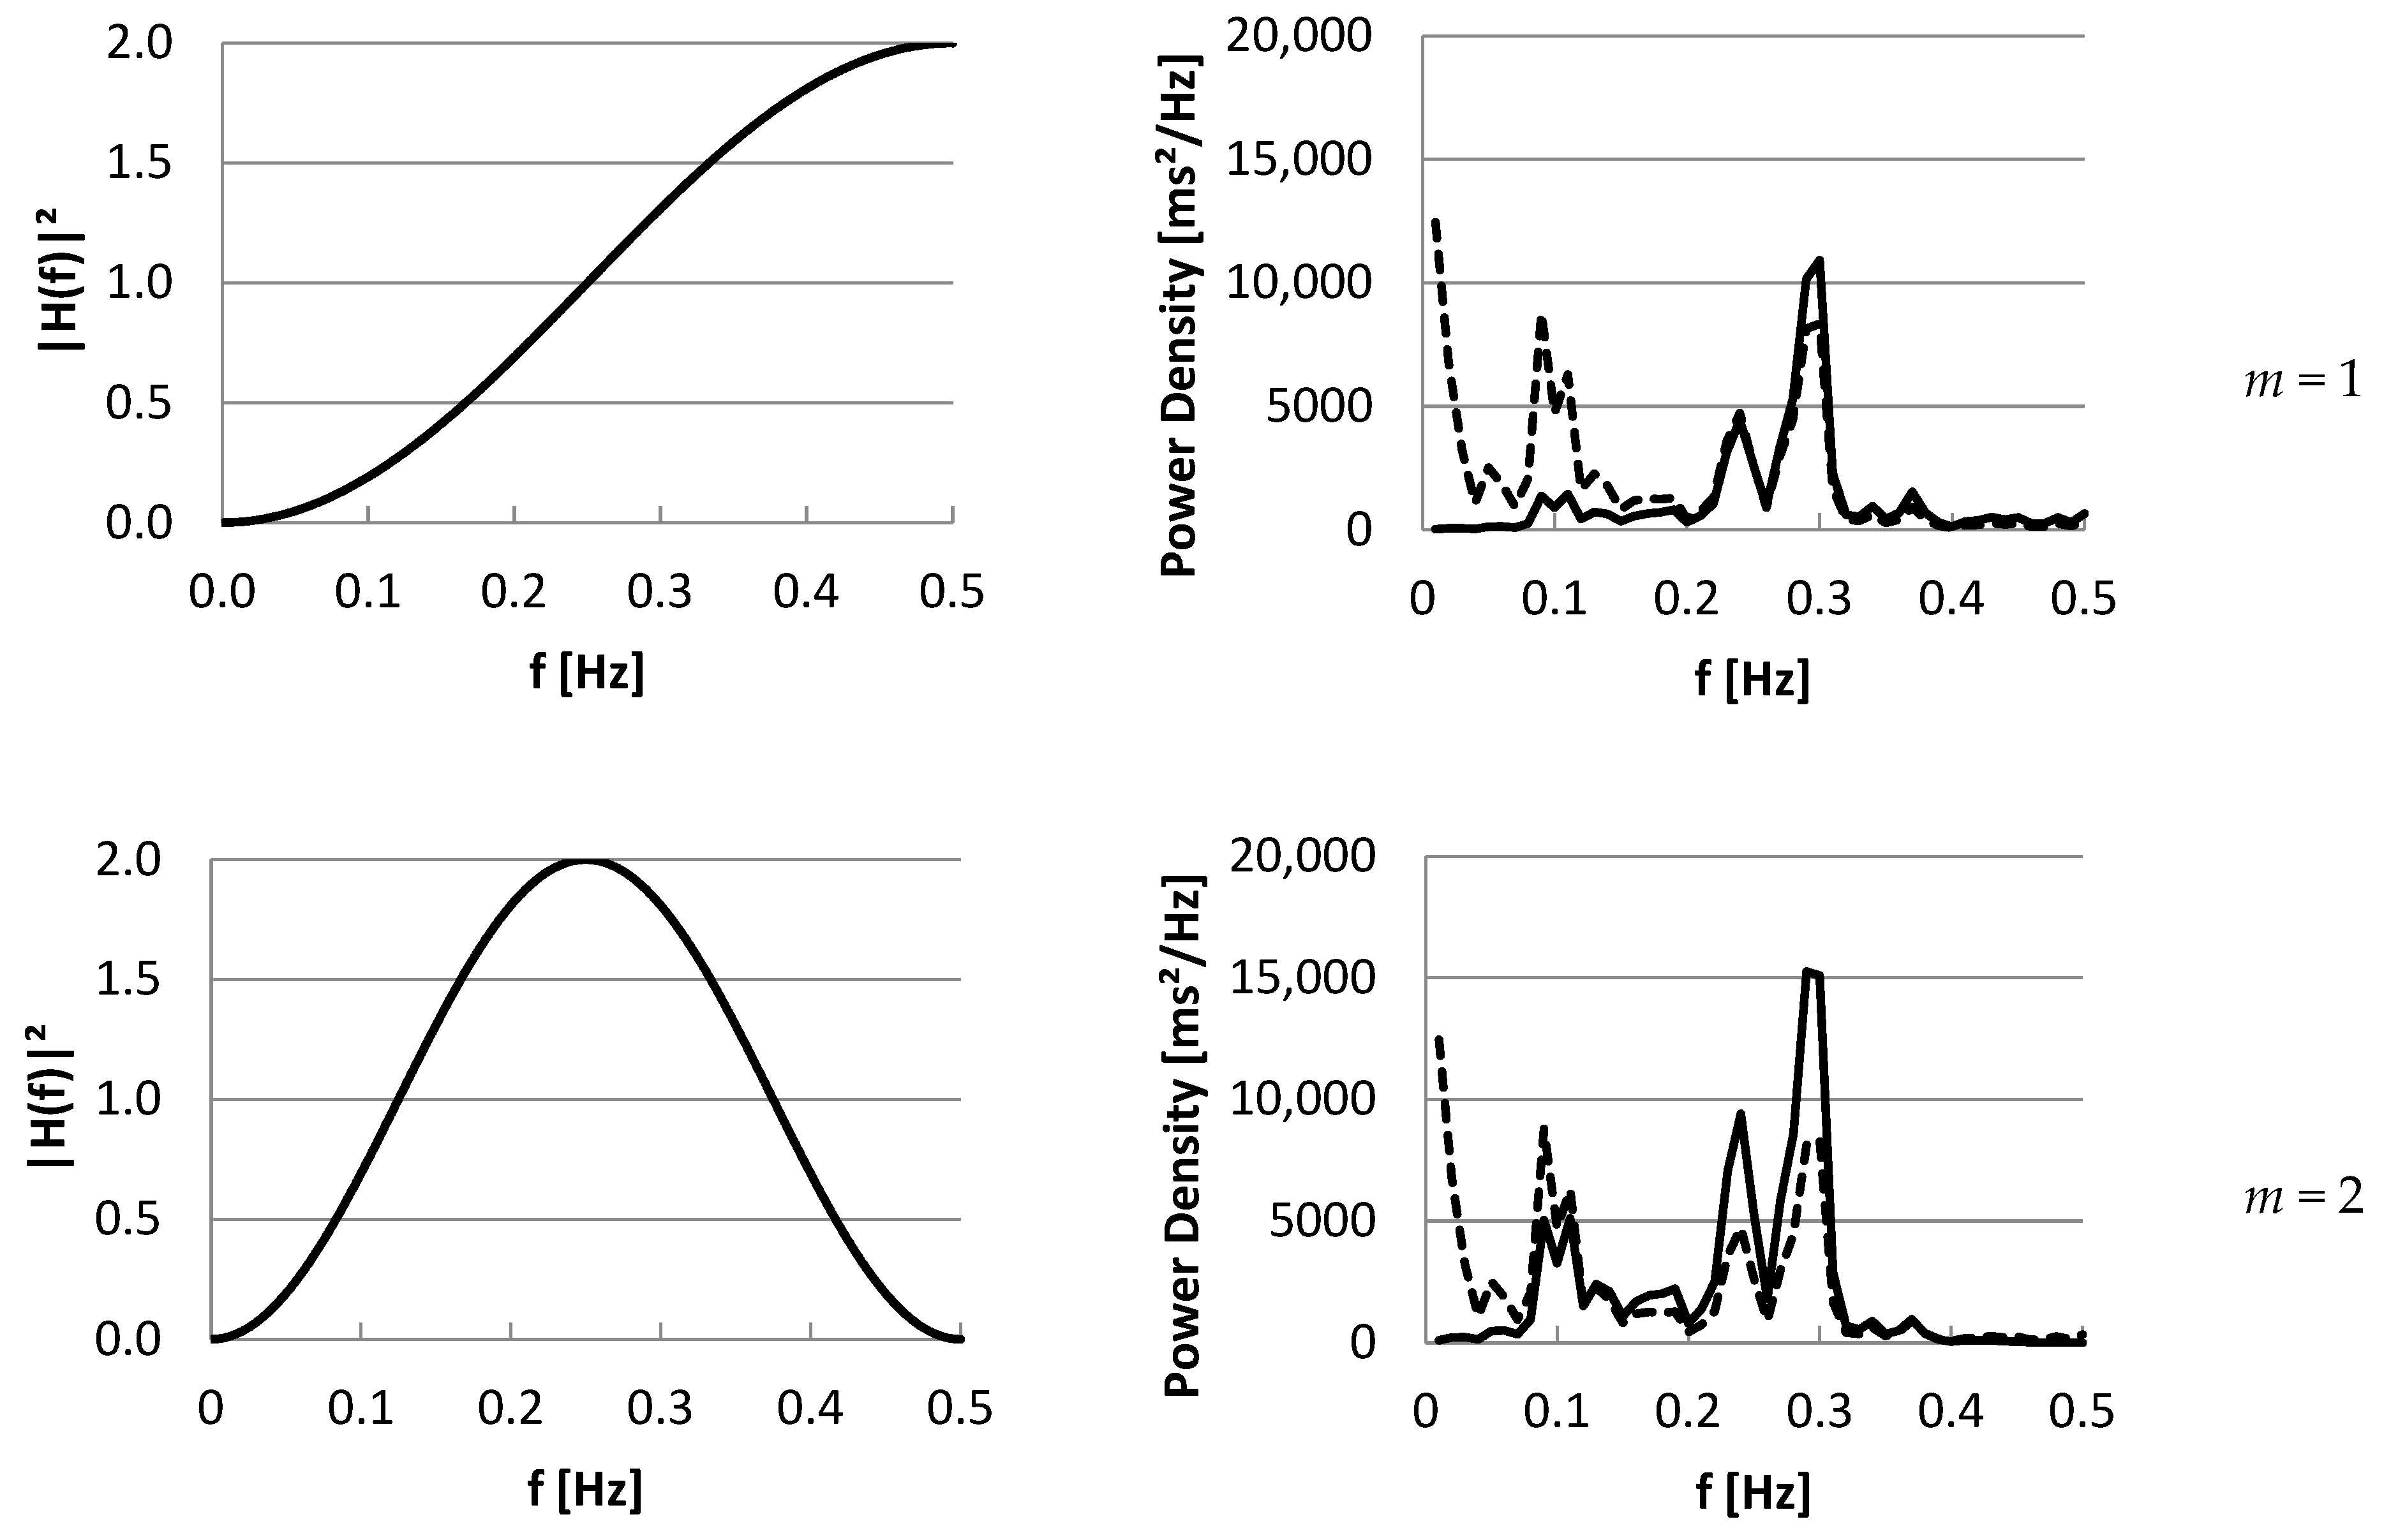
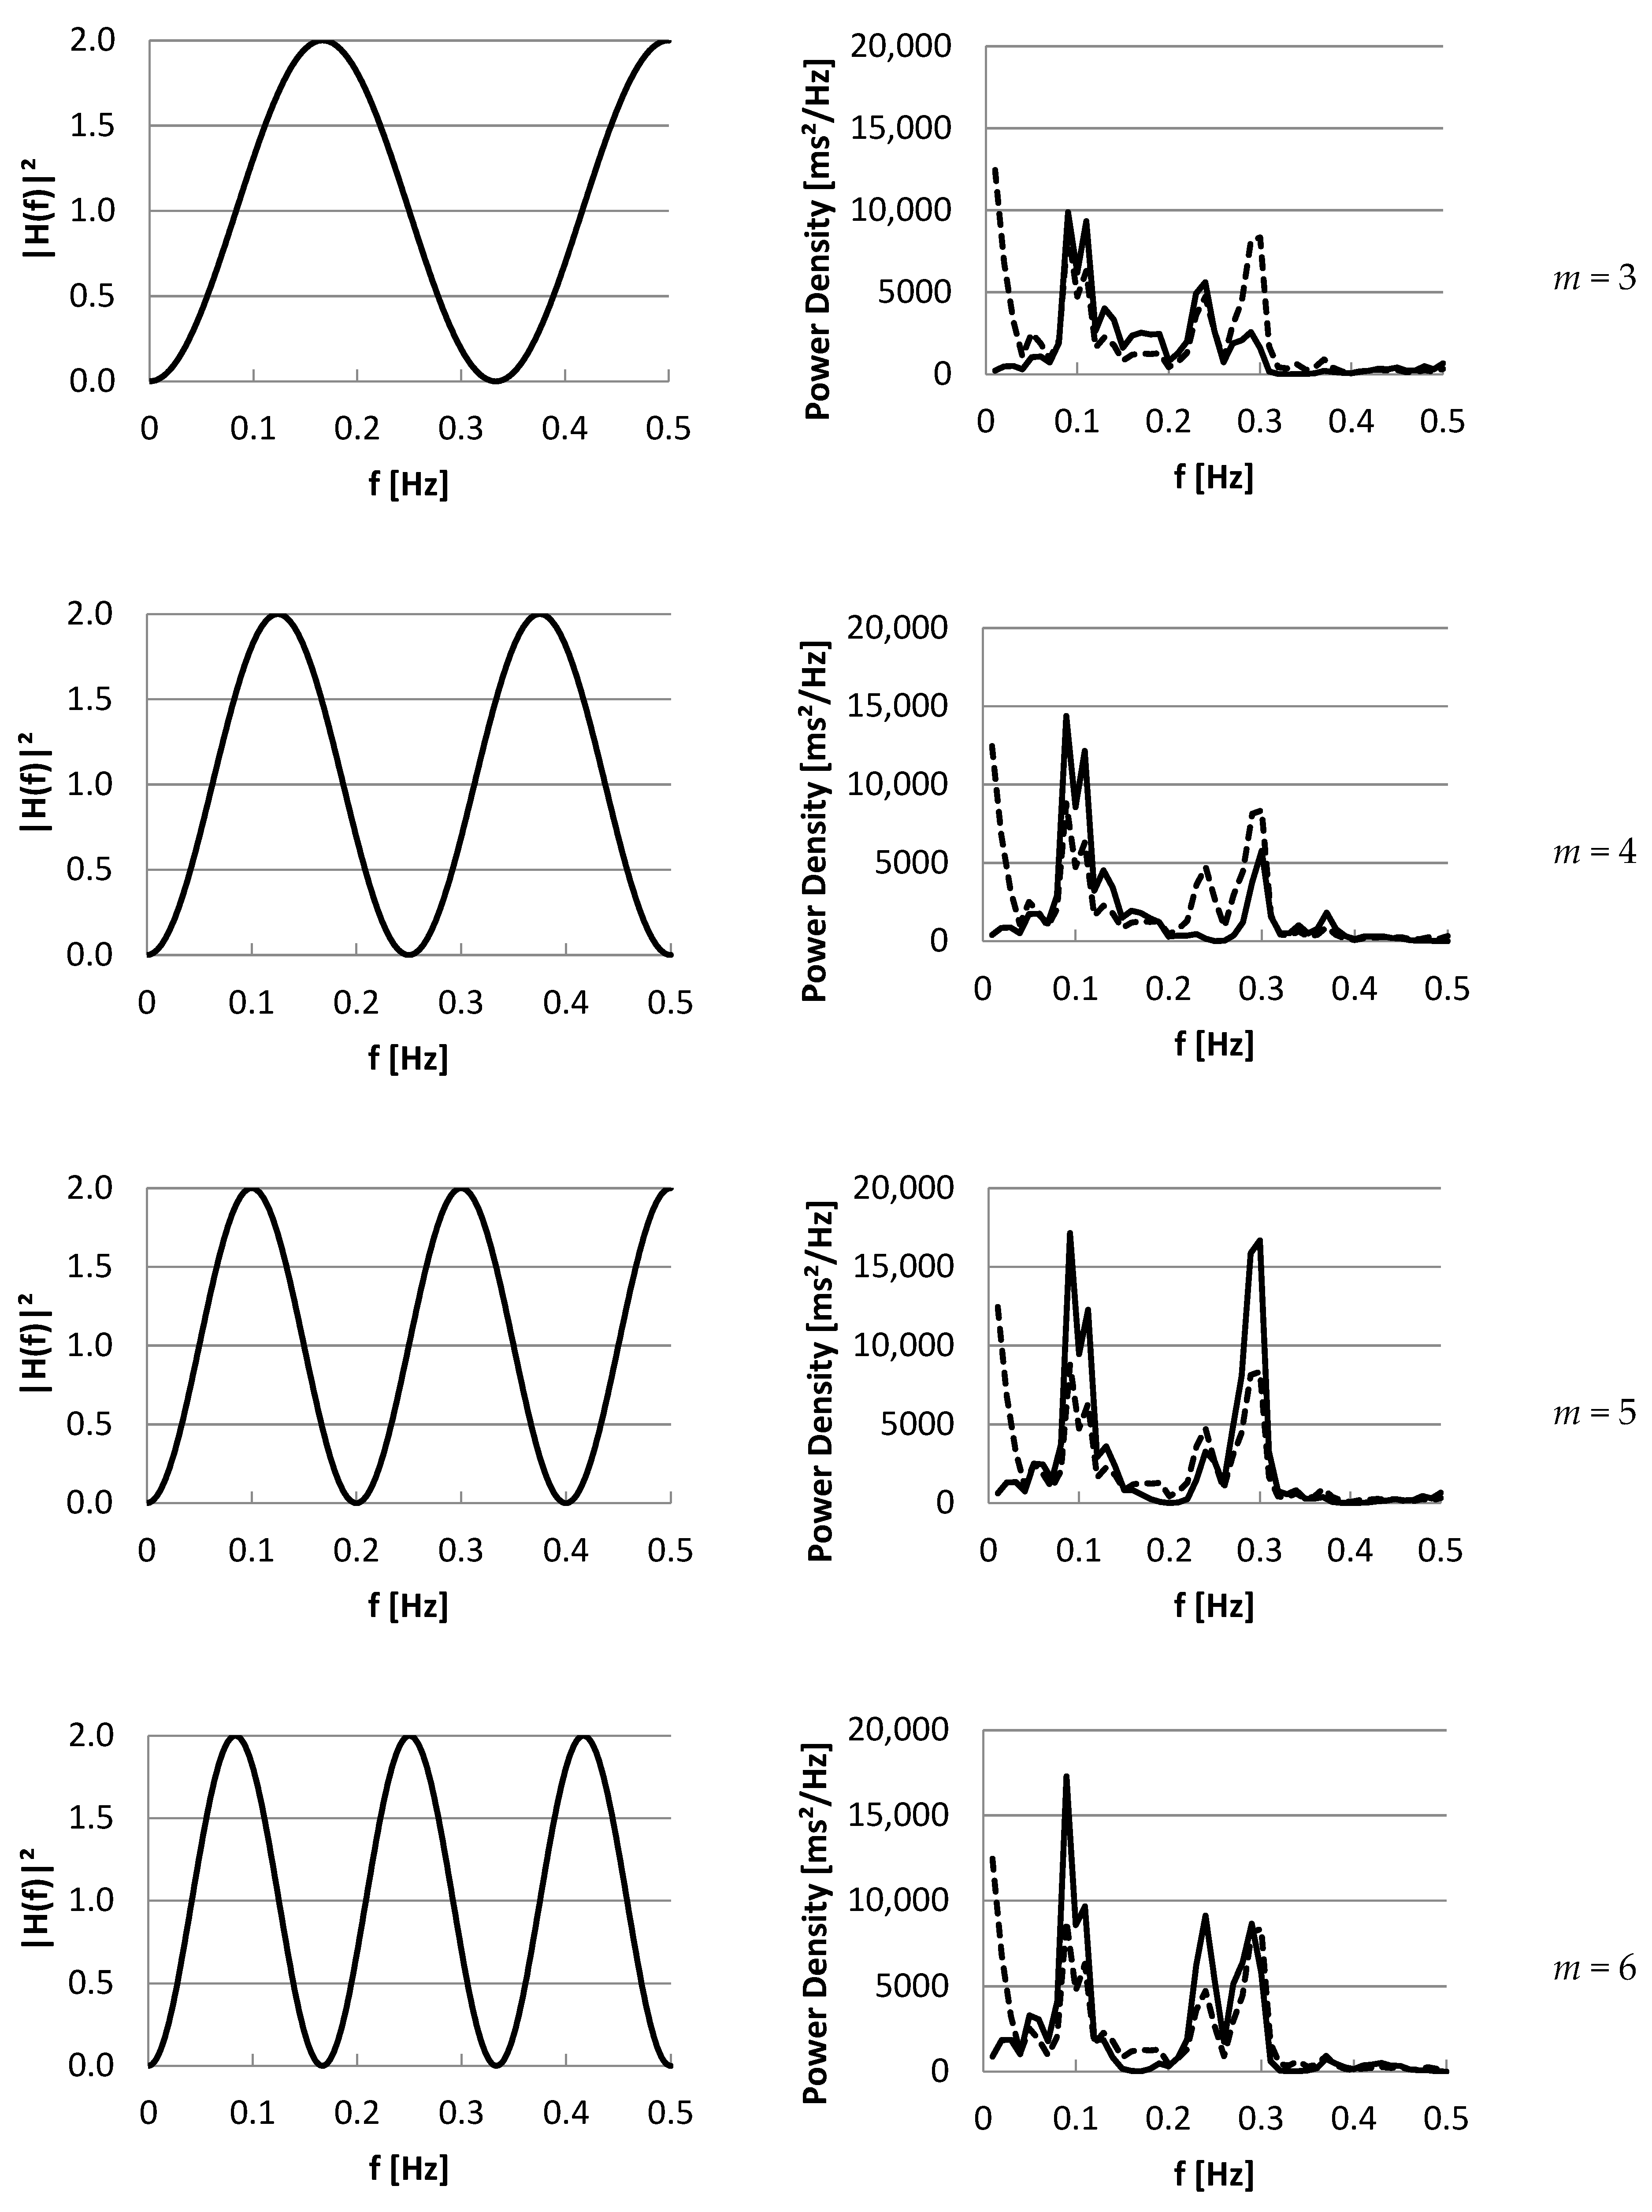
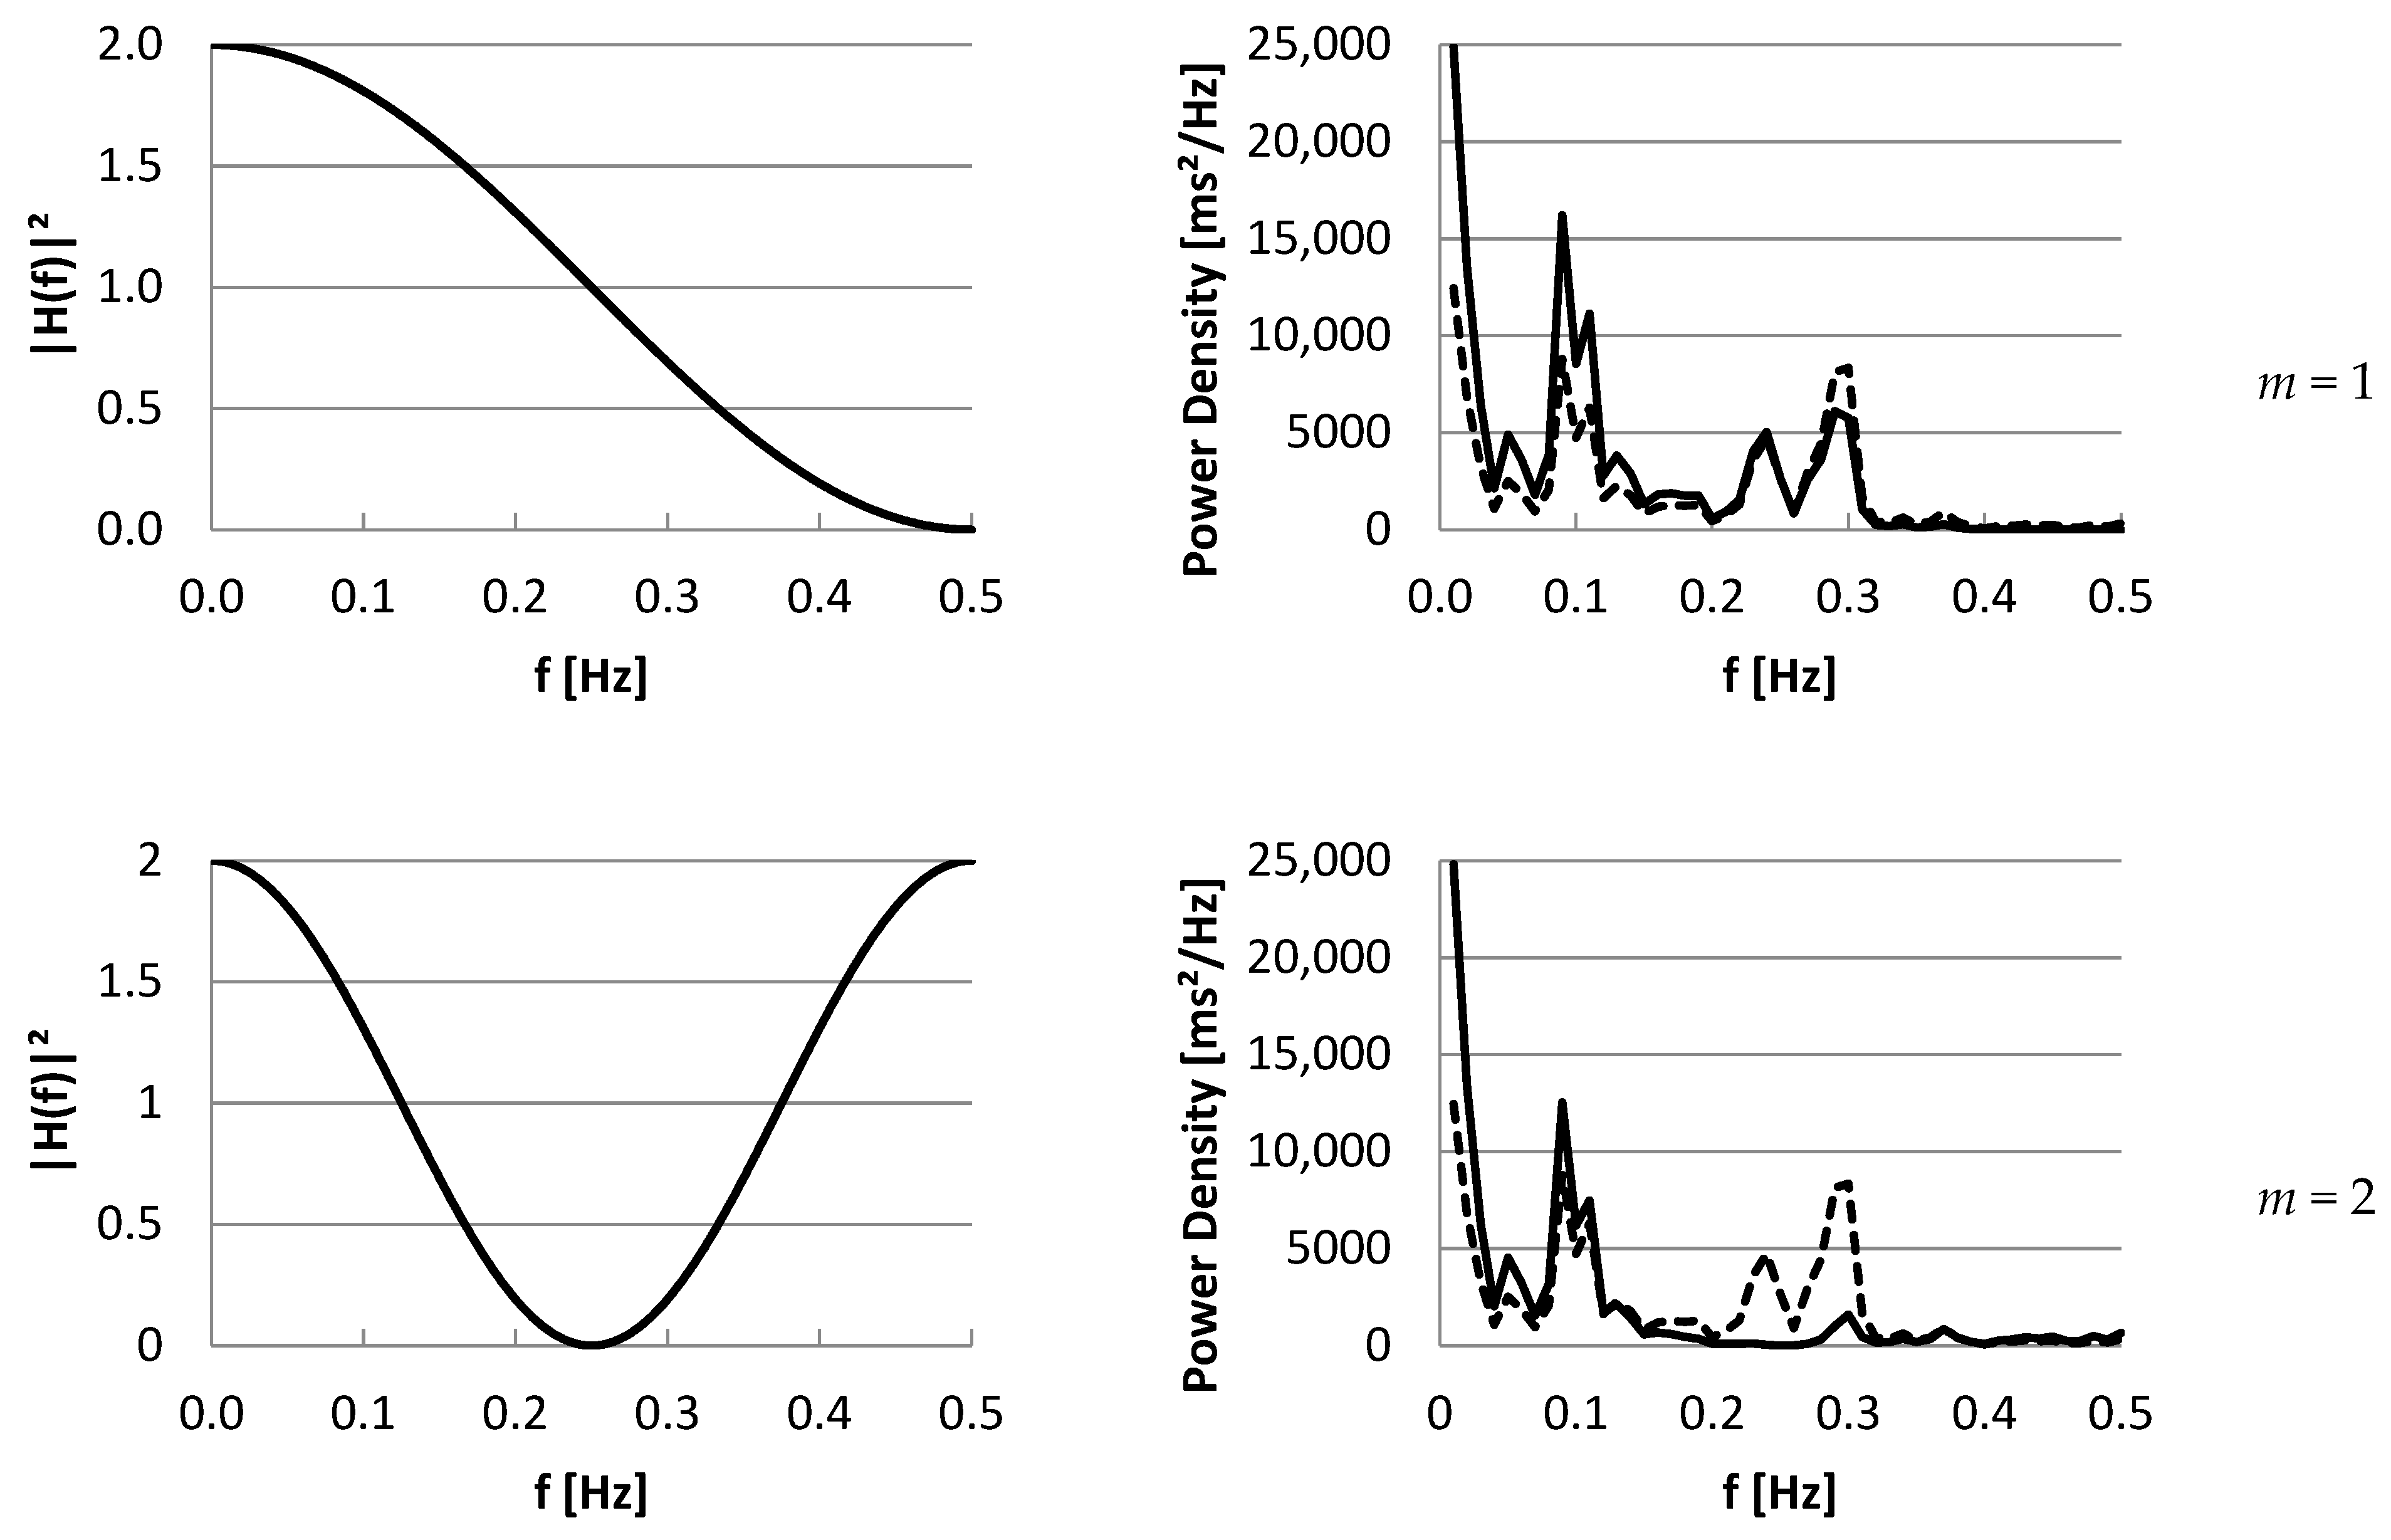
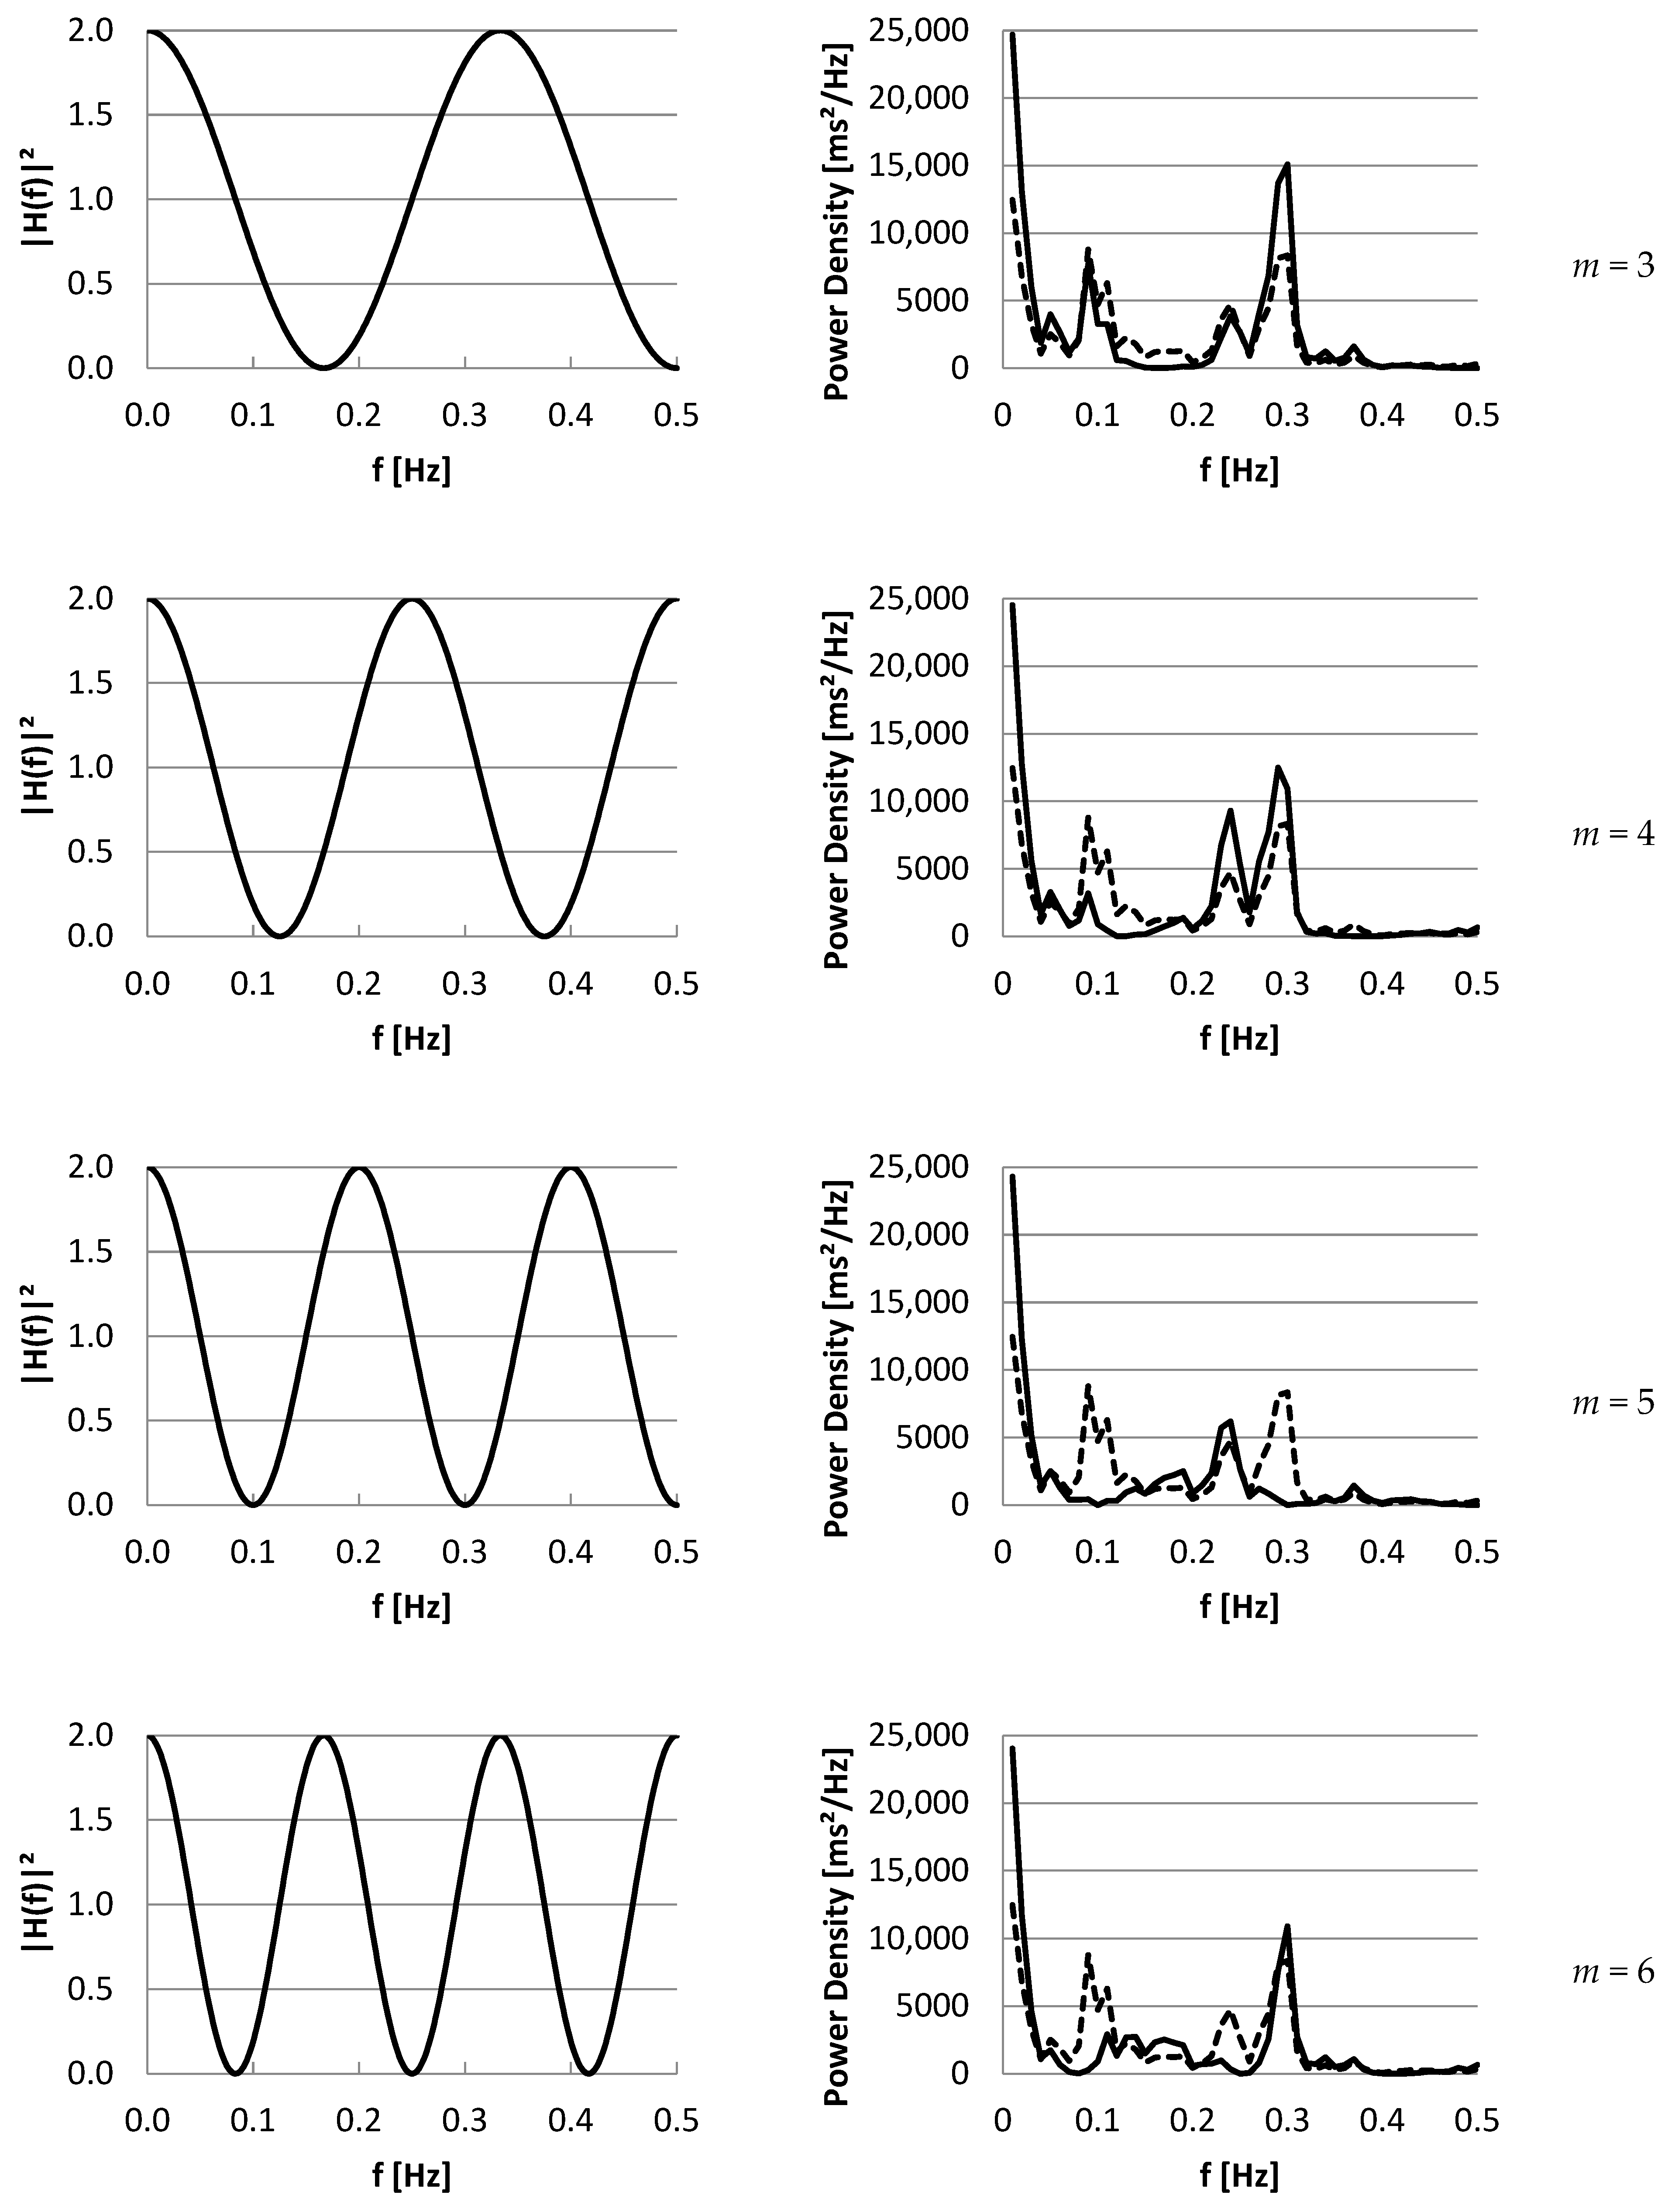
3.2. Part II: Frequency Domain
4. Discussion
5. Conclusions
Supplementary Materials
Author Contributions
Funding
Data Availability Statement
Conflicts of Interest
Abbreviations
| Symbol/Abbreviation | Description | Unit |
| General | ||
| Mean of x | unit of x | |
| Expected value of variable x | unit of x | |
| F | Frequency | Hz |
| I | Beat number | - |
| IBIi | Inter-beat interval of beat i | ms |
| N | Number of inter-beat intervals | - |
| Time domain measures | ||
| Mean inter-beat interval | ms | |
| RMSSD | Root mean square of successive differences | ms |
| SDNN | Standard deviation of normal-to-normal intervals, or the IBI time series | ms |
| Frequency domain measures | ||
| LF | Power in the low frequency band (0.04–0.15 Hz) | ms2 |
| HF | Power in the high frequency band (0.15–0.40 Hz) | ms2 |
| H(f) | Transfer function of a filter of the IBI time series | - |
| Px(f) | Single sided power density spectrum of x | (unit of x)2/Hz |
| VLF | Power in the very low frequency (0.01–0.04 Hz) | ms2 |
| Poincaré measures | ||
| m | ”Time” lag expressed as number of beats | - |
| τ | Time lag | s |
| r(m) | Pearson correlation coefficient between IBIi and IBIi+m | - |
| Autocorrelation or autocovariance function of IBIi and IBIi+m | ms2 | |
| SD1 | Short axis of the ellipse in the Poincaré plot at lag m = 1 | ms |
| SD1(m) | Short axis of the ellipse in the Poincaré plot at lag m | ms |
| SD2 | Long axis of the ellipse in the Poincaré plot at lag m = 1 | ms |
| SD2(m) | Long axis of the ellipse in the Poincaré plot at lag m | ms |
| SDi | Successive difference of beat i and beat i + 1 | ms |
| SDi(m) | Difference of IBI of beat i and i + m | ms |
| SDSD | Standard deviation of successive differences, the SD time series at lag m = 1 | ms |
| SDSD(m) | Standard deviation of successive differences, the SD time series at lag m | ms |
Appendix A
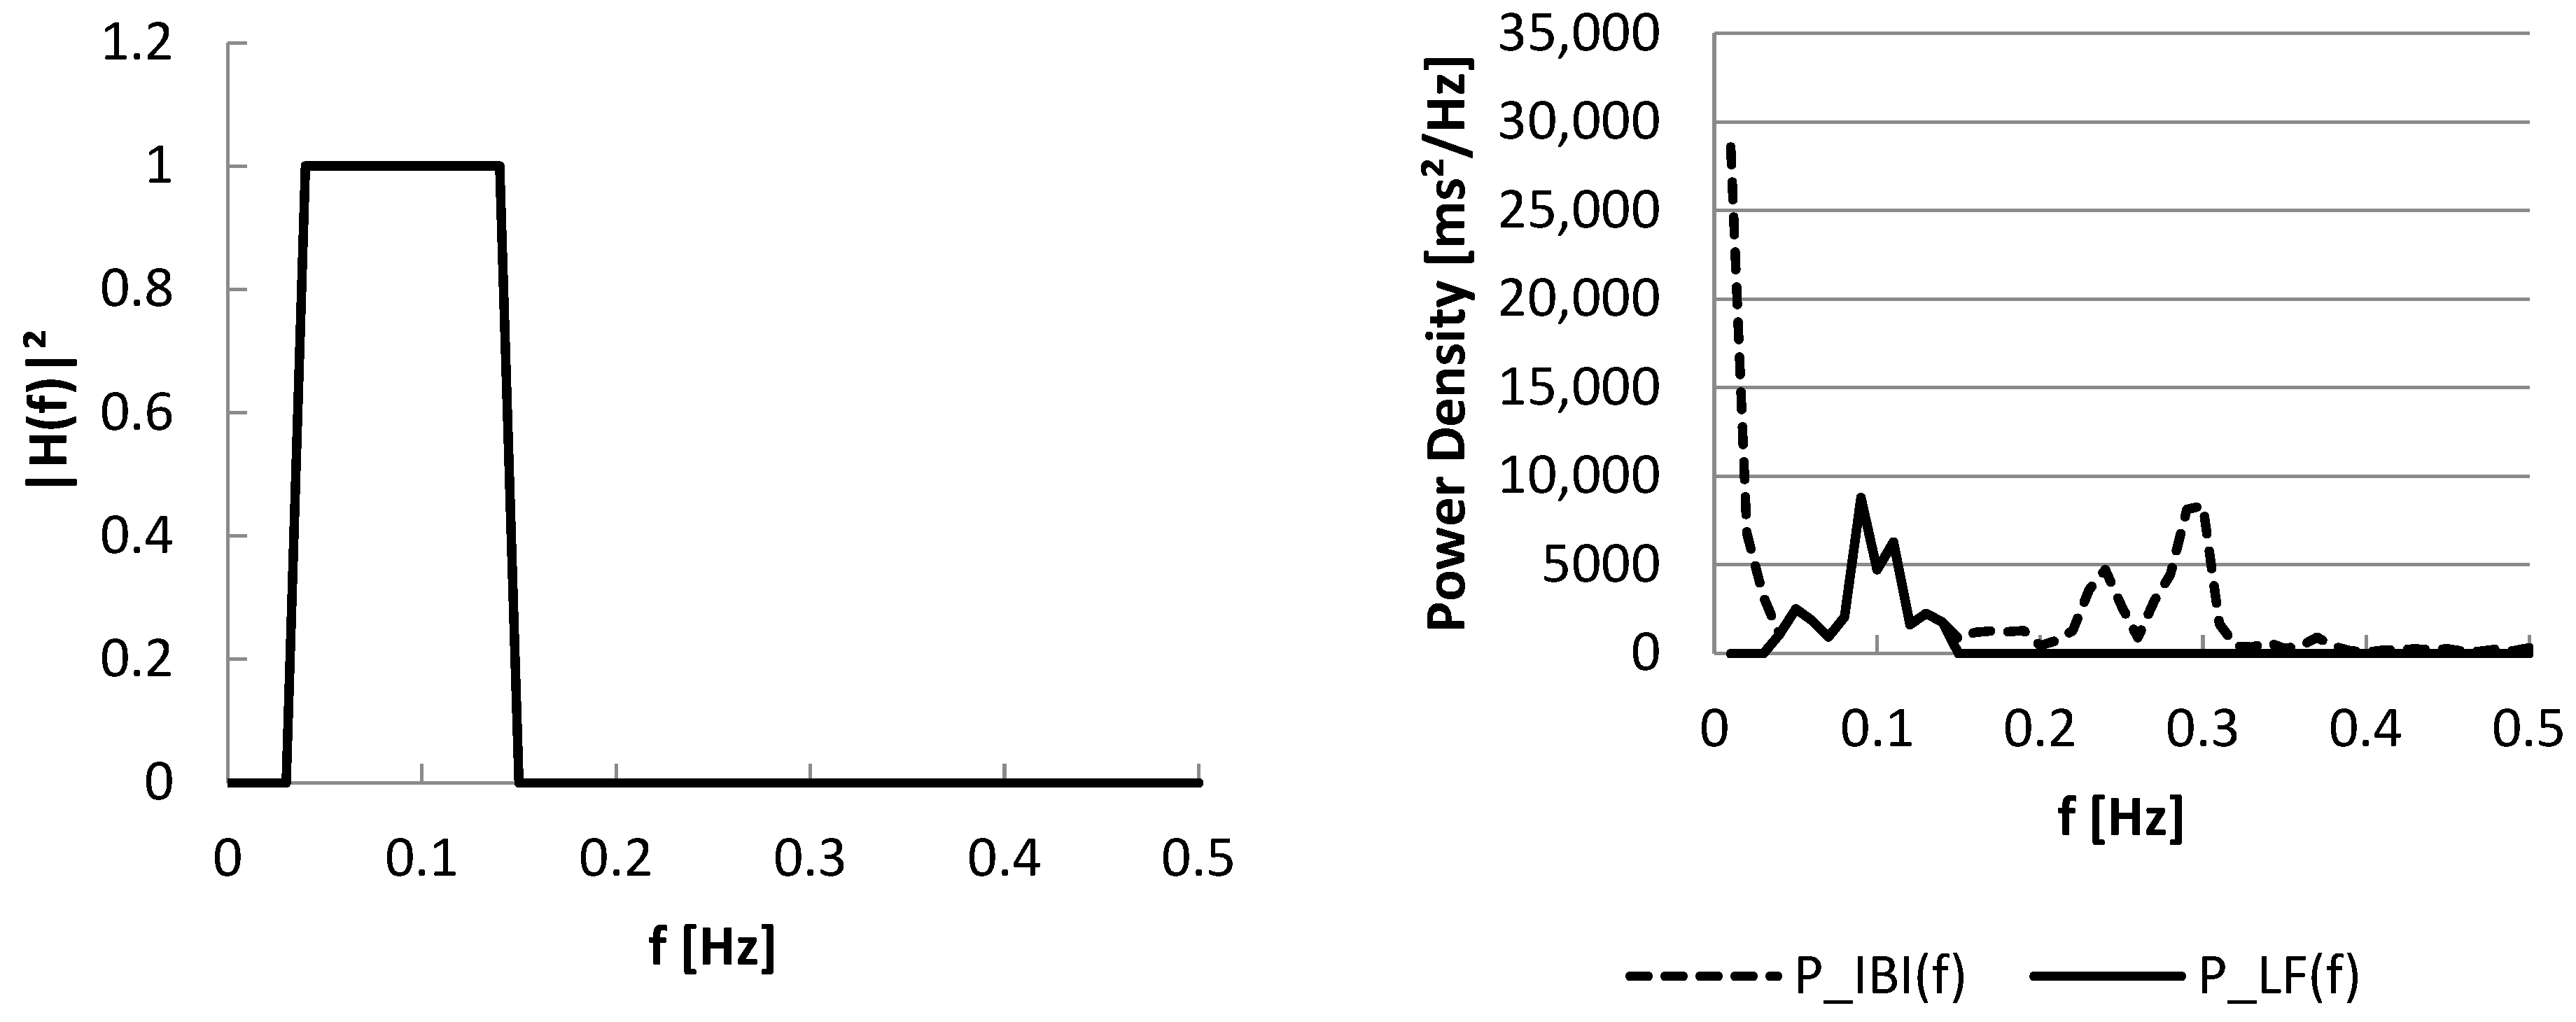
Appendix B
Appendix C
References
- Task Force of the European Society of Cardiology and the North American Society of Pacing and Electrophysiology. Heart rate variability. standards of measurement, physiological interpretation, and clinical use. Eur. Heart J. 1996, 17, 354–381. [Google Scholar] [CrossRef]
- Shaffer, F.; Ginsberg, J.P. An overview of heart rate variability metrics and norms. Front. Public Health 2017, 5, 258. [Google Scholar] [CrossRef]
- Arakaki, X.; Arechavala, R.J.; Choy, E.H.; Bautista, J.; Bliss, B.; Molloy, C.; Wu, D.-A.; Shimojo, S.; Jiang, Y.; Kleinman, M.T.; et al. The connection between heart rate variability (HRV), neurological health, and cognition: A literature review. Front. Neurosci. 2023, 17, 1055445. [Google Scholar] [CrossRef] [PubMed]
- Sassi, R.; Cerutti, S.; Lombardi, F.; Malik, M.; Huikuri, H.V.; Peng, C.-K.; Schmidt, G.; Yamamoto, Y.; Reviewers, D.; Gorenek, B.; et al. Advances in heart rate variability signal analysis: Joint position statement by the e-Cardiology ESC Working Group and the European Heart Rhythm Association co-endorsed by the Asia Pacific Heart Rhythm Society. Europace 2015, 17, 1341–1353. [Google Scholar] [CrossRef] [PubMed]
- Satti, R.; Abid, N.-U.; Bottaro, M.; De Rui, M.; Garrido, M.; Raoufy, M.R.; Montagnese, S.; Mani, A.R. The application of the extended Poincaré plot in the analysis of physiological variabilities. Front. Physiol. 2019, 10, 116. [Google Scholar] [CrossRef]
- Bottaro, M.; Abid, N.; El-Azizi, I.; Hallett, J.; Koranteng, A.; Formentin, C.; Montagnese, S.; Mani, A.R. Skin temperature variability is an independent predictor of survival in patients with cirrhosis. Physiol. Rep. 2020, 8, e14452. [Google Scholar] [CrossRef] [PubMed]
- Bhogal, A.S.; Mani, A.R. Pattern analysis of oxygen saturation variability in healthy individuals: Entropy of pulse oximetry signals carries information about mean oxygen saturation. Front. Physiol. 2017, 8, 555. [Google Scholar] [CrossRef]
- Medina, R.; Macancela, J.-C.; Lucero, P.; Cabrera, D.; Cerrada, M.; Sánchez, R.-V.; Vásquez, R.E. Vibration signal analysis using symbolic dynamics for gearbox fault diagnosis. Int. J. Adv. Manuf. Technol. 2019, 104, 2195–2214. [Google Scholar] [CrossRef]
- Orlando, G.; Zimatore, G. Recurrence quantification analysis on a Kaldorian business cycle model. Nonlinear Dyn. 2020, 100, 785–801. [Google Scholar] [CrossRef]
- Woo, M.A.; Stevenson, W.G.; Moser, D.K.; Trelease, R.B.; Harper, R.M. Patterns of beat-to-beat heart rate variability in advanced heart failure. Am. Heart J. 1992, 123, 704–710. [Google Scholar] [CrossRef]
- Toichi, M.; Sugiura, T.; Murai, T.; Sengoku, A. A new method of assessing cardiac autonomic function and its comparison with spectral analysis and coefficient of variation of R-R interval. J. Auton. Nerv. Syst. 1997, 62, 79–84. [Google Scholar] [CrossRef]
- Carrasco, S.; Gaitan, M.J.; Gonzalez, R.; Yanez, O. Correlation among Poincaré plot indexes and time and frequency domain measures of heart rate variability. J. Med. Eng. Technol. 2001, 25, 240–248. [Google Scholar] [CrossRef]
- Lerma, C.; Infante, O.; Perez-Grovas, H.; Jose, M.V. Poincare plot indexes of heart rate variability capture dynamic adaptations after haemodialysis in chronic renal failure patients. Clin. Physiol. Funct. Imaging 2003, 23, 72–80. [Google Scholar] [CrossRef]
- Oishi, K.; Himeno, Y.; Miwa, M.; Anzai, H.; Kitajima, K.; Yasunaka, Y.; Kumagai, H.; Ieiri, S.; Hirooka, H. Correcting the activity-specific component of heart rate variability using dynamic body acceleration under free-moving conditions. Front. Physiol. 2018, 9, 1063. [Google Scholar] [CrossRef] [PubMed]
- Guzik, P.; Piskorski, J.; Krauze, T.; Schneider, R.; Wesseling, K.H.; Wykretowicz, A.; Wysocki, H. Correlations between the Poincaré plot and conventional heart rate variability parameters assessed during paced breathing. J. Physiol. Sci. 2007, 57, 63–71. [Google Scholar] [CrossRef] [PubMed]
- Kumar, H.; Kaur, K.; Kaur, G. Heart variability analysis by using non-linear techniques and their comparison. Int. J. Comput. Appl. 2013, 65, 33–36. [Google Scholar]
- Brennan, M.; Palaniswami, M.; Kamen, P. Do existing measures of Poincaré plot geometry reflect nonlinear features of heart rate variability? IEEE Trans. Biomed. Eng. 2001, 48, 1342–1347. [Google Scholar] [CrossRef]
- Tulppo, M.P.; Makikallio, T.H.; Takala, T.E.; Seppanen, T.; Huikuri, H.V. Quantitative beat-to-beat analysis of heart rate dynamics during exercise. Am. J. Physiol. 1996, 271, H244–H252. [Google Scholar] [CrossRef]
- Khandoker, A.H.; Karmakar, C.; Brennan, M.; Palaniswami, M.; Voss, A. Poincaré Plot Methods for Heart Rate Variability Analysis; Springer: Boston, MA, USA, 2013. [Google Scholar]
- Ciccone, A.B.; Siedlik, J.A.; Wecht, J.M.; Deckert, J.A.; Nguyen, N.D.; Weir, J.P. Reminder: RMSSD and SD1 are identical heart rate variability metrics. Muscle Nerve 2017, 56, 674–678. [Google Scholar] [CrossRef]
- Contreras, P.; Canetti, R.; Migliaro, E.R. Correlations between frequency-domain HRV indices and lagged Poincaré plot width in healthy and diabetic subjects. Physiol. Meas. 2007, 28, 85–94. [Google Scholar] [CrossRef]
- Harris, B.; Bendat, J.S.; Piersol, A.G. Random Data: Analysis and Measurement Procedures, 2nd ed.; John Wiley and Sons: New York, NY, USA, 1986. [Google Scholar]
- Lampard, D.G. Generalization of the Wiener-Khintchine theorem to nonstationary processes. J. Appl. Phys. 1954, 25, 802–803. [Google Scholar] [CrossRef]
- Fisher, R.A. Frequency distribution of the values of the correlation coefficient in samples from an indefinitely large population. Biometrika 1915, 10, 507–521. [Google Scholar] [CrossRef]
- IBM SPSS. IBM SPSS Statistics Algorithms, Help Documentation for SPSS Version 28. p. 187. Available online: https://www.ibm.com/docs/SSLVMB_28.0.0/pdf/IBM_SPSS_Statistics_Algorithms.pdf (accessed on 11 August 2025).
- Koichubekov, B.; Riklefs, V.; Sorokina, M.; Korshukov, I.; Turgunova, L.; Laryushina, Y.; Bakirova, R.; Muldaeva, G.; Bekov, E.; Kultenova, M. Informative nature and nonlinearity of lagged Poincaré plots Indices in analysis of heart rate variability. Entropy 2017, 19, 523. [Google Scholar] [CrossRef]
- Stein, P.K.; Domitrovich, P.P.; Huikuri, H.V.; Kleiger, R.E. Traditional and nonlinear heart rate variability are each independently associated with mortality after myocardial infarction. J. Cardiovasc. Electrophysiol. 2005, 16, 13–20. [Google Scholar] [CrossRef]
- Casali, K.R.; Casali, A.G.; Montano, N.; Irigoyen, M.C.; Macagnan, F.; Guzzetti, S.; Porta, A. Multiple testing strategy for the detection of temporal irreversibility in stationary time series. Phys. Rev. E 2008, 77, 066204. [Google Scholar] [CrossRef]
- Porta, A.; Casali, K.R.; Casali, A.G.; Gnecchi-Ruscone, T.; Tobaldini, E.; Montano, N.; Lange, S.; Geue, D.; Cysarz, D.; Van Leeuwen, P. Temporal asymmetries of short-term heart period variability are linked to autonomic regulation. Am. J. Physiol. Regul. Integr. Comp. Physiol. 2008, 295, R550–R557. [Google Scholar] [CrossRef]
- Fishman, M.; Jacono, F.J.; Park, S.; Jamasebi, R.; Thungtong, A.; Loparo, K.A.; Dick, T.E. A method for analyzing temporal patterns of variability of a time series from Poincaré plots. J. Appl. Physiol. 2012, 113, 297–306. [Google Scholar] [CrossRef]

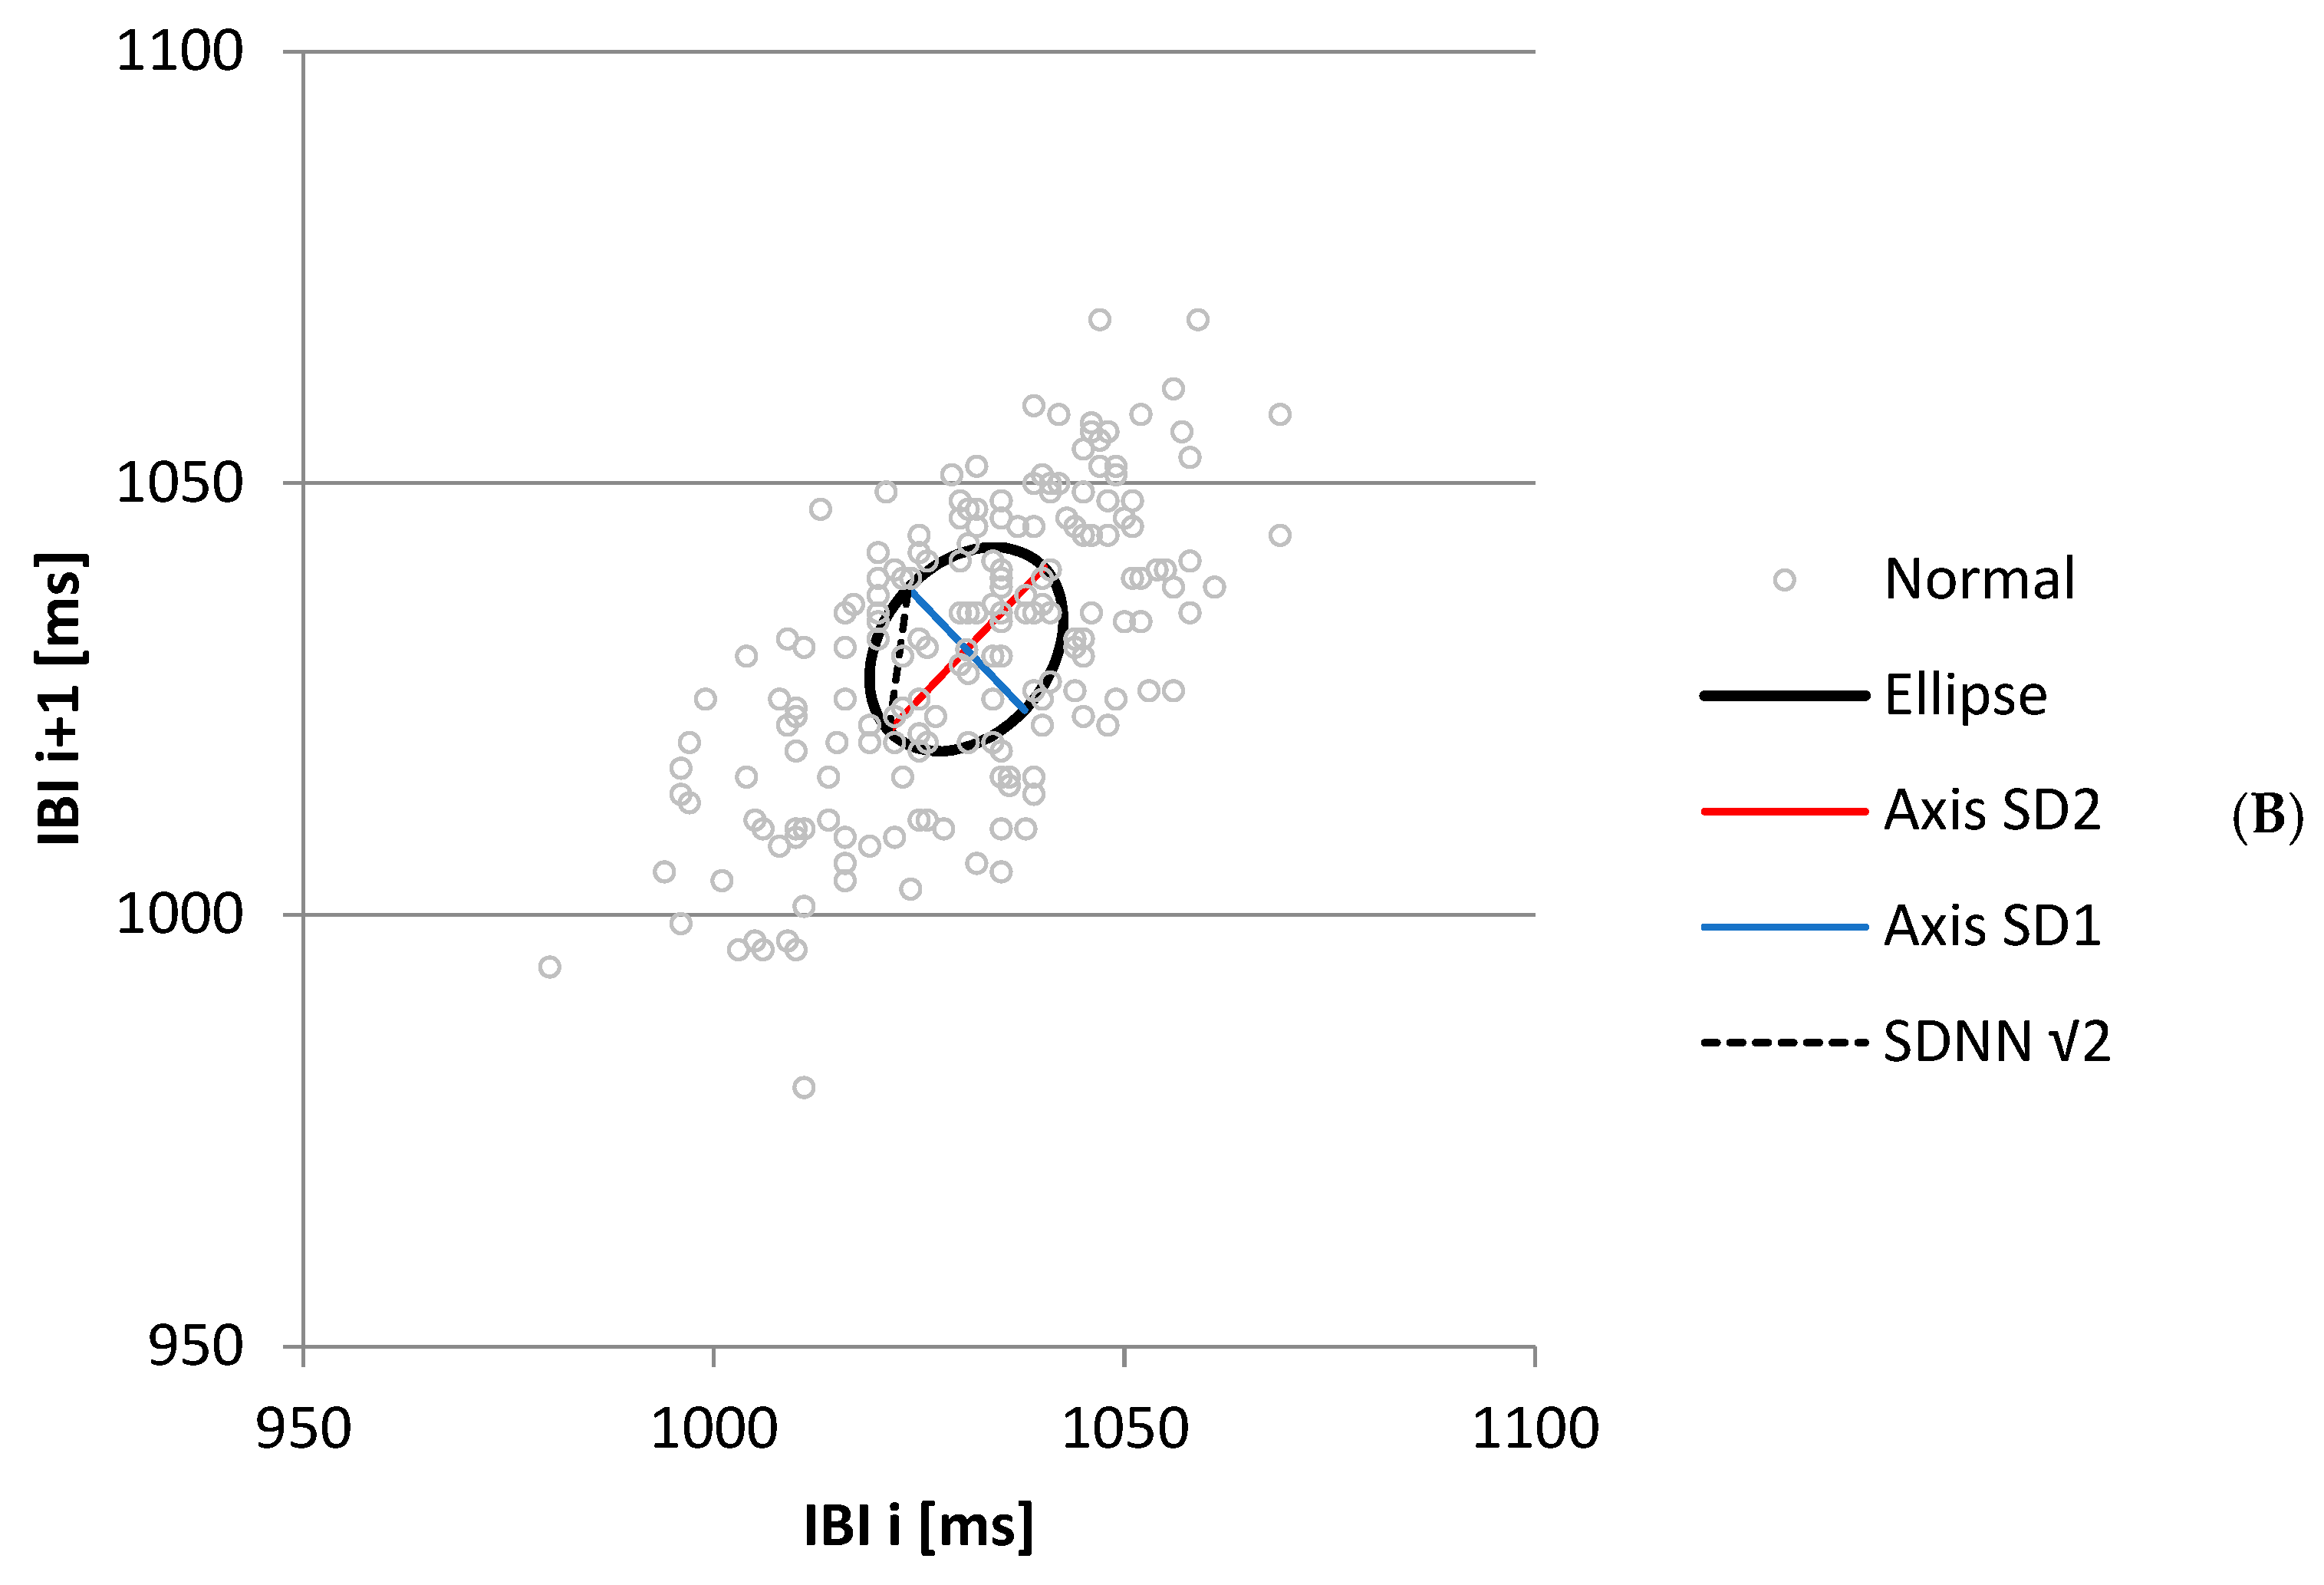
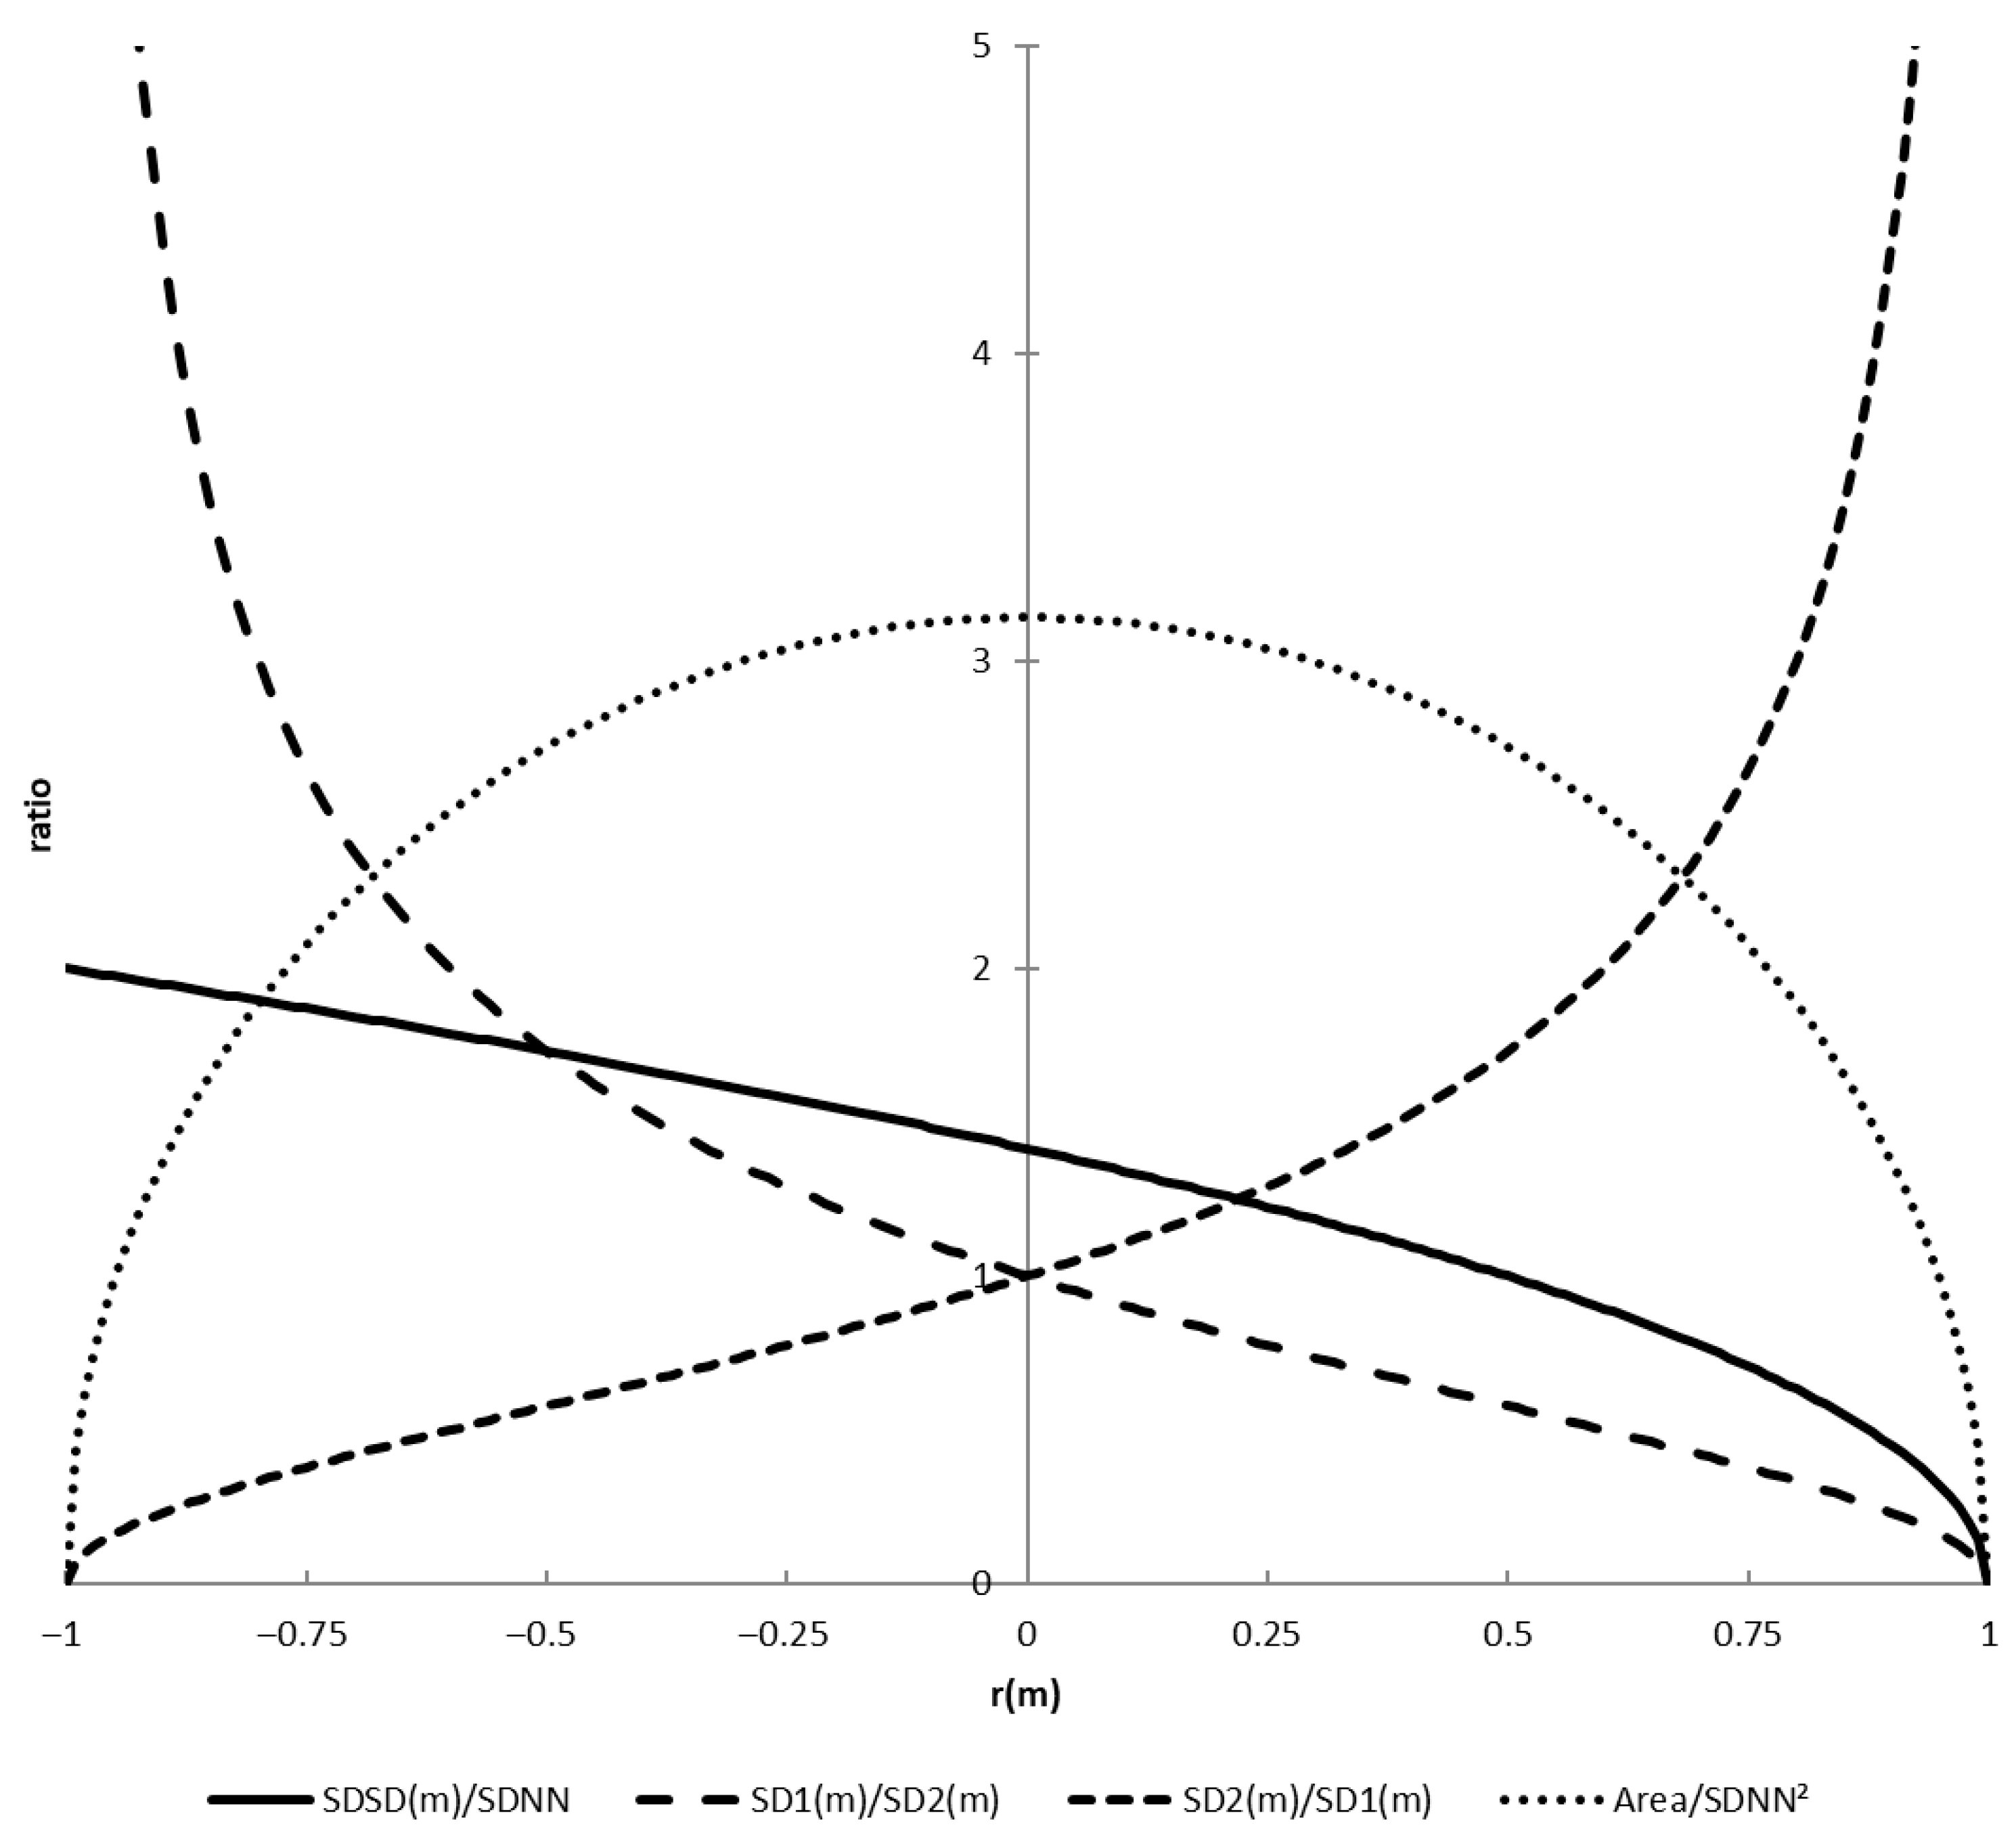


Disclaimer/Publisher’s Note: The statements, opinions and data contained in all publications are solely those of the individual author(s) and contributor(s) and not of MDPI and/or the editor(s). MDPI and/or the editor(s) disclaim responsibility for any injury to people or property resulting from any ideas, methods, instructions or products referred to in the content. |
© 2025 by the authors. Licensee MDPI, Basel, Switzerland. This article is an open access article distributed under the terms and conditions of the Creative Commons Attribution (CC BY) license (https://creativecommons.org/licenses/by/4.0/).
Share and Cite
van Roon, A.M.; Span, M.M.; Lefrandt, J.D.; Riese, H. Overview of Mathematical Relations Between Poincaré Plot Measures and Time and Frequency Domain Measures of Heart Rate Variability. Entropy 2025, 27, 861. https://doi.org/10.3390/e27080861
van Roon AM, Span MM, Lefrandt JD, Riese H. Overview of Mathematical Relations Between Poincaré Plot Measures and Time and Frequency Domain Measures of Heart Rate Variability. Entropy. 2025; 27(8):861. https://doi.org/10.3390/e27080861
Chicago/Turabian Stylevan Roon, Arie M., Mark M. Span, Joop D. Lefrandt, and Harriëtte Riese. 2025. "Overview of Mathematical Relations Between Poincaré Plot Measures and Time and Frequency Domain Measures of Heart Rate Variability" Entropy 27, no. 8: 861. https://doi.org/10.3390/e27080861
APA Stylevan Roon, A. M., Span, M. M., Lefrandt, J. D., & Riese, H. (2025). Overview of Mathematical Relations Between Poincaré Plot Measures and Time and Frequency Domain Measures of Heart Rate Variability. Entropy, 27(8), 861. https://doi.org/10.3390/e27080861


