Fisher–Shannon Analysis of Sentinel 1 Time Series from 2015 to 2023: Revealing the Impact of Toumeyella Parvicornis Infection in a Pilot Site of Central Italy


Abstract
1. Introduction
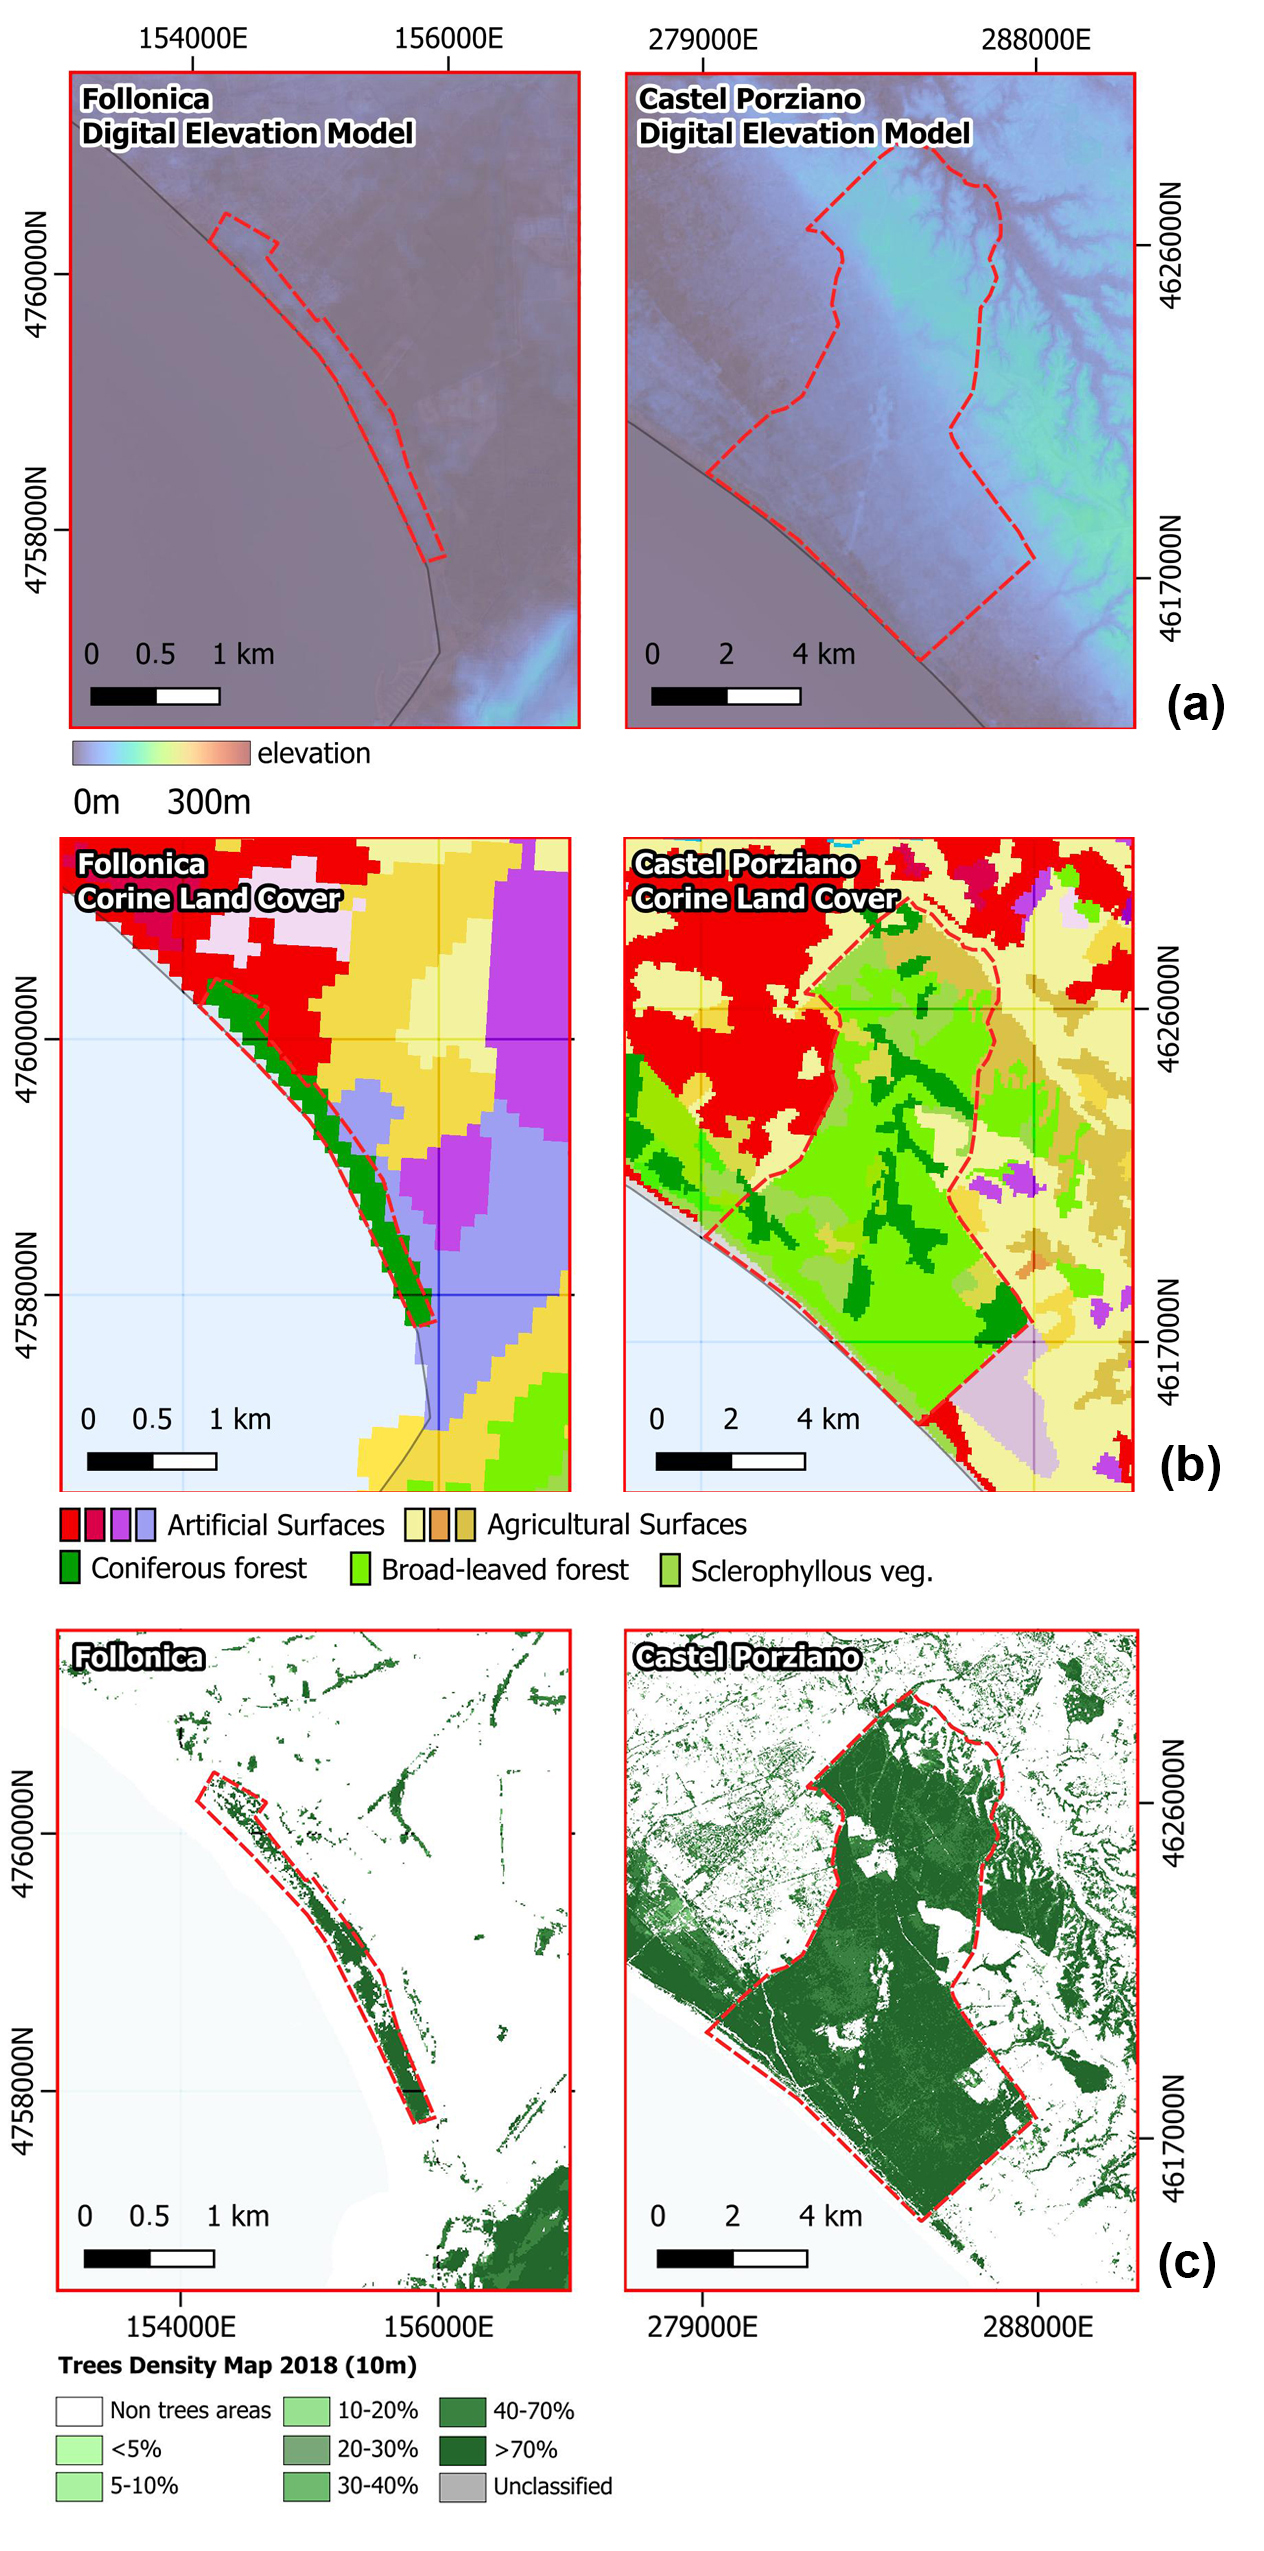
2. Data
3. Method
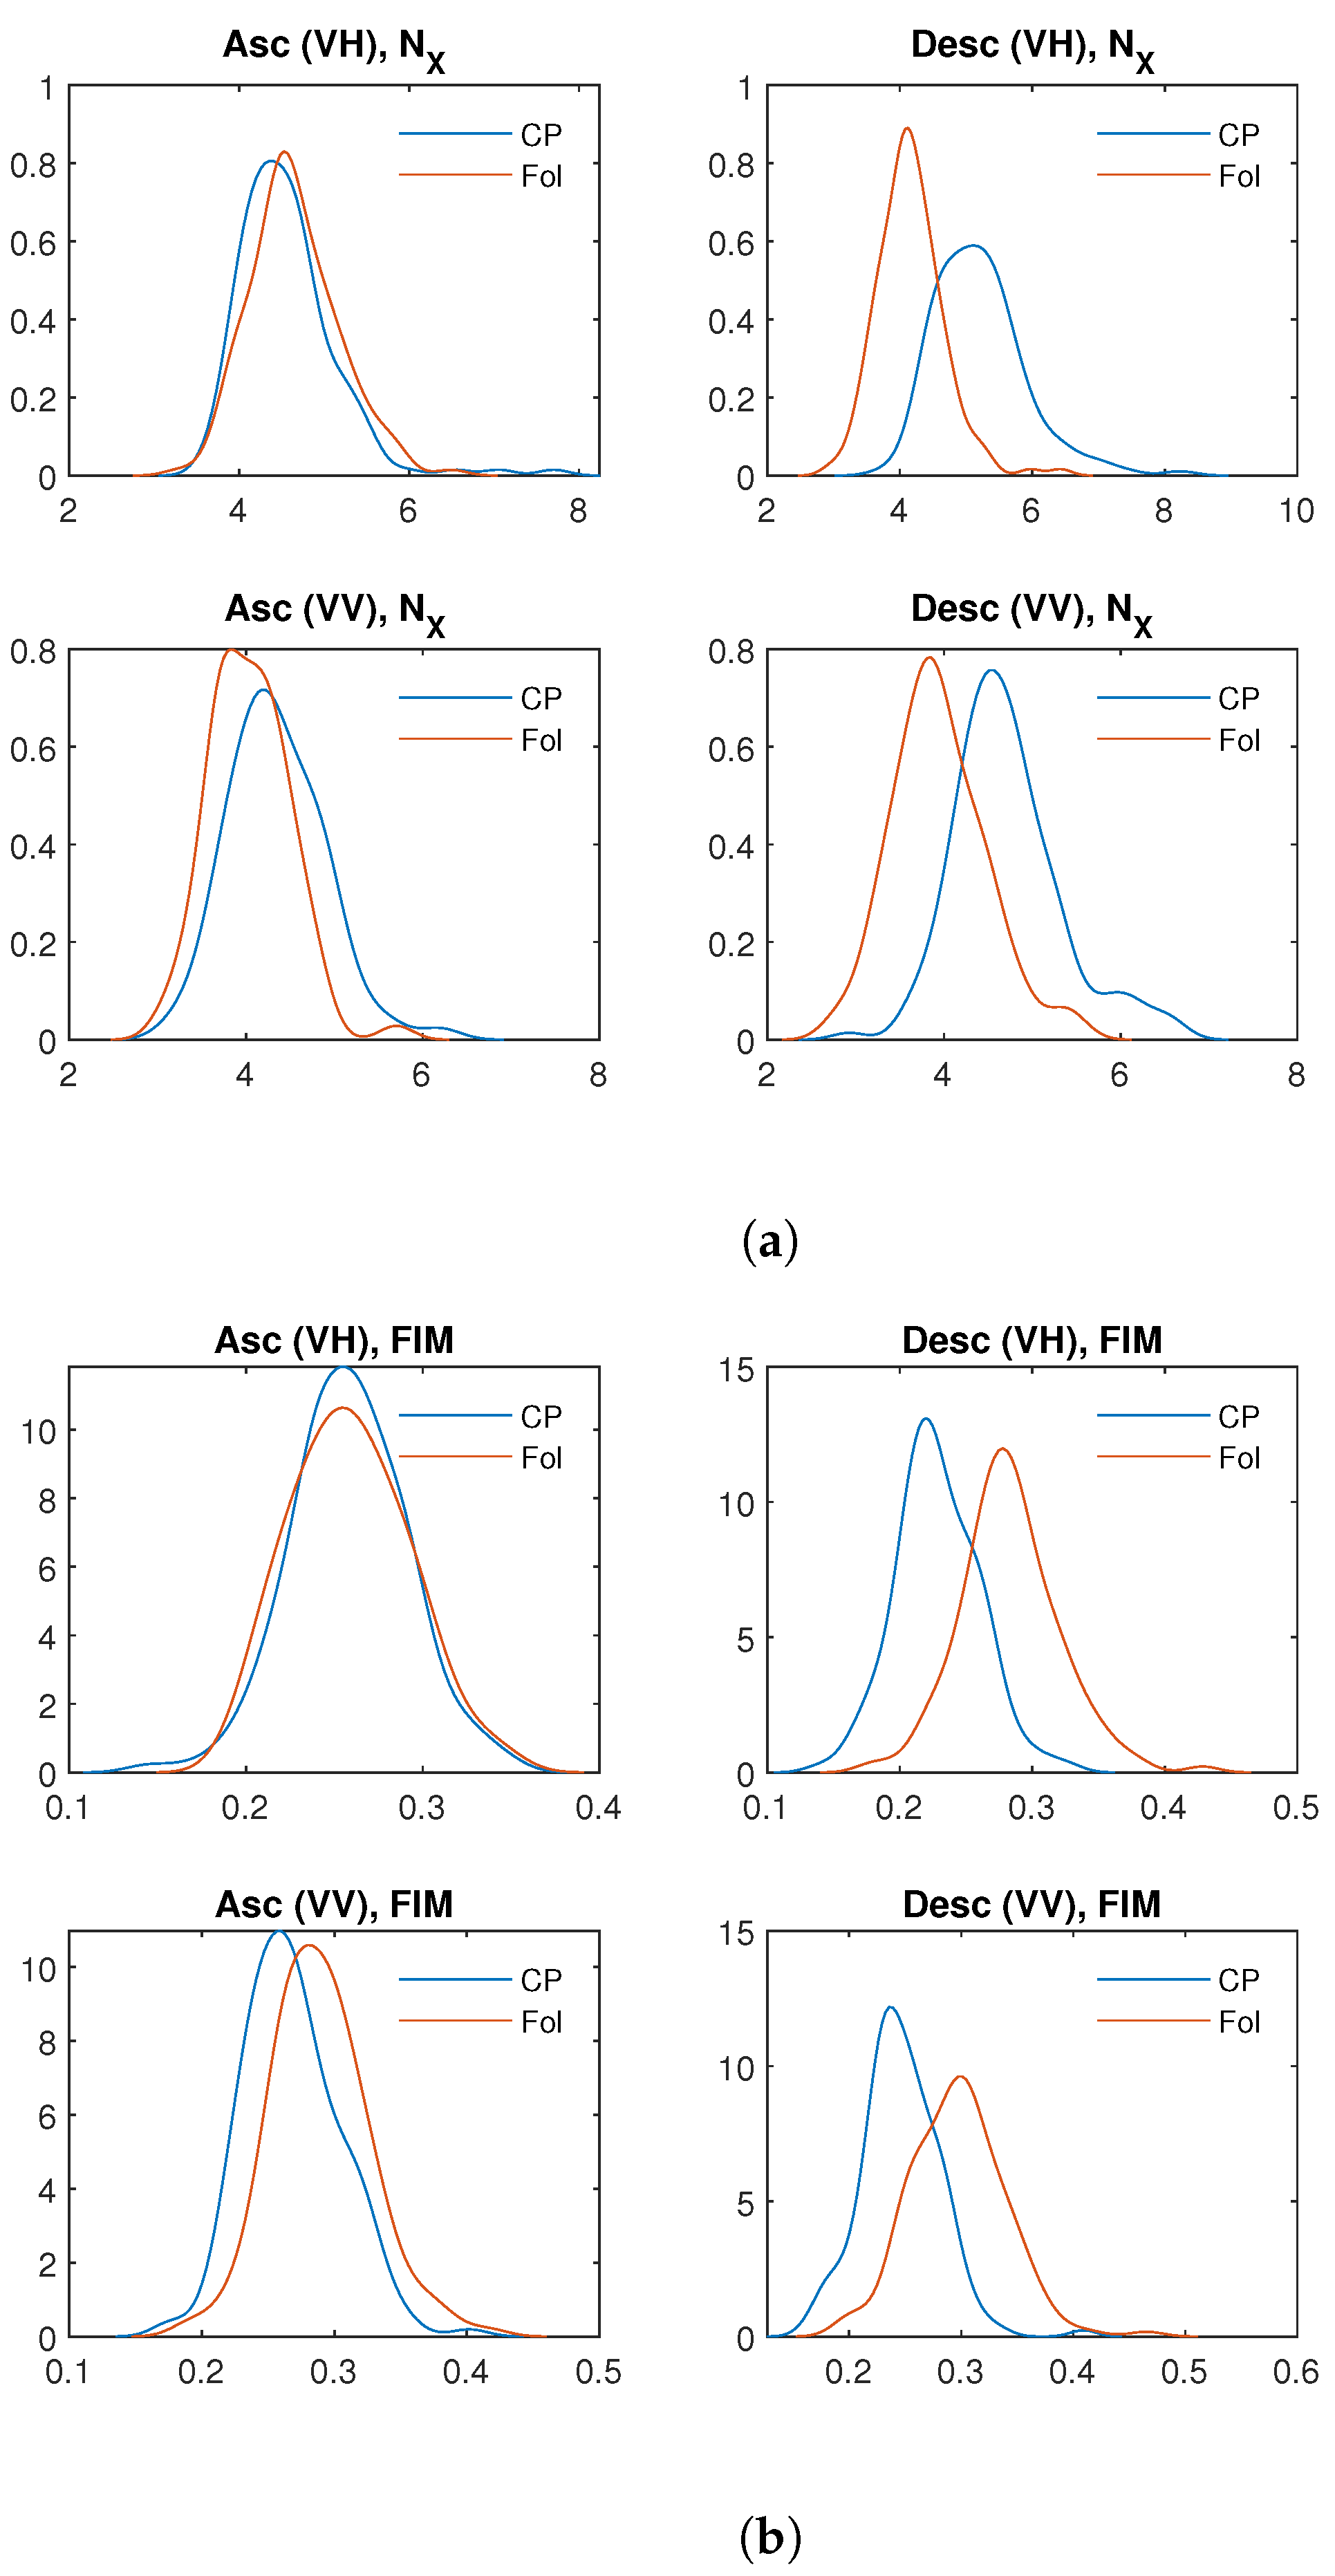
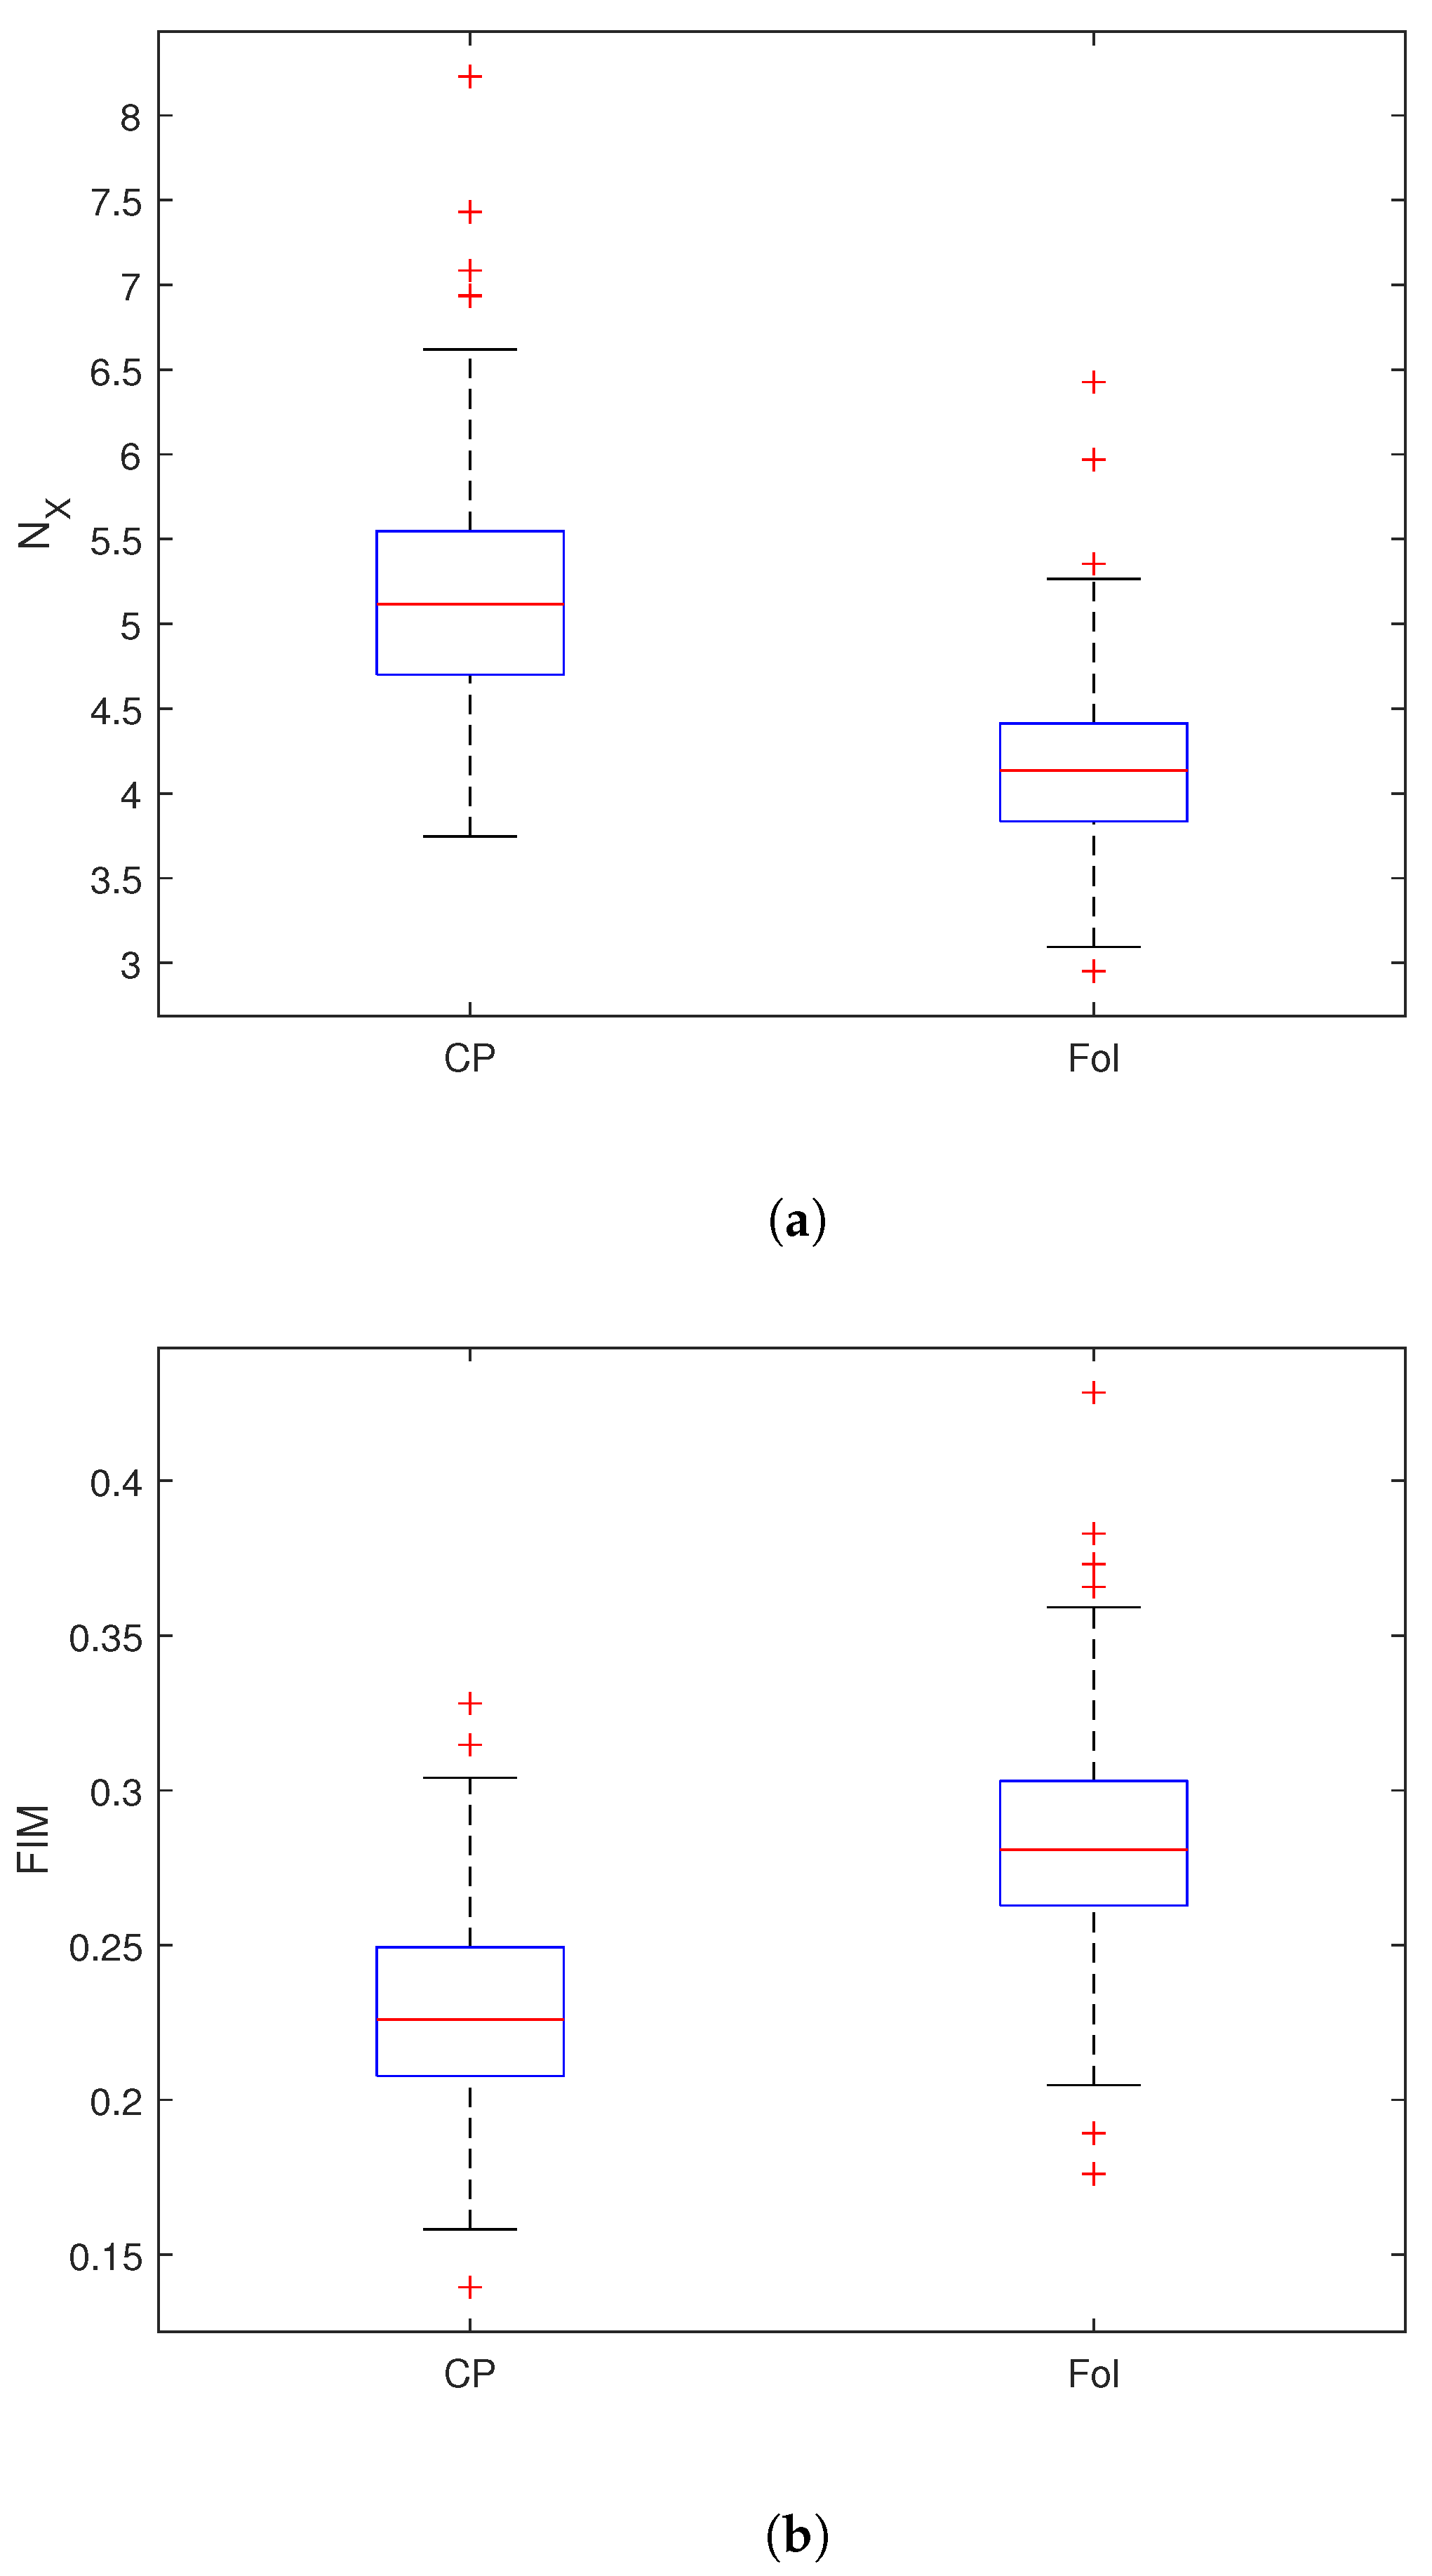
4. Results
5. Discussion
6. Conclusions
Supplementary Materials
Author Contributions
Funding
Data Availability Statement
Conflicts of Interest
References
- Ameztegui, A.; Coll, L.; Cáceres, M.D.; Morán-Ordóñez, A. Disturbance impacts on Mediterranean forests across climate and management scenarios. J. Environ. Manag. 2024, 371, 123193. [Google Scholar] [CrossRef] [PubMed]
- Peñuelas, J.; Sardans, J. Global Change and Forest Disturbances in the Mediterranean Basin: Breakthroughs, Knowledge Gaps, and Recommendations. Forests 2021, 12, 603. [Google Scholar] [CrossRef]
- Addas, A. Impact of forestry on environment and human health: An evidence-based investigation. Front. Public Health 2023, 11, 1260519. [Google Scholar] [CrossRef]
- Xu, W.; Cheng, Y.; Luo, M.; Mai, X.; Wang, W.; Zhang, W.; Wang, Y. Progress and Limitations in Forest Carbon Stock Estimation Using Remote Sensing Technologies: A Comprehensive Review. Forests 2025, 16, 449. [Google Scholar] [CrossRef]
- Mngadi, T.M.; Smith, J.L.; Roberts, P.K. A systematic review of the application of remote sensing technologies in mapping forest insect pests and diseases at a tree-level. Remote Sens. Appl. Soc. Environ. 2024, 36, 101341. [Google Scholar] [CrossRef]
- El-Ghany, N.M.A.; El-Aziz, S.E.A.; Marei, S.S. A review: Application of remote sensing as a promising strategy for insect pests and diseases management. Environ. Sci. Pollut. Res. 2020, 27, 33503–33515. [Google Scholar] [CrossRef]
- Reiche, J.; Mullissa, A.; Slagter, B.; Gou, Y.; Tsendbazar, N.E.; Odongo-Braun, C.; Vollrath, A.; Weisse, M.J.; Stolle, F.; Pickens, A.; et al. Forest disturbance alerts for the Congo Basin using Sentinel-1. Environ. Res. Lett. 2021, 16, 024005. [Google Scholar] [CrossRef]
- Tang, X.; Bratley, K.H.; Cho, K.; Bullock, E.L.; Olofsson, P.; Woodcock, C.E. Near real-time monitoring of tropical forest disturbance by fusion of Landsat, Sentinel-2, and Sentinel-1 data. Remote Sens. Environ. 2023, 294, 113626. [Google Scholar] [CrossRef]
- Slagter, B.; Reiche, J.; Marcos, D.; Mullissa, A.; Lossou, E.; Peña-Claros, M.; Herold, M. Monitoring direct drivers of small-scale tropical forest disturbance in near real-time with Sentinel-1 and -2 data. Remote Sens. Environ. 2023, 295, 113655. [Google Scholar] [CrossRef]
- Ban, Y.; Zhang, P.; Nascetti, A.; Bevington, A.R.; Wulder, M.A. Near Real-Time Wildfire Progression Monitoring with Sentinel-1 SAR Time Series and Deep Learning. Sci. Rep. 2020, 10, 1322. [Google Scholar] [CrossRef]
- Lasaponara, R.; Fattore, C.; Modica, G. Imaging Burned Areas and Fire Severity in Mediterranean Fragmented Ecosystems Using Sentinel-1 and Sentinel-2: The Case Study of Tortoli–Ogliastra Fire (Sardinia). IEEE Geosci. Remote Sens. Lett. 2023, 20, 2505505. [Google Scholar] [CrossRef]
- Dalponte, M.; Solano-Correa, Y.T.; Marinelli, D.; Liu, S.; Yokoya, N.; Gianelle, D. Detection of forest windthrows with bitemporal COSMO-SkyMed and Sentinel-1 SAR data. Remote Sens. Environ. 2023, 297, 113787. [Google Scholar] [CrossRef]
- Schellenberg, K.; Jagdhuber, T.; Zehner, M.; Hese, S.; Urban, M.; Urbazaev, M.; Hartmann, H.; Schmullius, C.; Dubois, C. Potential of Sentinel-1 SAR to Assess Damage in Drought-Affected Temperate Deciduous Broadleaf Forests. Remote Sens. 2023, 15, 1004. [Google Scholar] [CrossRef]
- Soudani, K.; Delpierre, N.; Berveiller, D.; Hmimina, G.; Vincent, G.; Morfin, A.; Dufrêne, É. Potential of C-band Synthetic Aperture Radar Sentinel-1 time-series for the monitoring of phenological cycles in a deciduous forest. Int. J. Appl. Earth Obs. Geoinf. 2021, 104, 102505. [Google Scholar] [CrossRef]
- Lechner, M.; Dostálová, A.; Hollaus, M.; Atzberger, C.; Immitzer, M. Combination of Sentinel-1 and Sentinel-2 Data for Tree Species Classification in a Central European Biosphere Reserve. Remote Sens. 2022, 14, 2687. [Google Scholar] [CrossRef]
- Bullock, E.L.; Healey, S.P.; Yang, Z.; Houborg, R.; Gorelick, N.; Tang, X.; Andrianirina, C. Timeliness in forest change monitoring: A new assessment framework demonstrated using Sentinel-1 and a continuous change detection algorithm. Remote Sens. Environ. 2022, 276, 113043. [Google Scholar] [CrossRef]
- Ruiz-Ramos, J.; Marino, A.; Boardman, C.; Suarez, J. Continuous Forest Monitoring Using Cumulative Sums of Sentinel-1 Timeseries. Remote Sens. 2020, 12, 3061. [Google Scholar] [CrossRef]
- Sora, N.D.; Mannu, R.; Rossini, L.; Contarini, M.; Gallego, D.; Speranza, S. Using Species Distribution Models (SDMs) to Estimate the Suitability of European Mediterranean Non-Native Area for the Establishment of Toumeyella Parvicornis (Hemiptera: Coccidae). Insects 2023, 14, 46. [Google Scholar] [CrossRef]
- Parisi, F.; Amico, G.; Francini, S.; Vangi, E.; Travaglini, D.; Chirici, G. Monitoring Toumeyella parvicornis (Hemiptera, Coccidae) Infestation in Italian Mediterranean Pine Forests Using Sentinel-2 Imagery. In Proceedings of the Conference: XXVII Congresso Nazionale Italiano di Entomologia, Palermo, Italy, 12–16 June 2023. [Google Scholar]
- Sora, N.D.; Rossini, L.; Contarini, M.; Chiarot, E.; Speranza, S. Endotherapic treatment to control Toumeyella parvicornis COCKERELL infestations on Pinus pinea L. Pest Manag. Sci. 2022, 78, 2443–2448. [Google Scholar] [CrossRef]
- Niccoli, F.; Kabala, J.; Altieri, S.; Faugno, S.; Battipaglia, G. Impact of Toumeyella Parvicornis Outbreak in Pinus pinea L. Forest of Southern Italy: First Detection Using a Dendrochronological, Isotopic and Remote Sensing Analysis. For. Ecol. Manag. 2024, 566, 122086. [Google Scholar] [CrossRef]
- Lazio, R. SCHEDA Toumeyella parvicornis Aggiornata. 2023. Available online: https://www.regione.lazio.it/sites/default/files/2023-09/SCHEDA-Toumeyella-parvicornis-aggiornata-08-09-2023.pdf (accessed on 12 February 2025).
- Lasaponara, R.; Abate, N.; Masini, N. Early Identification of Vegetation Pest Diseases Using Sentinel 2 NDVI Time Series 2016–2023: The Case of Toumeyella Parvicornis at Castel Porziano (Italy). IEEE Geosci. Remote Sens. Lett. 2024, 21, 2502305. [Google Scholar] [CrossRef]
- Beck, H.E.; Zimmermann, N.E.; McVicar, T.R.; Vergopolan, N.; Berg, A.; Wood, E.F. Present and future Köppen-Geiger climate classification maps at 1-km resolution. Sci. Data 2018, 5, 180214. [Google Scholar] [CrossRef]
- European Environment Agency. Tree Cover Density 2018 (Raster 10 m), Europe, 3-Yearly, September 2020. Available online: https://doi.org/10.2909/486F77DA-D605-423E-93A9-680760AB6791 (accessed on 20 June 2025).
- Frieden, B.R. Fisher information, disorder, and the equilibrium distributions of physics. Phys. Rev. A 1990, 41, 4265–4276. [Google Scholar] [CrossRef] [PubMed]
- Shannon, C.E. A mathematical theory of communication. Bell Syst. Tech. J. 1948, 27, 379–423. [Google Scholar] [CrossRef]
- Telesca, L.; Lovallo, M. On the performance of Fisher Information Measure and Shannon entropy estimators. Phys. A Stat. Mech. Its Appl. 2017, 484, 569–576. [Google Scholar] [CrossRef]
- Devroye, L. A Course in Density Estimation; Birkhauser Boston Inc.: Basel, Switzerland, 1987. [Google Scholar]
- Janicki, A.; Weron, A. Simulation and Chaotic Behavior of Alpha-Stable Stochastic Processes; CRC Press: Boca Raton, FL, USA, 1993. [Google Scholar]
- Troudi, M.; Alimi, A.M.; Saoudi, S. Analytical Plug-in Method for Kernel Density Estimator Applied to Genetic Neutrality Study. EURASIP J. Adv. Signal Process. 2008, 2008, 739082. [Google Scholar] [CrossRef]
- Raykar, V.C.; Duraiswami, R. Fast Optimal Bandwidth Selection for Kernel Density Estimation. In Proceedings of the 2006 SIAM International Conference on Data Mining, SIAM, Bethesda, MD, USA, 20–22 April 2006; pp. 524–528. [Google Scholar]
- Fawcett, T. An introduction to ROC analysis. Pattern Recognit. Lett. 2006, 27, 861–874. [Google Scholar] [CrossRef]
- Pirotti, F.; Adedipe, O.; Leblon, B. Sentinel-1 Response to Canopy Moisture in Mediterranean Forests before and after Fire Events. Remote Sens. 2023, 15, 823. [Google Scholar] [CrossRef]
- van der Woude, S.; Reiche, J.; Sterck, F.; Nabuurs, G.J.; Vos, M.; Herold, M. Sensitivity of Sentinel-1 Backscatter to Management-Related Disturbances in Temperate Forests. Remote. Sens. 2024, 16, 1553. [Google Scholar] [CrossRef]


| Castel Porziano | Follonica | |
|---|---|---|
| VH (Asc) | 0.03% | 0.03% |
| VV (Asc) | 0.03% | 0.06% |
| VH (Desc) | 0.07% | 0.06% |
| VV (Desc) | 0.07% | 0.06% |
| VH (Asc) | VV (Asc) | VH (Desc) | VV (Desc) | |
|---|---|---|---|---|
| AUC | ||||
| Optimal threshold | 4.1 | 4.5 | 4.4 | 4.3 |
| TPr * | ||||
| FPr * |
| VH (Asc) | VV (Asc) | VH (Desc) | VV (Desc) | |
|---|---|---|---|---|
| AUC | ||||
| Optimal threshold | ||||
| TPr * | ||||
| FPr * |
Disclaimer/Publisher’s Note: The statements, opinions and data contained in all publications are solely those of the individual author(s) and contributor(s) and not of MDPI and/or the editor(s). MDPI and/or the editor(s) disclaim responsibility for any injury to people or property resulting from any ideas, methods, instructions or products referred to in the content. |
© 2025 by the authors. Licensee MDPI, Basel, Switzerland. This article is an open access article distributed under the terms and conditions of the Creative Commons Attribution (CC BY) license (https://creativecommons.org/licenses/by/4.0/).
Share and Cite
Telesca, L.; Abate, N.; Lovallo, M.; Lasaponara, R. Fisher–Shannon Analysis of Sentinel 1 Time Series from 2015 to 2023: Revealing the Impact of Toumeyella Parvicornis Infection in a Pilot Site of Central Italy. Entropy 2025, 27, 721. https://doi.org/10.3390/e27070721
Telesca L, Abate N, Lovallo M, Lasaponara R. Fisher–Shannon Analysis of Sentinel 1 Time Series from 2015 to 2023: Revealing the Impact of Toumeyella Parvicornis Infection in a Pilot Site of Central Italy. Entropy. 2025; 27(7):721. https://doi.org/10.3390/e27070721
Chicago/Turabian StyleTelesca, Luciano, Nicodemo Abate, Michele Lovallo, and Rosa Lasaponara. 2025. "Fisher–Shannon Analysis of Sentinel 1 Time Series from 2015 to 2023: Revealing the Impact of Toumeyella Parvicornis Infection in a Pilot Site of Central Italy" Entropy 27, no. 7: 721. https://doi.org/10.3390/e27070721
APA StyleTelesca, L., Abate, N., Lovallo, M., & Lasaponara, R. (2025). Fisher–Shannon Analysis of Sentinel 1 Time Series from 2015 to 2023: Revealing the Impact of Toumeyella Parvicornis Infection in a Pilot Site of Central Italy. Entropy, 27(7), 721. https://doi.org/10.3390/e27070721