3.2. Results on CFFI
Our analysis begins with a robust discretization of the Caputo fractional derivative applied to our time series. For a series
sampled at uniform time steps
, the derivative of a function
at time
is approximated using a Riemann sum. In particular, the derivative is computed as
where
is determined via finite differences (typically using a centered difference method), and
is the Gamma function. A small constant
(e.g.,
) is introduced in the denominators to avoid numerical instabilities, and the fractional order
is selected from values such as
,
, or
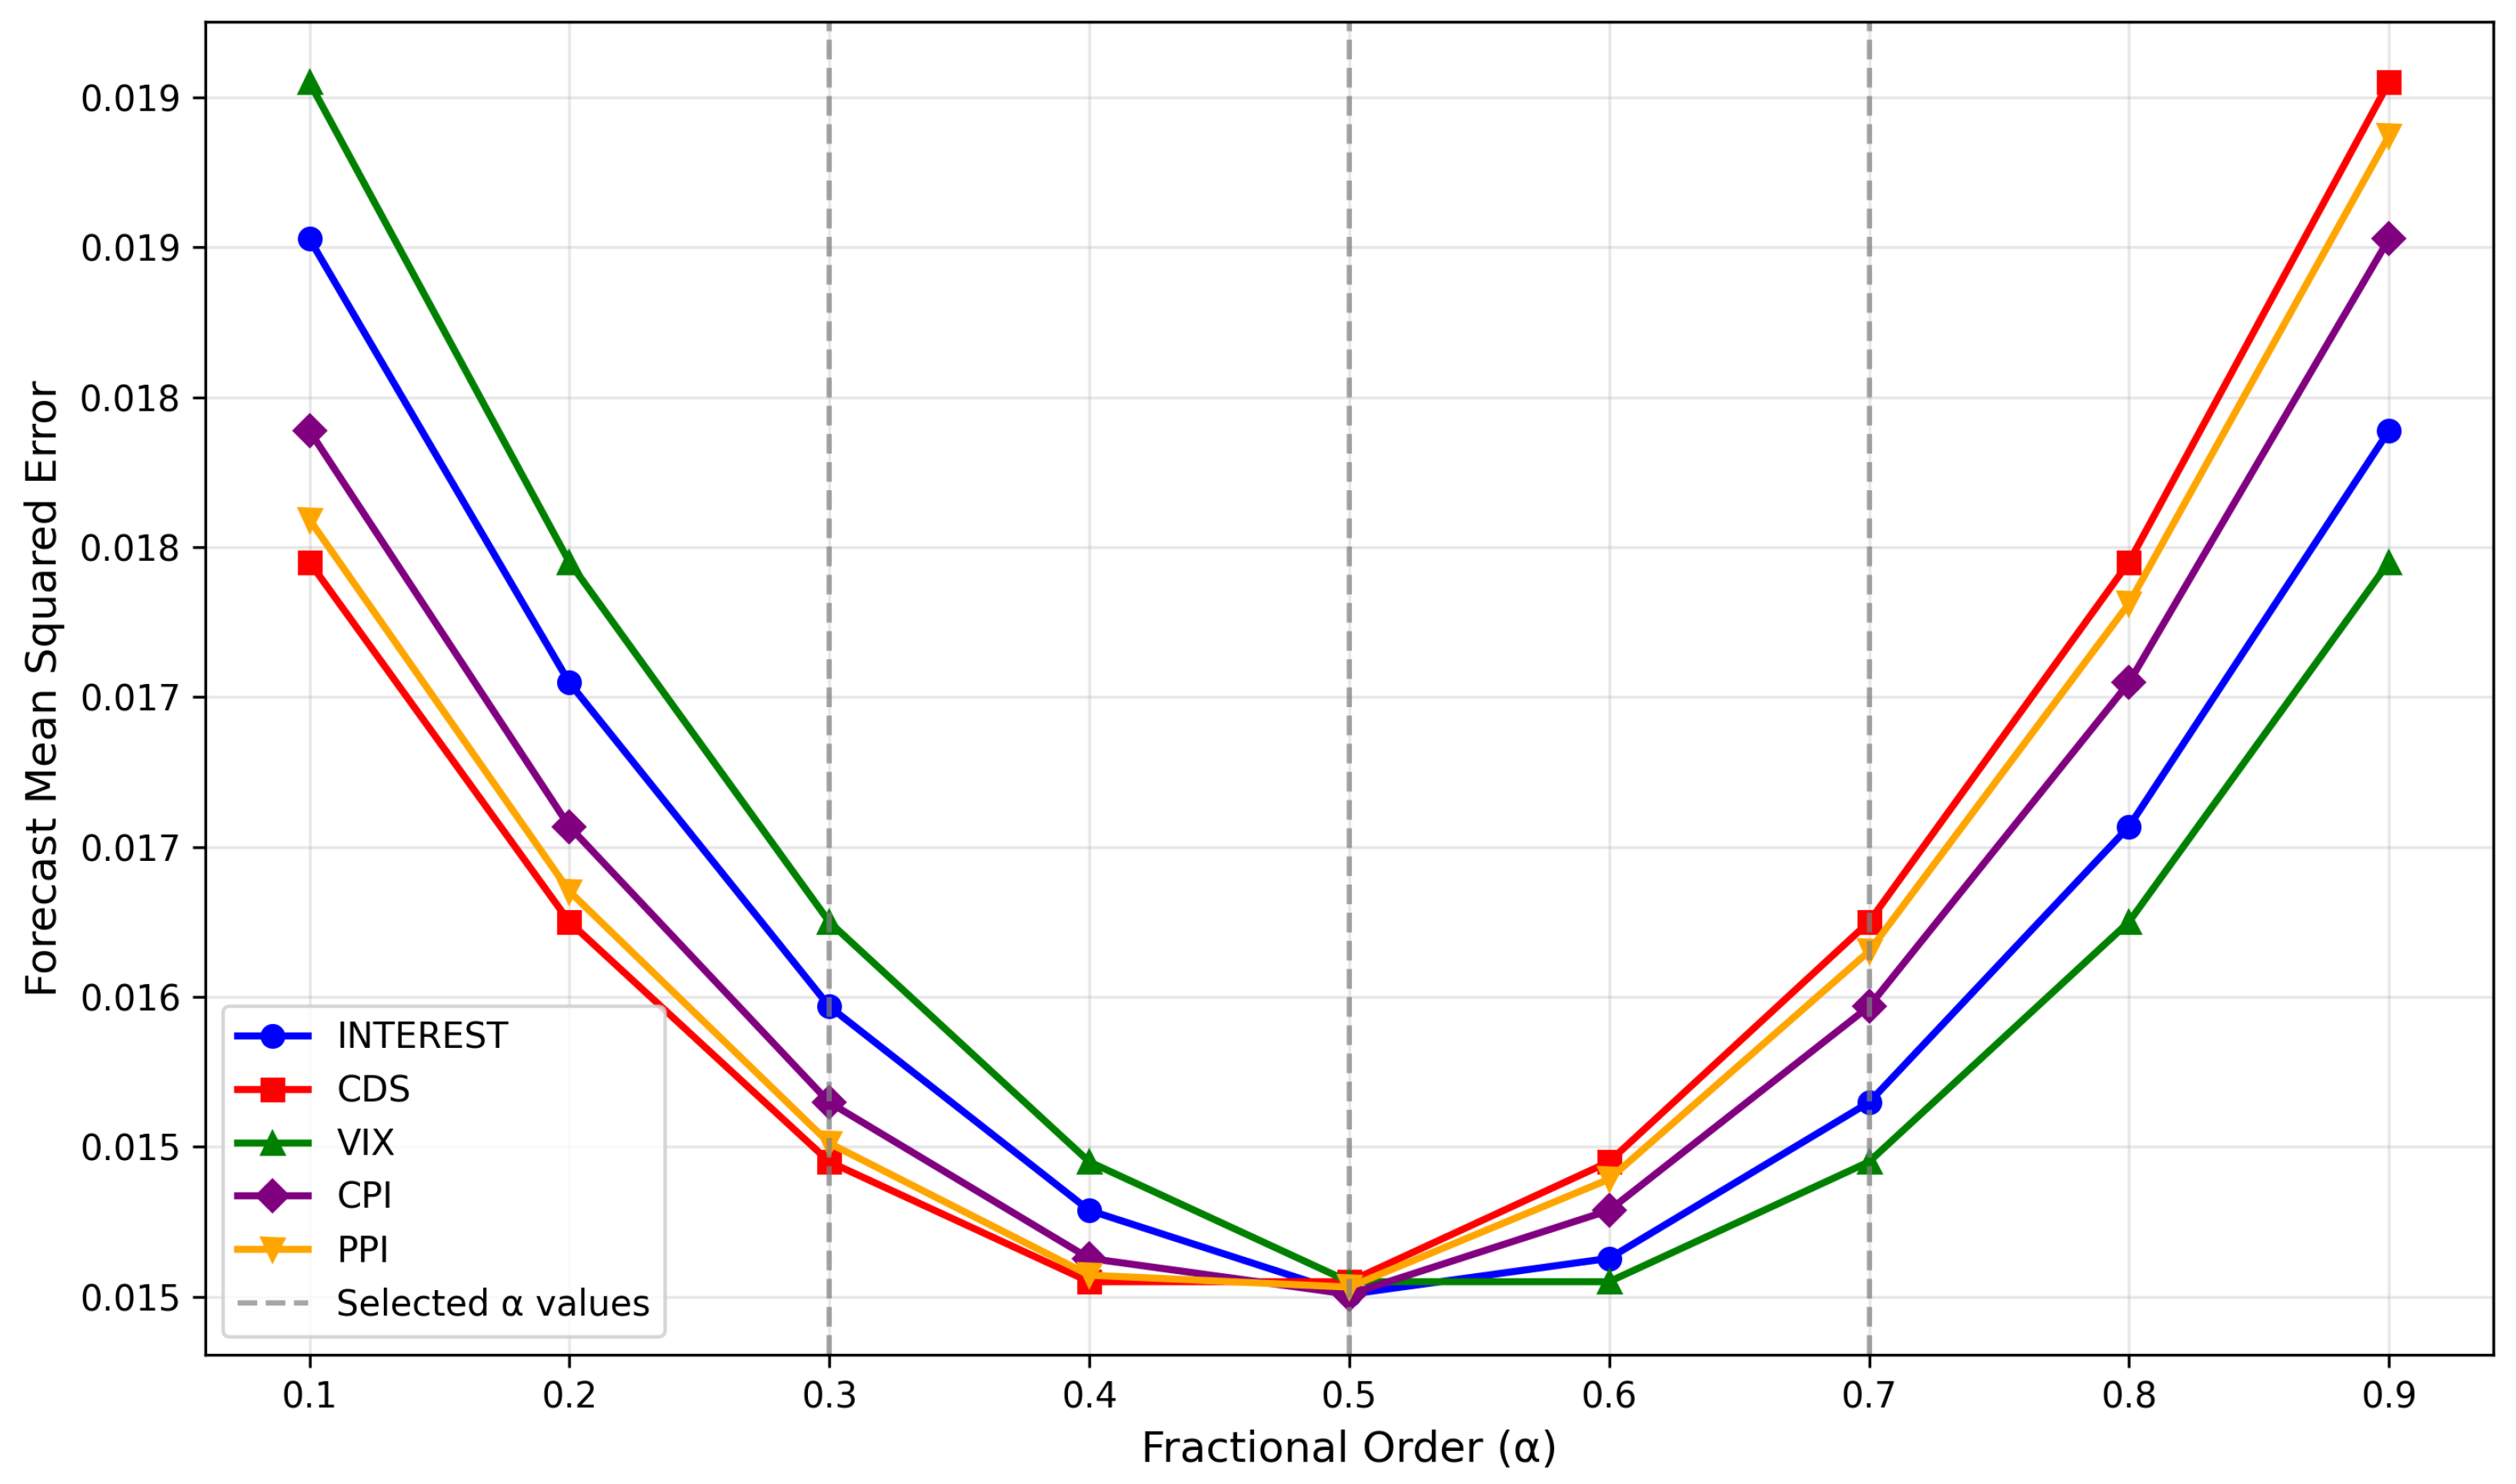
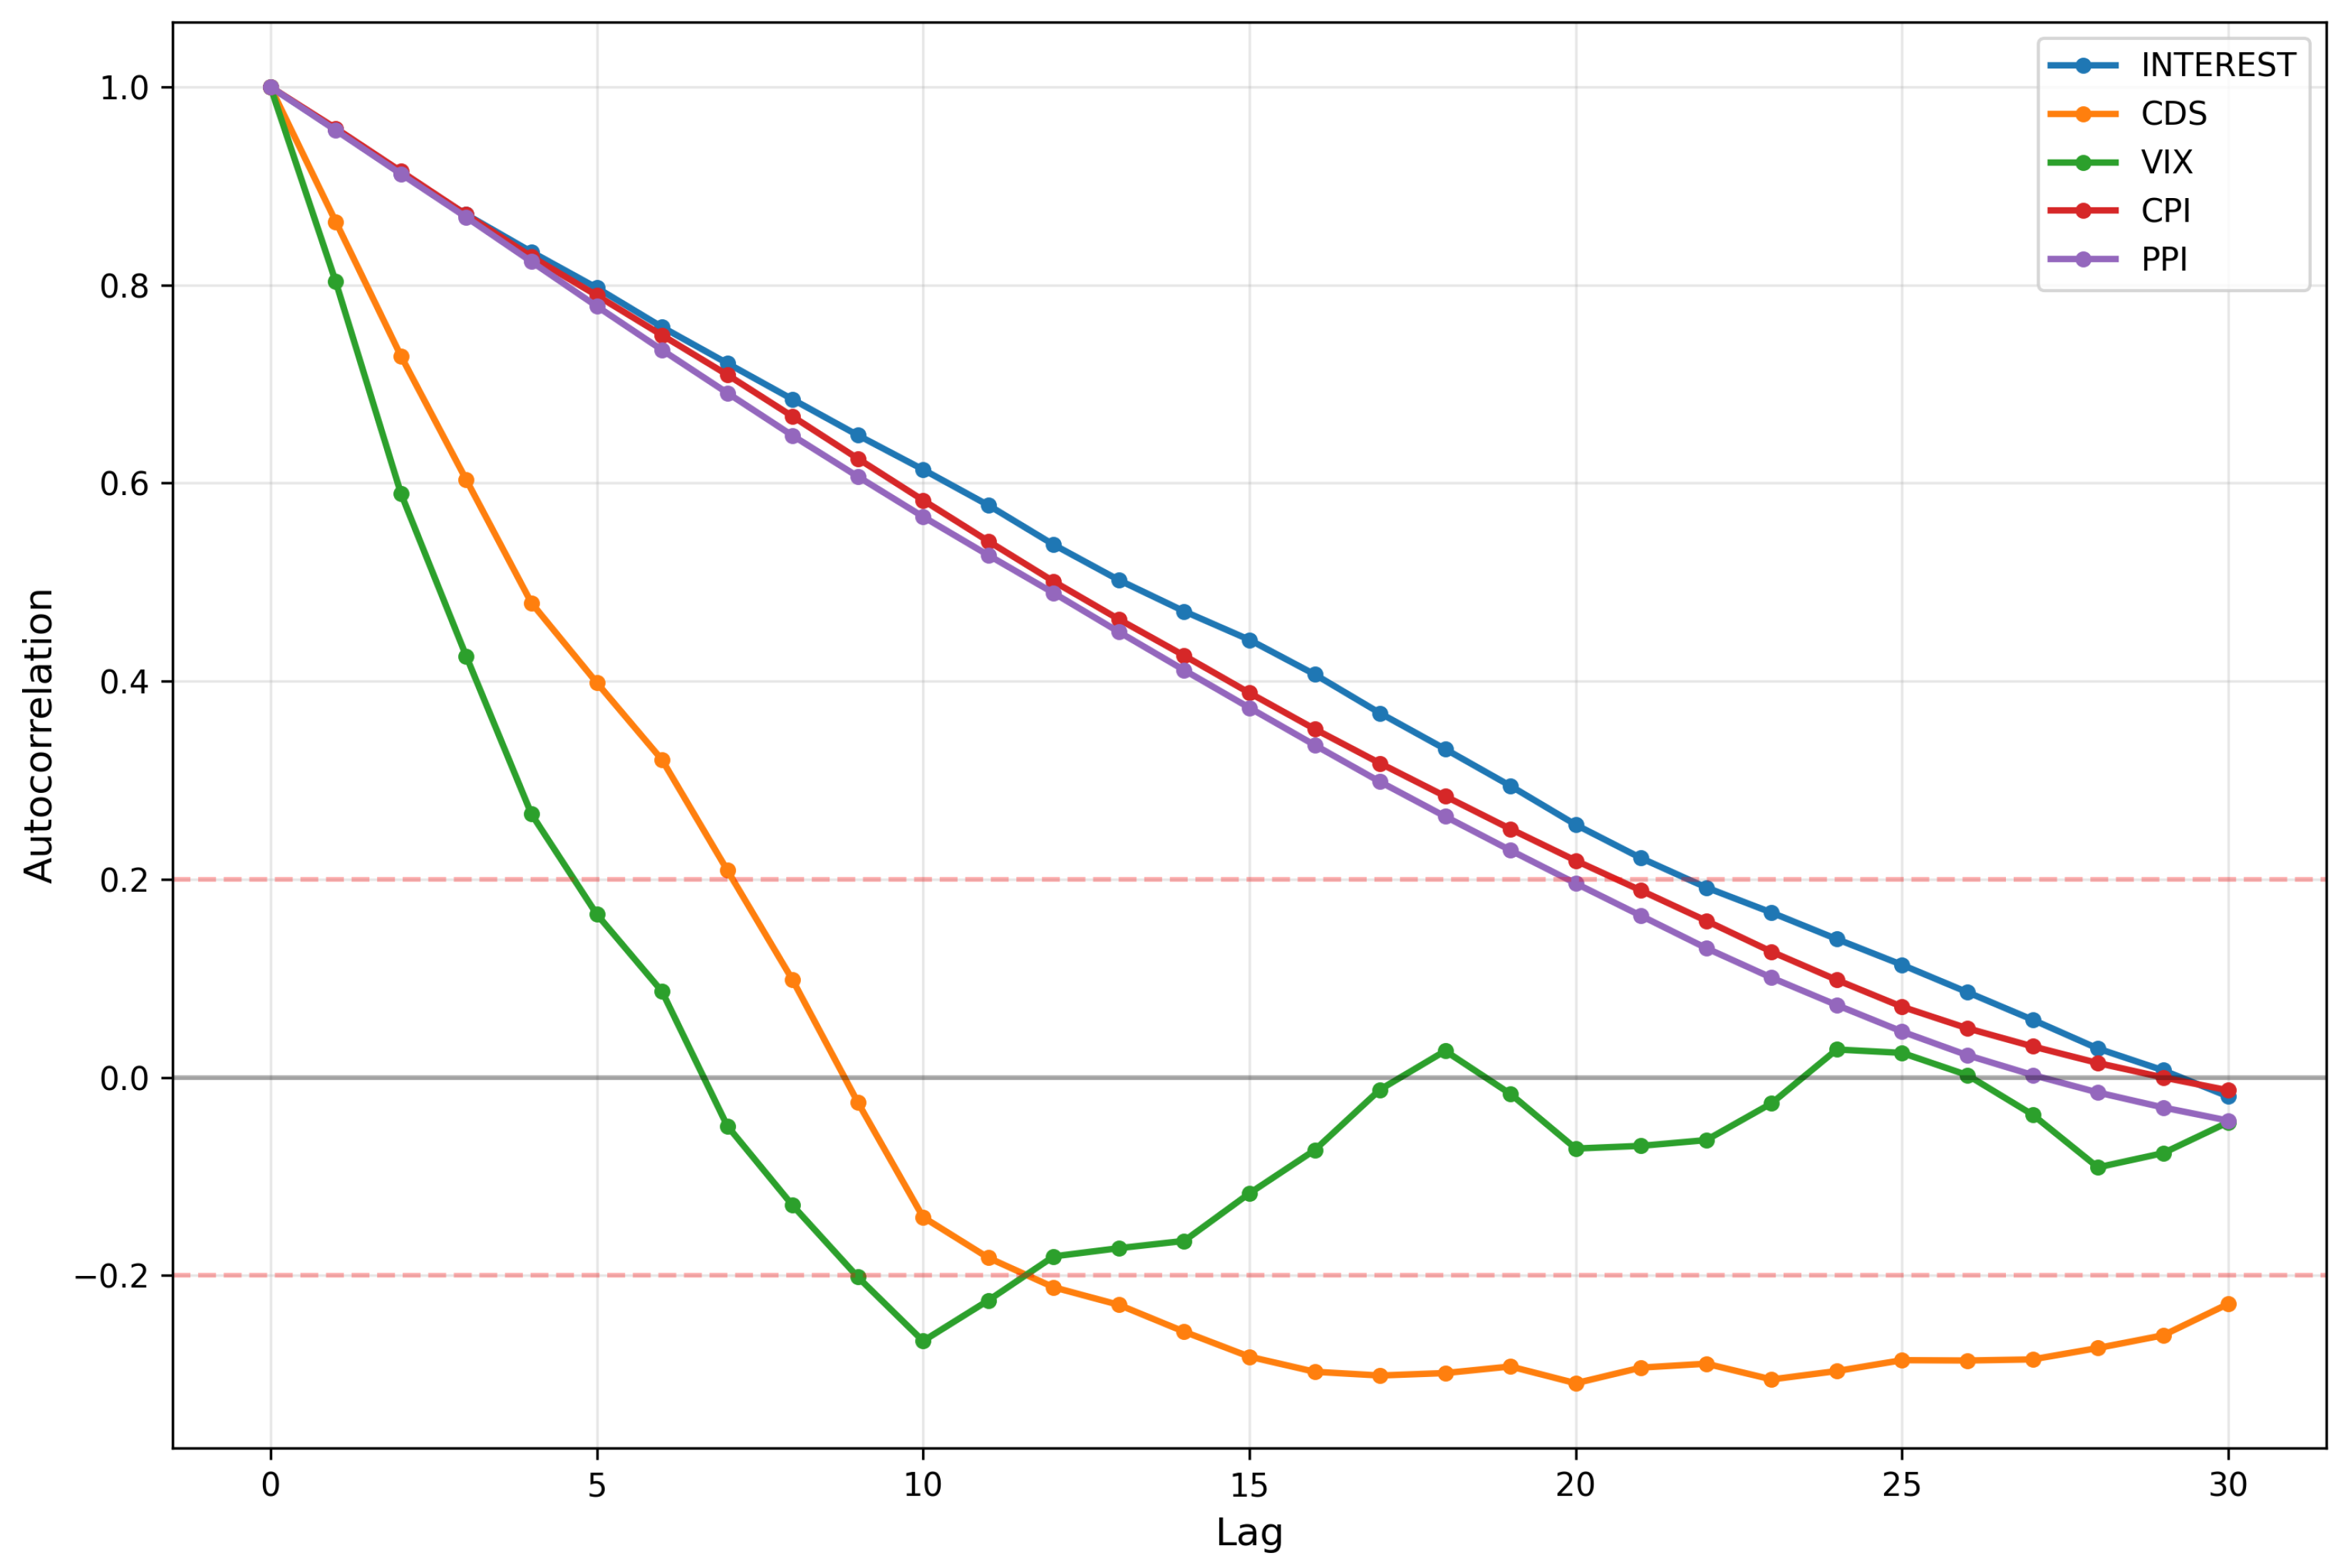
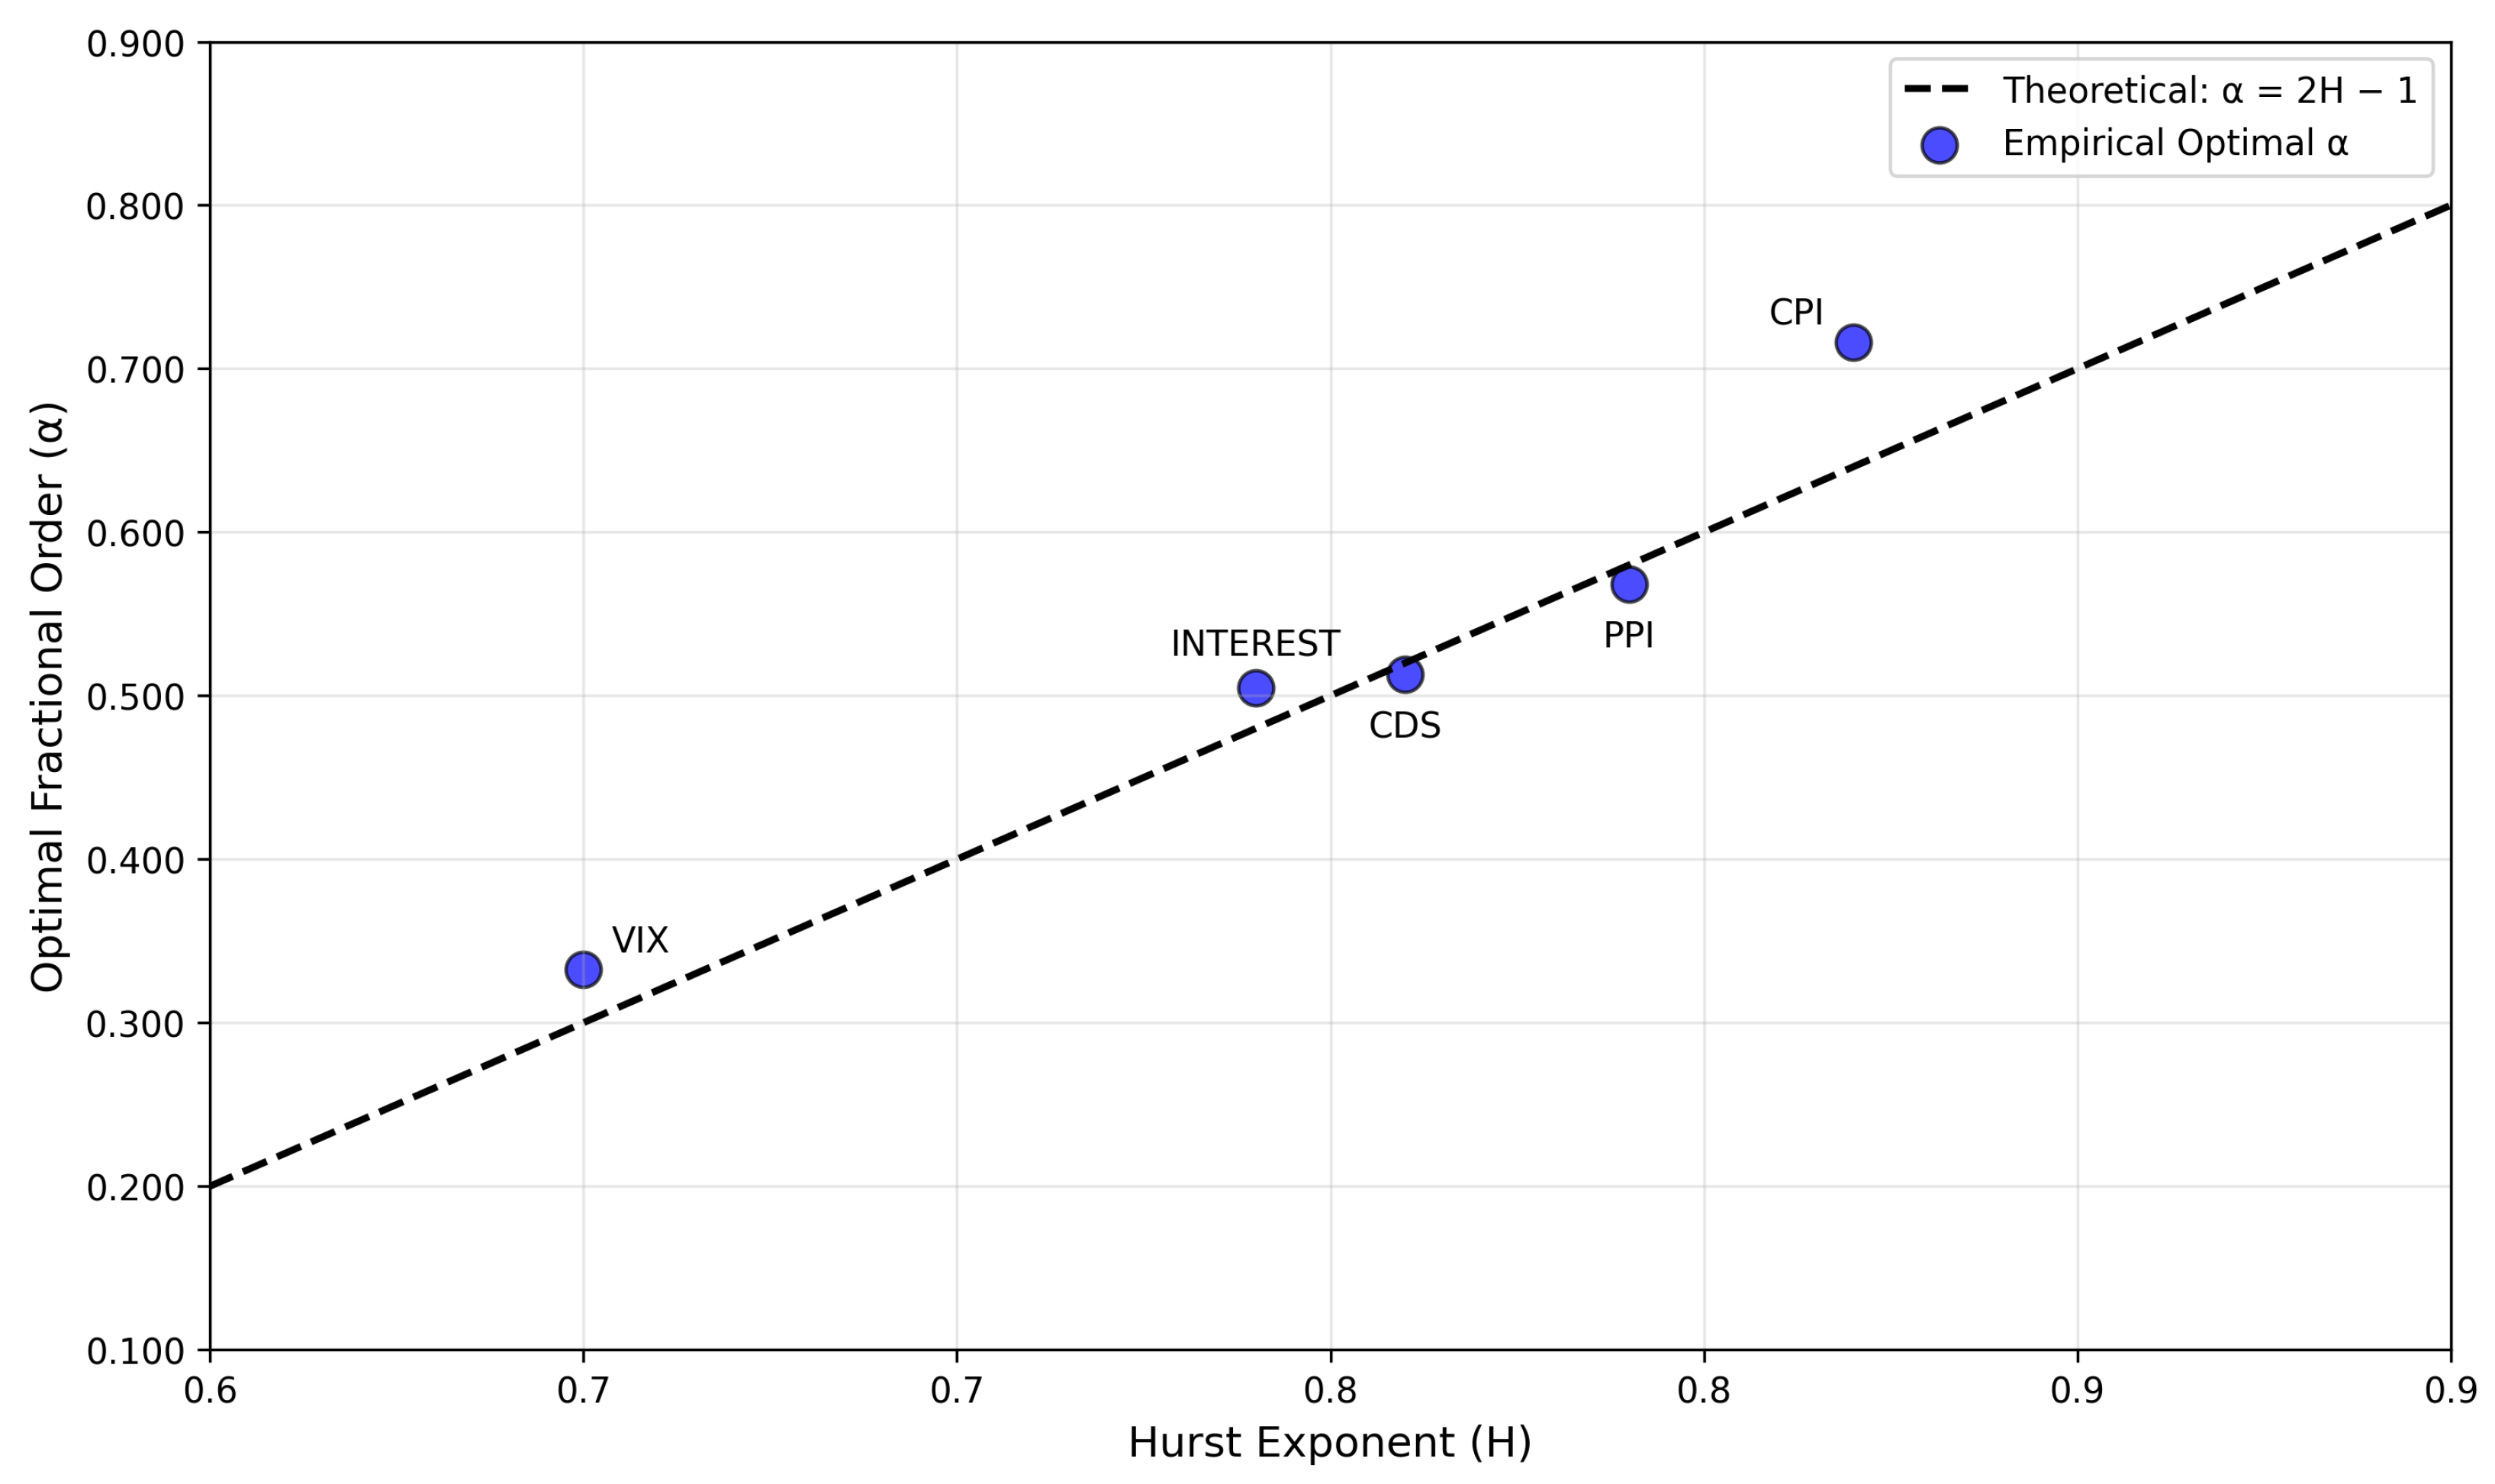
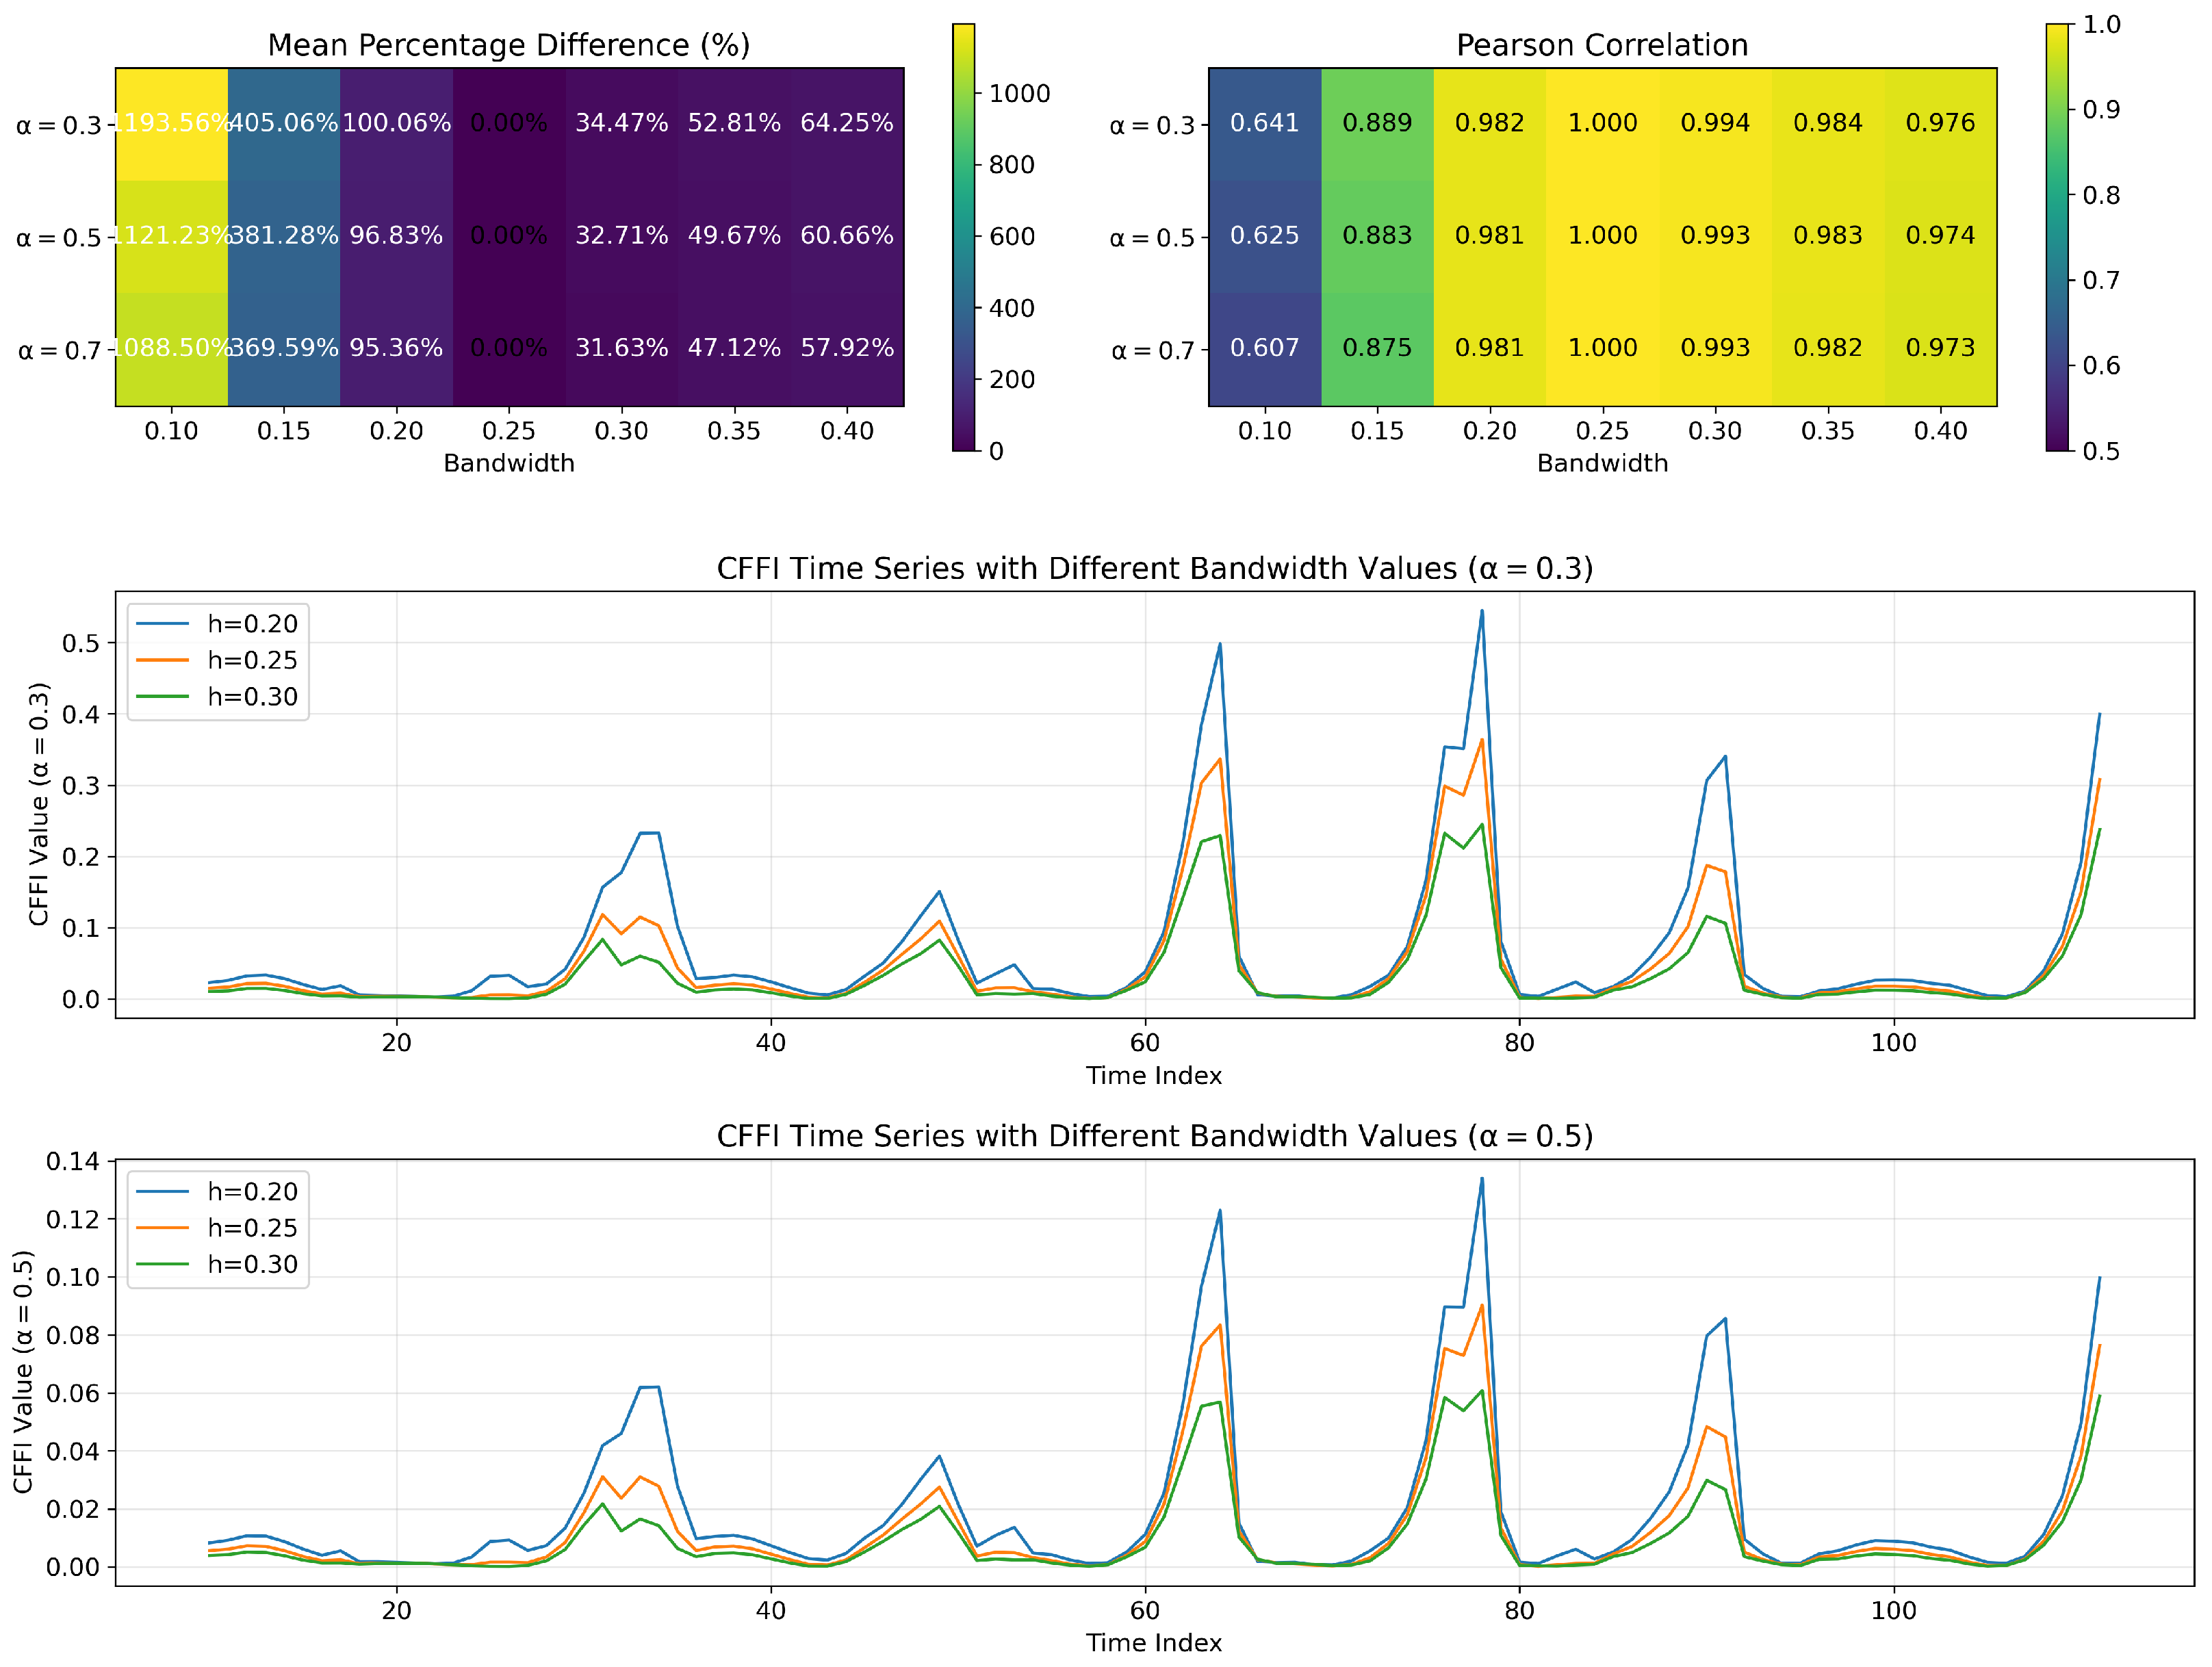
to capture different strengths of memory effects. More details on the choice of
values are presented in
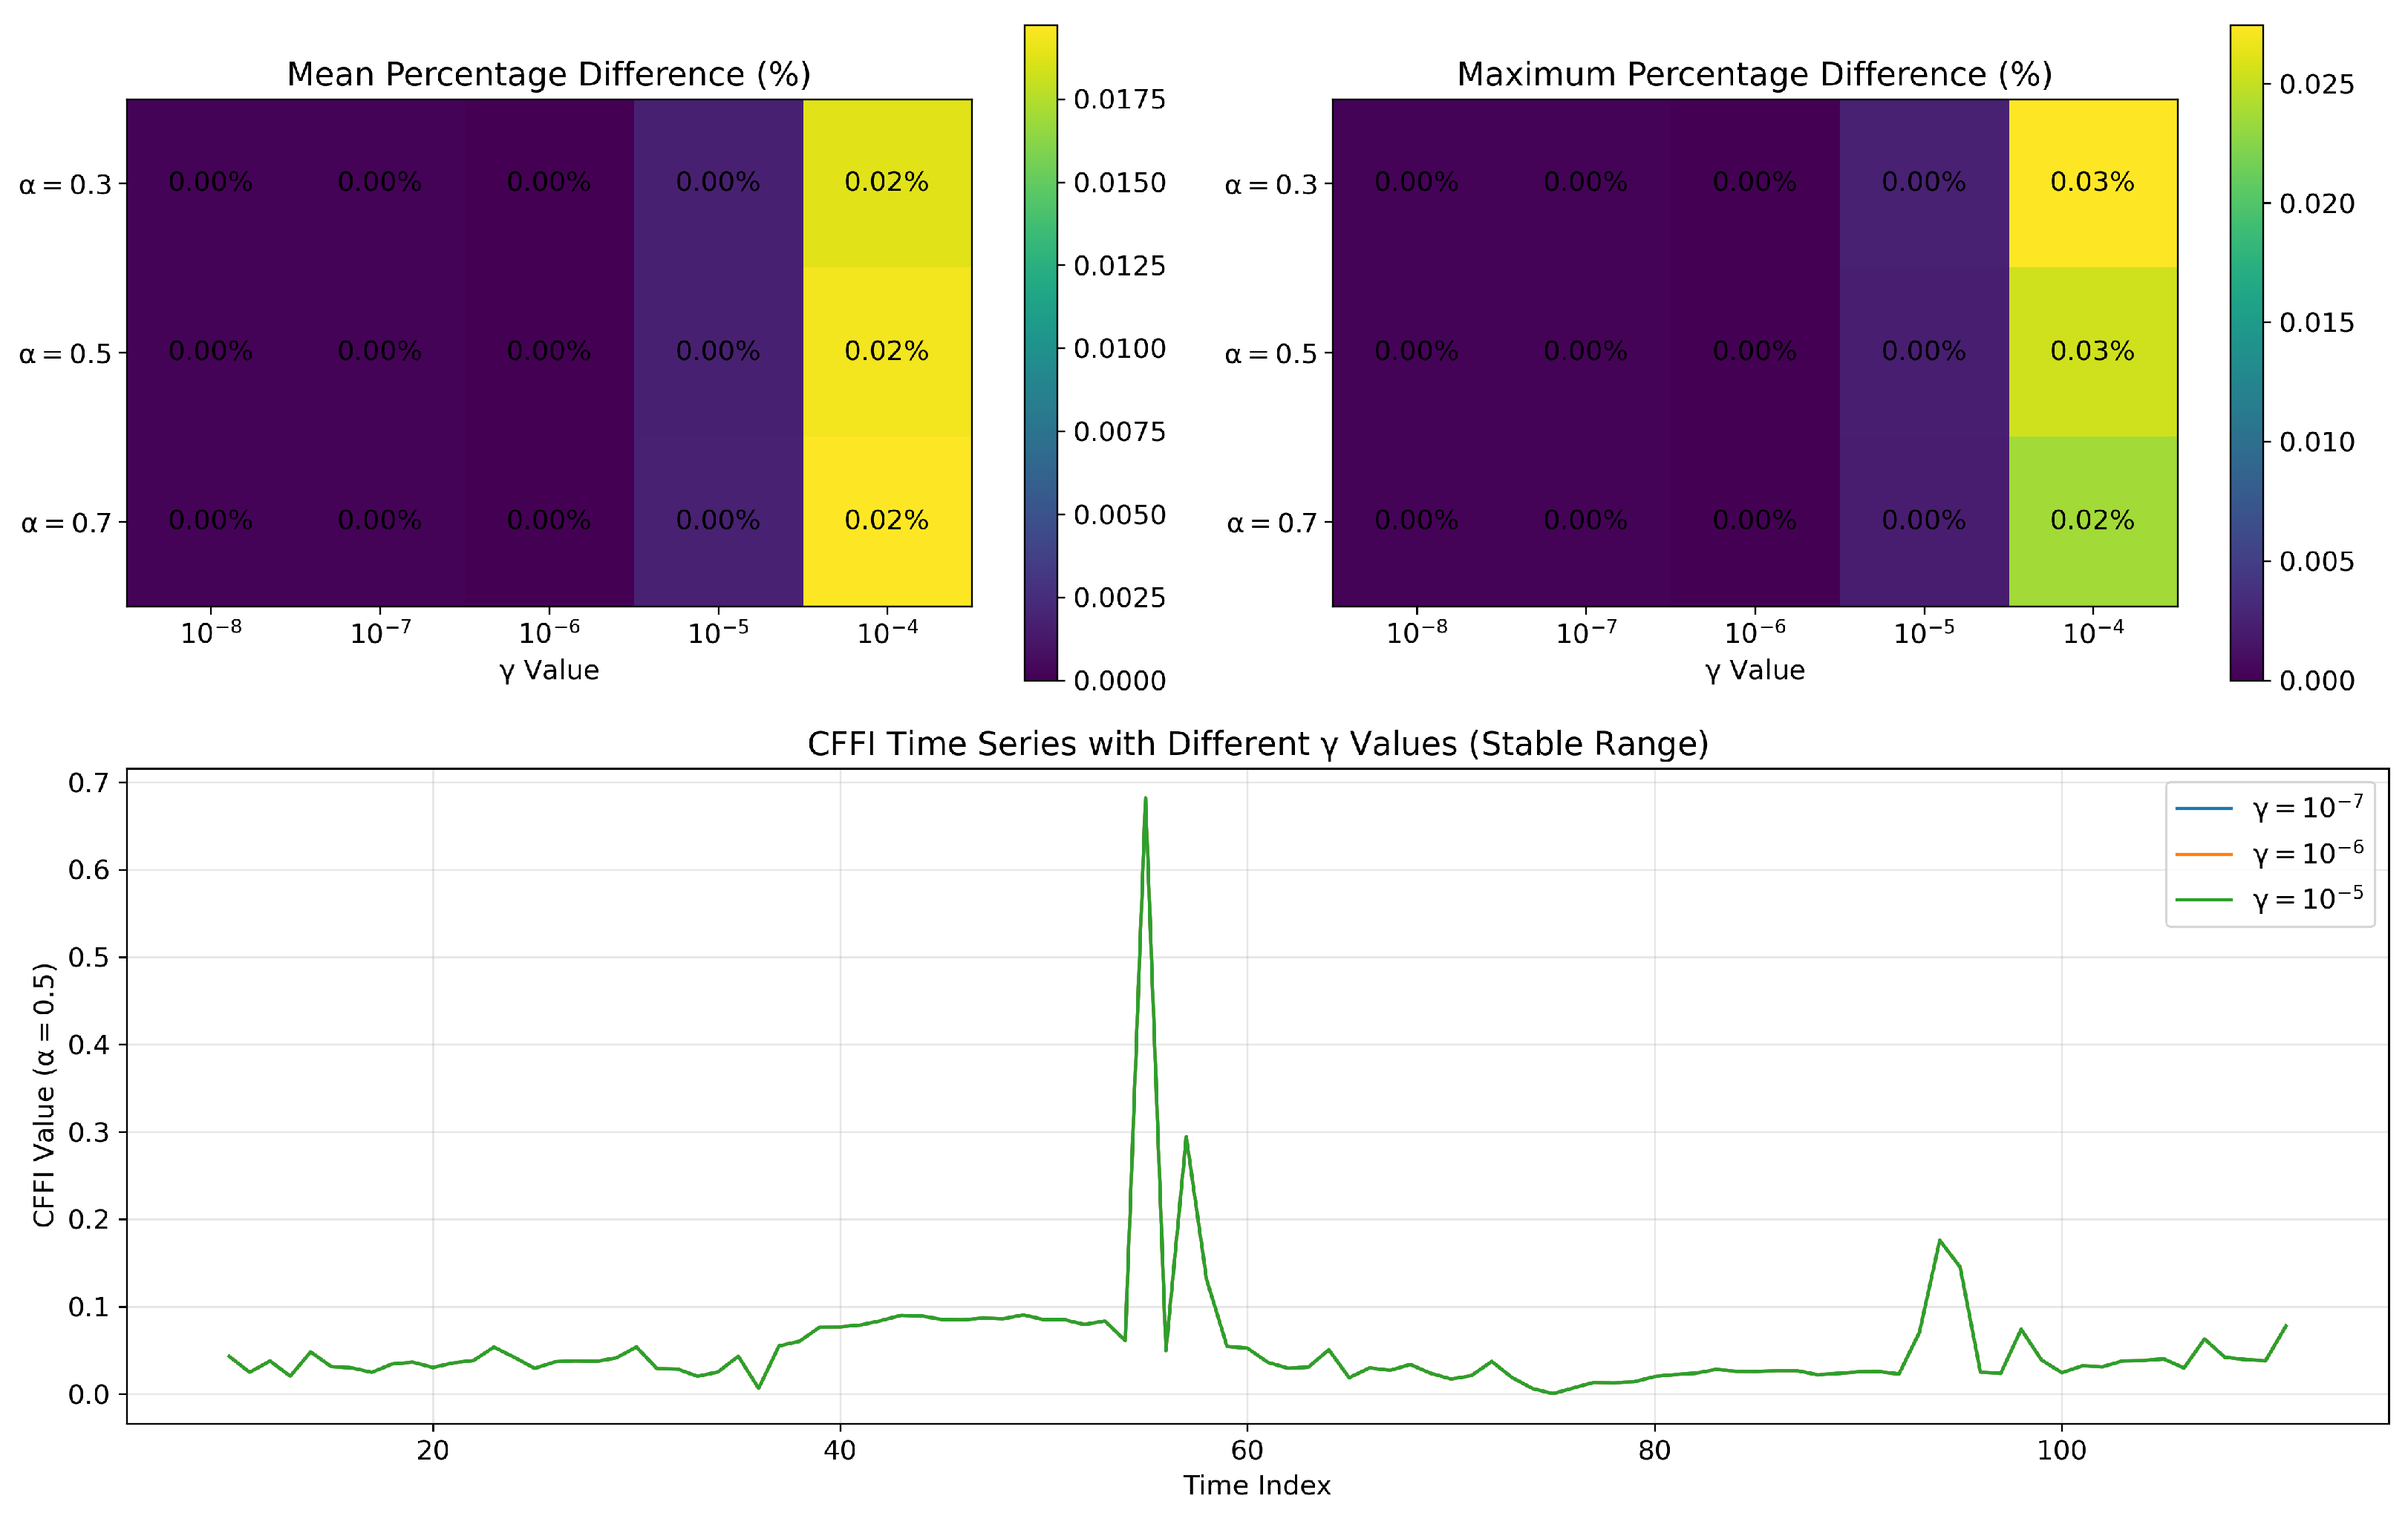
Appendix B, and sensitivity analysis for
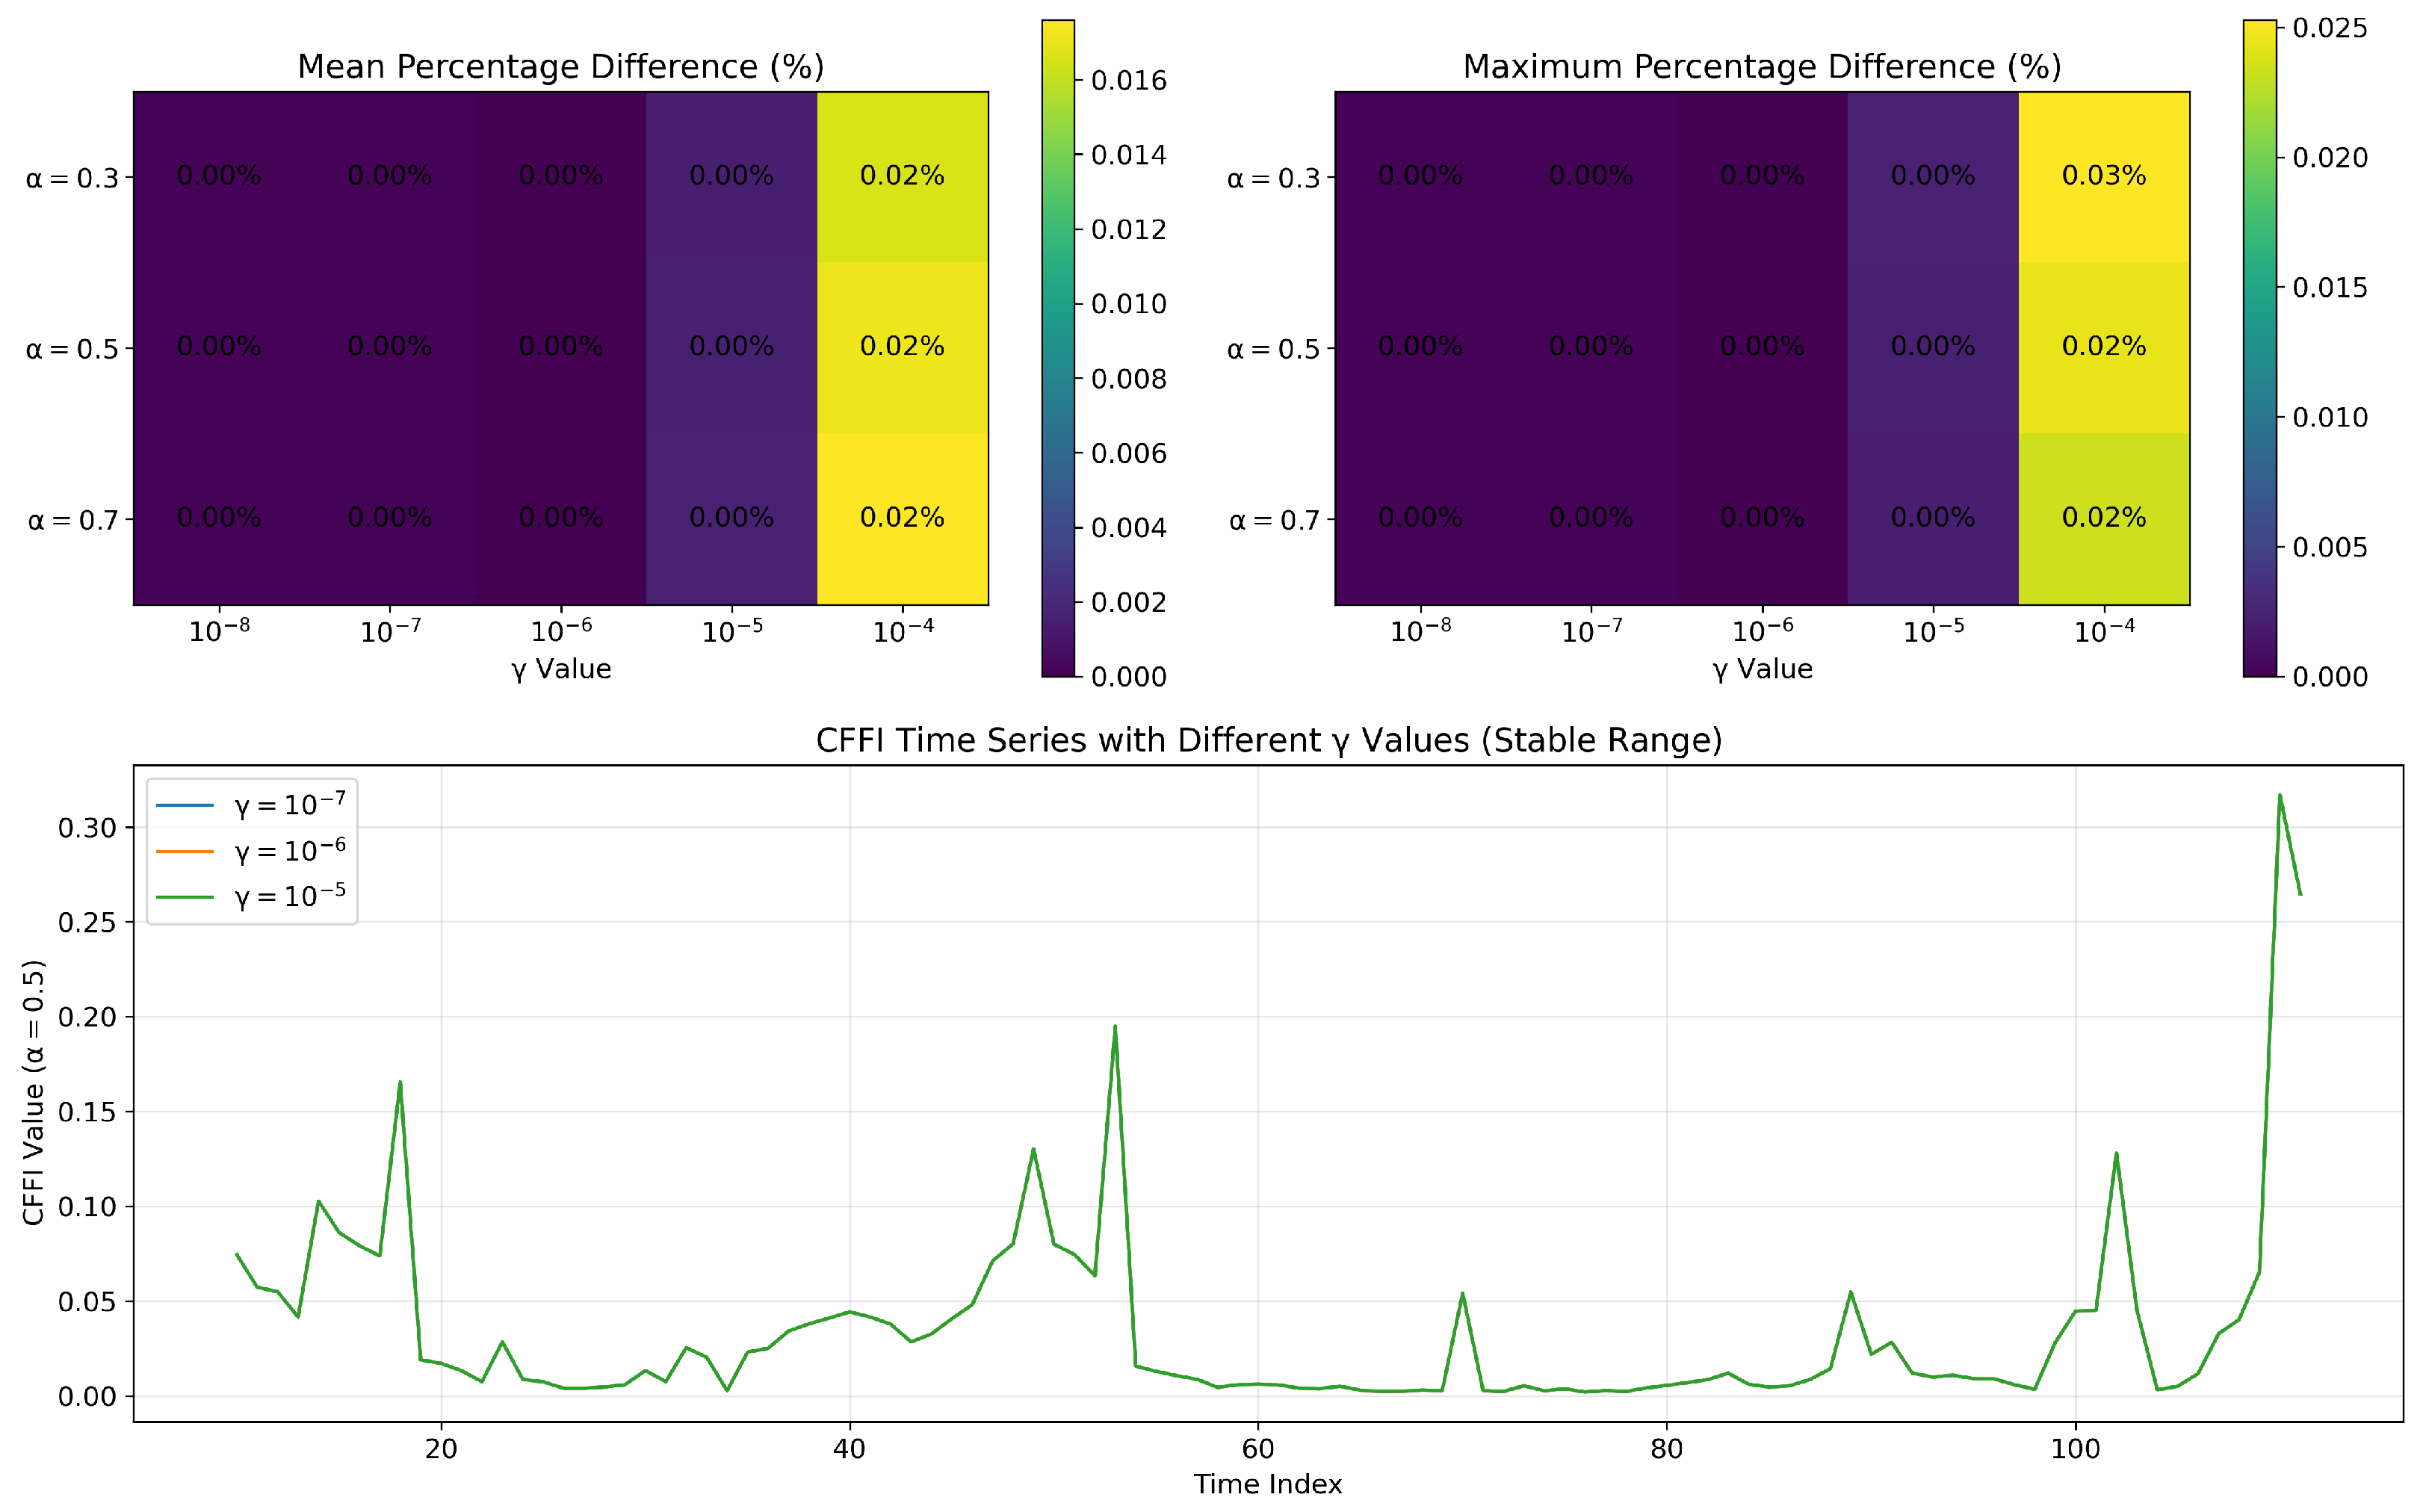
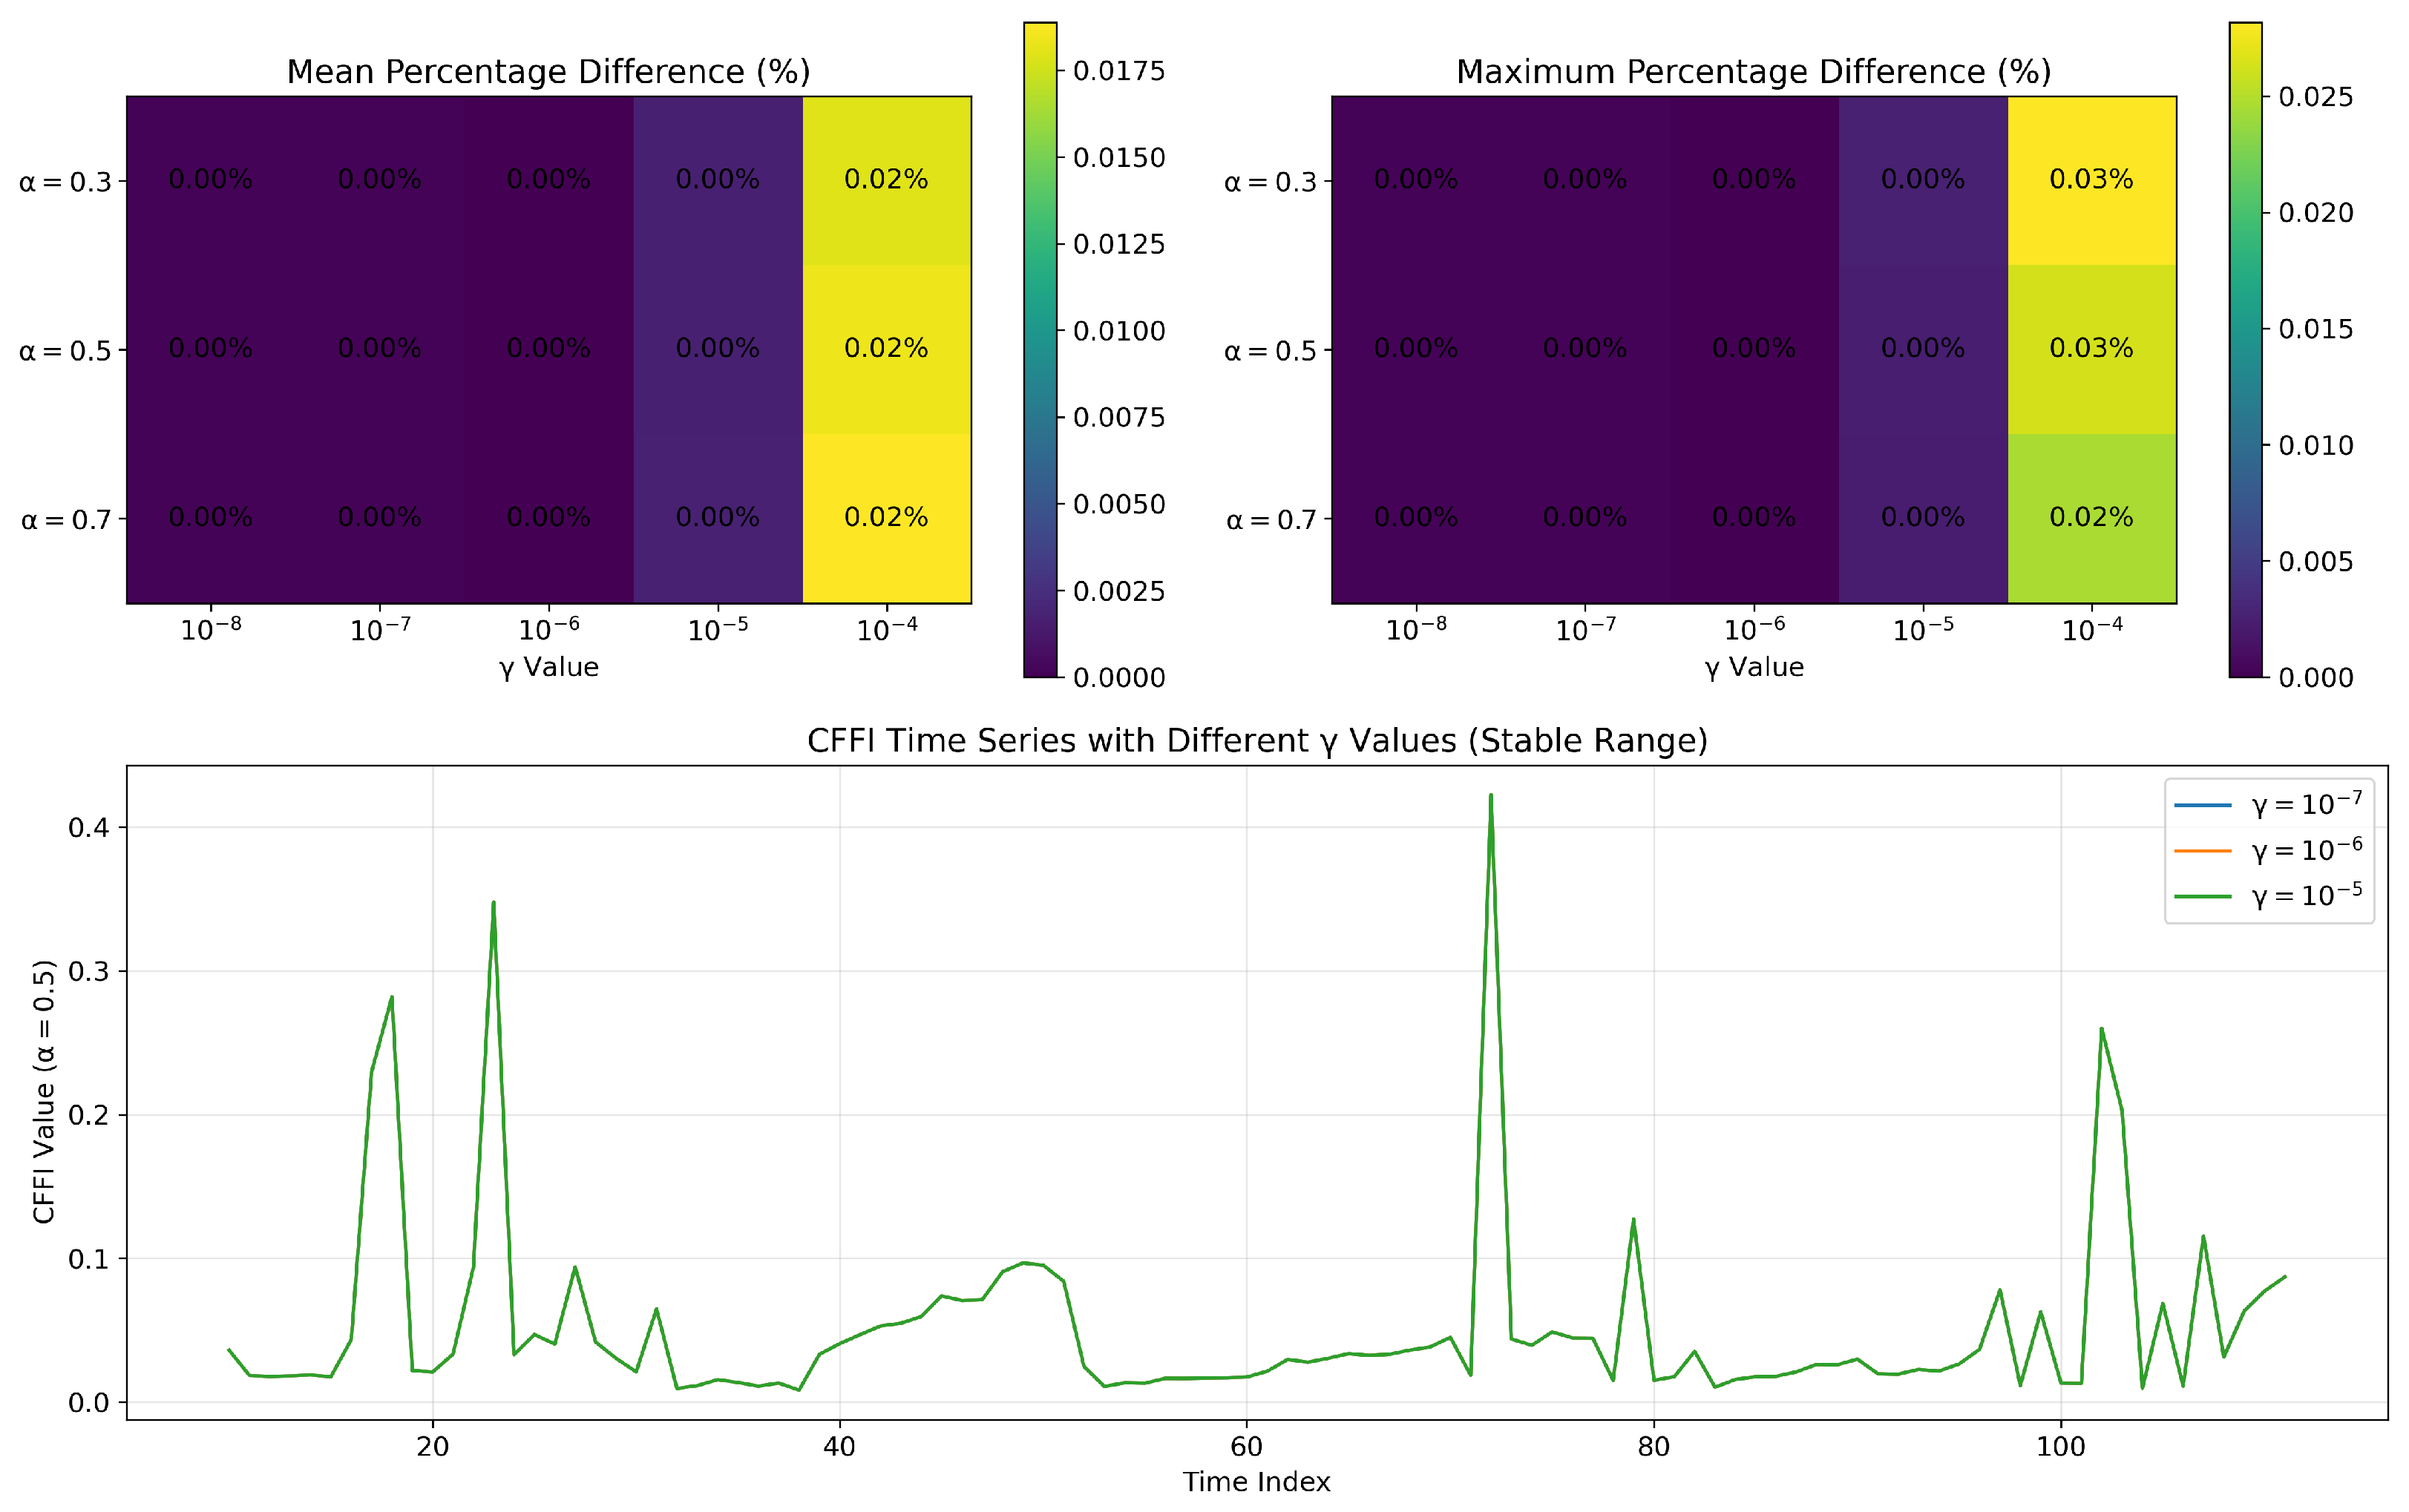
parameter is presented in
Appendix C.
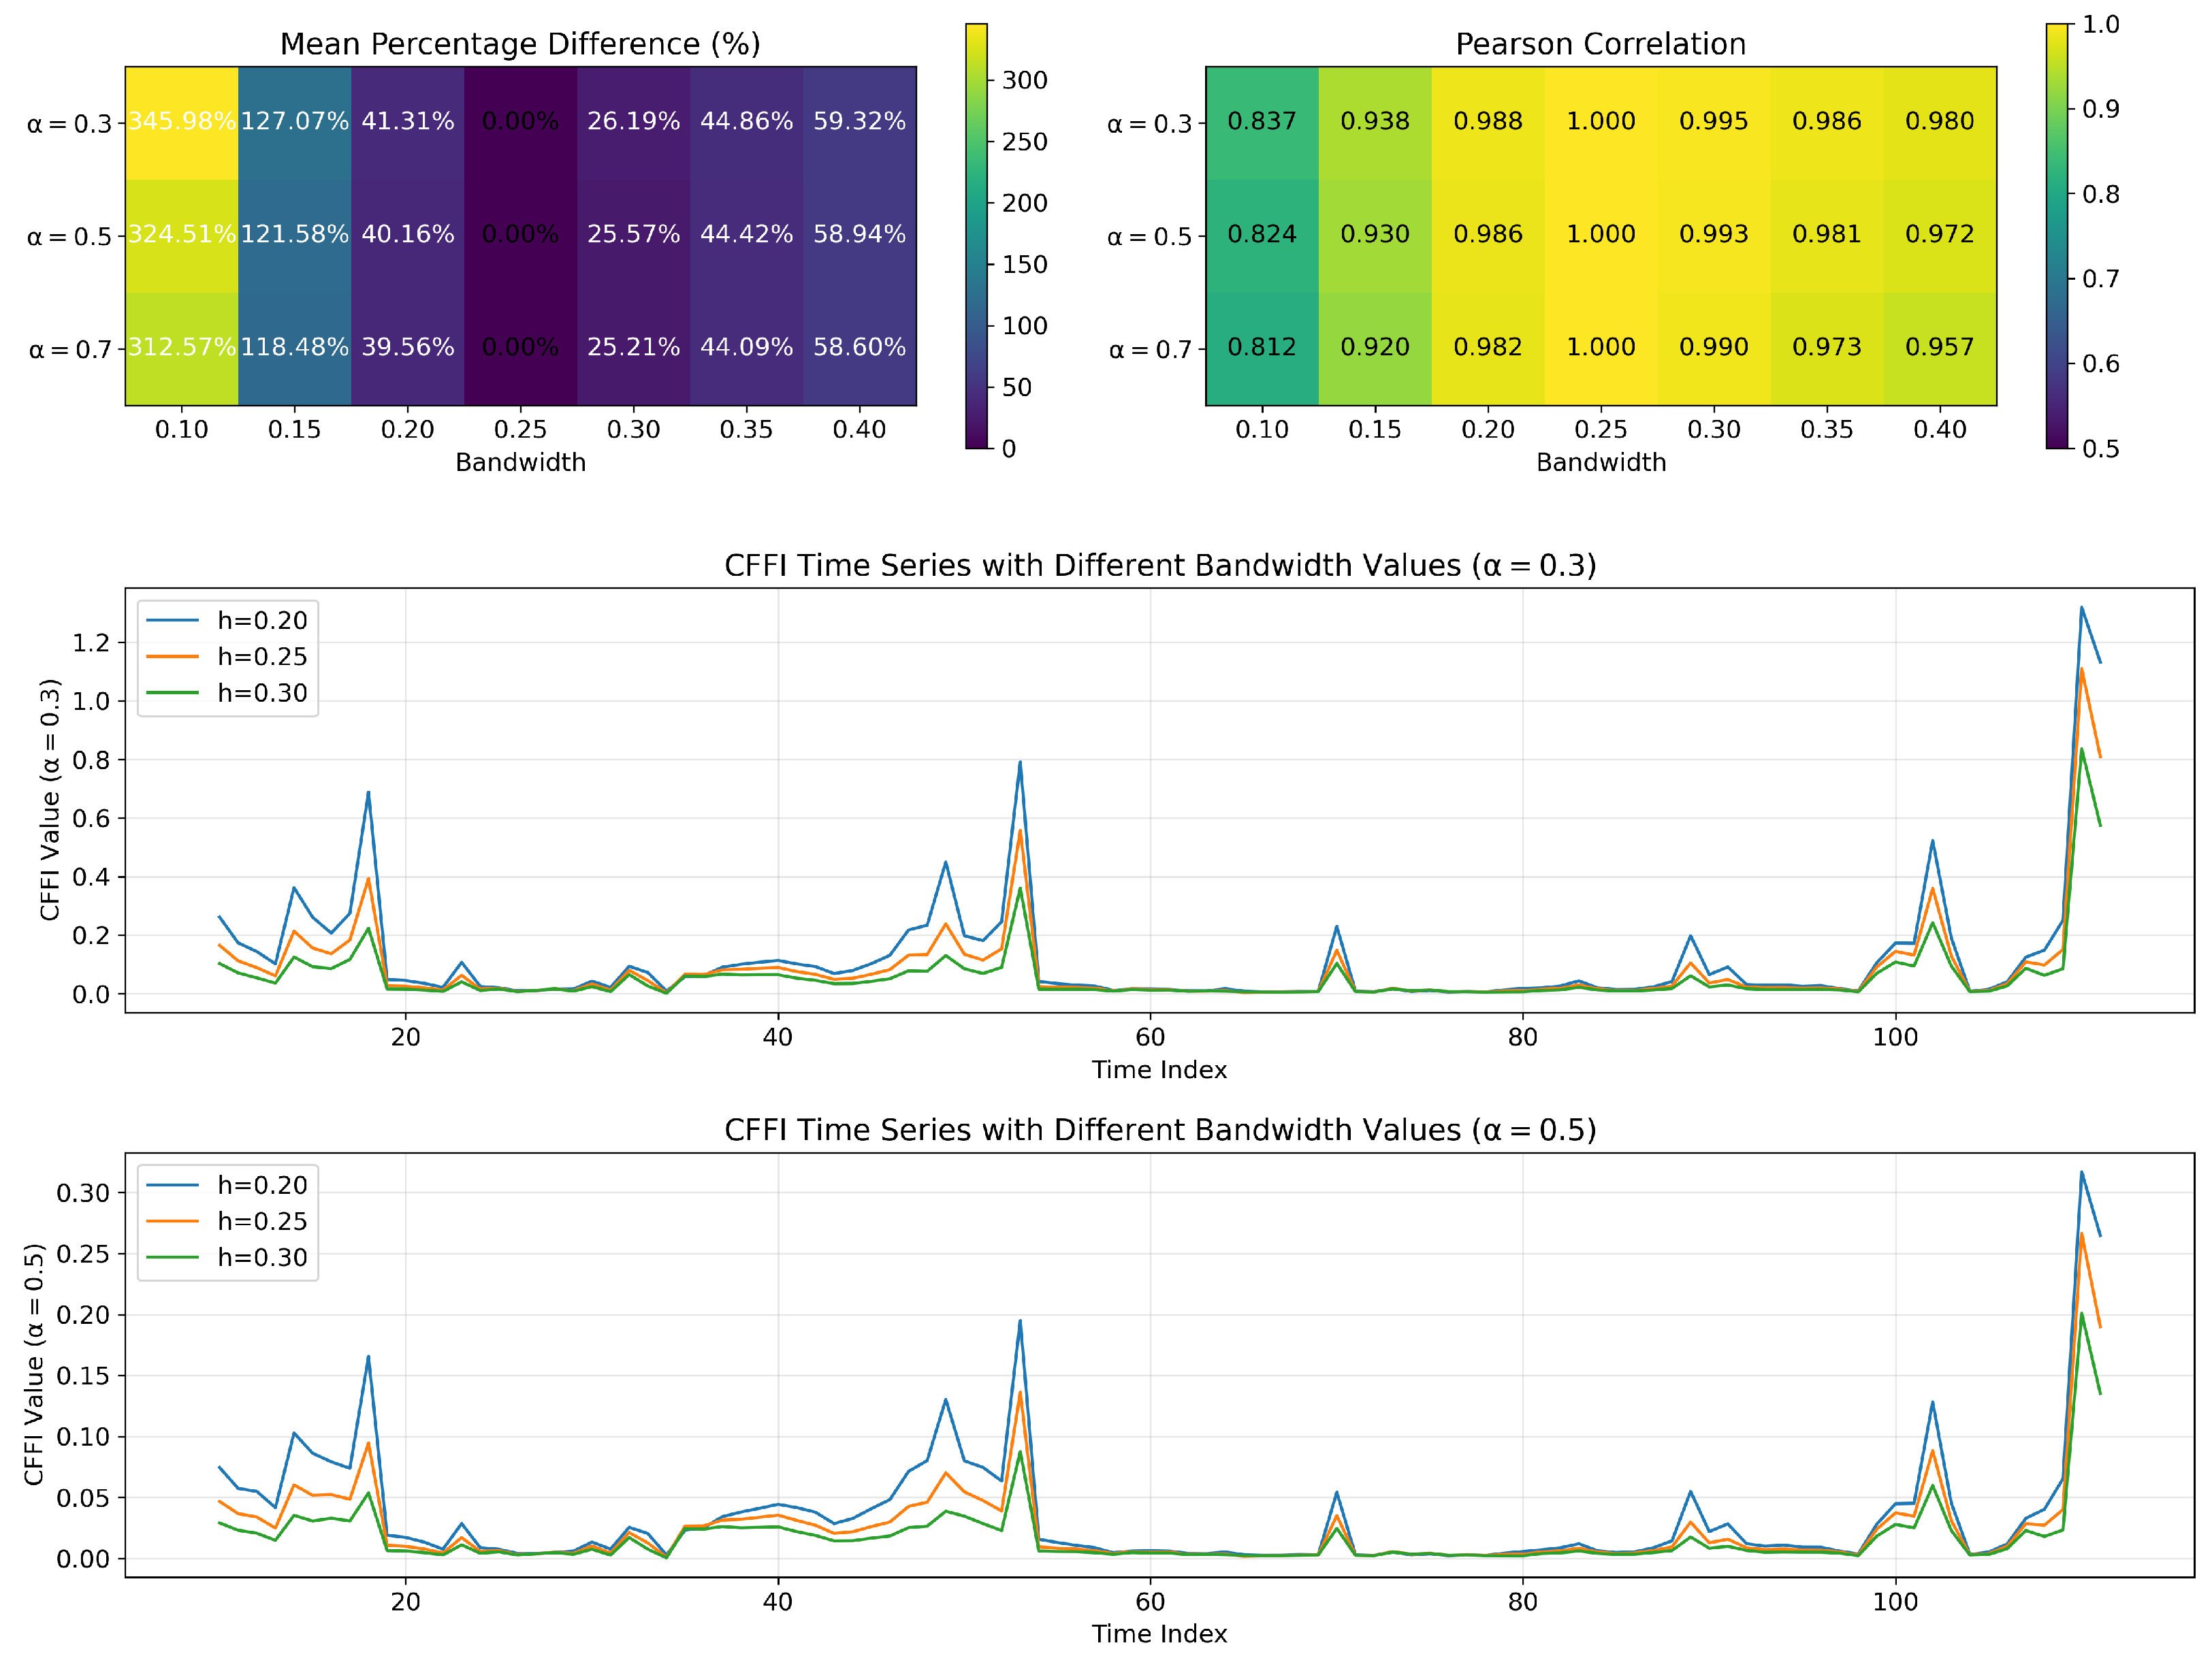
Subsequently, we estimate the log-density of the observed data using a non-parametric density estimation method. In this framework, the observed time series is smoothed using a kernel-based approach with a bandwidth parameter set to approximately
–
. This smoothing process yields an estimate of
, which serves as the input for the fractional derivative calculation. The choice of bandwidth is critical as it balances the trade-off between resolution and smoothness, ensuring that the density is neither over-smoothed nor too noisy. Details on the bandwidth choice is presented in
Appendix D.
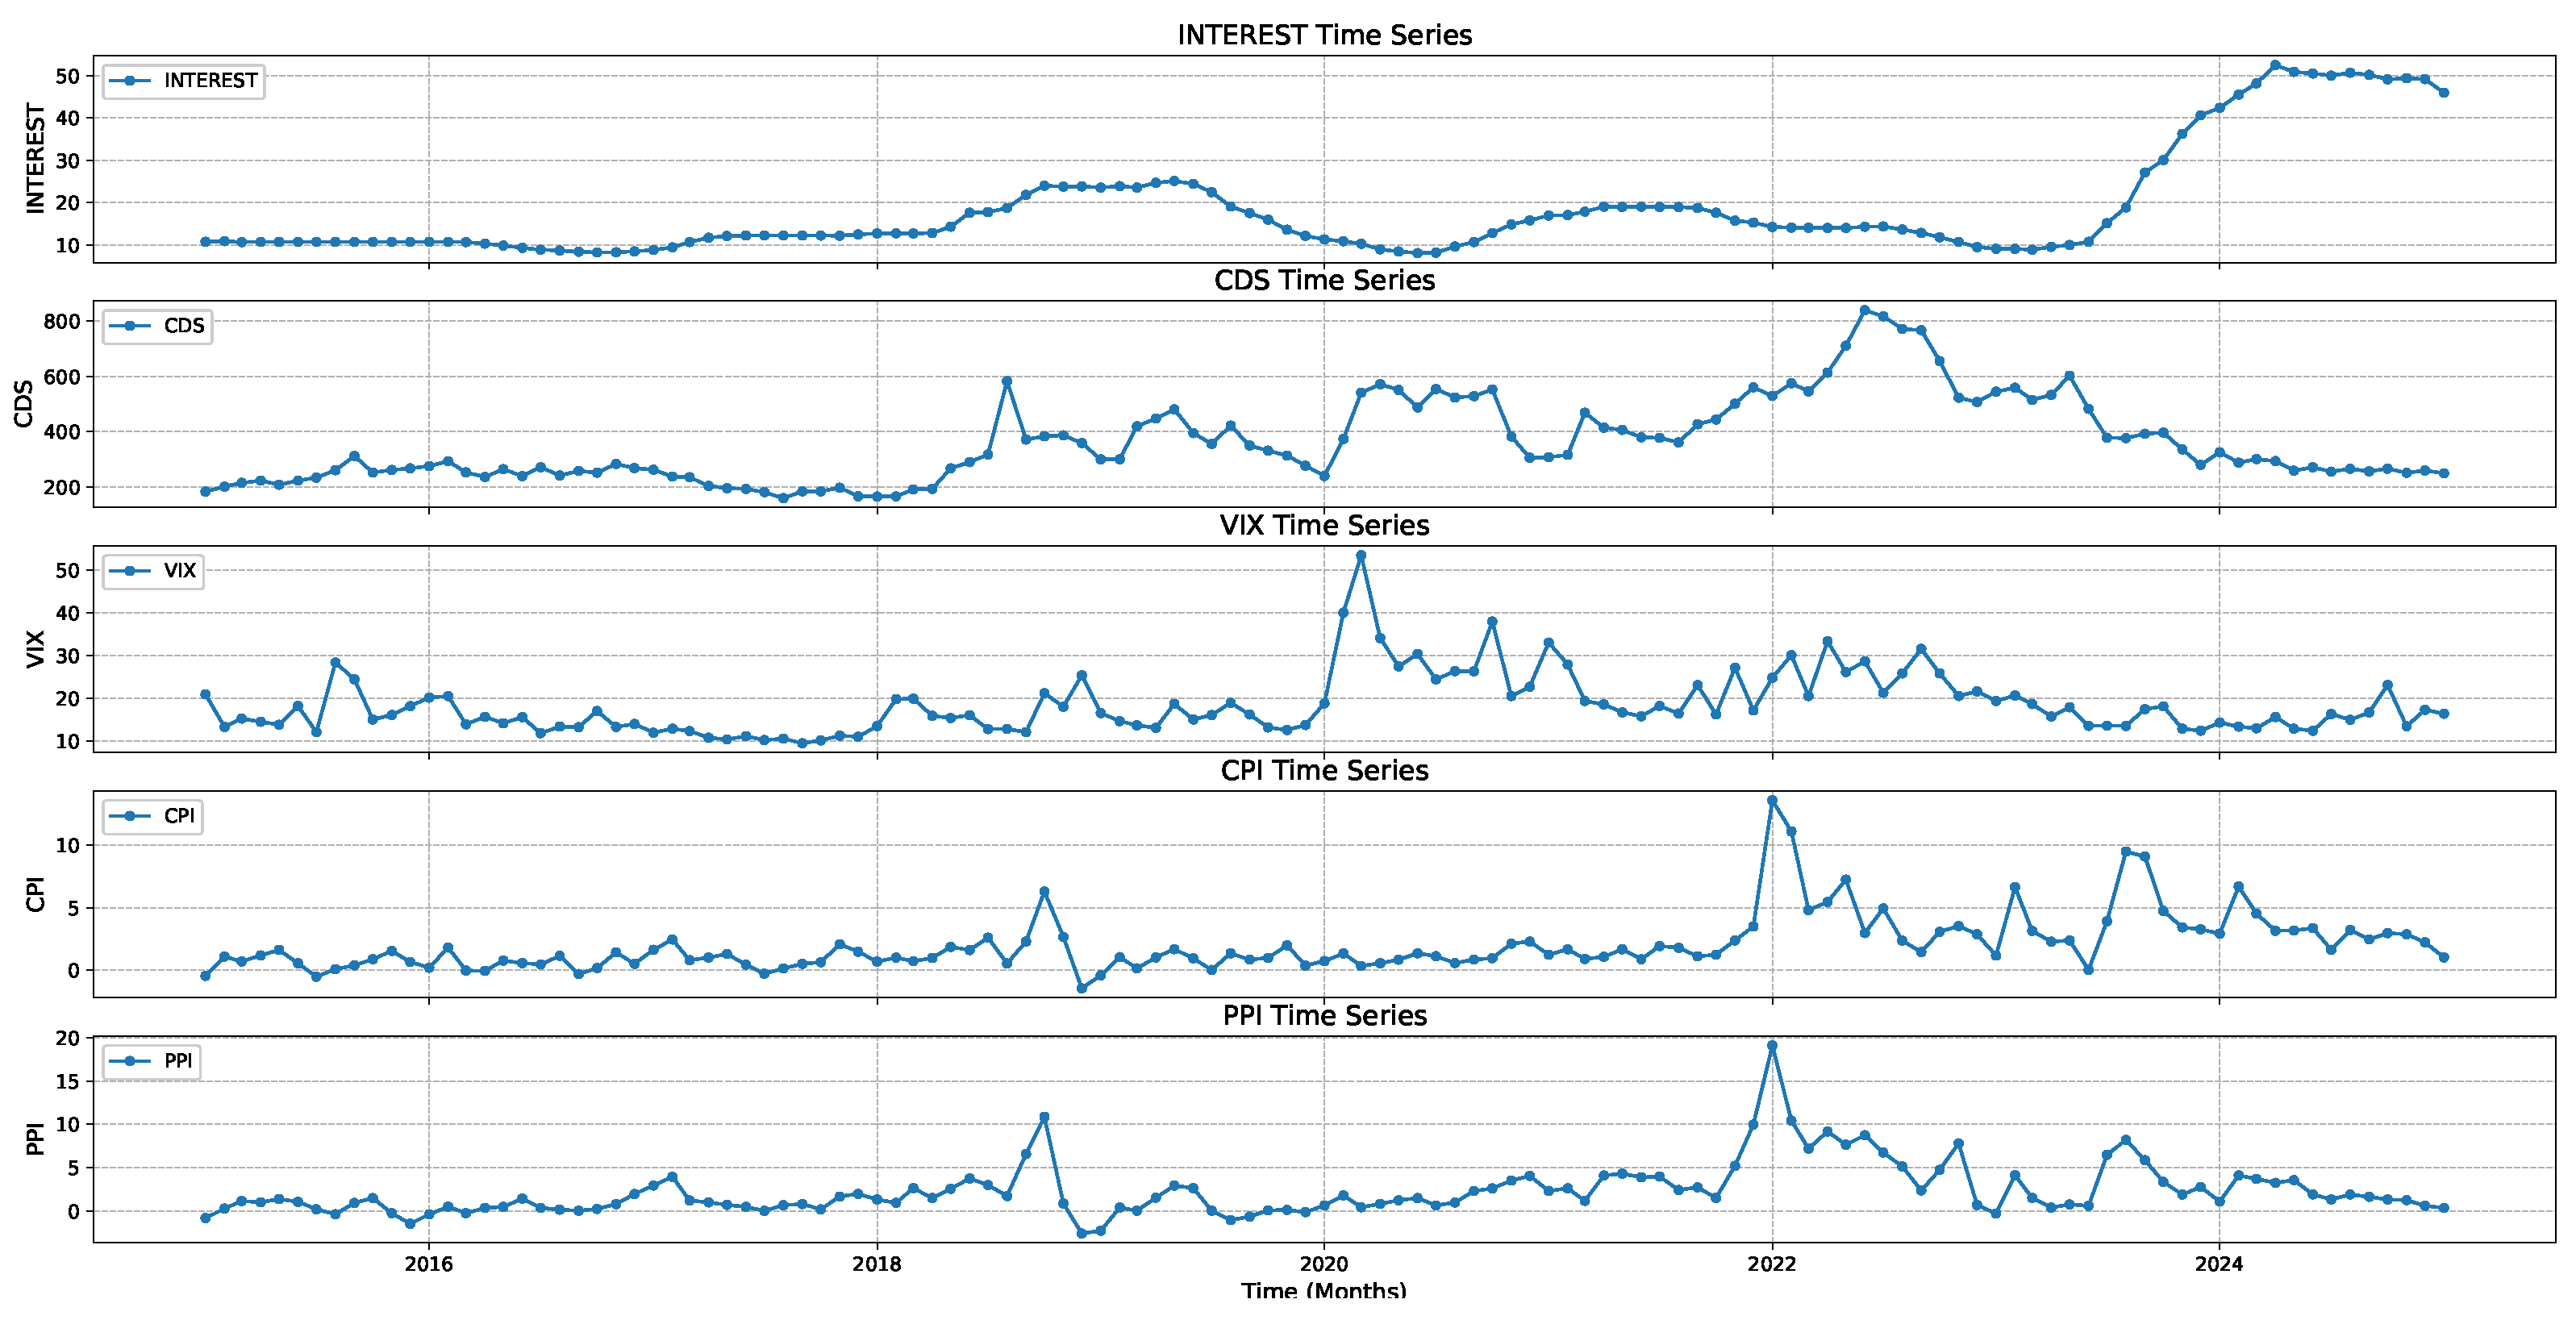
While our theoretical framework is formulated in continuous time, practical implementation necessitates discrete-time approximation methods for analyzing sampled economic data observed at regular monthly intervals. For a discretely sampled time series
with uniform time steps
, we approximate the Caputo fractional derivative using the L1 scheme (first-order approximation)
where the weights
are defined as
for
. This approximation carries a global truncation error of
, which is sufficient for our monthly economic data, though higher-order schemes could be employed for higher frequency data if necessary.
The continuous CFFI definition in Equation (
5) involves an expectation over the squared fractional score function, which we implement in discrete time as
where
represents a grid of points spanning the support of the distribution,
are quadrature weights proportional to
, and
is the kernel density estimate at time
and value
. We employ an adaptive grid refinement strategy that places more points in regions where the density or its derivative changes rapidly, thereby ensuring accurate numerical integration.
For density estimation, we utilize a Gaussian kernel with bandwidth
h as previously discussed
where
w defines the rolling window size (20 observations in our case), and
is the standard Gaussian kernel. The log-density is then approximated as
, with a small
added to avoid numerical issues with near-zero density values.
Building on the estimated log-density and its fractional derivative, we define CFFI. This measure is computed as the expectation of the squared fractional derivative of the log-density, formally expressed as
In practical terms, for each time point, the squared value of the discretized fractional derivative is multiplied by to obtain an information measure analogous to the classical Fisher Information, yet modified to incorporate the non-local memory effects present in the system.
To capture the temporal evolution of these information measures, we implement a rolling-window analysis. The data are divided into overlapping segments of fixed size—typically 20 observations per window—and within each segment, the entire procedure (density estimation, fractional derivative computation, and CFFI calculation) is performed. The window is then incrementally advanced (with a step size of one observation), yielding a time series of CFFI estimates. This rolling-window approach provides a dynamic view of the information flow, enabling us to detect and analyze changes in the system’s informational characteristics over time.
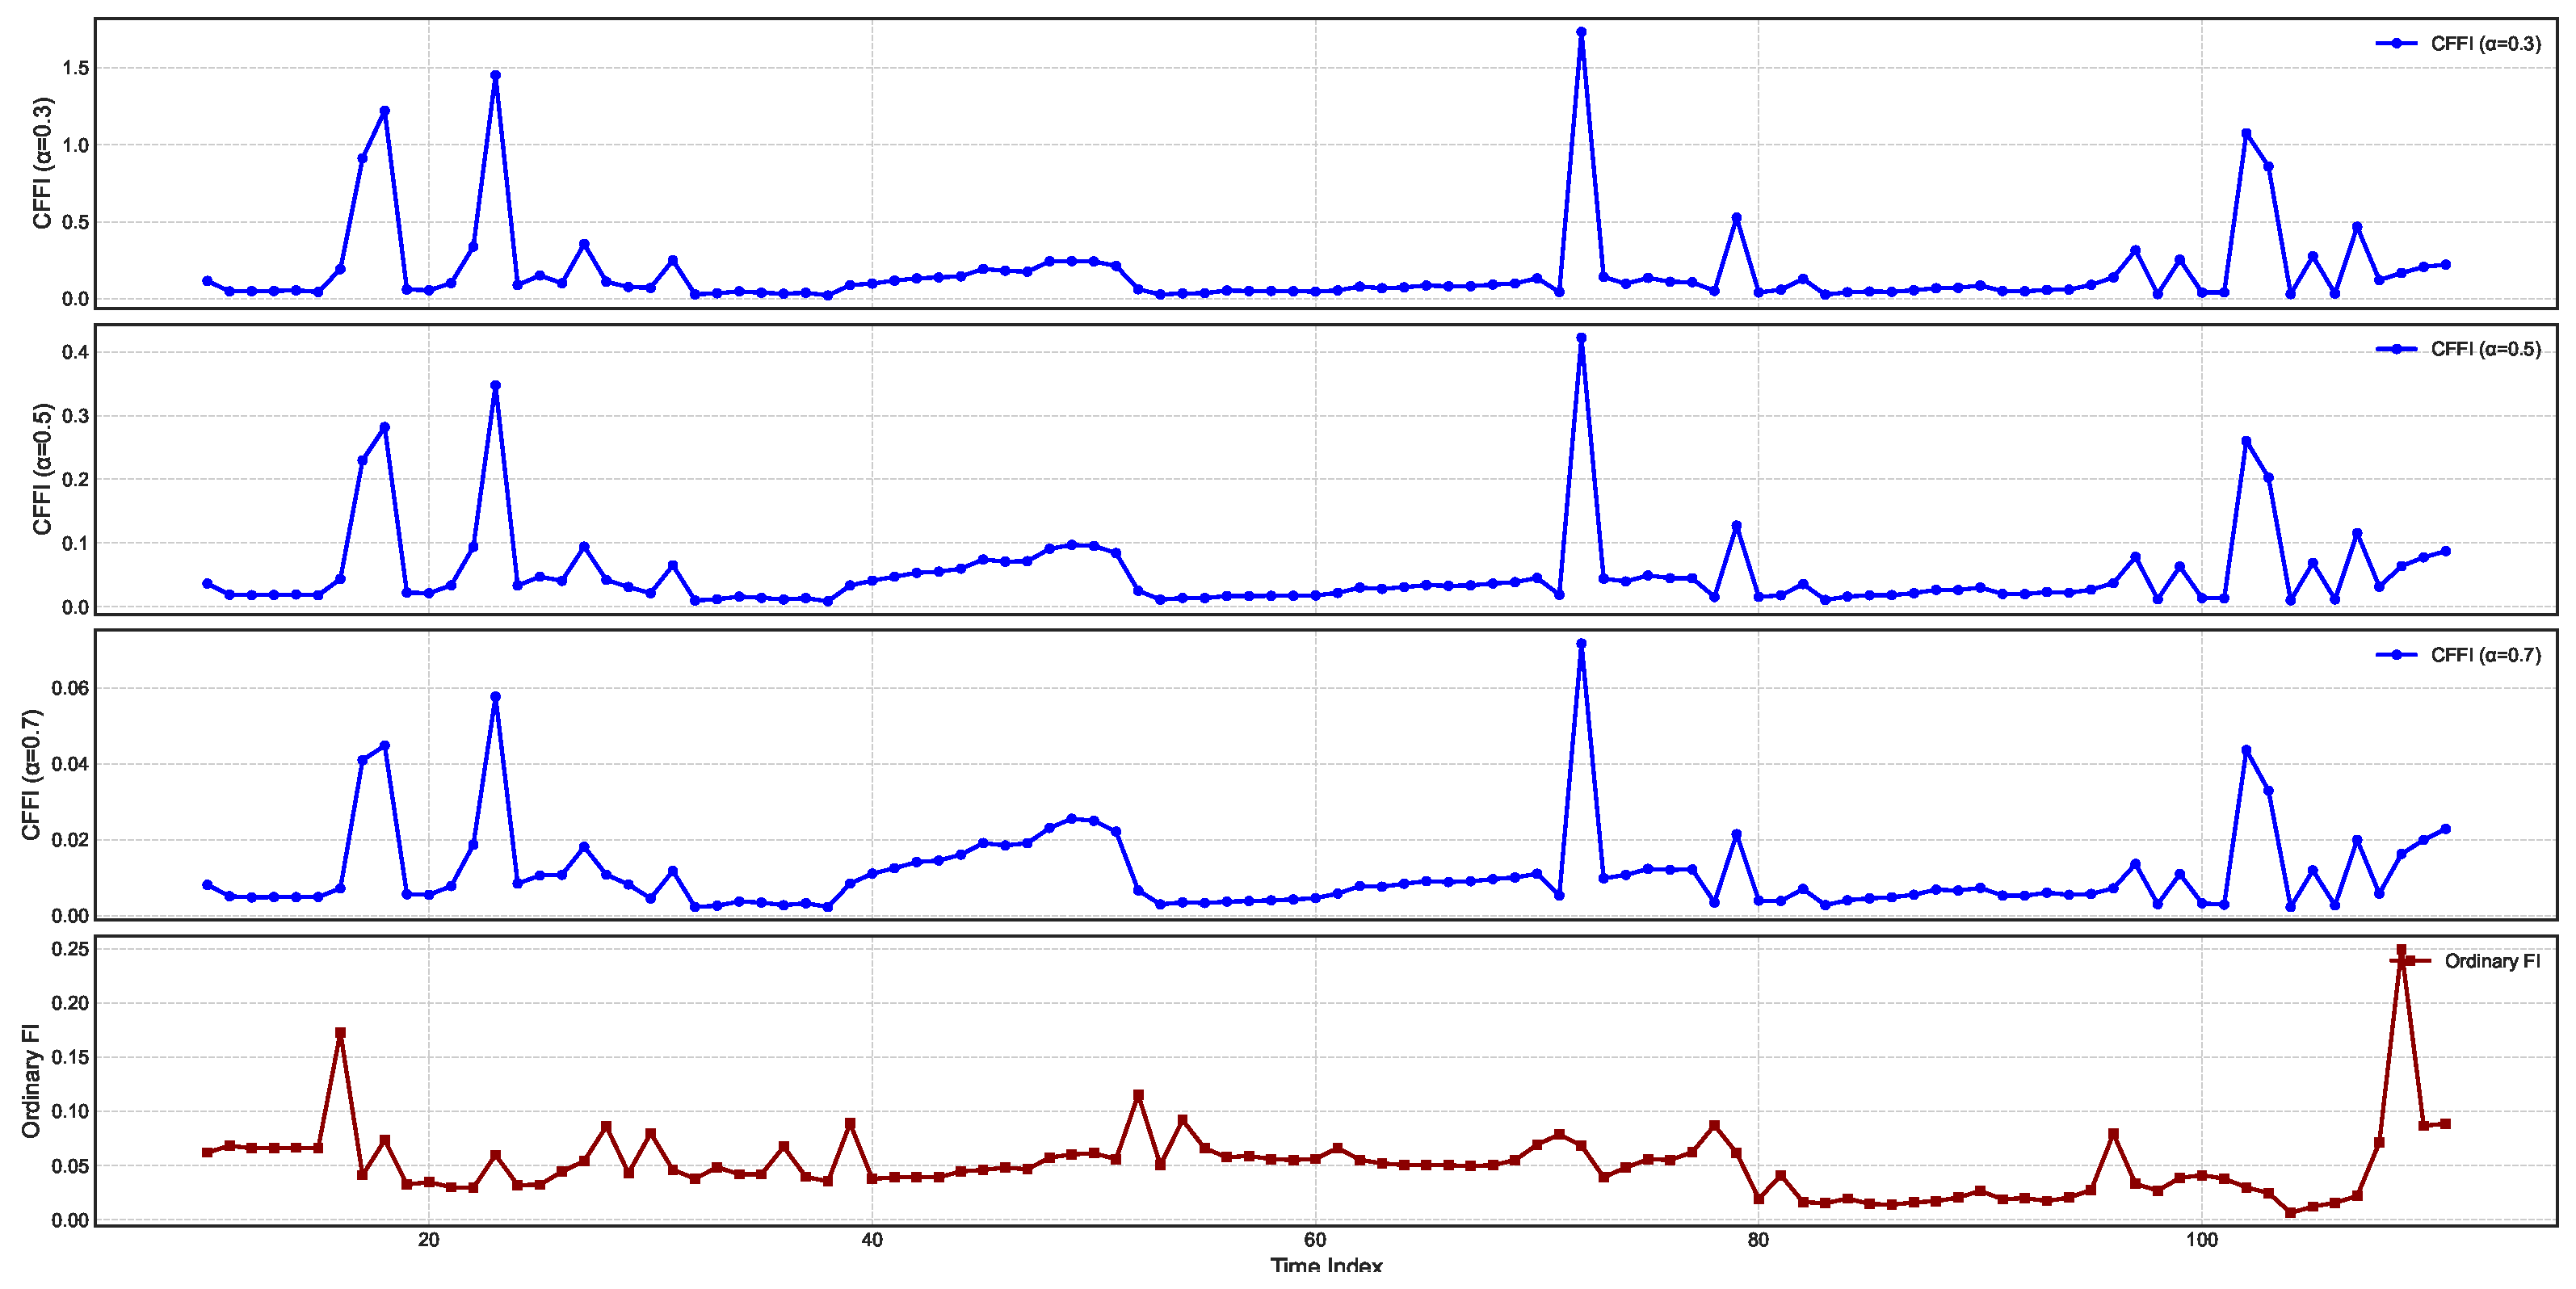
Figure 2 presents temporal changes on CFFI for INTEREST.
In all three fractional plots, the spikes in CFFI appear at consistent time indices, suggesting that the system undergoes pronounced changes in its probability distribution at these intervals. However, the amplitude of the peaks varies markedly with . For , the peaks are higher, indicating that the measure is more sensitive to past data when the system undergoes transitions. As increases to and , the peaks become smaller, reflecting a more moderate weighting of historical states in the fractional derivative. This outcome aligns with the notion that smaller values emphasize long-range memory effects, causing the measure to accumulate higher values during episodes of pronounced distributional shifts.
Comparing these fractional measures with the ordinary Fisher Information (OFI) in the bottom panel reveals both similarities and distinctions. All four plots show the same general pattern of repeated spikes, indicating that the timing of significant shifts in the underlying interest rate distribution is consistent regardless of whether memory is taken into account. Yet the scale of the OFI curve differs substantially, most notably when is small. In the fractional framework, historical influences accumulate over time, amplifying the response whenever the log-density undergoes changes. By contrast, OFI captures primarily local (i.e., instantaneous) sensitivity of the log-density to small perturbations, leading to lower overall peak magnitudes and a narrower perspective on how the system evolves.
From a dynamical standpoint, these results underscore the impact of long-range dependencies in modeling the sensitivity of the interest rate distribution to perturbations. The high-amplitude spikes for reflect a strong memory effect, where past fluctuations remain influential for a longer duration and thus elevate the CFFI values. As grows closer to 1, the measure converges toward OFI, resulting in more moderate peak values and reduced sensitivity to historical states.
Figure 3 presents temporal changes on CFFI for CDS.
CFFI curves for CDS series exhibit pronounced peaks at specific time indices, suggesting intervals during which the probability distribution of CDS experiences heightened sensitivity to perturbations. For each fractional order , the spikes occur broadly in the same locations, indicating that the primary shifts in the underlying CDS distribution are robust to changes in the fractional order. However, the magnitude of these peaks diminishes as increases, reflecting a progressive reduction in how strongly historical states influence the present. Smaller values (e.g., ) emphasize longer-range memory effects, thereby producing higher peaks when significant distributional changes occur, whereas larger values place more emphasis on more recent data, leading to relatively lower peak heights.
While both the CFFI and OFI exhibit their most notable rises around similar time points, the fractional measures typically reach higher or more sustained values, especially for smaller . This discrepancy stems from the fact that the CFFI integrates historical gradients of the log-density via a power-law kernel, thereby aggregating the influence of prior states into the current measure. By contrast, the OFI captures only the instantaneous sensitivity of the log-density, effectively treating the CDS series as Markovian and memoryless. Consequently, the OFI curve often displays narrower spikes, reflecting the immediate response to distributional changes without the extended contribution of past data. These results emphasize the importance of fractional approaches for capturing the long-term dependencies that can characterize CDS behavior, particularly in contexts where market sentiment and risk assessments accumulate over time.
Figure 4 presents temporal changes on CFFI for CPI.
CFFI curves for CPI, a particularly large spike emerges around the same time index for all fractional orders. This sudden jump indicates a moment of heightened sensitivity in the CPI distribution, suggesting that the underlying statistical properties of CPI underwent a marked shift. Although the exact timing of this spike remains consistent across different values, the amplitude varies, with the lower fractional order () showing a more pronounced peak. Such behavior reflects the stronger memory effect introduced by smaller , whereby more distant historical states exert a cumulative influence on the current dynamics, thus amplifying the response whenever there is a significant change in the probability distribution.
A closer look at the CFFI plots for higher fractional orders, such as , reveals that while the major transition is still captured, its magnitude is less extreme. This reduction in peak height illustrates how larger places greater emphasis on more recent states, effectively tempering the contributions of longer historical windows. Consequently, the measure remains sensitive to major distributional shifts but does so with a shorter memory horizon. A smaller second spike in the and curves further highlights how a longer memory can detect subtle variations in the distribution that might be overlooked or appear muted when memory is shortened.
The OFI exhibits multiple peaks of moderate amplitude, capturing the localized changes in CPI distribution. However, it does not reflect the same degree of cumulative effect seen in the smaller curves, which more aggressively aggregate historical gradients of the log-density. As a result, the OFI and higher curves converge toward similar profiles, whereas the lower measures stand out with their sharper, more pronounced transitions.
Figure 5 presents temporal changes on CFFI for PPI.
For smaller fractional orders, such as , the amplitude of these spikes is especially large, underscoring the stronger memory effect that emerges when historical data are given substantial weight. In contrast, higher fractional orders ( and ) continue to capture the same core transitions but with lower peak magnitudes, illustrating that shorter memory horizons dampen the impact of older states on the present information measure. OFI in the bottom panel captures some of the same transitions but lacks the pronounced accumulation of effects characteristic of lower fractional orders, thus producing lower or narrower peaks overall.
When compared to CPI, which also exhibited prominent spikes in its fractional information measures, the PPI displays timing and amplitude patterns that can be slightly offset. Such differences highlight how producer-level price changes may lead or lag shifts at the consumer level. From a memory perspective, the PPI’s smaller- curves more vigorously integrate historical fluctuations in producer costs, amplifying the response to any abrupt distributional change. Meanwhile, CPI may reflect downstream effects of these shifts but with its own timing and magnitude. Observing both PPI and CPI through the lens of fractional derivatives thus provides a complementary view of inflationary pressures, capturing how price changes at the producer stage can propagate to consumer prices with distinct delays and intensities.
Figure 6 presents temporal changes on CFFI for VIX.
Across all fractional orders, these peaks generally occur at similar time indices, but the amplitudes vary considerably, reflecting the different strengths of memory effects encoded in each . When is small, the measure integrates historical data more extensively, which can amplify responses to a single abrupt change and produce higher peak values. In contrast, larger places more weight on recent data, leading to comparatively tempered spikes that still capture the timing of significant transitions but with a reduced magnitude.
By comparing these curves with OFI at the bottom, one observes that the memoryless framework also registers a series of peaks aligned with the most prominent shifts in the PPI distribution. However, OFI tends to exhibit either narrower or lower spikes than those seen for smaller fractional orders, underscoring the role of historical influences in magnifying the fractional measures. This dynamic is particularly important for producer-level inflation, where past fluctuations in costs or supply conditions can reverberate through time. In periods of rapid change—whether triggered by commodity price shocks or policy shifts—the fractional derivatives accumulate the effects of earlier volatility, often producing sharp surges in the CFFI. The ordinary measure, by contrast, responds primarily to the immediate local gradient in the log-density, missing some of the accumulated impact of past states. These results highlight the potential value of a fractional calculus perspective for studying inflationary processes as it can reveal how lingering producer-side shocks shape the distribution over longer horizons.
3.3. Correlation Analysis
To investigate cross-indicial dependencies, we conduct correlation and transfer entropy analyses on rolling estimates of CFFI and OFI for each index. The correlation analysis evaluates linear pairwise relationships between indices, facilitating the identification of synchronous patterns and shared trends in informational dynamics across diverse markets. Complementarily, transfer entropy is employed to quantify directional information flow between indices, thereby capturing non-linear and asymmetrical dependencies that may signify lead–lag relationships.
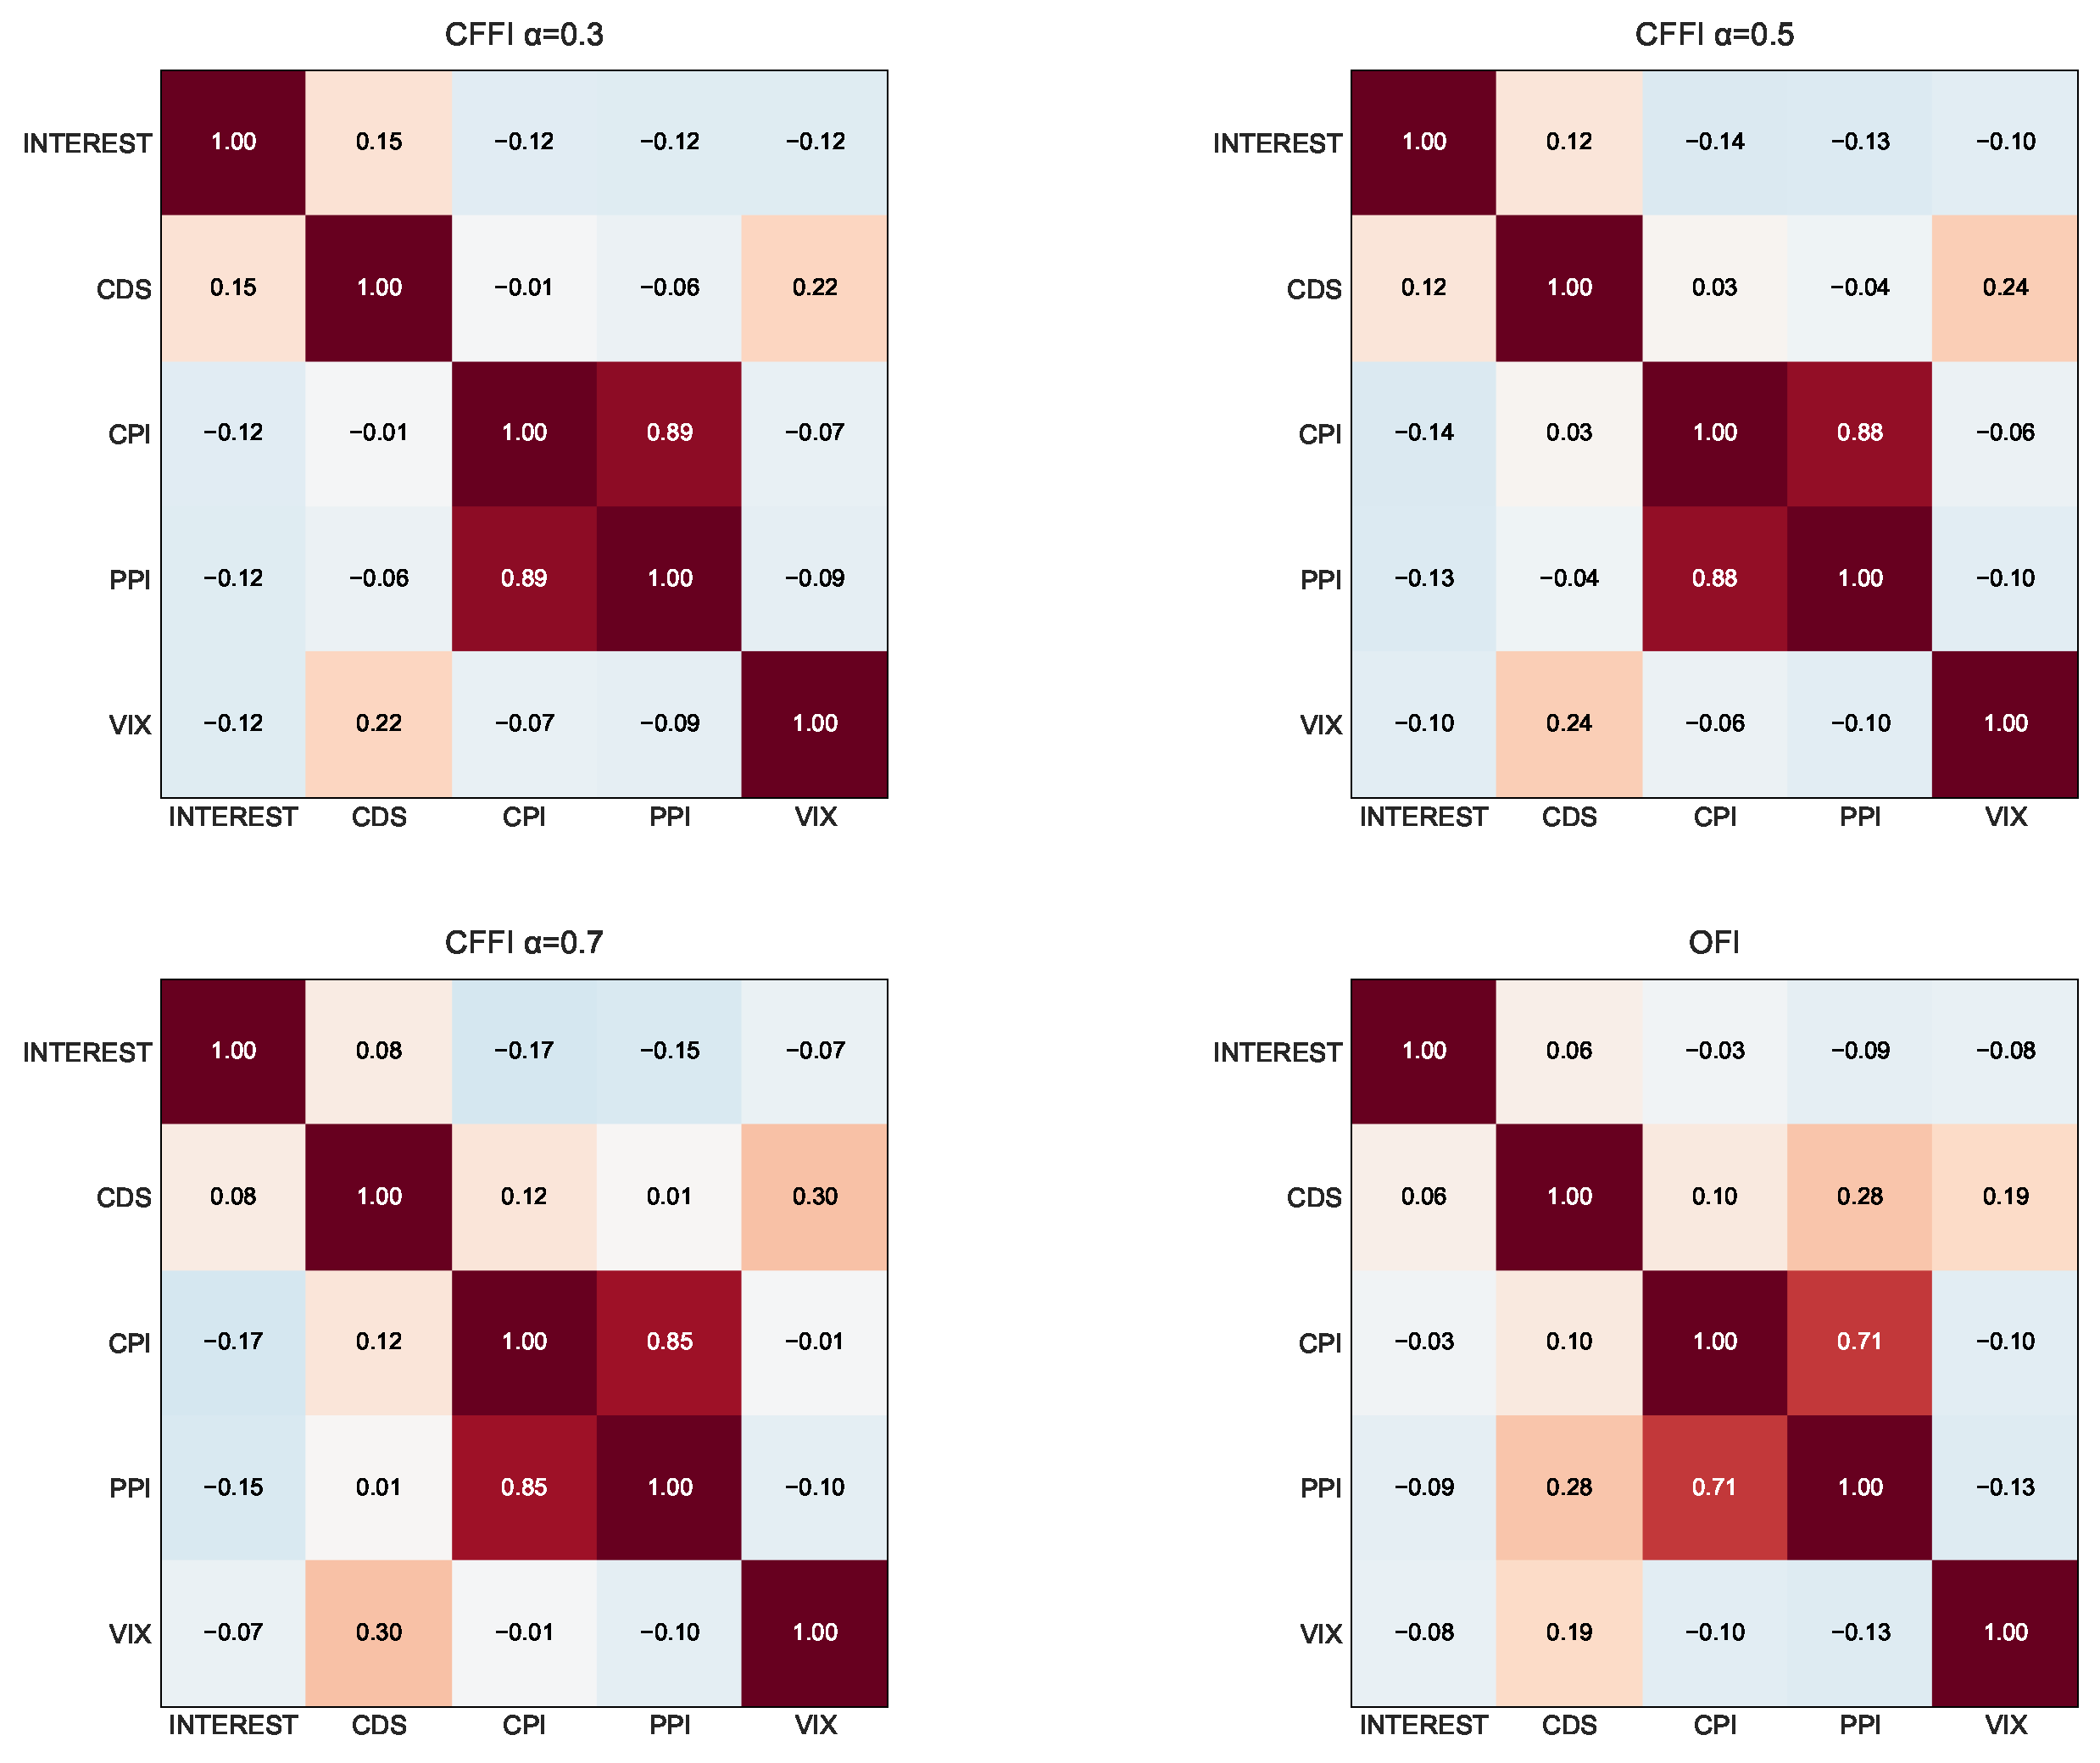
From an information-theoretic perspective, the correlation matrices based on CFFI in
Figure 7 reveal how the informational dynamics of key economic indicators co-evolve under different memory assumptions. The CFFI quantifies how sensitive an index’s probability distribution is to its past behavior, and by comparing these measures across indices, we gain insight into the shared historical influences among them. When
is small, such as
, the CFFI places considerable weight on long-range memory; this means that the accumulated historical shifts in an index’s distribution significantly drive its information measure. In practical terms, a strong correlation at
between INTEREST and CDS suggests that the deep-rooted, historical sensitivities of monetary policy signals and perceived default risk are tightly linked, possibly reflecting persistent economic regimes or long-term policy influences. As
increases to 0.7, the CFFI becomes more responsive to recent fluctuations rather than extended historical trends. This transition can lead to altered correlations, for instance, between CPI and PPI, if their short-term inflationary dynamics diverge from their long-term patterns.
In contrast, the memoryless OFI captures only the local, instantaneous sensitivity of the distribution, often yielding moderate correlations that overlook the layered, historical dependencies detected by fractional models. For example, while the correlation between INTEREST and VIX may appear moderate under OFI, the stronger association observed under CFFI at indicates that long-term market volatility is more closely linked to the enduring effects of monetary policy signals. Overall, these comparative analyses underscore the value of incorporating memory effects into information measures as doing so unveils deeper, more nuanced interdependencies among critical economic indicators such as interest rates, credit risk, inflation measures, and market volatility.
Figure 8 displays cross-correlation analyses with lags between selected indices.
In
Figure 8, each row corresponds to a particular way of modeling the memory embedded in the informational dynamics of short-term policy interest rates (INTEREST) and various economic indicators (CDS, VIX, CPI, and PPI). Each column compares INTEREST with a different indicator—credit default swaps (CDSs), implied market volatility (VIX), consumer inflation (CPI), or producer inflation (PPI)—across time lags. The horizontal axis denotes the lag, where positive lags suggest that changes in the first series precede changes in the second, and negative lags indicate the opposite ordering. Peaks in these curves reveal potential lead–lag relationships, while their width and height reflect the persistence and magnitude of the co-movement.
From an information-theoretic viewpoint, smaller values of assign substantial weight to deep historical states when computing the CFFI. In the top row, this often manifests as broader or more pronounced cross-correlation peaks, implying that extended past conditions in one index’s distributional shifts—such as a persistently low interest rate regime—can foreshadow future movements in another indicator’s information measure. For instance, if CFFI : INTEREST vs. CDS exhibits a strong positive-lag peak, it suggests that historically rooted shifts in monetary policy signals have long-lasting effects on perceived credit risk, driving CDS dynamics with a delay. Conversely, as grows to 0.5 or 0.7, the CFFI becomes more sensitive to recent changes, causing narrower peaks closer to zero lag. Under these more moderate memory horizons, immediate feedback loops—such as short-term market reactions to interest rate announcements—can dominate the correlation structure, reducing the influence of older policy regimes on current credit risk or volatility expectations.
Comparing these fractional rows to the OFI row in the bottom panels highlights the differences between memory-sensitive and memoryless frameworks. OFI emphasizes local, instantaneous changes in the distribution of each index, so the cross-correlations frequently peak near zero lag and show fewer secondary peaks at large positive or negative lags. This can obscure certain lead–lag patterns that fractional measures detect. For instance, OFI: INTEREST vs. VIX may show a moderate peak around lag zero, suggesting an immediate reaction of implied market volatility to interest rate signals, yet it may lack the long-tail behavior visible in CFFI : INTEREST vs. VIX. Such a discrepancy implies that short-run volatility responses can be captured by OFI, whereas extended historical influences—such as entrenched monetary regimes that shape long-term risk appetites—are only discernible through fractional measures with smaller .
From an economic perspective, these differences matter because interest rates, credit risk, volatility, and inflation indicators can each embody a distinct combination of short-term shocks and long-term structural factors. If, for example, INTEREST and PPI exhibit sustained correlations at a positive lag under , it may indicate that entrenched monetary policy paths eventually feed into producer-level price pressures over extended horizons. On the other hand, smaller-lag peaks under or OFI might reflect quicker pass-through effects, such as immediate cost changes that producers face after a policy announcement.
3.4. Transfer Entropy
Table 1 displays transfer entropy results for the configuration
.
A small fractional order accentuates long-range memory, so each index’s deep historical states strongly shape its present-day distributional changes. Notably, the largest transfer entropy arises from INTEREST to VIX, implying that the historical accumulation of short-term policy signals carries significant predictive power over implied market volatility’s informational dynamics. In other words, when the central bank’s policy stance—embedded in INTEREST’s distribution—shifts after a protracted historical buildup, it can substantially alter how the VIX distribution evolves, reflecting heightened sensitivity in markets prone to long-lasting monetary conditions. A similarly robust effect appears from CDS to VIX, suggesting that perceived default risk exerts a directional influence on volatility measures, further underscoring how risk premiums can ripple through markets over extended horizons.
On the inflationary front, the asymmetry between CPI → PPI and PPI → CPI is striking. The larger transfer entropy from CPI to PPI suggests that consumer-level inflation signals, when viewed through a long-memory lens, convey more informational impact on producer-level price shifts than vice versa. This may indicate that protracted changes in consumer inflation—possibly linked to entrenched expectations or wage-price spirals—eventually filter back into producers’ pricing decisions, influencing their cost structures and profit margins. By contrast, the lower value from PPI to CPI implies that while producer prices still offer some informational cues for consumer inflation, the effect is relatively weaker under strong memory conditions, highlighting the role of sustained demand-side pressures.
Comparisons to correlation or cross-correlation findings reinforce these interpretations. A strong correlation may reveal synchronous or lagged co-movements, but the directionality gleaned from transfer entropy is key for understanding which index actively drives shifts in another’s informational content. For instance, a moderate correlation between INTEREST and VIX might mask the fact that, under , policy signals truly lead volatility rather than simply co-moving.
Table 2 displays transfer entropy results for the configuration
.
At
, CFFI balances long-range memory with a more immediate focus on recent distributional shifts, creating an intermediate memory horizon. As shown in
Table 2, many of the transfer entropy (TE) values exceed those at
, indicating that while historical influences remain important, mid-range changes in an index’s distributional behavior now hold greater sway. For instance, the largest directional influence appears from INTEREST to VIX (0.226628), which is even more pronounced than at
. This heightened flow of information suggests that intermediate-horizon monetary policy signals may drive market volatility more forcefully as traders and investors respond to evolving policy expectations without fully relying on deep historical anchors. By the same token, VIX itself exerts a stronger influence on INTEREST and CDS compared to smaller
, implying that intermediate-memory processes can also capture feedback loops in which volatility shifts feed back into credit risk perceptions and policy considerations.
From an economic perspective, these results highlight how the mid-range memory captured at can amplify or reconfigure certain lead–lag relationships that were less prominent at . INTEREST and CDS exhibit reciprocal influences (0.179559 vs. 0.184342), suggesting that moderately persistent signals in monetary policy and credit markets inform each other’s informational changes. Meanwhile, CPI’s stronger bidirectional TE with both INTEREST and CDS—compared to smaller —hints that consumer-level inflation data, when viewed over a moderate historical window, becomes more influential in shaping interest rate expectations and risk premiums. PPI still registers notable information flows to and from CPI, consistent with the notion that producer-level and consumer-level inflation remain interlinked, but the intermediate memory horizon may emphasize shorter supply-chain effects rather than deeply entrenched pricing regimes.
Comparing these findings to those at suggests that certain relationships intensify as the model shifts away from deep historical accumulation toward more recent signals. The fact that INTEREST, CDS, and VIX exhibit consistently high transfer entropy values underscores their collective role in shaping market sentiment and risk, but the specific magnitudes at reveal how mid-range memory can reinforce feedback loops that are less visible under a predominantly long-memory () framework. Consequently, while smaller can uncover enduring monetary or risk-based regimes, highlights how moderately persistent signals also carry significant informational weight, potentially aligning more closely with the fluid market adjustments and evolving economic narratives typical of a mid-term horizon.
Table 3 displays transfer entropy results for the configuration
.
At , TE values indicate that a shorter memory horizon captures more immediate, recent dynamics in the informational interplay among economic indicators. For example, the directional flow from INTEREST to CDS increases significantly—from roughly 0.099 at to 0.256 at —implying that recent shifts in monetary policy have a pronounced impact on credit risk as perceived through CDS spreads. Similarly, the transfer entropy from CDS to INTEREST rises steadily across the spectrum, reaching approximately 0.275 at , which suggests a strong feedback mechanism where contemporary changes in credit risk also influence policy signals. In contrast, the relationship between INTEREST and VIX appears to be more nuanced; while the TE from CDS to VIX increases with higher , the value from INTEREST to VIX peaks at an intermediate memory length () and then slightly declines at . This pattern may indicate that the impact of monetary policy on market volatility is maximized when recent dynamics dominate but does not necessarily continue to intensify with an even shorter memory window.
Additionally, the TE values involving inflation measures (CPI and PPI) generally increase as
rises, suggesting that, over a shorter memory horizon, consumer and producer price changes are more strongly interrelated with shifts in monetary policy. Overall, these findings from
Table 3—when compared with the lower
values—demonstrate that a mid-range memory horizon enhances the detectability of directional information flows, highlighting the immediate responsiveness of economic agents to recent events, while also underlining that certain relationships, such as those involving market volatility, may be optimized at intermediate memory levels rather than at the shortest horizons.
Table 4 displays transfer entropy results for OFI.
Under the memoryless framework provided by OFI, the transfer entropy values indicate a moderate yet consistent flow of information among key economic indicators. For instance, the directional transfer entropy from INTEREST to CDS is approximately 0.296 and nearly 0.290 in the reverse direction, suggesting a robust mutual linkage between monetary policy signals and credit risk. Similar values observed for the interactions between INTEREST and VIX (around 0.311 and 0.285, respectively) point to an immediate and symmetric influence between policy measures and market volatility. Furthermore, the relatively similar transfer entropy values between inflation measures—such as CPI and PPI—reinforce the notion that, in the absence of long-memory effects, the instantaneous sensitivities across these indices are stable and homogeneous.
Comparing these OFI-based results to the fractional CFFI outcomes reveals key differences in the informational dynamics. Fractional models, particularly at lower values like 0.3 and moderate values like 0.5, tend to amplify or differentiate directional dependencies by incorporating extended historical information. For example, while the OFI approach shows a moderate and nearly symmetric exchange between INTEREST and CDS, the fractional measures might reveal a stronger or more asymmetric influence when long-range memory effects are considered. This suggests that while OFI captures the immediate response of economic agents to market shocks, the fractional framework can uncover deeper, lagged interactions that emerge over longer horizons. Economically, these findings imply that short-term market adjustments—such as rapid policy responses or sudden shifts in credit conditions—are well represented by OFI, whereas the incorporation of memory through fractional measures may highlight delayed, yet significant, influences that affect market volatility, inflation, and overall risk perceptions in a more nuanced manner.
3.5. Partial Information Decomposition
Now, we present PID analysis results with selecting INTEREST as the dependent variable. INTEREST plays a pivotal role in monetary policy transmission, and our correlation analyses reveal that its informational dynamics are closely interwoven with those of CDS, VIX, CPI, and PPI under various memory assumptions. The consistently robust correlations indicate that fluctuations in interest rates are intimately linked with shifts in credit risk, market volatility, and inflationary trends. Moreover, our transfer entropy analyses underscore a significant directional flow of information between INTEREST and the other indices, with notable evidence that historical variations in interest rates can predict subsequent changes in these economic variables.
PID results are presented in
Table 5 for different
configurations. For the analysis presented in this paper, we employ
values that are approximately
times the corresponding
value for each fractional order, reflecting the empirical observation that cross-variable memory effects in economic systems typically decay somewhat faster than within-variable memory.
In these PID results, the unique information components reveal the extent to which each source index provides distinct, non-overlapping insights into the evolution of INTEREST. For instance, under the fractional framework with , the unique contributions from CDS, CPI, PPI, and VIX are relatively high, indicating that deep historical memory allows each of these economic variables to impart considerable individual influence on interest rate dynamics. From an information-theoretic perspective, this means that the probability distribution shifts of each index carry substantial autonomous signals that can affect monetary policy outcomes. Economically, such pronounced unique information is consistent with scenarios where prolonged monetary accommodation or sustained risk perceptions distinctly shape different facets of the financial environment, such as credit conditions or inflation expectations.
As the fractional order increases to and further to , the unique information values decline markedly. This reduction suggests that when the analysis gives more weight to recent data, the distinct long-term contributions of each source become less pronounced, thereby diminishing the individual signals that were evident under a long-memory regime. Concurrently, the redundant information—which represents the overlap in the informational content among the indices—also decreases as increases, reflecting a shift from enduring, shared historical influences to more immediate and idiosyncratic responses. However, the most striking change is observed in the synergistic information component. At , the synergistic value is exceptionally high, implying that the combined effect of these indices produces emergent dynamics that far exceed the sum of their individual contributions. This synergistic interplay is indicative of a complex, interdependent system where long-term interactions and historical contingencies drive interest rates in a way that is only revealed when deep memory is accounted for.
In contrast, under the memoryless OFI framework, all three PID components—unique, redundant, and especially synergistic—are uniformly lower. The OFI results suggest that when only the immediate, local changes in the information measures are considered, the cumulative and cooperative effects of the sources are largely missed. The relatively muted unique values in OFI imply that instantaneous responses of each economic variable do not capture the rich, individually distinct influences that arise when historical dependencies are incorporated. Similarly, the lower redundant and synergistic values under OFI indicate that the emergent, joint informational effects among CDS, CPI, PPI, and VIX are significantly underrepresented in a memoryless context. Consequently, while OFI may offer a snapshot of immediate interactions, the fractional PID approach provides a more comprehensive understanding of how both historical and short-term dynamics intertwine to shape monetary policy, as reflected in the evolution of interest rates. Ultimately, these findings underscore the critical importance of accounting for long-range memory when modeling the complex interplay of economic indicators as doing so unveils deeper interdependencies that are essential for robust economic forecasting and policy analysis.
