1. Introduction
In recent years, the rapid advancement of modern sensing and data acquisition technologies has enabled the real-time collection of high-dimensional data streams across diverse industrial applications. Such data streams often exhibit shifts in statistical properties, transitioning from an in-control (IC) state to an out-of-control (OC) state due to anomalies. For instance, in electron probe X-ray microanalysis, real-time monitoring of compositional changes in materials requires the detection of subtle shifts in high-dimensional spectral data, which may occur either abruptly or gradually. Addressing such scenarios requires robust online monitoring and fault diagnosis methods tailored for high-dimensional and sparsely changing data streams.
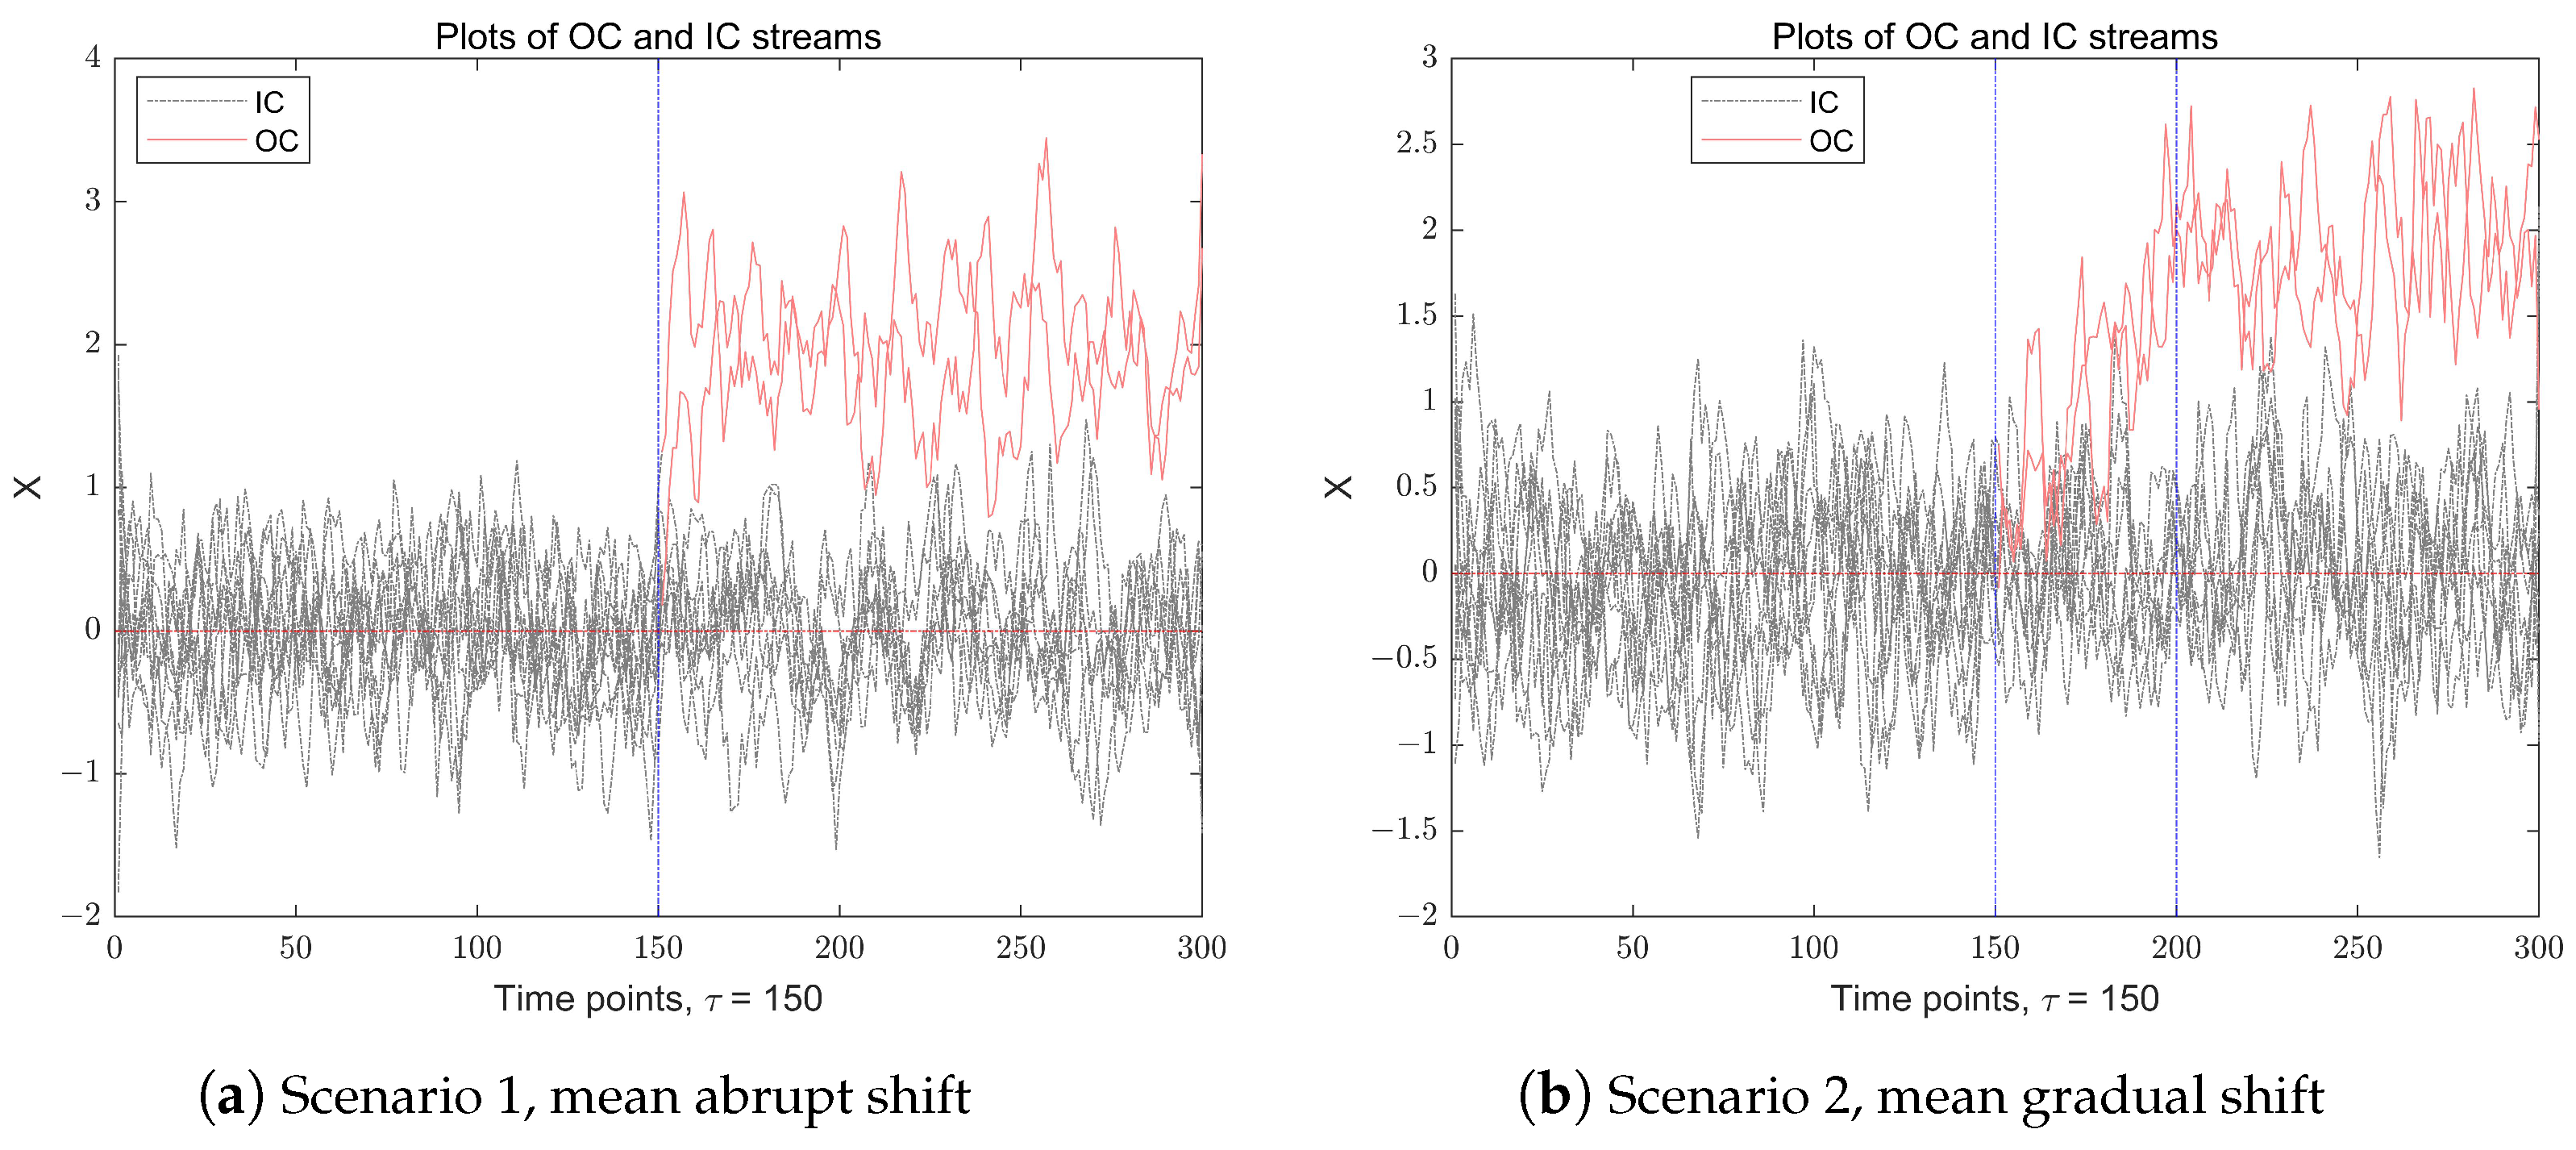
Before proceeding, for an intuitive explanation, we present a simple example to illustrate IC and OC observations in a multidimensional data stream.
Figure 1 illustrates a
p-dimensional (
) time series data stream recorded over
time points. The IC observations, denoted as
, are independently and identically distributed (i.i.d.) multivariate normal random variables with the mean vector
, and a covariance matrix
. After a change point
, the
components of the observations experience an anomaly, resulting in a shift in the data stream. The figure presents two distinct scenarios of mean-shift anomalies in a multidimensional data stream: the left subfigure depicts a mean abrupt shift scenario, where the change occurs suddenly after a time point
, while the right subfigure illustrates a mean gradual shift scenario, where the shift changes in a duration of about a 50-time-point interval, ultimately stabilizing when
.
In the examples mentioned, the change points in the data stream are easily identifiable due to the low dimensionality, allowing easy visual detection. However, in real-world applications, monitoring complex and high-dimensional data streams is more challenging. Anomalies may only appear in a small subset of variables at any given time, and the intricate interactions and high dimensionality of these variables complicate online monitoring and fault detection. This is especially true when pinpointing the exact time and specific elements that show abnormal variations. For instance, in semiconductor manufacturing, subtle sensor anomalies may indicate critical equipment issues, while in energy infrastructure, gradual pressure drifts could signal potential failures. Timely detection and diagnosis of such anomalies are crucial for operational safety and efficiency. Yet, the high dimensionality, sparsity of changes, and complex variable interdependencies present significant challenges to existing monitoring and diagnostic frameworks.
In order to overcome these challenges, a series of articles have been developed on the monitoring and diagnosis of high-dimensional data streams. Here, we roughly divide them into the following three categories.
(1) Statistical and Control Chart-Based Methods. Statistical and control chart-based methods are widely employed for monitoring high-dimensional data streams, with prominent techniques including Hotelling’s
, Multivariate Exponentially Weighted Moving Average (MEWMA), Multivariate Cumulative Sum (MCUSUM), and principal component analysis (PCA)-based monitoring. Zou et al. (2015) [
1] introduce a robust control chart utilizing local CUSUM statistics, demonstrating effective detection capabilities across both sparse and dense scenarios, albeit with certain limitations in parameter assumptions and implementation complexity. Ebrahimi et al. (2021) [
2] developed an adaptive PCA-based monitoring method incorporating compressed sensing principles and adaptive lasso for change source identification, though its computational demands may be substantial for large-scale datasets. Li (2019) [
3] proposes a flexible two-stage monitoring procedure with user-defined IC average run length (ARL) and type-I error rates, which requires meticulous calibration of control limits for both stages. For comprehensive reviews of online monitoring and diagnostic methods based on statistical process control (SPC), refer to studies such as [
4,
5,
6,
7,
8,
9,
10,
11,
12].
(2) Information-Theoretic and Entropy-Based Methods. Entropy-based measures, including Shannon entropy, Renyi entropy, and approximate entropy, are widely used to assess the complexity and randomness of data streams in monitoring and diagnostics. Recent research has made significant progress in both theoretical and practical aspects of this field. Mutambik (2024) [
13] develops E-Stream, an entropy-based clustering algorithm for real-time high-dimensional Internet of Things (IoT) data streams. By incorporating an entropy-based feature ranking method within a sliding window framework, the algorithm reduces dimensionality, improving clustering accuracy and computational efficiency. However, its dependence on manual parameter tuning restricts its adaptability to diverse datasets. Wan et al. (2024) [
14] propose an entropy-based method for monitoring pressure pipelines using acoustic signals. Their approach combines Denoising Autoencoder (DAE) and Generative Adversarial Network (GAN) with entropy-based loss functions for noise reduction. While effective, the adversarial training process requires substantial computational resources, limiting its feasibility for real-time applications in resource-constrained environments. For a deeper understanding of recent advancements in entropy-based theories, methods, and applications for data stream monitoring and diagnostics, see [
15,
16,
17,
18,
19]. These studies highlight the latest developments in this area.
(3) Machine Learning and Data-Driven Methods. In recent years, machine learning and data-driven methods have become increasingly important for monitoring and diagnostics in various fields. Online learning techniques, such as Online Support Vector Machines (OSVMs), Online Random Forests, and Stochastic Gradient Descent (SGD), have been successfully applied to real-time monitoring tasks. Additionally, deep learning models like Recurrent Neural Networks (RNNs), Long Short-Term Memory (LSTM) networks, and autoencoders have shown strong performance in capturing temporal patterns and detecting anomalies in high-dimensional data streams. Recent developments in this area include OLFA (Online Learning Framework for sensor Fault diagnosis Analysis) by Yan et al. (2023) [
20], which provides a solution for real-time fault diagnosis in autonomous vehicles by addressing the non-stationary nature of sensor faults. Chen et al. (2024) [
21] present a real-time fault diagnosis method for multisource heterogeneous information fusion based on two-level transfer learning (TTDNN), focusing on gearbox dataset, bearing dataset, etc. Another important contribution is from Li et al. (2025) [
22], who propose a novel framework combining Deep Reinforcement Learning (DRL) with SPC for online monitoring of high-dimensional data streams under limited resources. Although their approach shows good scalability through deep neural networks, the computational demands of the Double Dueling Q-network training process may be a limitation for real-time applications with strict computational constraints. For comprehensive reviews of machine learning-based online monitoring and diagnostic methods, see studies such as [
21,
23,
24,
25,
26,
27].
Despite these advancements, three key limitations remain. First, many SPC methods face computational challenges in ultra-high dimensions due to reliance on covariance matrix inversions or extensive hypothesis testing. Second, entropy-based techniques, though effective for noise reduction, show limited sensitivity to sparse changes where only few variables deviate, while machine learning approaches often demand substantial labeled data that may be unavailable. Third, current diagnostic procedures typically emphasize either speed or accuracy, struggling to achieve both real-time alerts and precise root-cause identification. This paper bridges these gaps by proposing a two-stage monitoring and diagnostic framework designed for high-dimensional data streams with sparse mean shifts. The first issue is online monitoring, which aims to check whether the data stream has changed over time points and accurately estimate the change point after the change occurs. The second issue is the diagnosis of the fault, which aims to identify the components that have undergone abnormal changes; it will help eliminate the root causes of the change.
As the EWMA statistic is sensitive to small changes and includes the information of previous samples, we use it for online monitoring [
28]. At the first stage, we construct a monitoring statistic based on the EWMA statistic. Under certain conditions, we prove the asymptotic distribution of the monitoring statistic and then obtain the threshold of online monitoring. At any time point, if the monitoring statistic value is greater than the threshold, a real-time alert is issued, indicating that the data stream is out of control. Then, we move into the second stage, to identify the components that have undergone abnormal changes over time points, which belongs to the scope of fault diagnosis. Specifically, when the monitoring procedure proposed in the first stage alerts that the data stream is abnormal, we allow the monitoring procedure to continue running for a while, and obtain more sample data, then we conduct multiple hypothesis tests on the data before and after the alarm to determine which components of the data stream have experienced anomalies. The desired two-stage monitoring and diagnosis scheme in this study can not only correctly estimate the time point in time but also accurately identify the OC components of the data stream.
The contributions of this paper are as follows: (1) Methodological Innovation: This study introduces an EWMA-based monitoring statistic that leverages max-norm aggregation to enhance sensitivity to sparse changes. After its asymptotic distribution is derived, a dynamic thresholding mechanism is established for real-time anomaly detection. (2) Integrated Diagnosis: Upon detecting an OC state, the framework employs a delayed multiple hypothesis testing procedure to isolate anomalous components. This approach minimizes false discoveries while accommodating temporal dependencies in post-alarm data. (3) Industrial Applicability: Our method is validated through electron probe X-ray microanalysis (EPXMA), a critical technique in materials science for real-time composition monitoring. The method’s efficiency in handling high-dimensional sparse shifts makes it equally viable for IoT-enabled predictive maintenance and industrial process control.
This paper is structured as follows:
Section 2 formulates the monitoring and diagnosis problem, detailing the EWMA statistic, fault isolation strategy, and performance metrics.
Section 3 evaluates the method via simulations, benchmarking against state-of-the-art techniques.
Section 4 demonstrates its practicality through an EPXMA case study, highlighting its superiority in detecting micron-scale material defects. Conclusions and future directions are presented in
Section 5.
3. Simulation Studies
In this section, we conduct a comprehensive simulation study to evaluate the performance of our proposed monitoring and diagnosis framework, comparing it with several existing methodologies. For the experimental setup, we generate IC data streams from a multivariate normal distribution . To assess the effectiveness of our approach, we consider two distinct OC scenarios characterized by mean shifts:
(i) Mean abrupt shift: the OC stream follows , where is a parameter used to measure the degree of drift, and is a p-dimensional mean vector.
(ii) Mean gradual shift: the OC stream follows , where the mean vector evolves progressively over time according to the relationship, , with representing a small incremental change vector over time.
The two mean shift scenarios described above may impact only a subset of dimensions within the data. In the case of an abrupt mean shift, it is assumed that the initial mean vector is equal to , while the post-shift mean vector is a sparse p-dimensional vector. Specifically, most of its components remain zero, with only a few components assuming a value of 1. In the context of a gradual mean shift, the change in the mean vector is similarly sparse. That is, the incremental change affects only a few components, while the majority of its elements remain zero. The duration of the mean shift in each affected dimension is denoted by d, and the magnitude of the change at each time point is given by , reflecting a linear trend of increase or decrease. Over time, after a period of continuous gradual drift, the mean vector stabilizes, and the data stream enters a post-drift phase.
In both scenarios, the abnormal change occurs at a specific time point . Prior to , (i.e, when ), the process remains IC. However, for , the mean values of components undergo a change, while the remaining components remain unchanged. This sparsity in the mean shift is a critical characteristic of high-dimensional data streams, where changes are often localized to a small subset of dimensions.
The covariance matrix , which characterizes the correlation among p-dimensional random variables, plays a crucial role in the simulation study. In the experimental design, we maintain the assumption that remains invariant before and after the change point. Specifically, we investigate three distinct covariance matrix structures:
(a) Independent structure case: , where represents the identity matrix, indicating no correlation between variables;
(b) Long-range dependence structure case: for , with the correlation coefficient fixed at 0.5. This structure exhibits slowly decaying correlations between variables;
(c) Short-range correlation case: is a block-diagonal matrix, within each block matrix, , , where b is the block size and , .
The method presented in this study is fundamentally grounded in extreme value theory (EVT), henceforth referred to as the EVT method. To comprehensively evaluate its efficacy, we conducted comparative simulations with three alternative approaches, assessing their respective monitoring and/or diagnostic capabilities. The first comparative method employs an adaptive principal component (APC) selection mechanism utilizing hard-thresholding techniques, as proposed by Samaneh et al. [
2]. The second method, developed by Ahmadi and Mohsen [
5], incorporates a two-stage detection system combining a single Hotelling’s
control chart with a Shewhart control chart, subsequently denoted as the AM method. The third approach, proposed by Aman et al. [
27], presents a fault detection framework utilizing Slow Feature Analysis (SFA), specifically designed for time series models and SPC. In this study, we perform a thorough performance comparison with the Dynamic Slow Feature Analysis (DSFA) method, establishing a robust evaluation framework for our proposed methodology.
In the simulation framework, these methods are systematically applied to monitor continuous data streams and detect anomalies. The comparative analysis is performed through extensive computational experiments, with all performance metrics calculated from 1000 independent simulation runs to ensure statistical reliability and robustness.
Table 1 presents the simulated type-I error rates (
) and power values (
) obtained from the proposed online monitoring procedure under various model configurations. The simulation was conducted with parameters set at
,
,
,
,
, and the duration of the mean shift
in Scenario (ii), while examining three levels of abnormality degree
, respectively. The results demonstrate that when
and the proportion of abnormal data stream components (
) ranges from 10% to 25%, the empirical type-I error rates are effectively maintained around the nominal level of 5%, in most scenarios. Furthermore, the power values exhibit a positive correlation with the abnormality degree (
), indicating that higher degrees of abnormality facilitate easier detection of anomalous data. Notably, in Scenario (i), the power values consistently exceed 99% across all models and proportions when
, demonstrating the method’s exceptional detection capability for abrupt changes. In contrast, Scenario (ii) shows relatively lower power values ranging from 86.6% to 94.0%, reflecting the increased challenge in detecting gradual changes compared with abrupt mutations. The standard deviations, presented in parentheses, indicate the stability of the monitoring results across different experimental conditions. These findings collectively validate the effectiveness of the proposed method in maintaining controlled type-I error rates while achieving high power across various abnormal data scenarios.
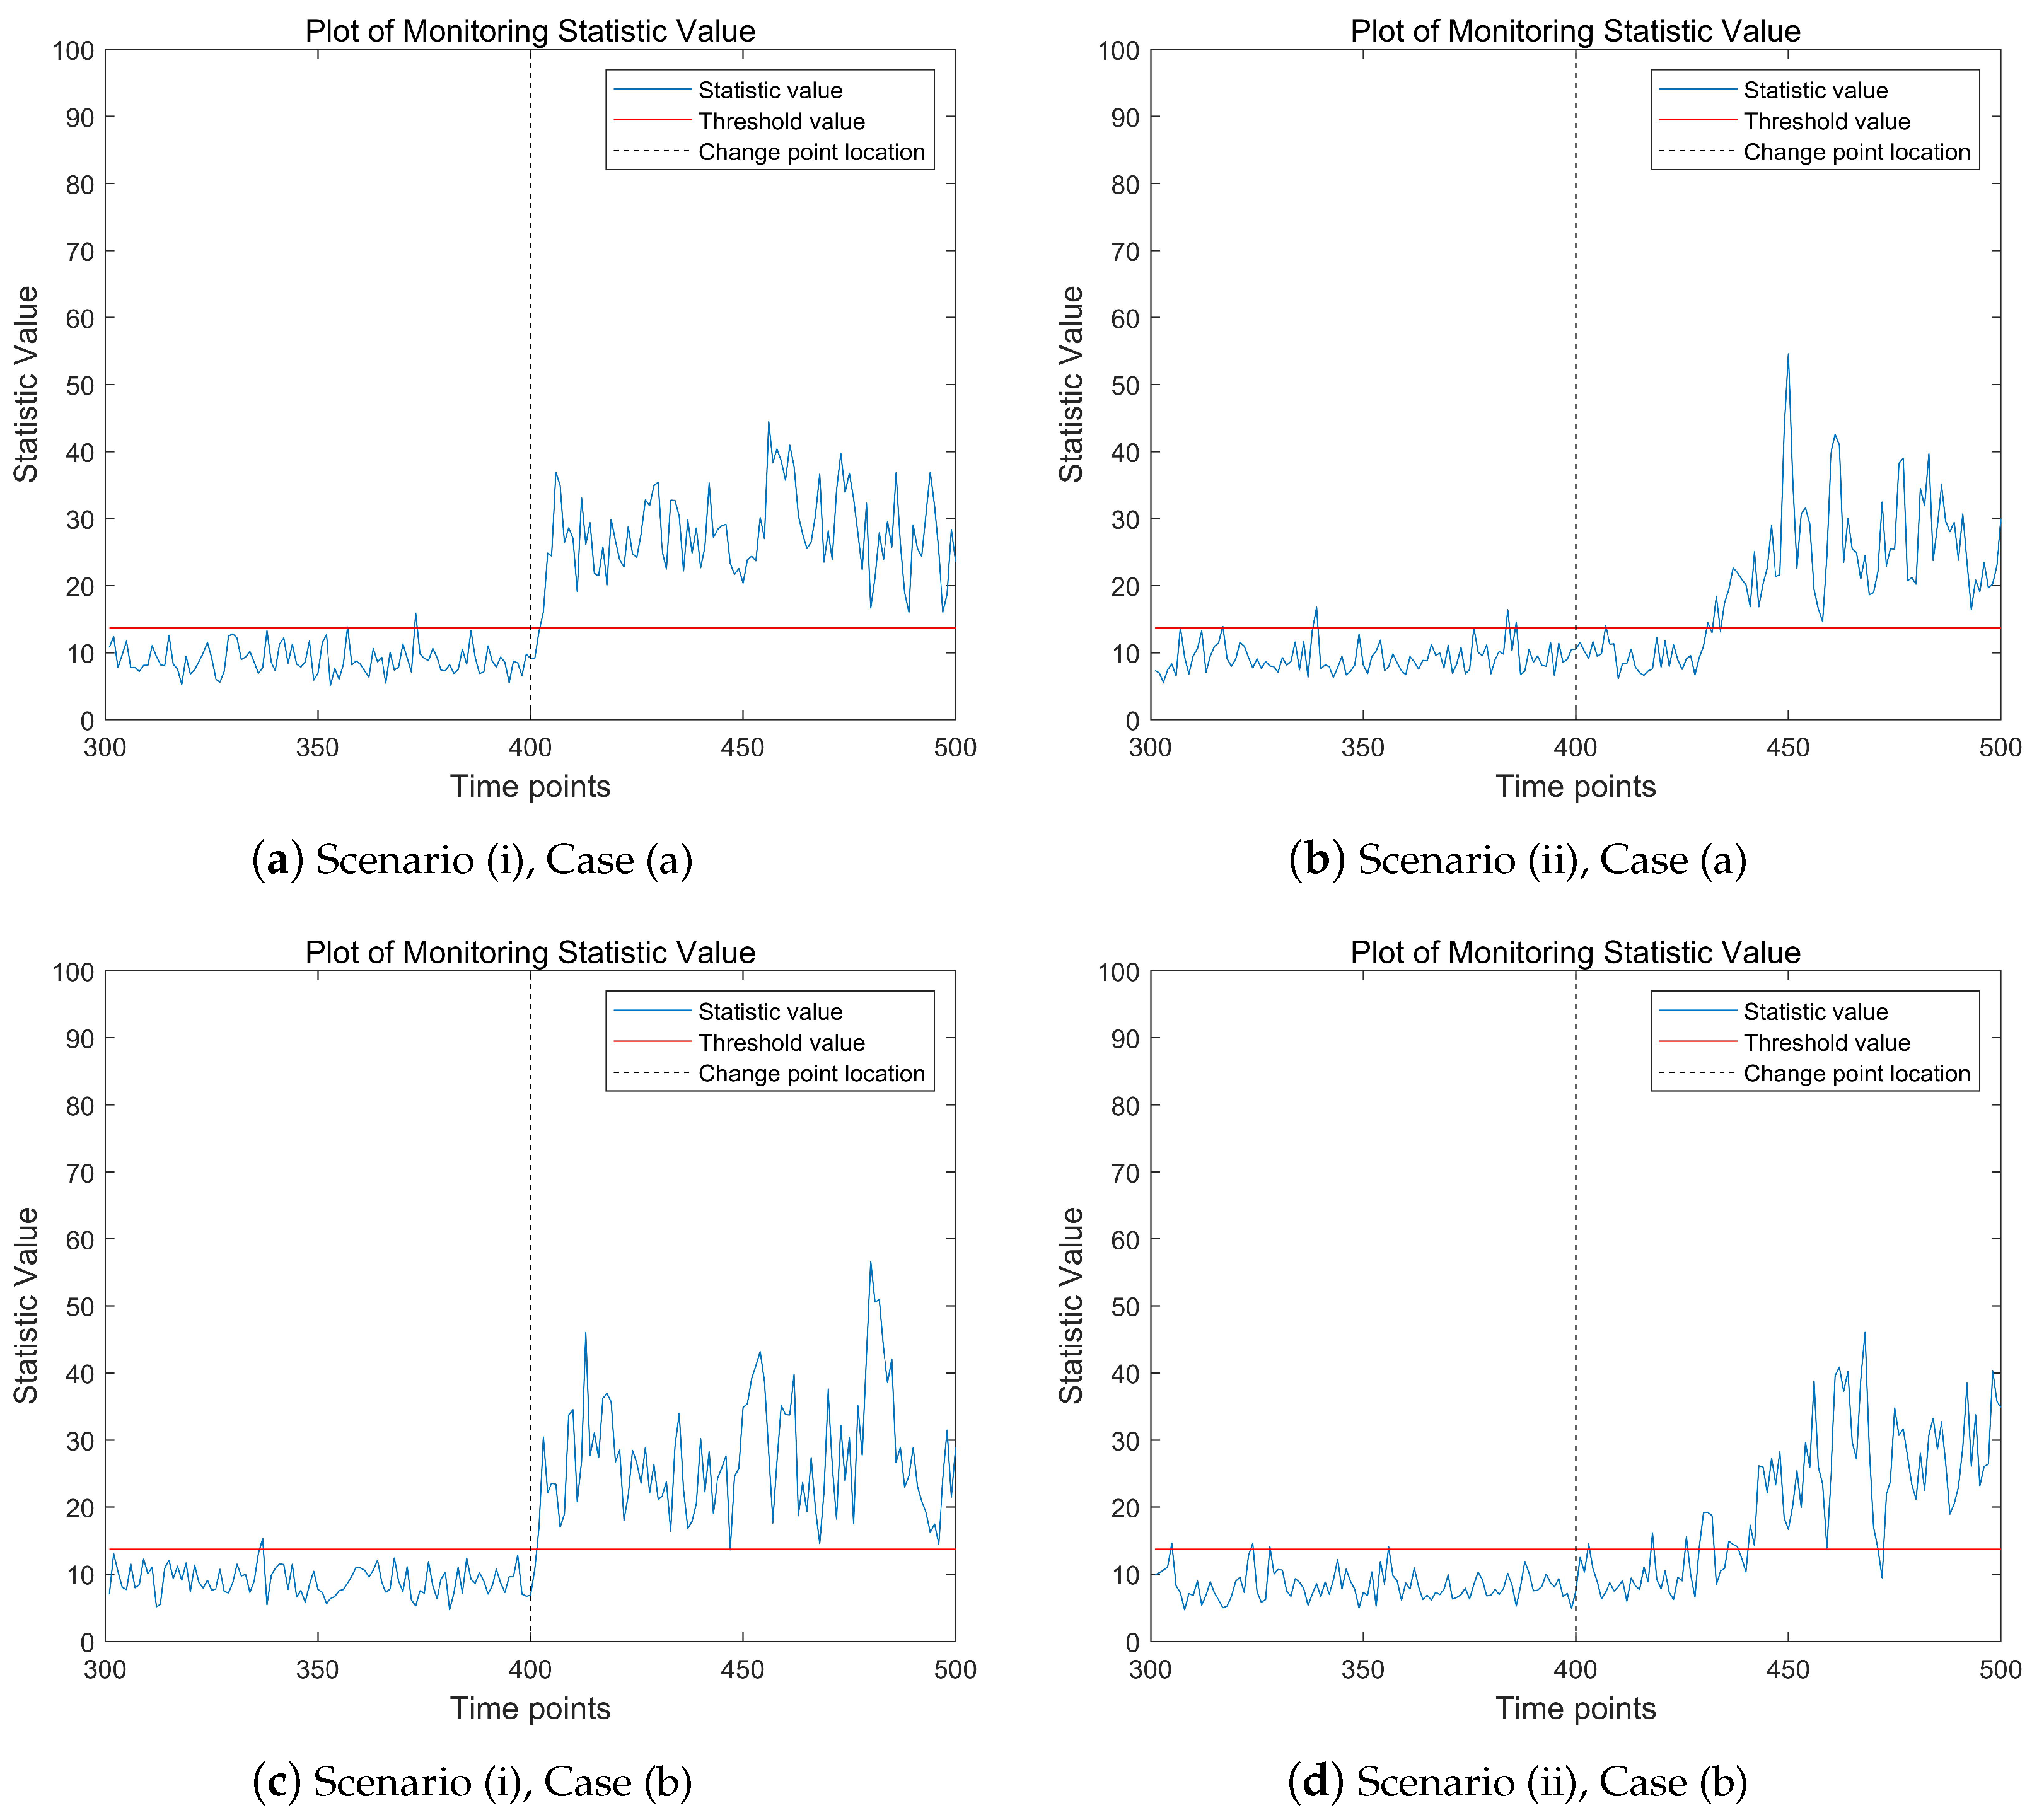
Figure 2 shows the change trend of the proposed monitoring statistics over time points in different model scenarios. The proportion of abnormal data stream is
. The three subfigures on the left depict the mean abrupt shift model, while the three subplots on the right represent the mean gradual shift model. In the high-dimensional data stream being monitored, the real change point time
. From the results presented in
Figure 2, it is evident that in all three model scenarios, the values of the monitoring statistics exhibit a significant upward trend after the change point occurs. Notably, the monitoring statistic values in the left subplots show a more pronounced upward trend post-change point compared with the right subplots. This is attributed to the abrupt mean shift in the left subplots, which leads to a more substantial increase in the monitoring statistic values. It is important to note that before the change point occurs, the values of the monitoring statistics may occasionally exceed the threshold at certain time points. This phenomenon is likely caused by outliers in the data. Overall,
Figure 2 demonstrates that the proposed monitoring statistic effectively captures the changing trends in high-dimensional data streams, providing a reliable method for detecting shifts in the data.
Table 2 presents a comprehensive comparison of three change point detection methods (EVT, A-M, and APC) under different scenarios and parameter settings. The evaluation is based on three key metrics: Bias (the absolute deviation between estimated and true change points), Sd (the standard deviation of estimators), and
(the probability that the absolute difference between true and estimated change points is within a specified threshold
j). The results demonstrate a clear trend across all methods: as the signal strength parameter
increases from 1.0 to 2.0, the estimation accuracy improves significantly. This improvement is evidenced by the decreasing values of Bias and Sd, along with the increasing values of
. Specifically, when
reaches 2.0, all methods achieve their best performance, with
values approaching or exceeding 90% in most cases.
In Scenario (i) with , the EVT method shows superior performance, particularly at higher values. When , EVT achieves a remarkably low Bias of 1.1 and Sd of 1.1, with reaching 99.5%. The APC method also demonstrates competitive performance, showing consistent improvement across different values. The A-M method, while showing improvement with increasing , generally underperforms compared with the other two methods in this scenario. For Scenario (i) with , similar patterns emerge, though the absolute values of the metrics are slightly different. The EVT method maintains its leading position, achieving a Bias of 1.2 and Sd of 0.8 at , with remaining at 99.5%. The APC method shows particularly strong improvement in this scenario, with increasing from 57.1% at to 92.7% at . In Scenario (ii), which represents a more challenging detection environment, all methods show higher Bias and Sd values compared with Scenario (i). However, the relative performance ranking remains consistent, with EVT maintaining its advantage, followed by APC and then A-M. Notably, even in this more difficult scenario, the EVT method achieves values above 90% when reaches 2.0.
These results collectively demonstrate that while all methods benefit from stronger signals (higher values), the EVT method consistently outperforms the others across different scenarios and parameter settings. The findings suggest that the choice of detection method should consider both the expected signal strength and the required precision of change point estimation.
The size of the smoothing parameter
plays a crucial role in determining the performance of the EWMA-based monitoring procedure, particularly affecting the type-I error rate, detection power, and change point estimation accuracy.
Table 3 presents a comprehensive simulation study evaluating these performance metrics under different
values (0.2, 0.4, and 0.6) across various abnormality indicators (
= 1.0, 1.5, 2.0) and sparsity levels (
= 0.05, 0.10, 0.15) of the mean abrupt shift model. The simulation results reveal several important patterns. First, the type-I error rate remains stable around the nominal level of 5% across all
values, demonstrating the robustness of the proposed method in maintaining false alarm control. However, the power
shows a strong dependence on
, with higher values of
leading to substantially reduced detection rates. For instance, when
= 1.0 and
, the detection power decreases from 80.4% at
= 0.2 to only 17.8% at
= 0.6.
The change point estimation accuracy, measured by , also exhibits sensitivity to selection. Smaller values consistently provide more precise change point detection, particularly for smaller mean shifts ( = 1.0). For example, at and = 1.0, the estimation error increases from 9.5 (209.5–200) at = 0.2 to 90.1 at = 0.6. This pattern is particularly pronounced for smaller values, confirming the EWMA statistic’s sensitivity to small mean drifts. Interestingly, as increases, the influence of on both detection power and change point estimation diminishes. At = 2.0, even with = 0.6, the method achieves detection power above 85% across all sparsity levels, and the change point estimation error remains within 5.5 time units. This suggests that while selection is critical for detecting small changes, its impact becomes less significant when dealing with larger mean shifts. The results also indicate that higher sparsity levels () generally improve detection performance, particularly for smaller values. This pattern is most evident in the = 1.0 scenario, where increasing from 0.05 to 0.15 improves detection power from 80.4% to 95.9% at = 0.2.
These findings collectively suggest that while smaller values (around 0.2) are preferable for detecting small changes and achieving accurate change point estimation, larger values may be more suitable when robustness to noise is prioritized over sensitivity to small shifts. The choice of should therefore be guided by the specific monitoring objectives and the expected magnitude of process changes.
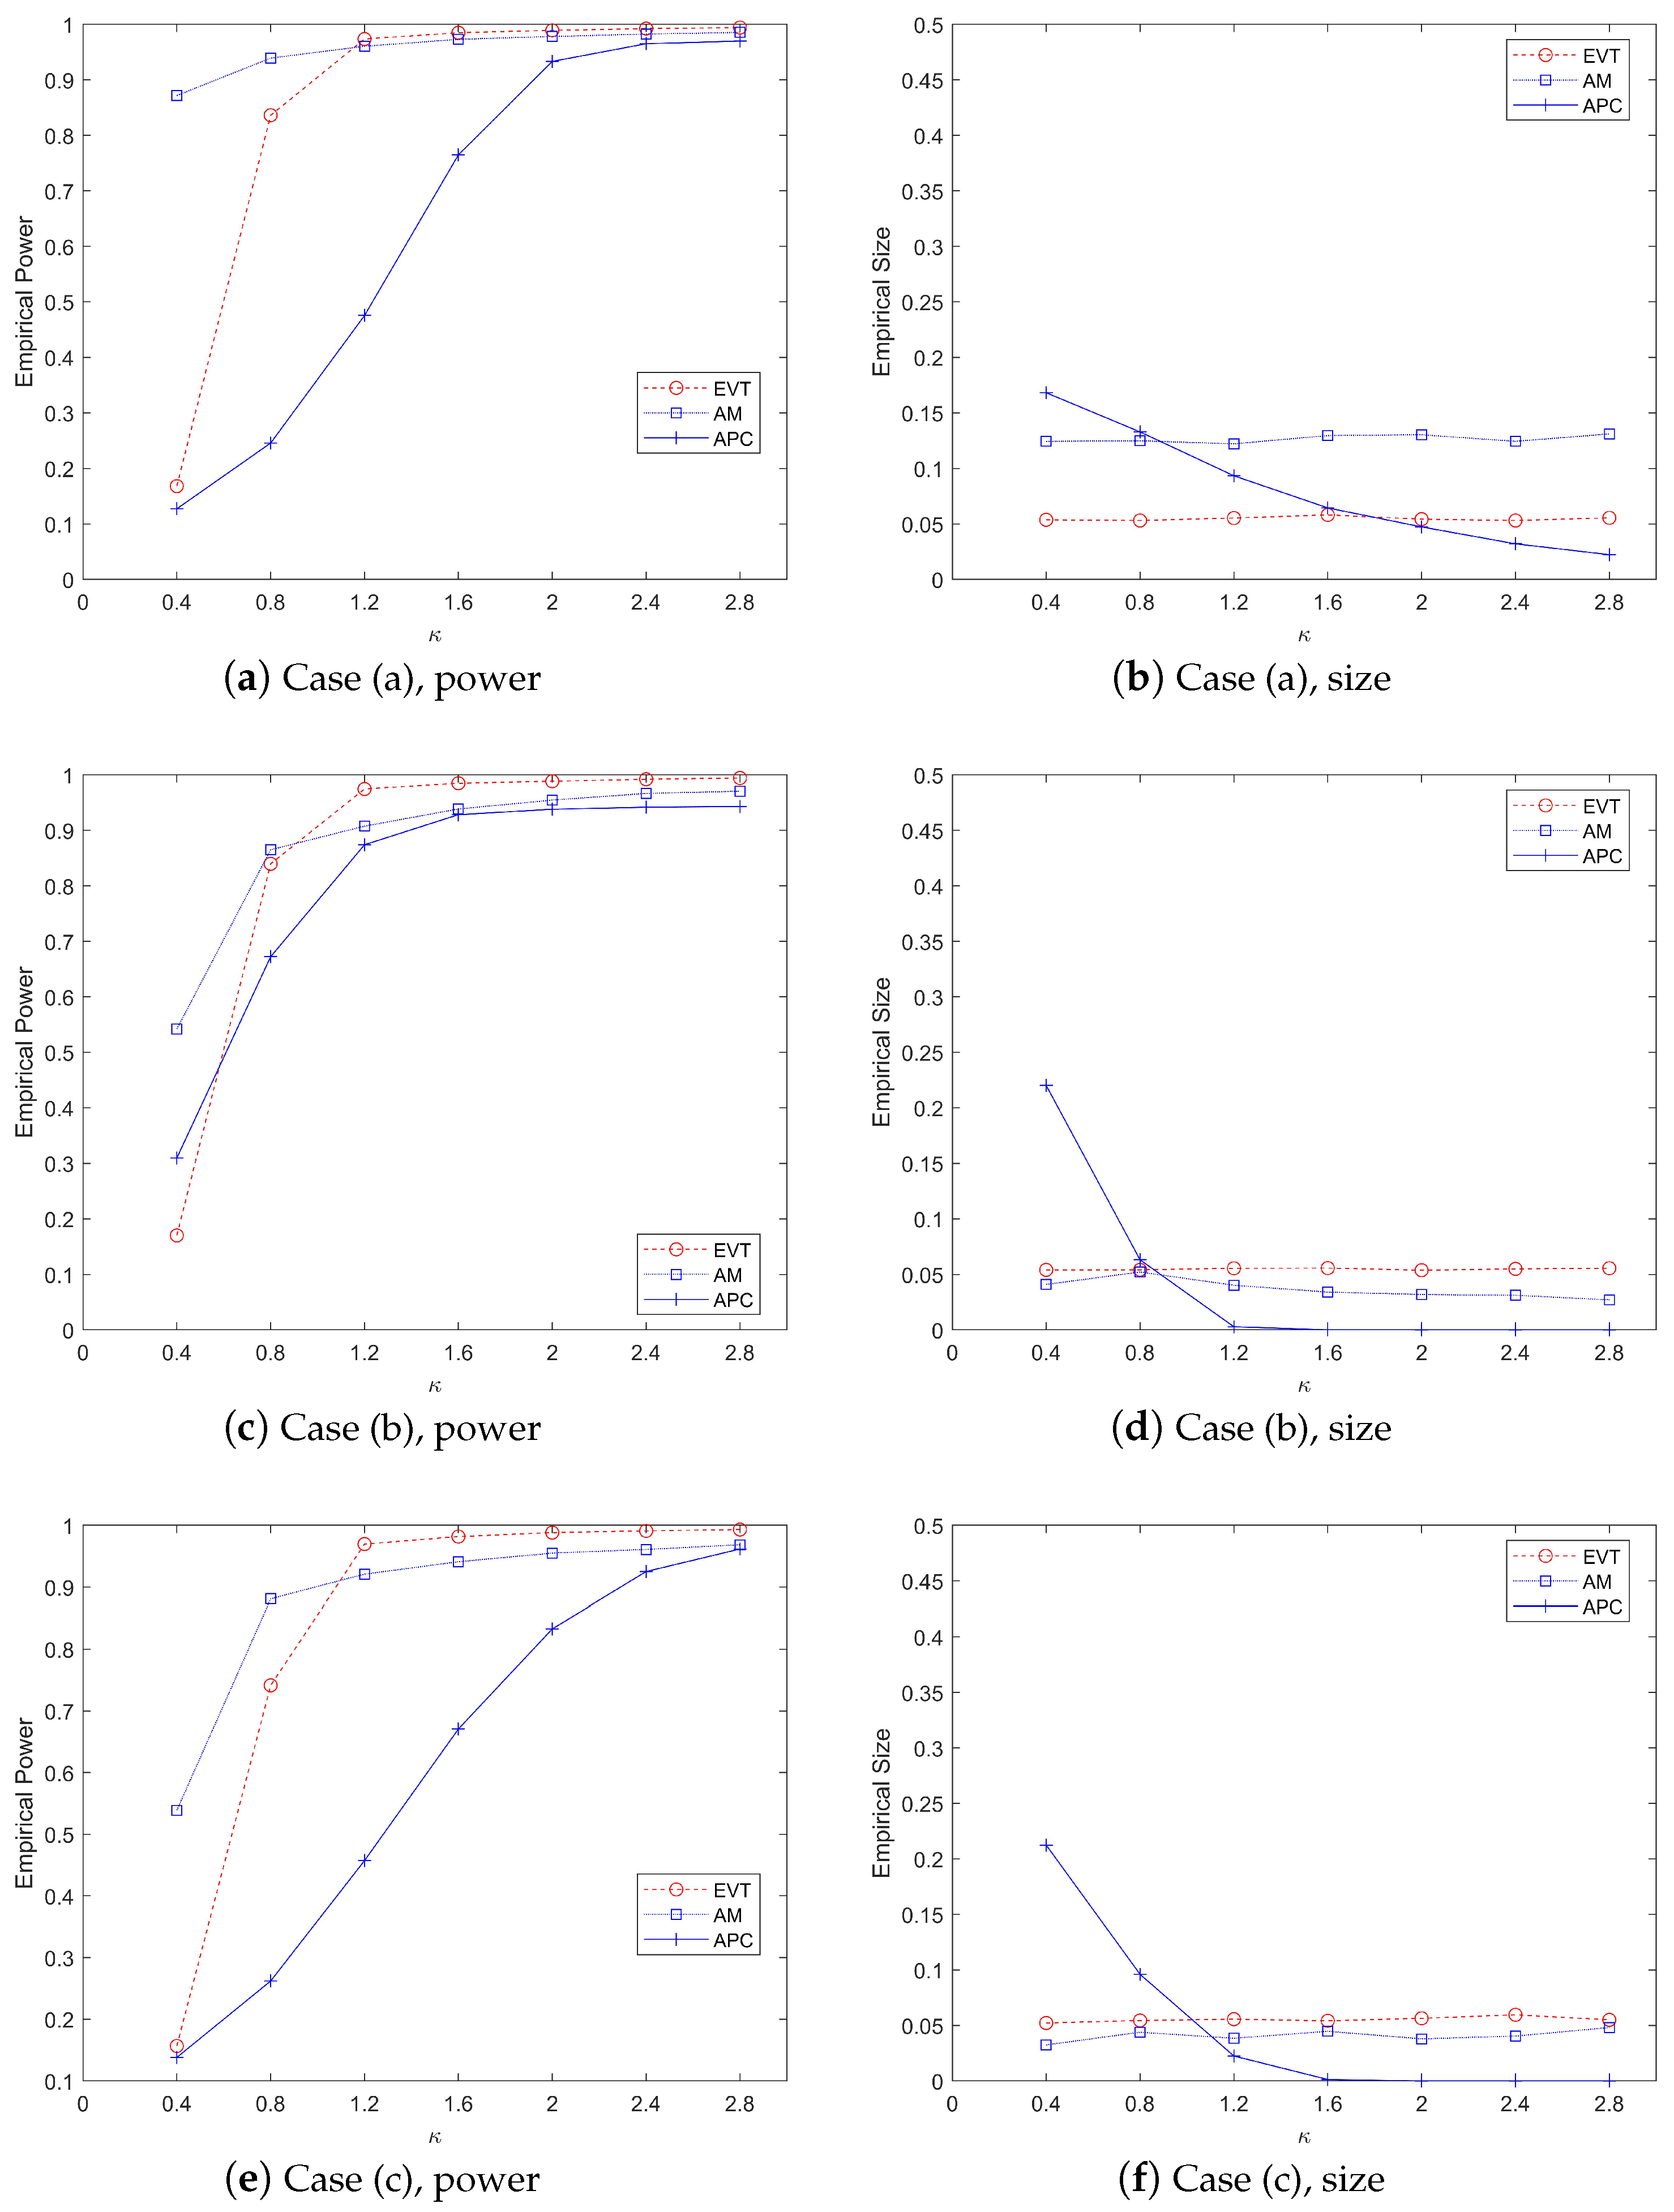
Figure 3 illustrates a comparative analysis of the performance metrics, including power values and type-I error rates, across three monitoring methods under varying
parameter values, evaluated against three distinct covariance matrix structures in the mean abrupt shift scenario. The left panel of the figure demonstrates the power values obtained by each method. When
= 0.4 or
= 0.8, the AM method exhibits a slight advantage over our proposed EVT method. However, as
increases to 1.2 or beyond, the EVT method significantly outperforms both the AM and APC methods in terms of power values. The right panel of
Figure 3 focuses on the type-1 error rates. It is evident that the EVT method effectively controls the type-1 error rate around the nominal level of 5%. In contrast, the AM method fails to maintain control over the type-I error rate. The APC method also shows suboptimal performance in controlling type-I errors. Overall,
Figure 3 highlights the robustness and superiority of the EVT method, especially for larger values of
, both in terms of power and type-I error control. The results underscore the limitations of the AM and APC methods in maintaining statistical control under varying conditions.
Table 4 lists the fault diagnosis results of high-dimensional data streams by using different diagnostic methods. We have calculated the values of two main indicators here: one is the correct recognition rate, and the other is the incorrect recognition rate. At the same time, we also considered the value of change point estimation during the online monitoring phase. The results show that as
k increases, the change point estimation becomes closer to the true value. Regardless of the proportion of
being equal to 5%, 10%, or 15%, the EVT method is significantly better than the other two methods. Furthermore, from the diagnostic results, the TPR values of the EVT method are close to 100%. It should be noted that the AM method and APC method also have good diagnostic results. As pointed out by Vilenchik et al. (2019) [
35], PCA-based approaches, such as APC, face a problem of difficult interpretation, especially for high-dimensional data. Considering this, as well as the results of point estimation, our method is, overall, superior to the other two methods.
Recently, Aman et al. [
27] proposed a novel methodology for fault detection based on Slow Feature Analysis (SFA), specifically tailored for time series models and SPC. Their comprehensive analysis demonstrates that Kernel SFA (KSFA) and Dynamic SFA (DSFA) significantly outperform traditional methods by offering enhanced sensitivity and fault detection capabilities.
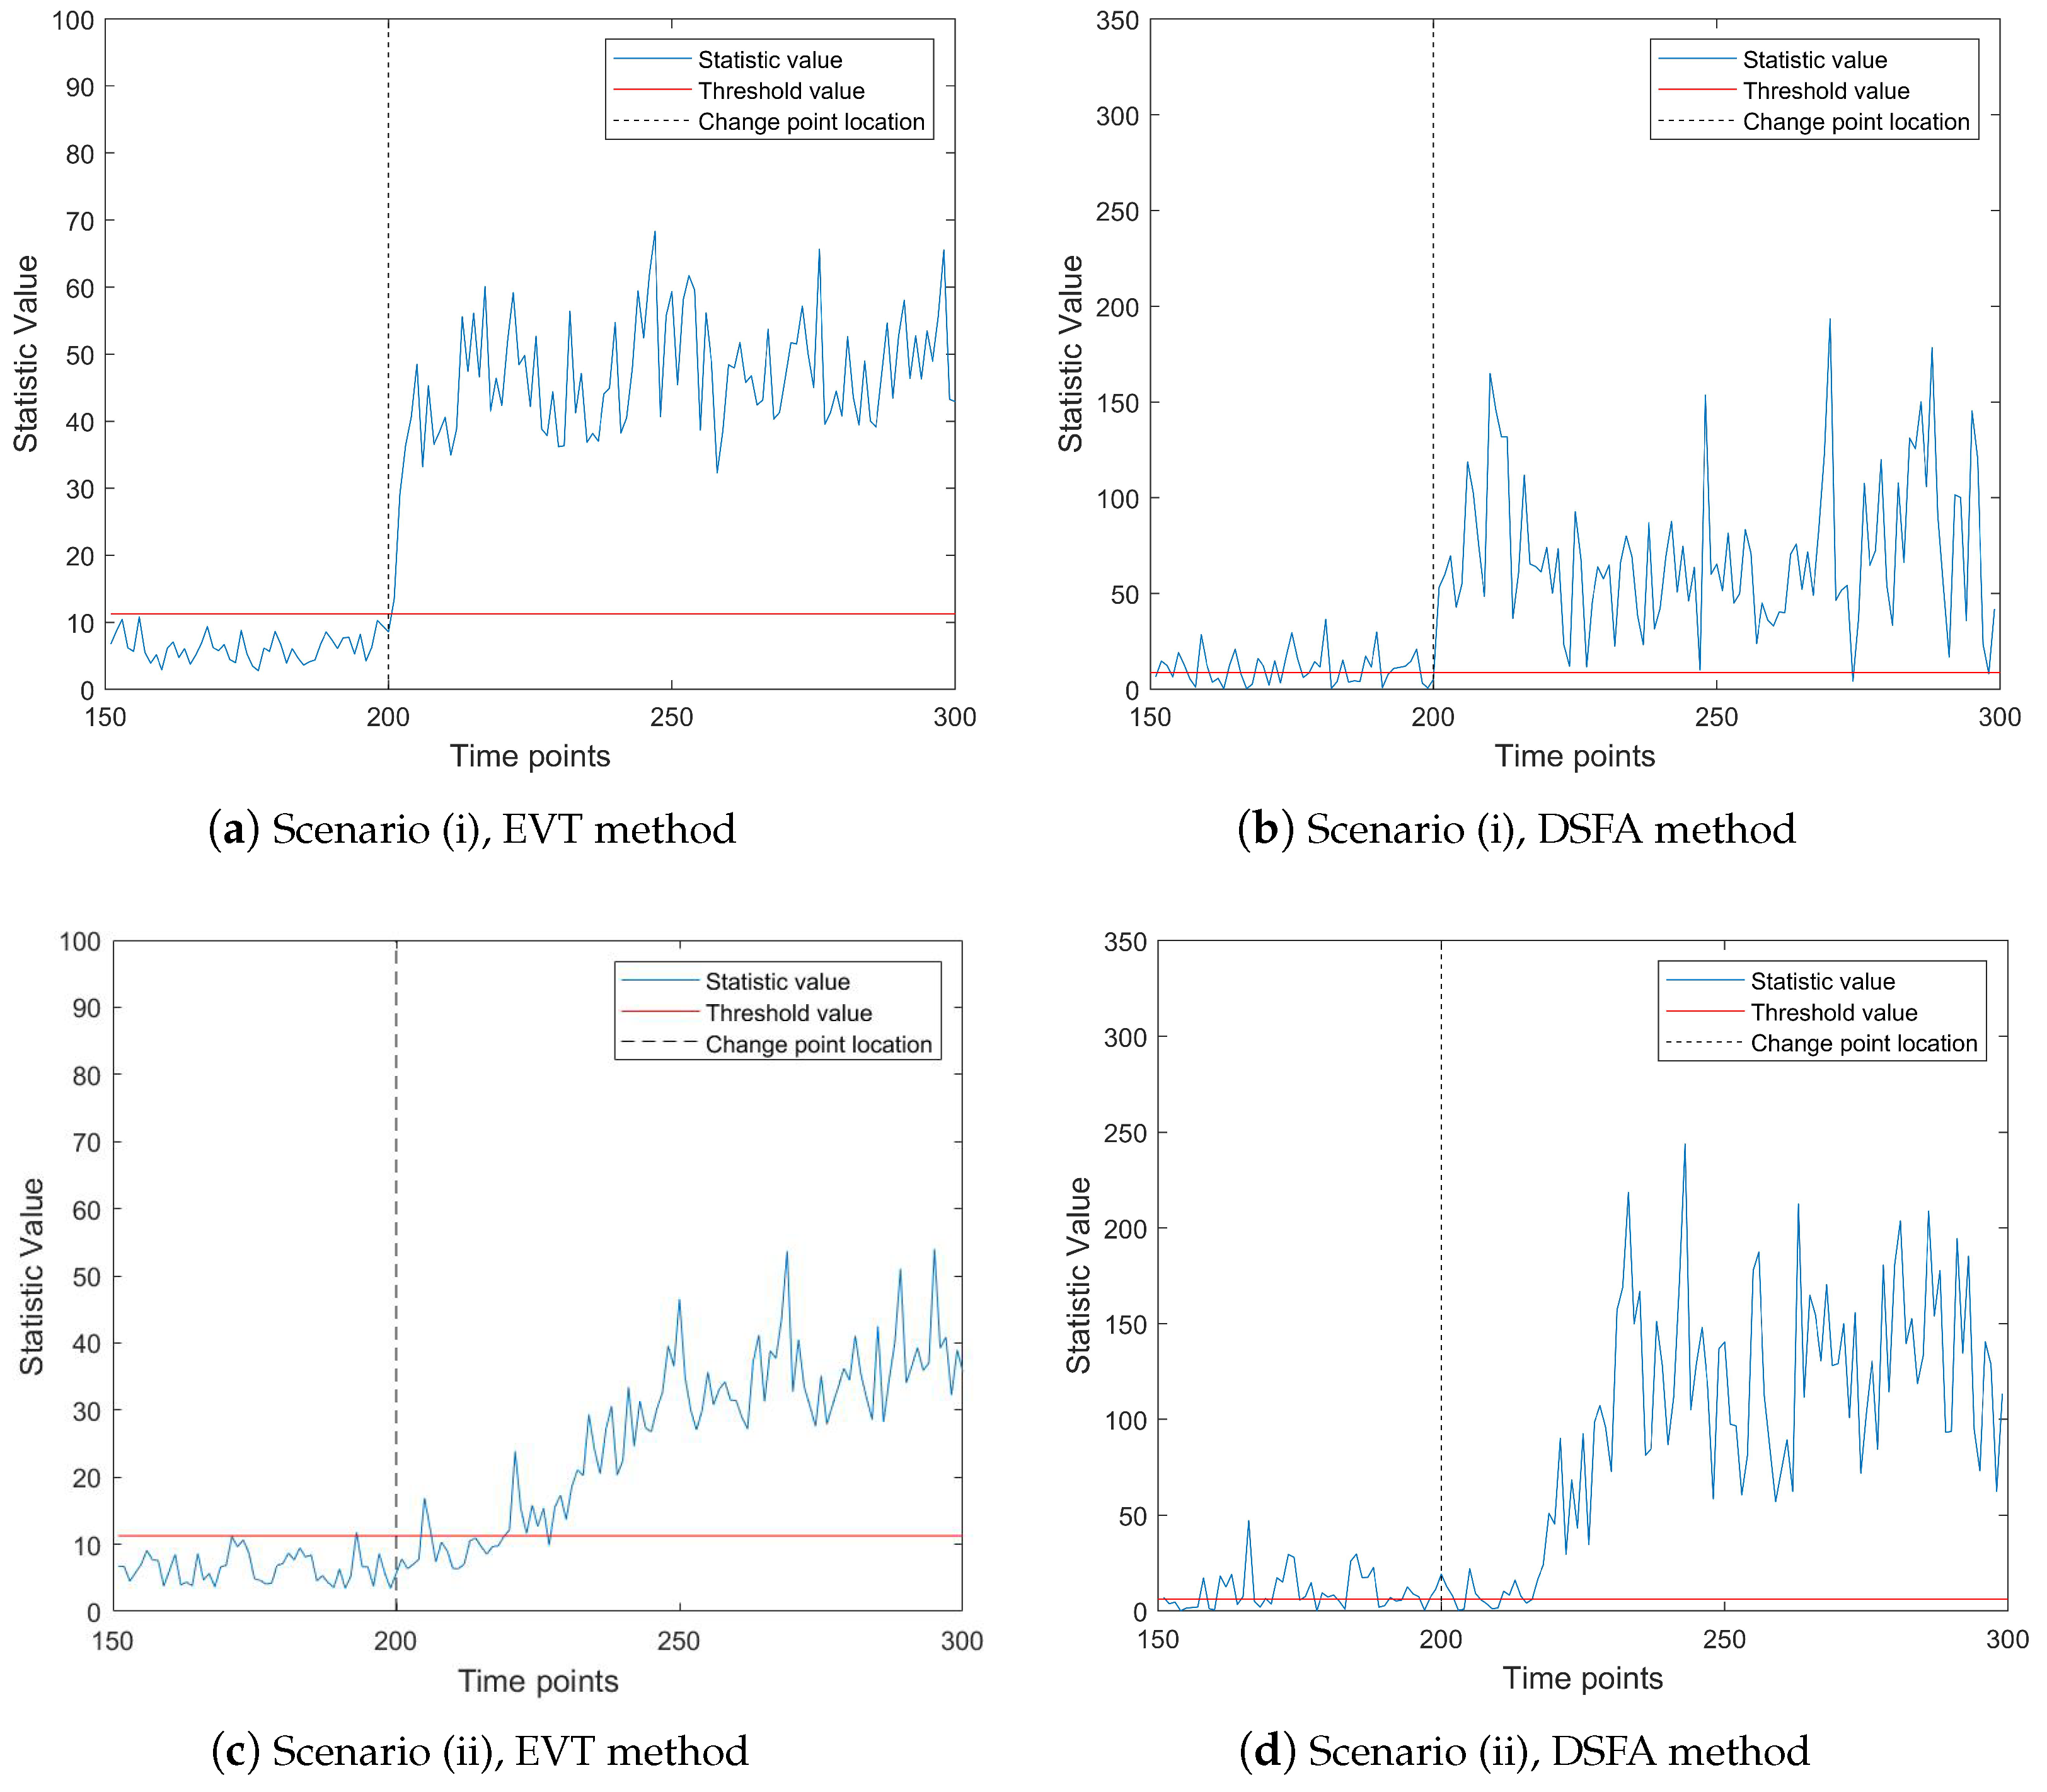
To further evaluate the effectiveness of fault detection methods, we compare the proposed EVT online monitoring method with the DSFA method. The results of this comparison are presented in
Figure 4 and
Figure 5. It is important to note that, as observed in prior analyses, the DSFA method struggles to effectively monitor high-dimensional and ultra-high-dimensional sparsely changing time series data streams, primarily due to the challenges posed by the curse of dimensionality. To facilitate a more meaningful comparison, we select a data stream with a slightly lower dimensionality. Specifically, we set the parameters as follows:
,
,
,
, with 30 components exhibiting abnormal changes. We examine two scenarios of mean change: (i) mean abrupt shift and (ii) mean gradual shift. In the gradual shift scenario, the duration of the change is set to
time units.
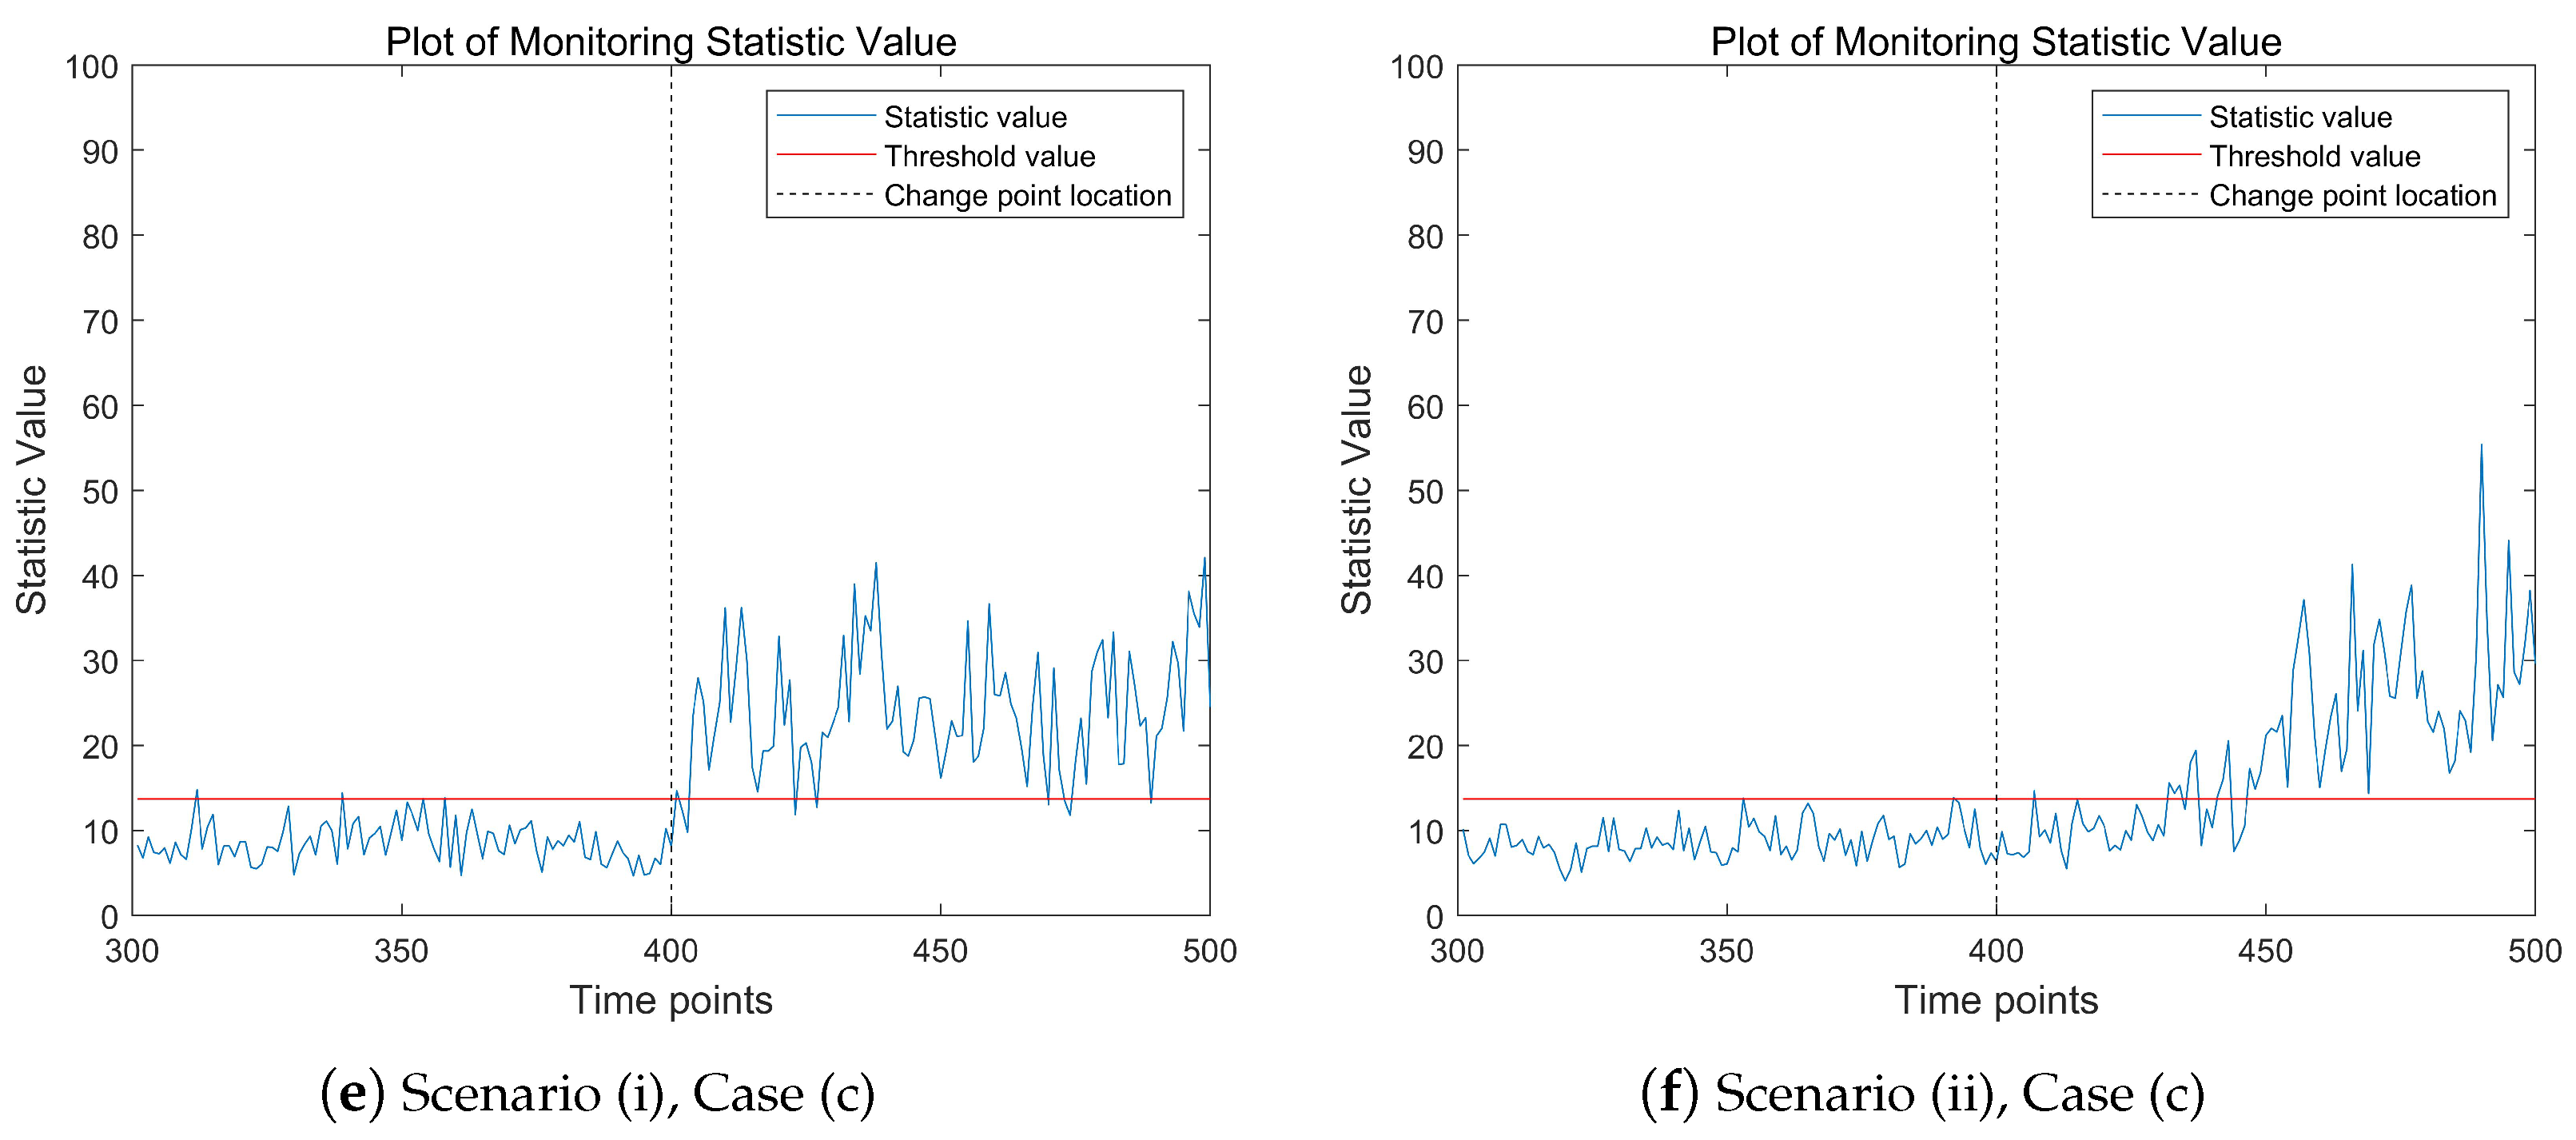
Figure 4 illustrates the performance of both the EVT and DSFA methods under these two scenarios. The left subfigure depicts the mean abrupt shift case, while the right subfigure represents the mean gradual shift case. In both subfigures, the gray lines denote IC data, and the red lines indicate OC data. From
Figure 4, it is evident that both methods exhibit significant changes in monitoring statistics after the change point, indicating their ability to detect faults. In the first scenario (mean abrupt shift), the EVT method promptly reflects the abnormal changes in the data stream, with the monitoring statistics clearly exceeding the threshold at the change point. Moreover, in the absence of changes, most of the monitoring statistics remain below the threshold, demonstrating the method’s robustness. In the second scenario (mean gradual shift), both methods exhibit a delay in detection due to the gradual nature of the change. However, the DSFA method incorrectly identifies a substantial amount of normal data as abnormal before the change point occurs, highlighting its limitations in handling gradual shifts. In contrast, the EVT method demonstrates superior performance by more accurately distinguishing between normal and abnormal data, even in the presence of gradual changes.
Overall, the results in
Figure 4 underscore the advantages of the EVT method over the DSFA method, particularly in terms of timely and accurate fault detection in both abrupt and gradual change scenarios. This comparison reinforces the effectiveness of the EVT approach for online monitoring of time series data streams.
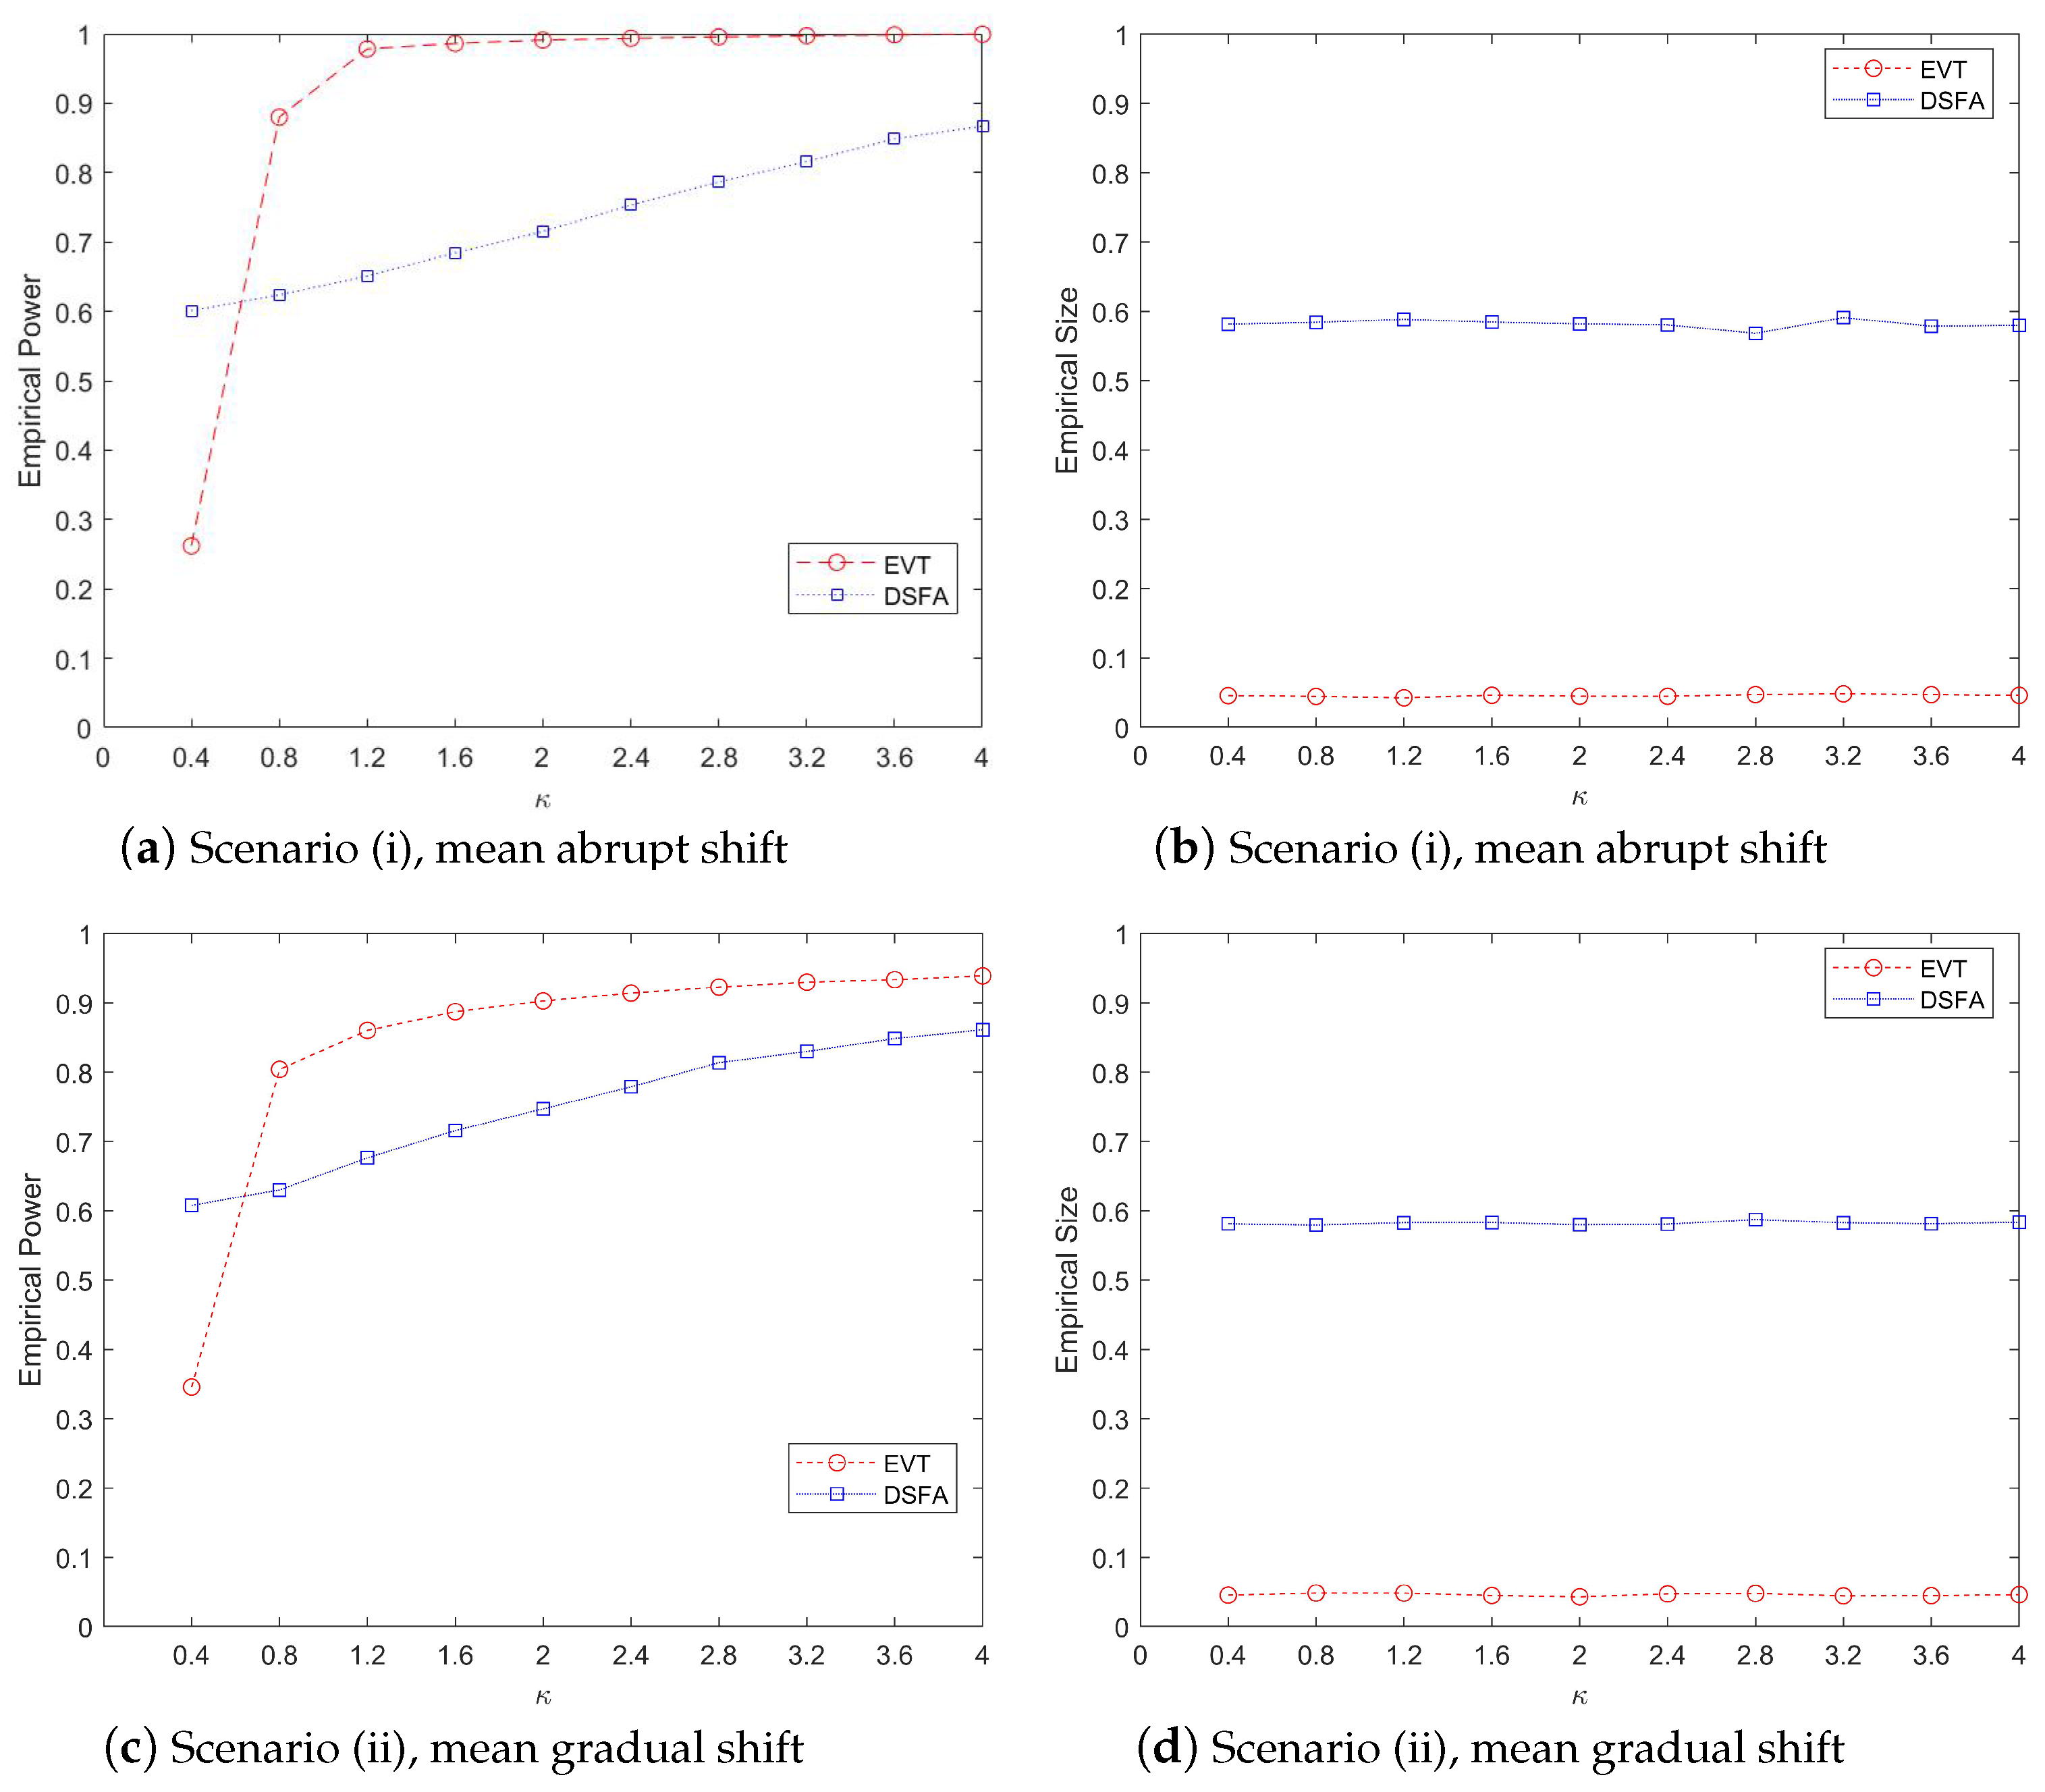
Figure 5 illustrates the change trends in monitoring power and type-I error rates for the EVT and DSFA methods as the degree of abnormality
increases from 0.4 to 4.0. The figure examines two types of mean changes: abrupt and gradual shifts. The top two subplots (a) and (b) depict the performance of the two methods in terms of monitoring power and type I error under abrupt mean changes, while the bottom two subplots (c) and (d) show the corresponding trends under gradual mean changes.
From
Figure 5, it is evident that the monitoring power of both methods increases with the rise in
, as shown in the left subplots. However, the EVT method consistently outperforms the DSFA method, demonstrating superior monitoring efficiency. Specifically, the power values monitored by the EVT method are significantly higher than those of the DSFA method, regardless of whether the mean change is abrupt or gradual. This indicates that the EVT method is more effective in detecting anomalies as
increases. The right subplots focus on the type-I error rates. The EVT method effectively controls the error rate around the 5% threshold, maintaining reliability in false positive detection. In contrast, the DSFA method struggles to control the type-I error, with many monitoring statistics exceeding the threshold before the change point occurs. This aligns with the results observed in
Figure 4, further highlighting the robustness of the EVT method in managing error rates. In summary,
Figure 5 demonstrates that while both methods improve in monitoring power with increasing
, the EVT method is significantly more effective and reliable, particularly in controlling type-I errors, making it a preferable choice for detecting mean changes in data streams.


