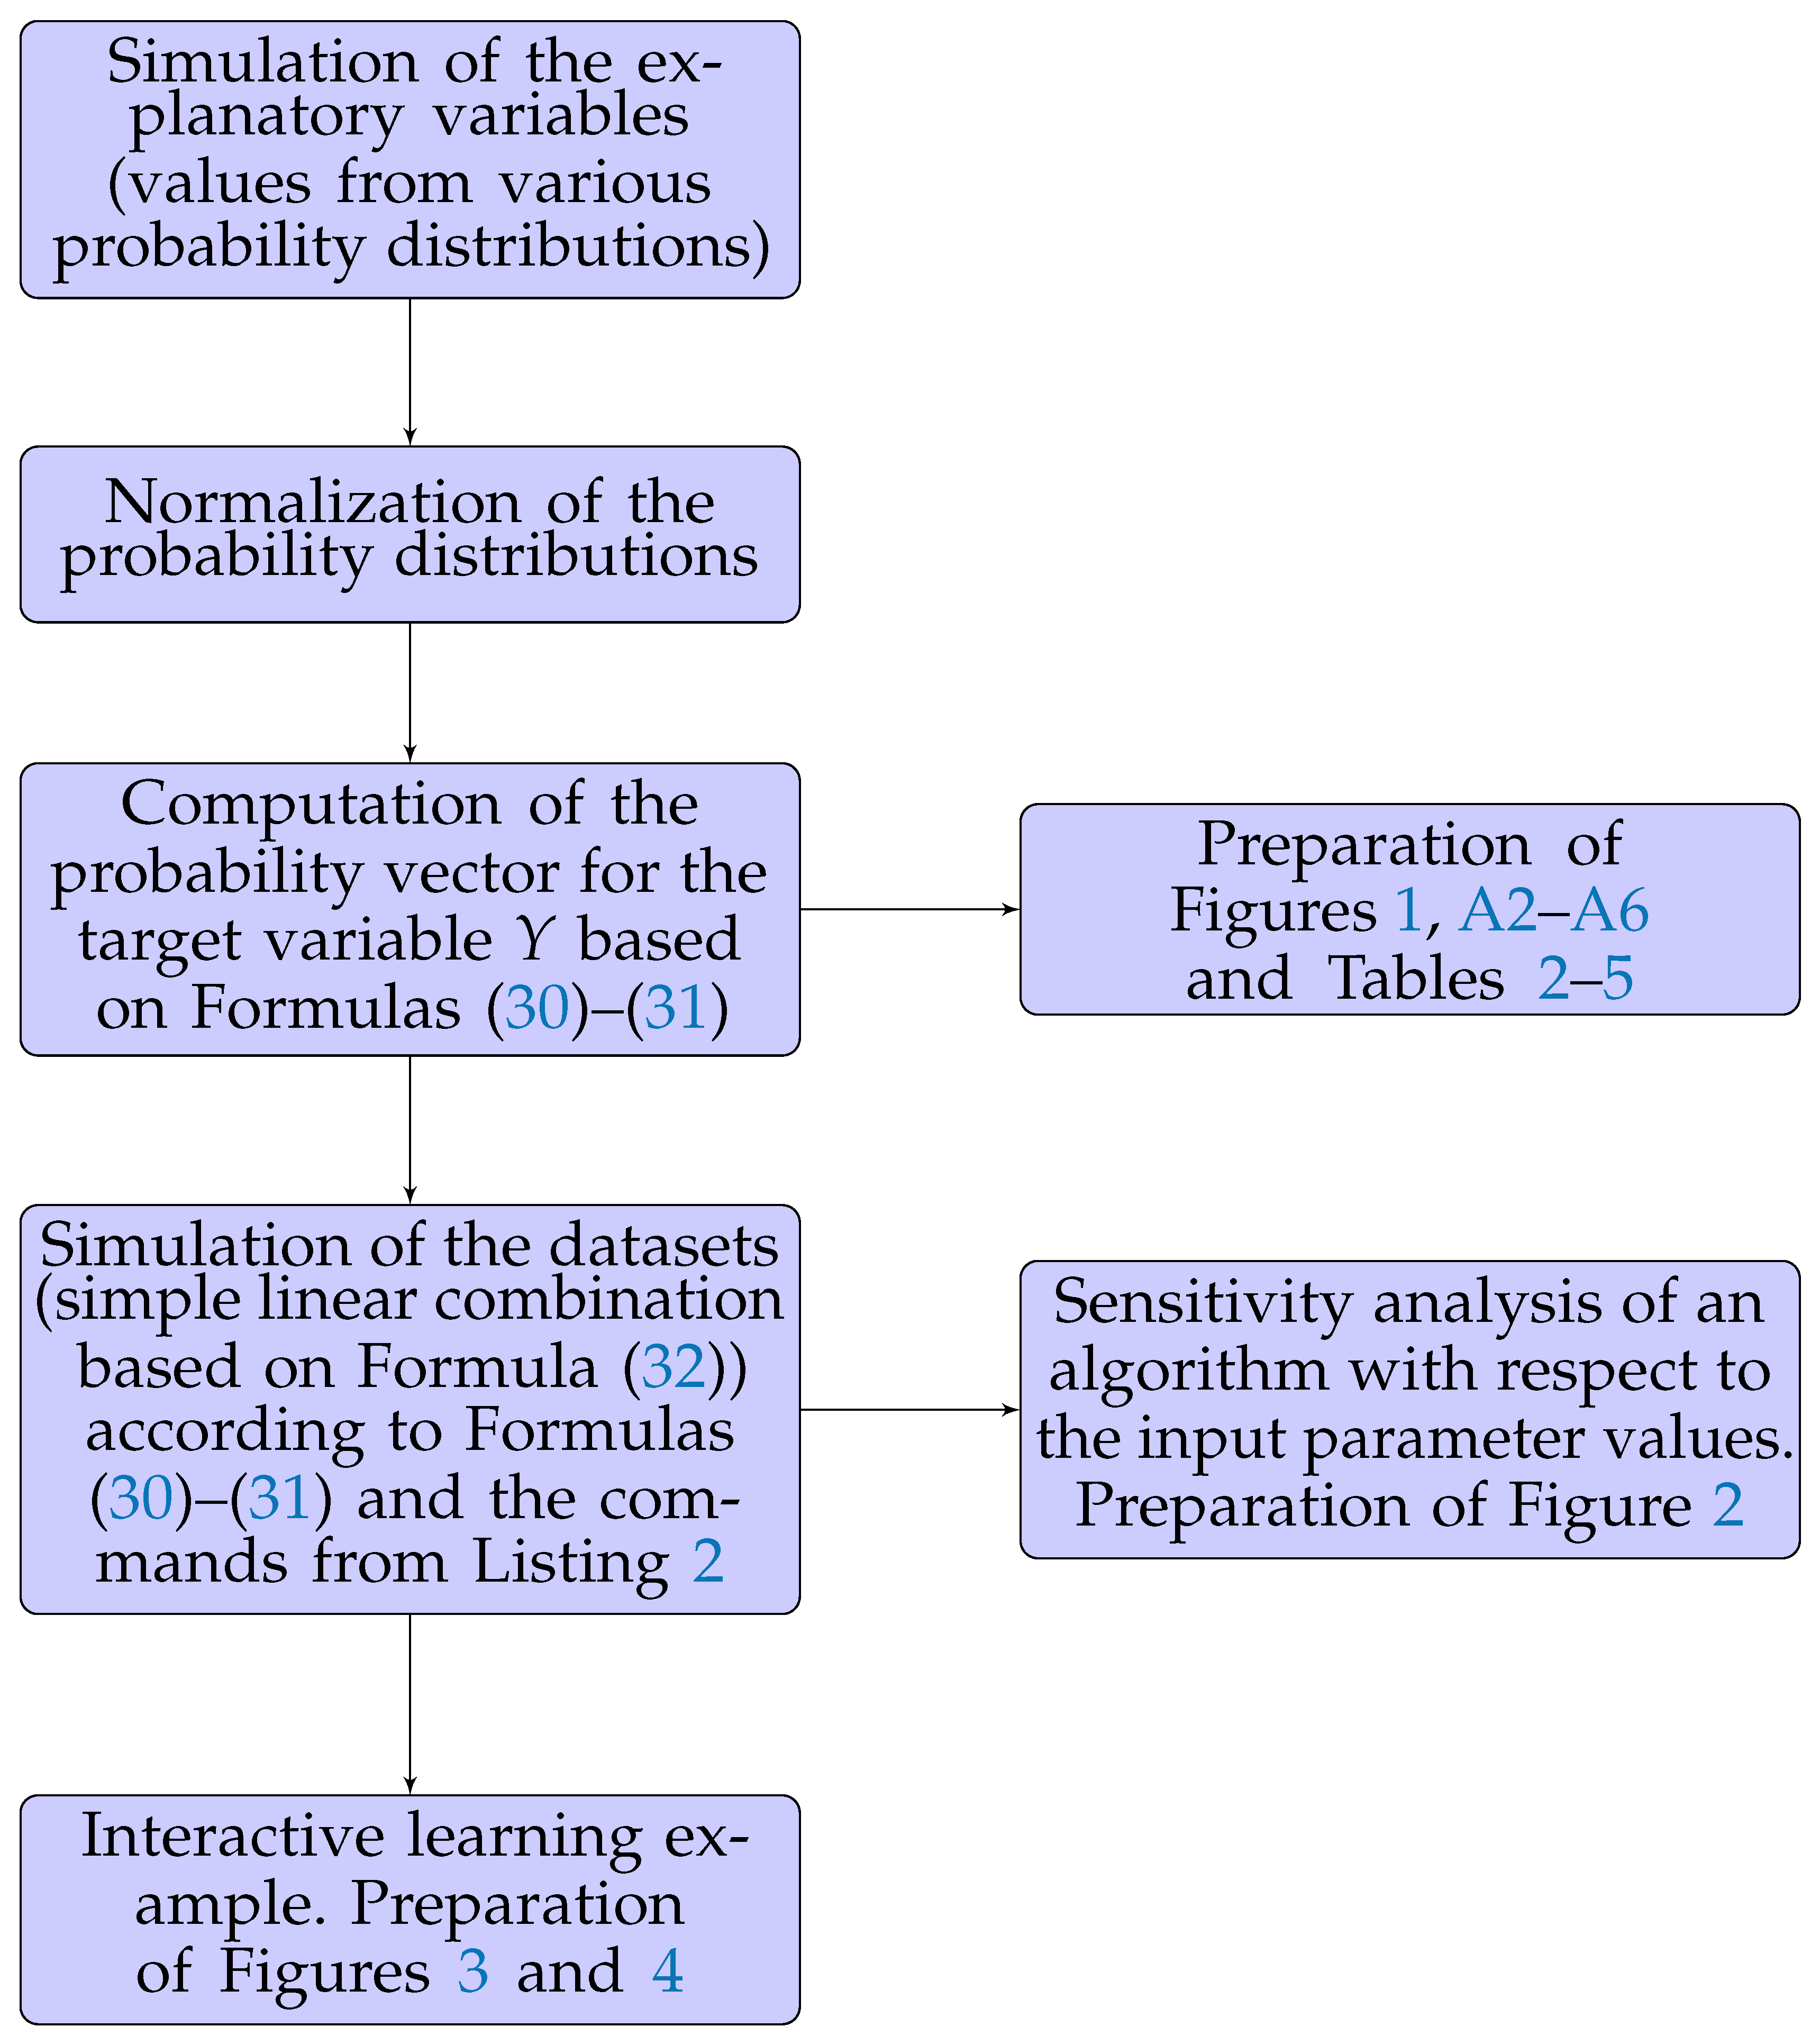
6.1. Nature of the Applied Explanatory Variables and Implemented Impurity Measures
To understand the main steps of the analysis and the experiment structure, see
Figure A1 in
Appendix A.
We have started our empirical study by simulating the explanatory variables values (for the future regression logistic model) from various probability distributions in order to ensure a wide range of variability (see [
46]). The following six distributions (with parameters specified in parentheses) have been selected: normal (
rnorm function with a mean of 0 and a standard deviation of 1), uniform (
runif function with an interval of
), beta (
rbeta function with both the shape and scale parameters set to
), exponential (
rexp function with a parameter of 1), Cauchy (
rcauchy function with the location and scale parameters set to 0 and 1, respectively), right-skewed beta—denoted as Beta2 (
rbeta function with the shape and scale parameters set to 5 and 1, respectively). For more insight into these simulations, see the subplots (a) in
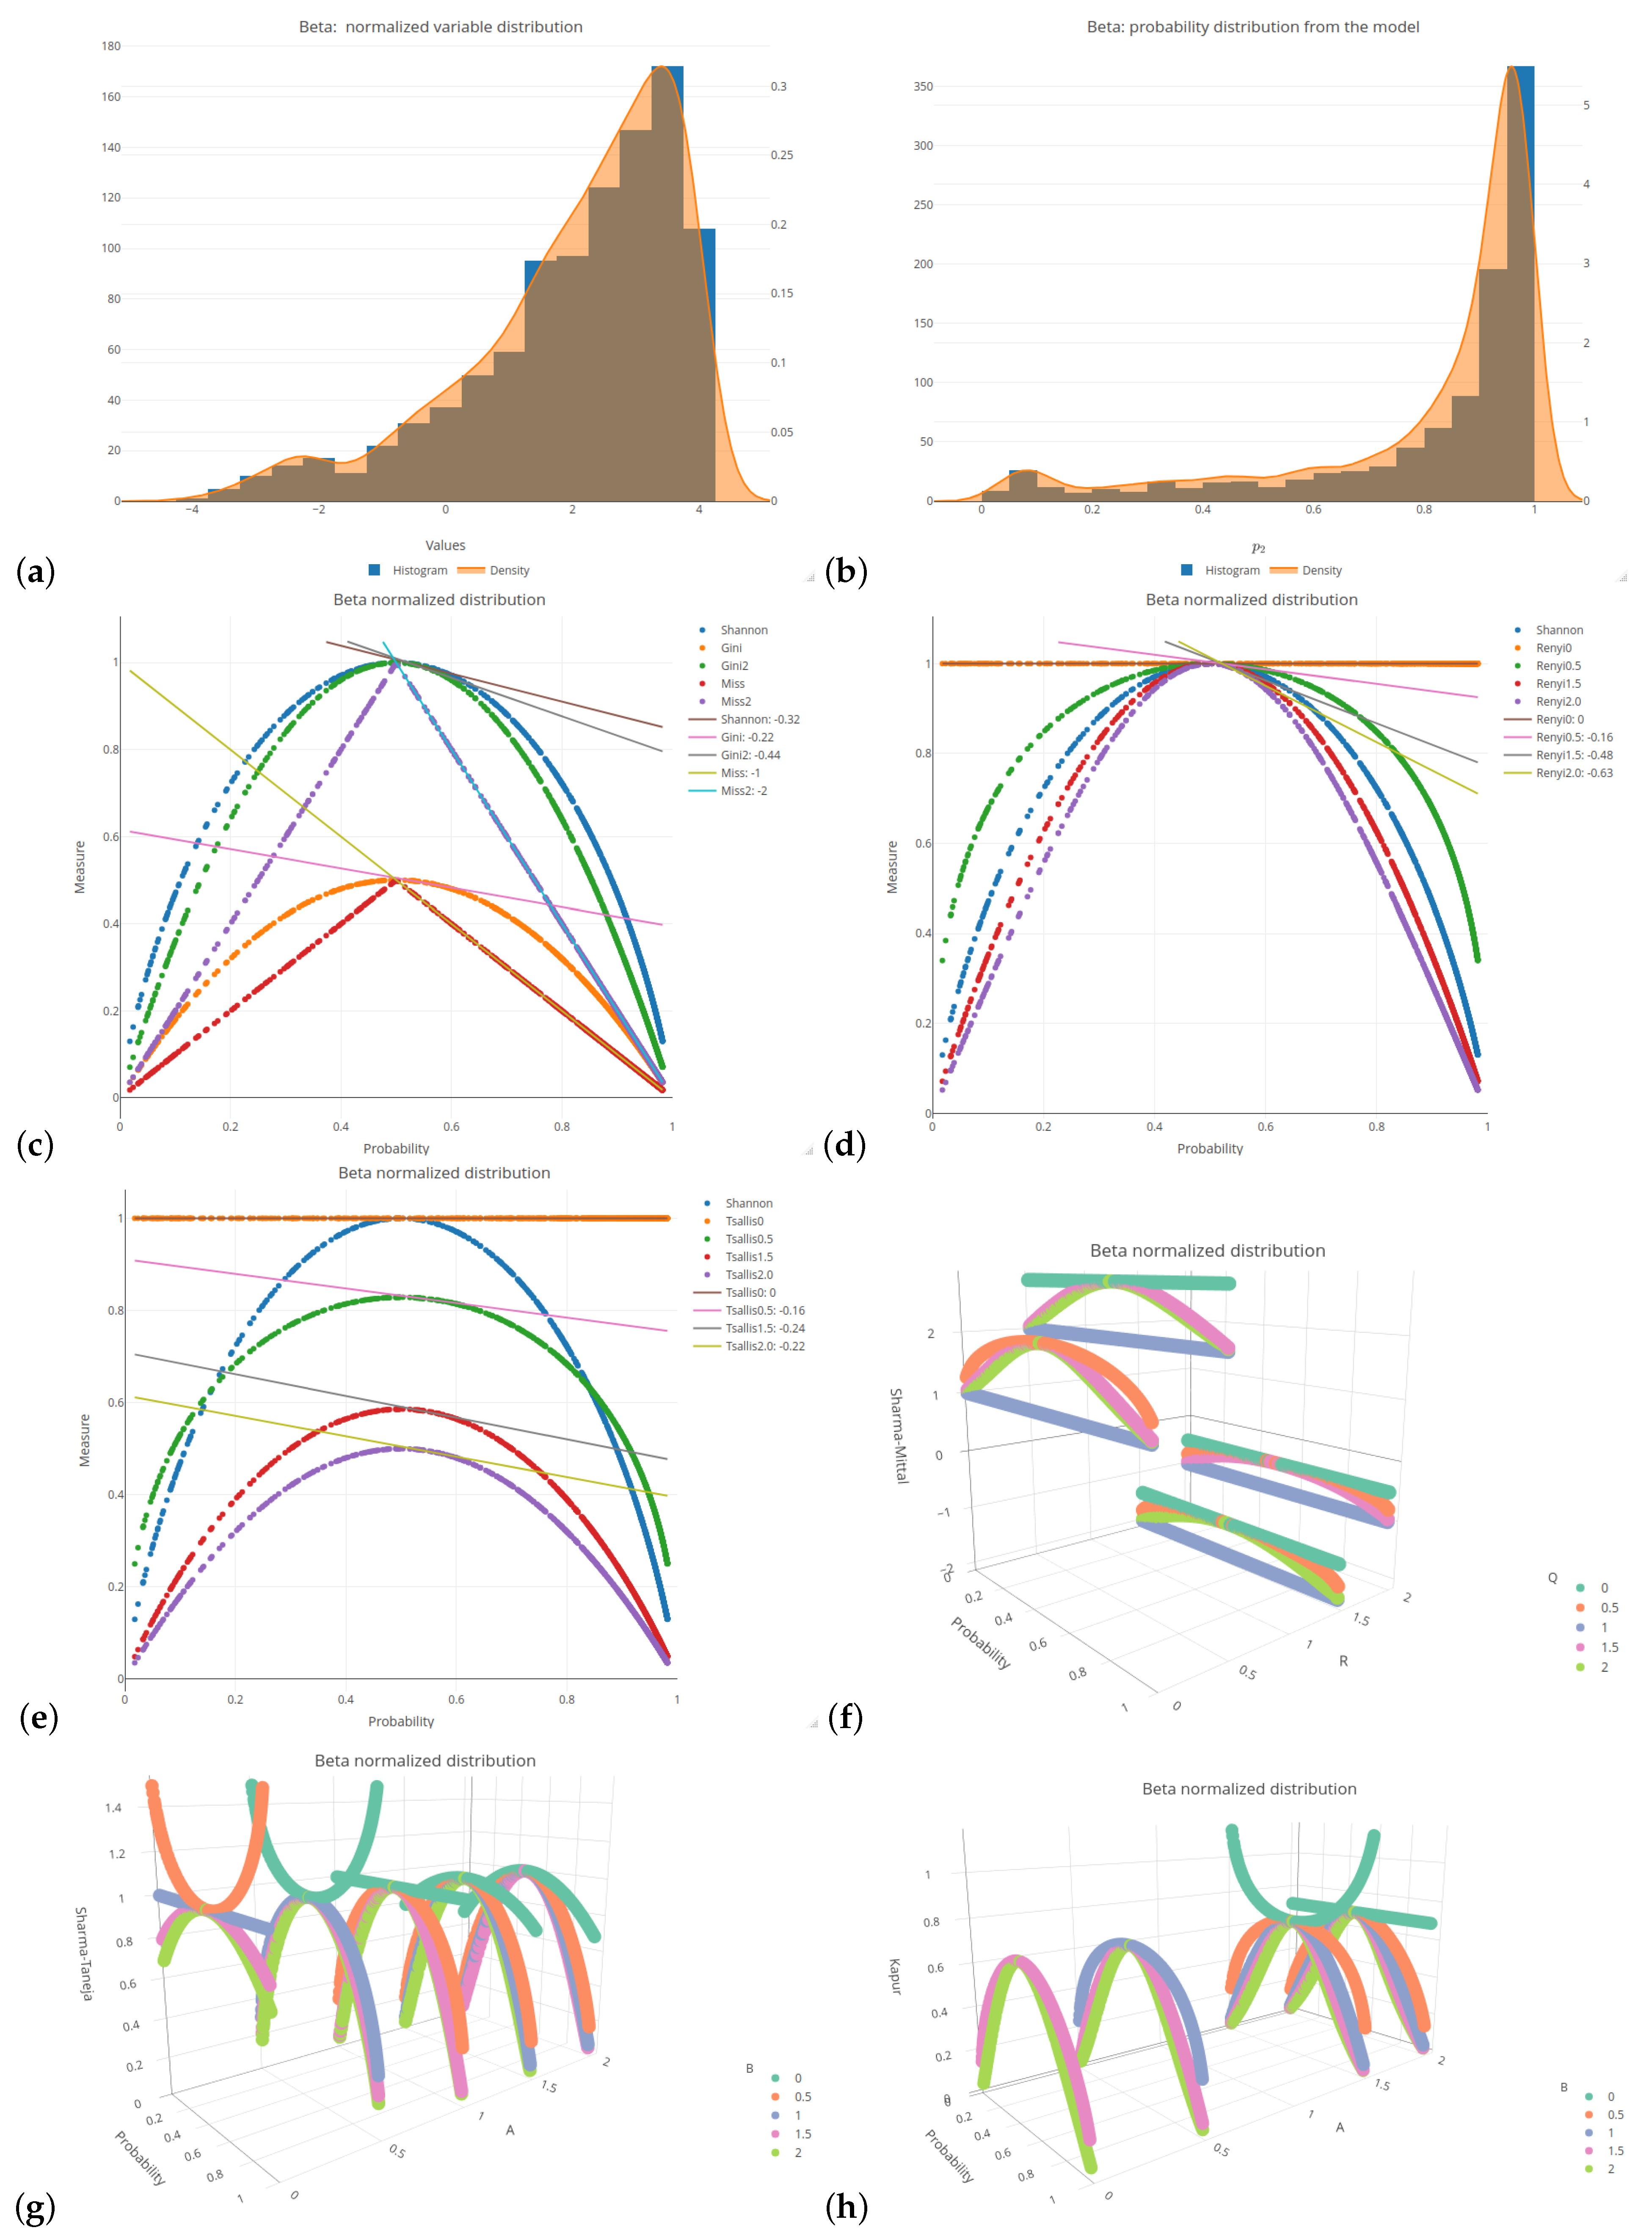
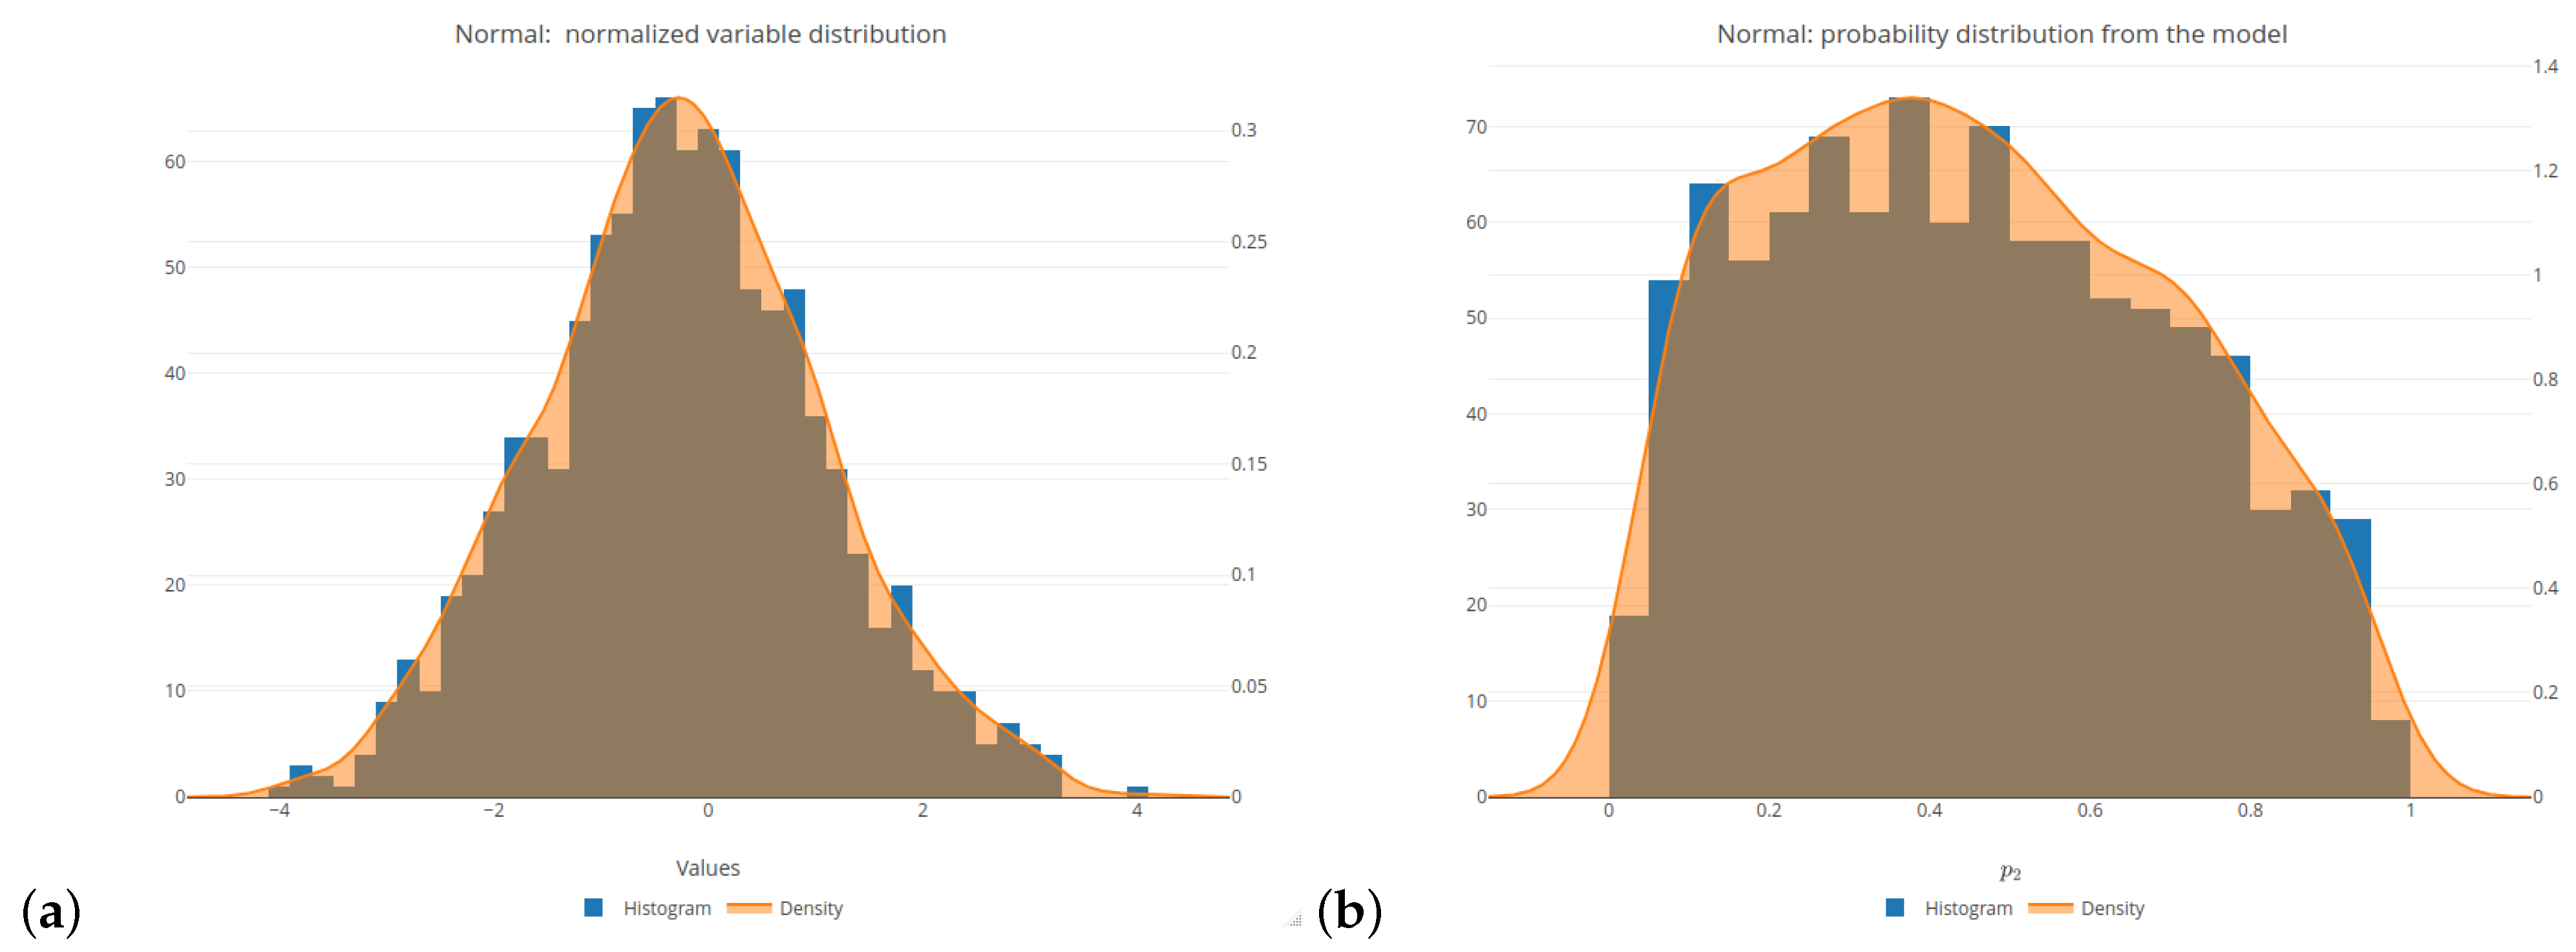
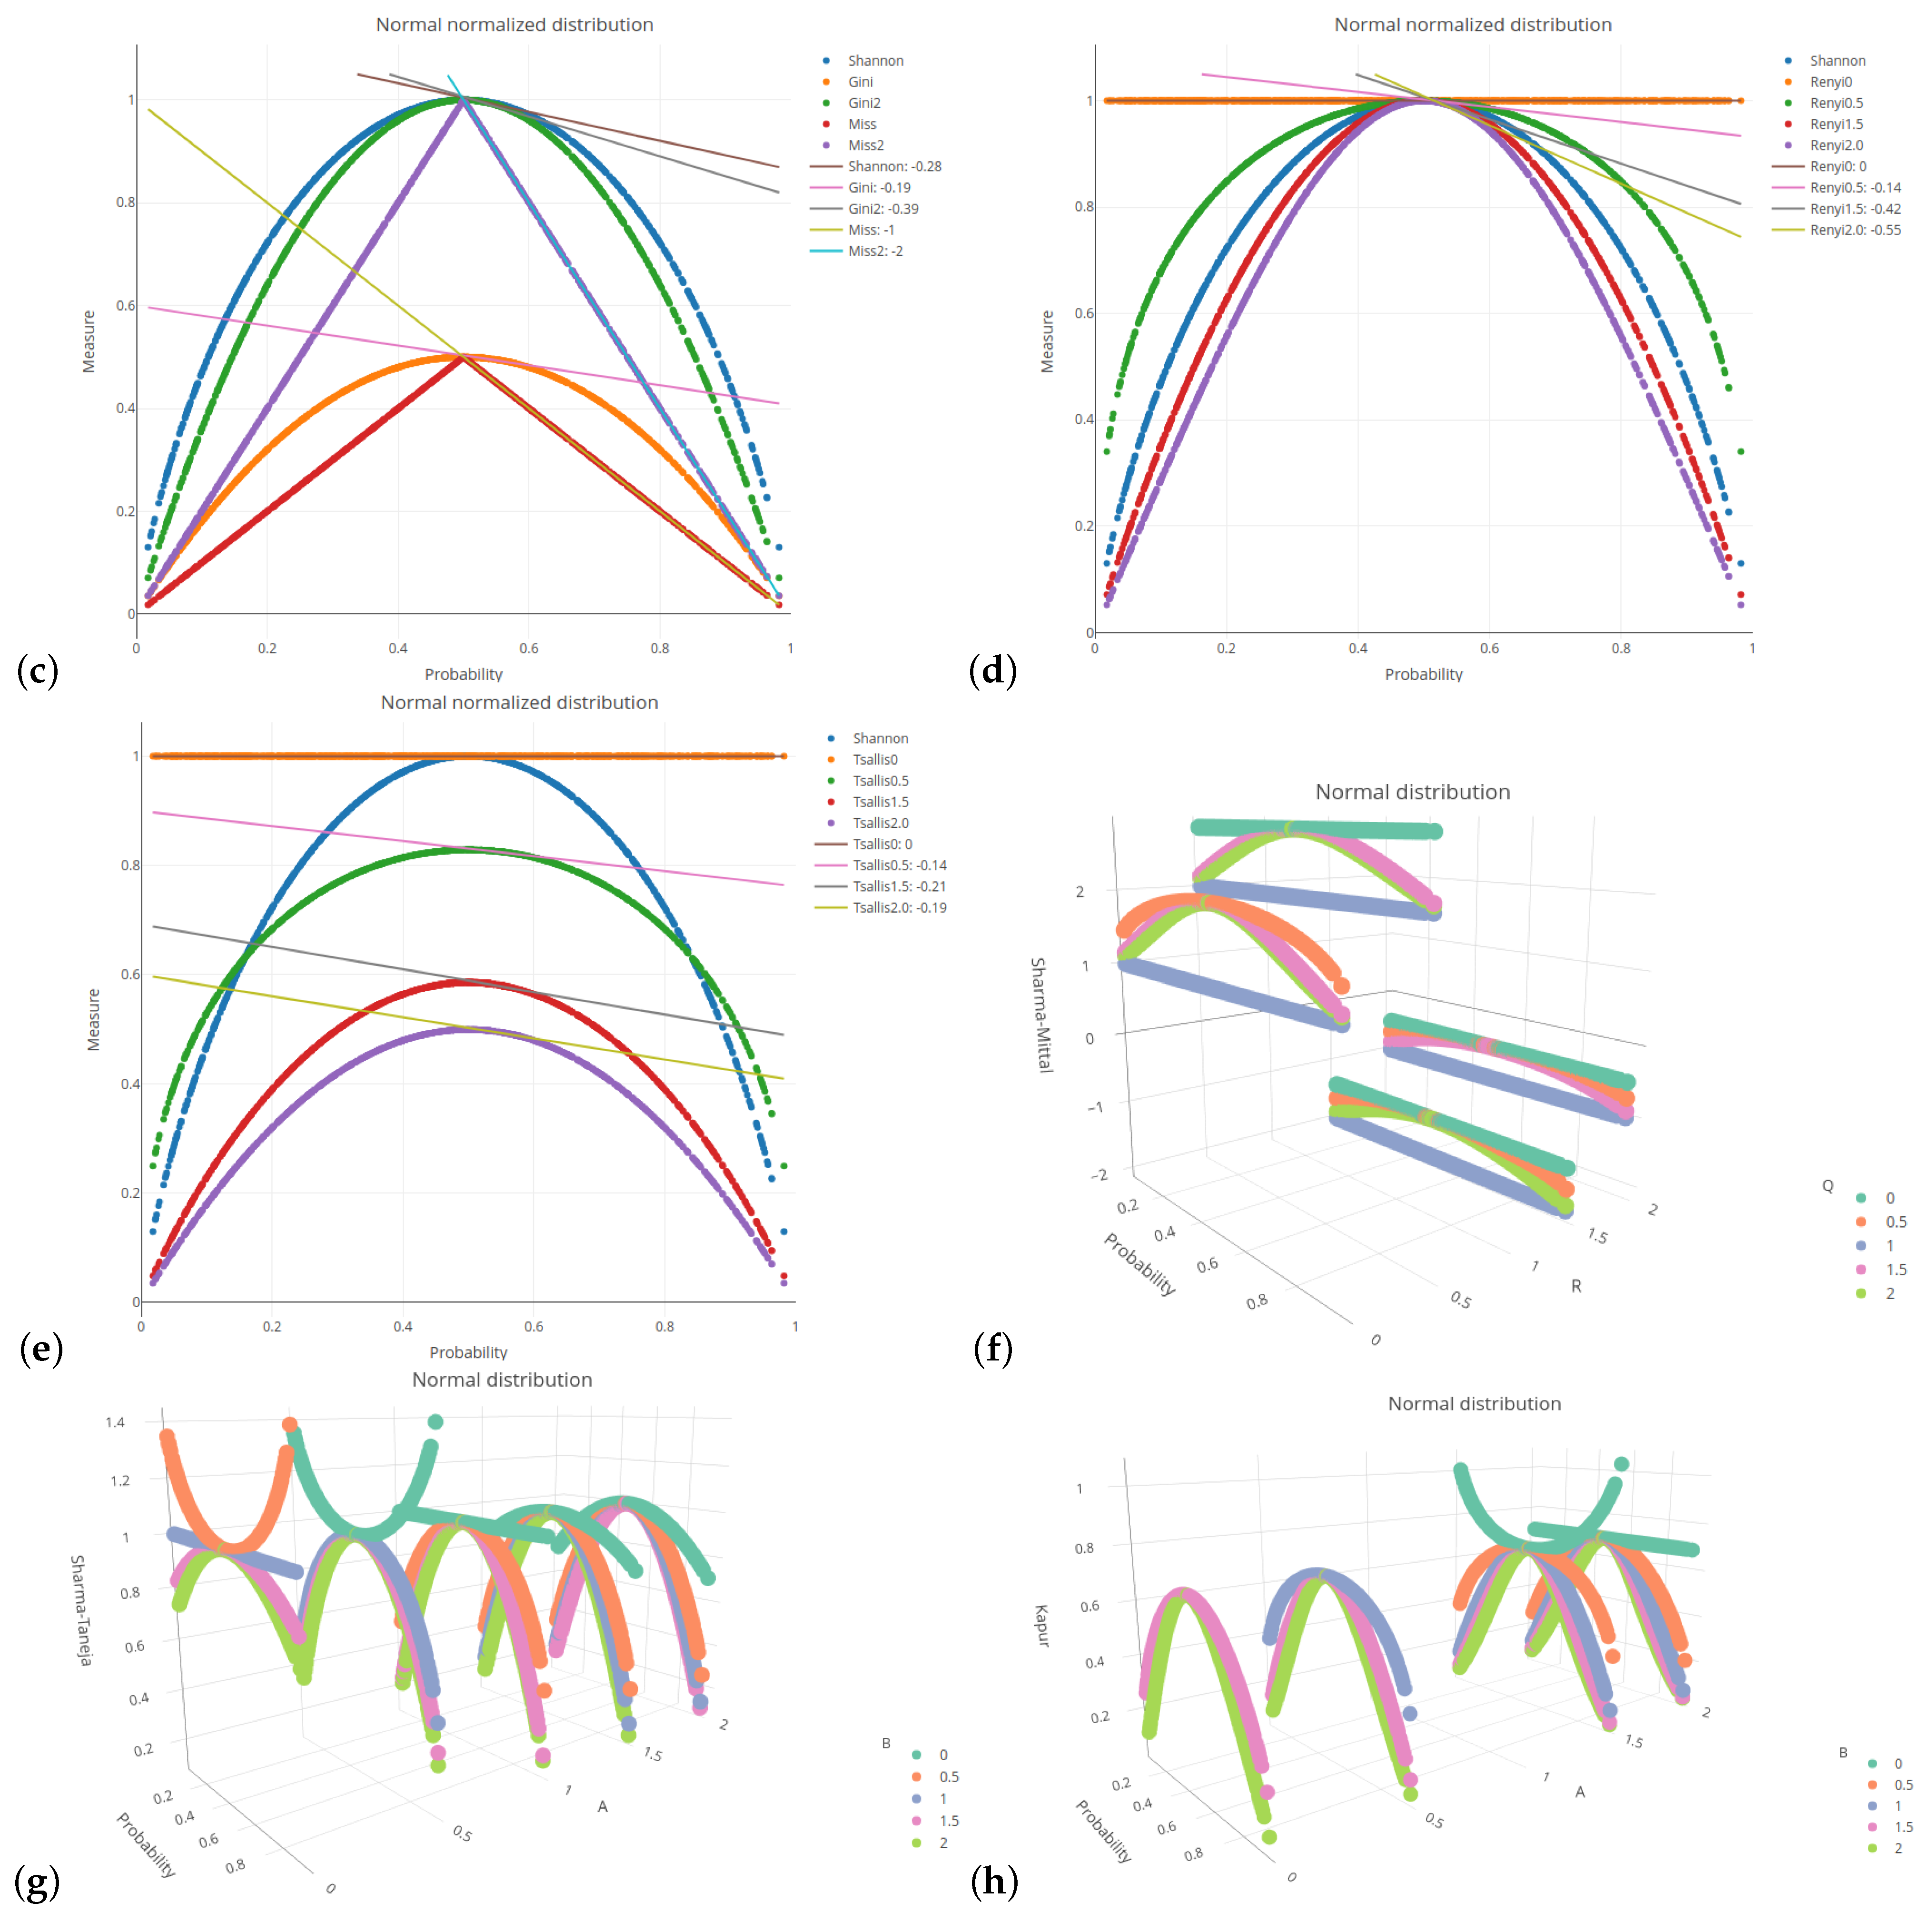
Figure 1 and
Figure A2,
Figure A3,
Figure A4,
Figure A5 and
Figure A6. In order to conduct comparisons between the simulated values, these values have been normalized (see [
47] for comparison).
In the next step of our empirical study, we computed a probability vector for a target variable
. For that purpose, the parametric logistic regression model was used. Thus, the binary responses were obtained from the model of the following form:
where
is a vector of the model parameters (weights), and
stands for a feature matrix. In order to perform simulations using a given model based on an observable matrix
, we computed the dot product
(value of the corresponding linear combination) by applying the inverse
logit function:
As an outcome, we obtain the probability that a given observation belongs to the class of a target variable Y labeled as 2. Consequently, a response (target) variable Y is a Bernoulli random variable with parameter . This variable returns label 1 if or label 2 if . In the corresponding code below, the text labels and are used for return labels 1 and 2, respectively.
A linear combination
refers to the values simulated from the considered (normalized) probability distributions. Subplots (b) of
Figure 1 and
Figure A2,
Figure A3,
Figure A4,
Figure A5 and
Figure A6 depict the distributions of a response variable
Y in the logistic model generated for the selected probability distributions of the explanatory variables. Due to the fact that some of these distributions generate only positive values by default, these variables are normalized as described above, because both positive and negative input values are needed in order to obtain the probability values both from the areas above and below the threshold of
.
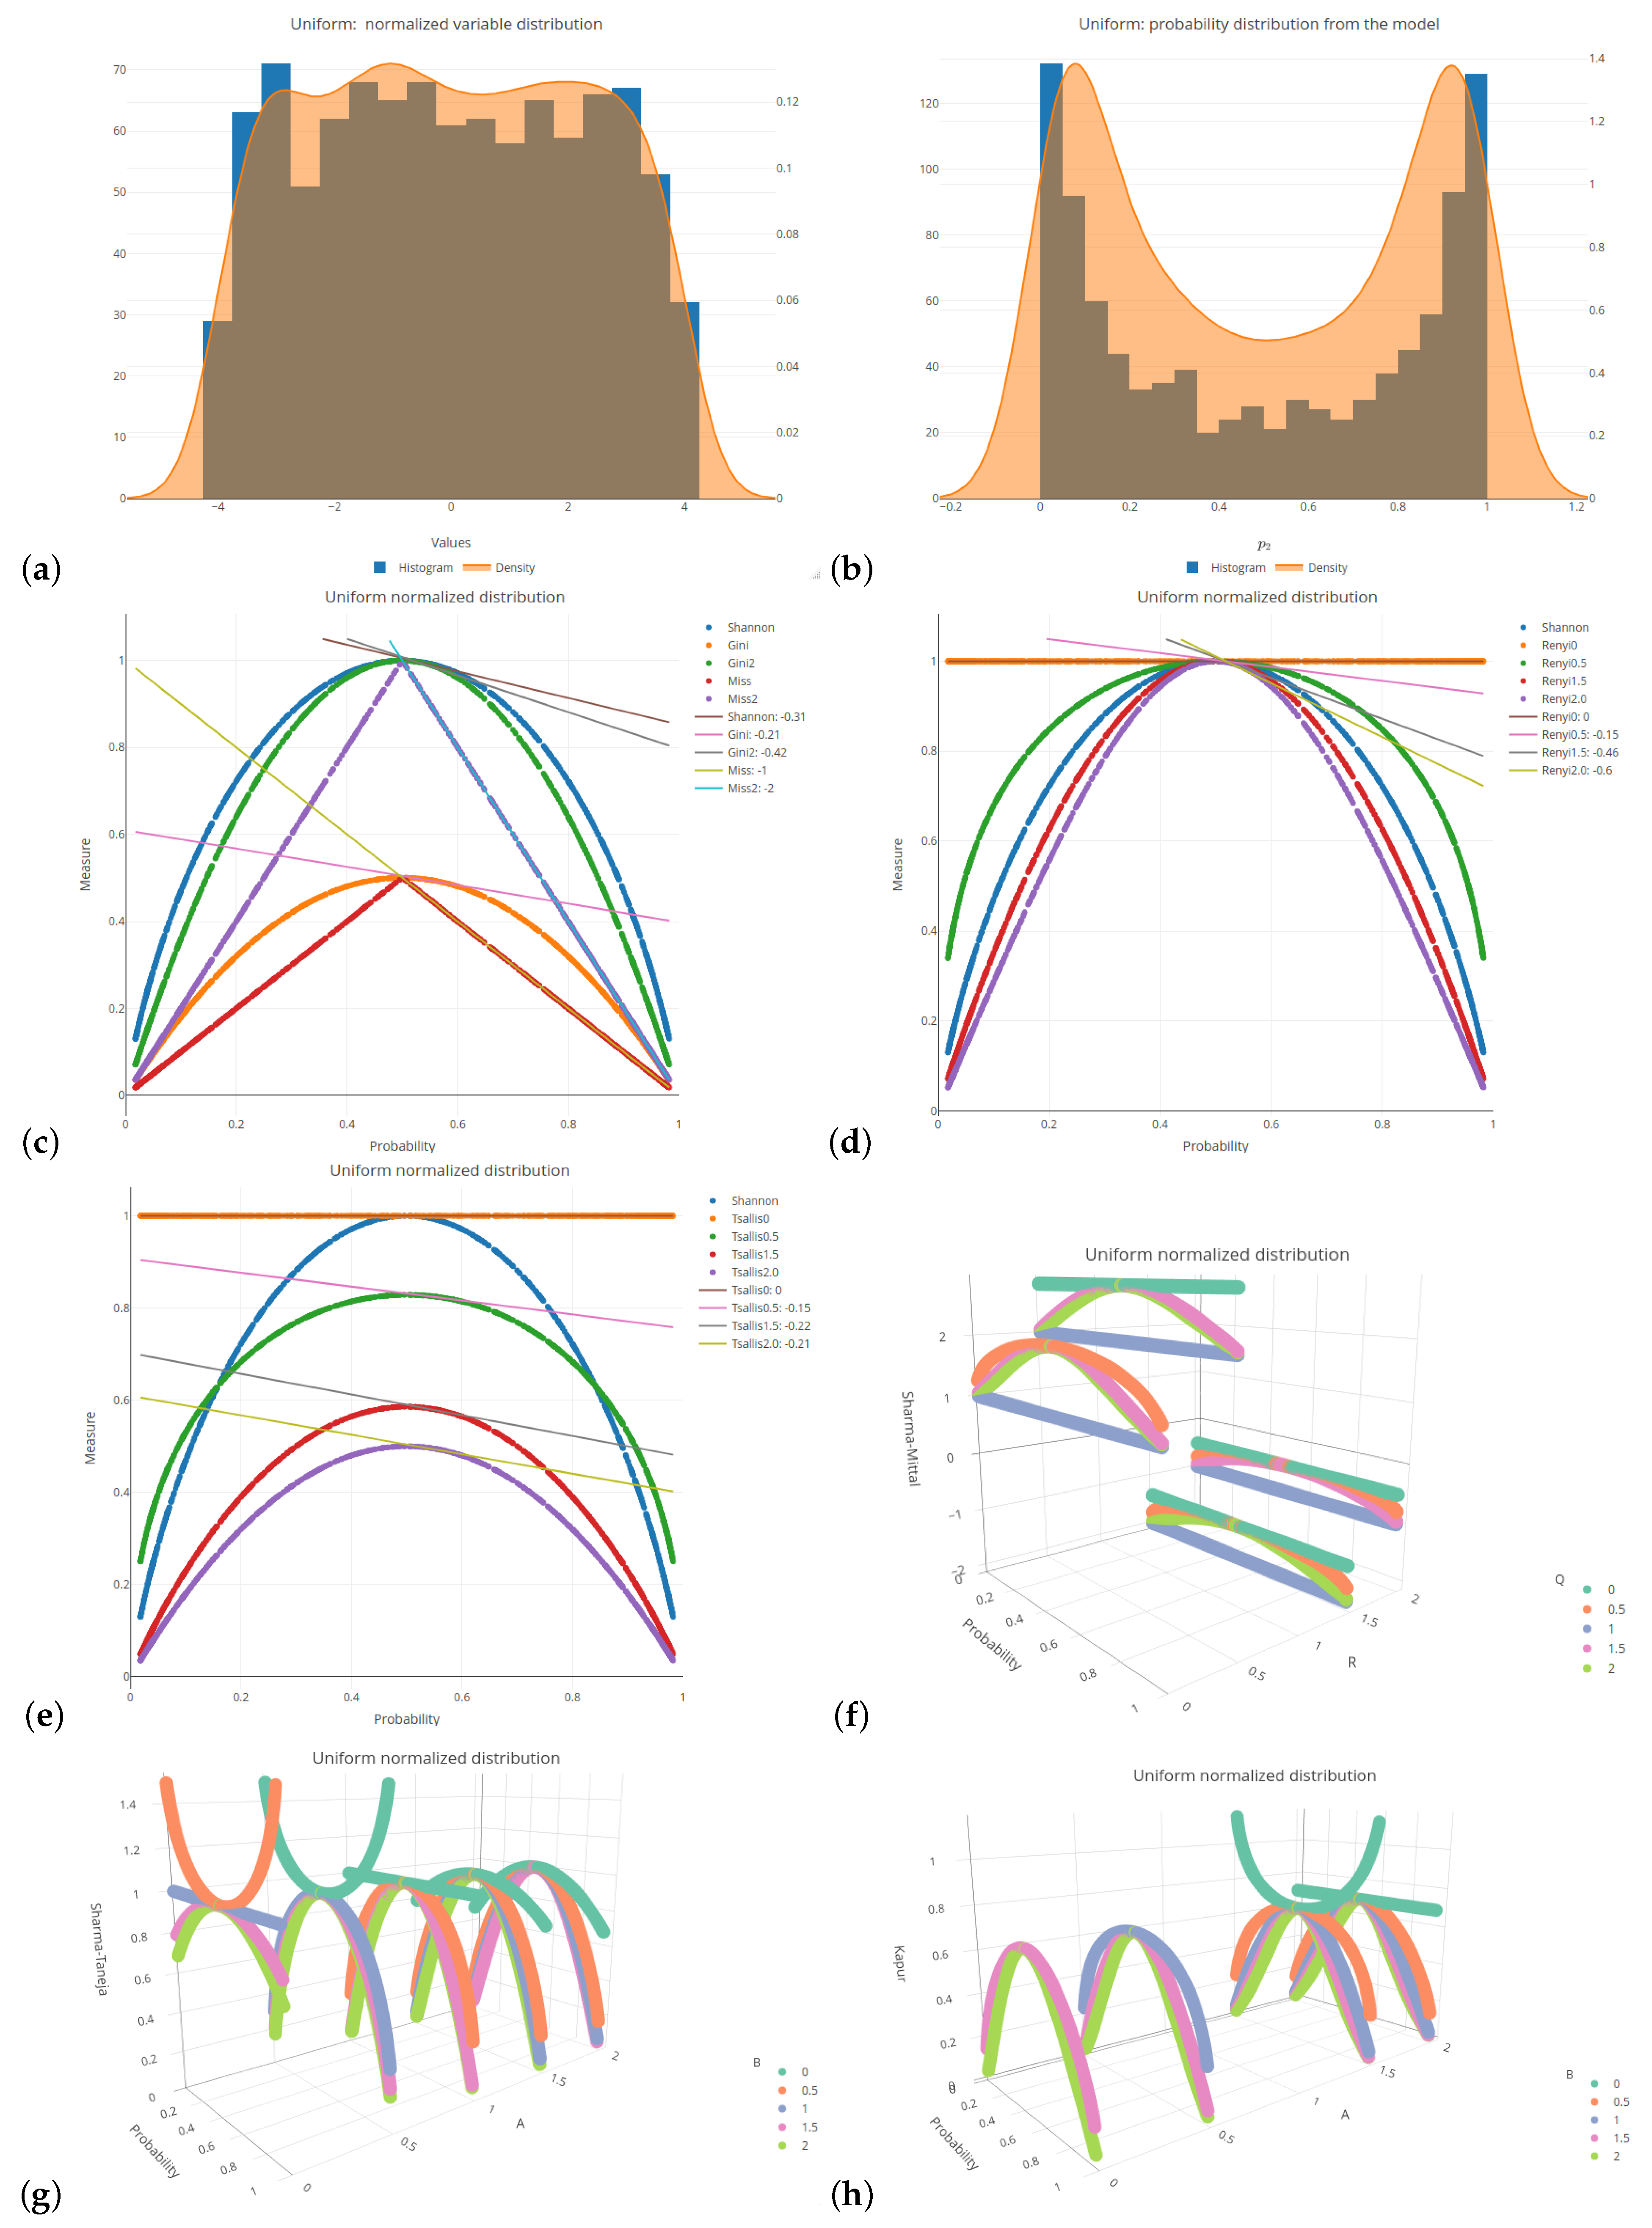
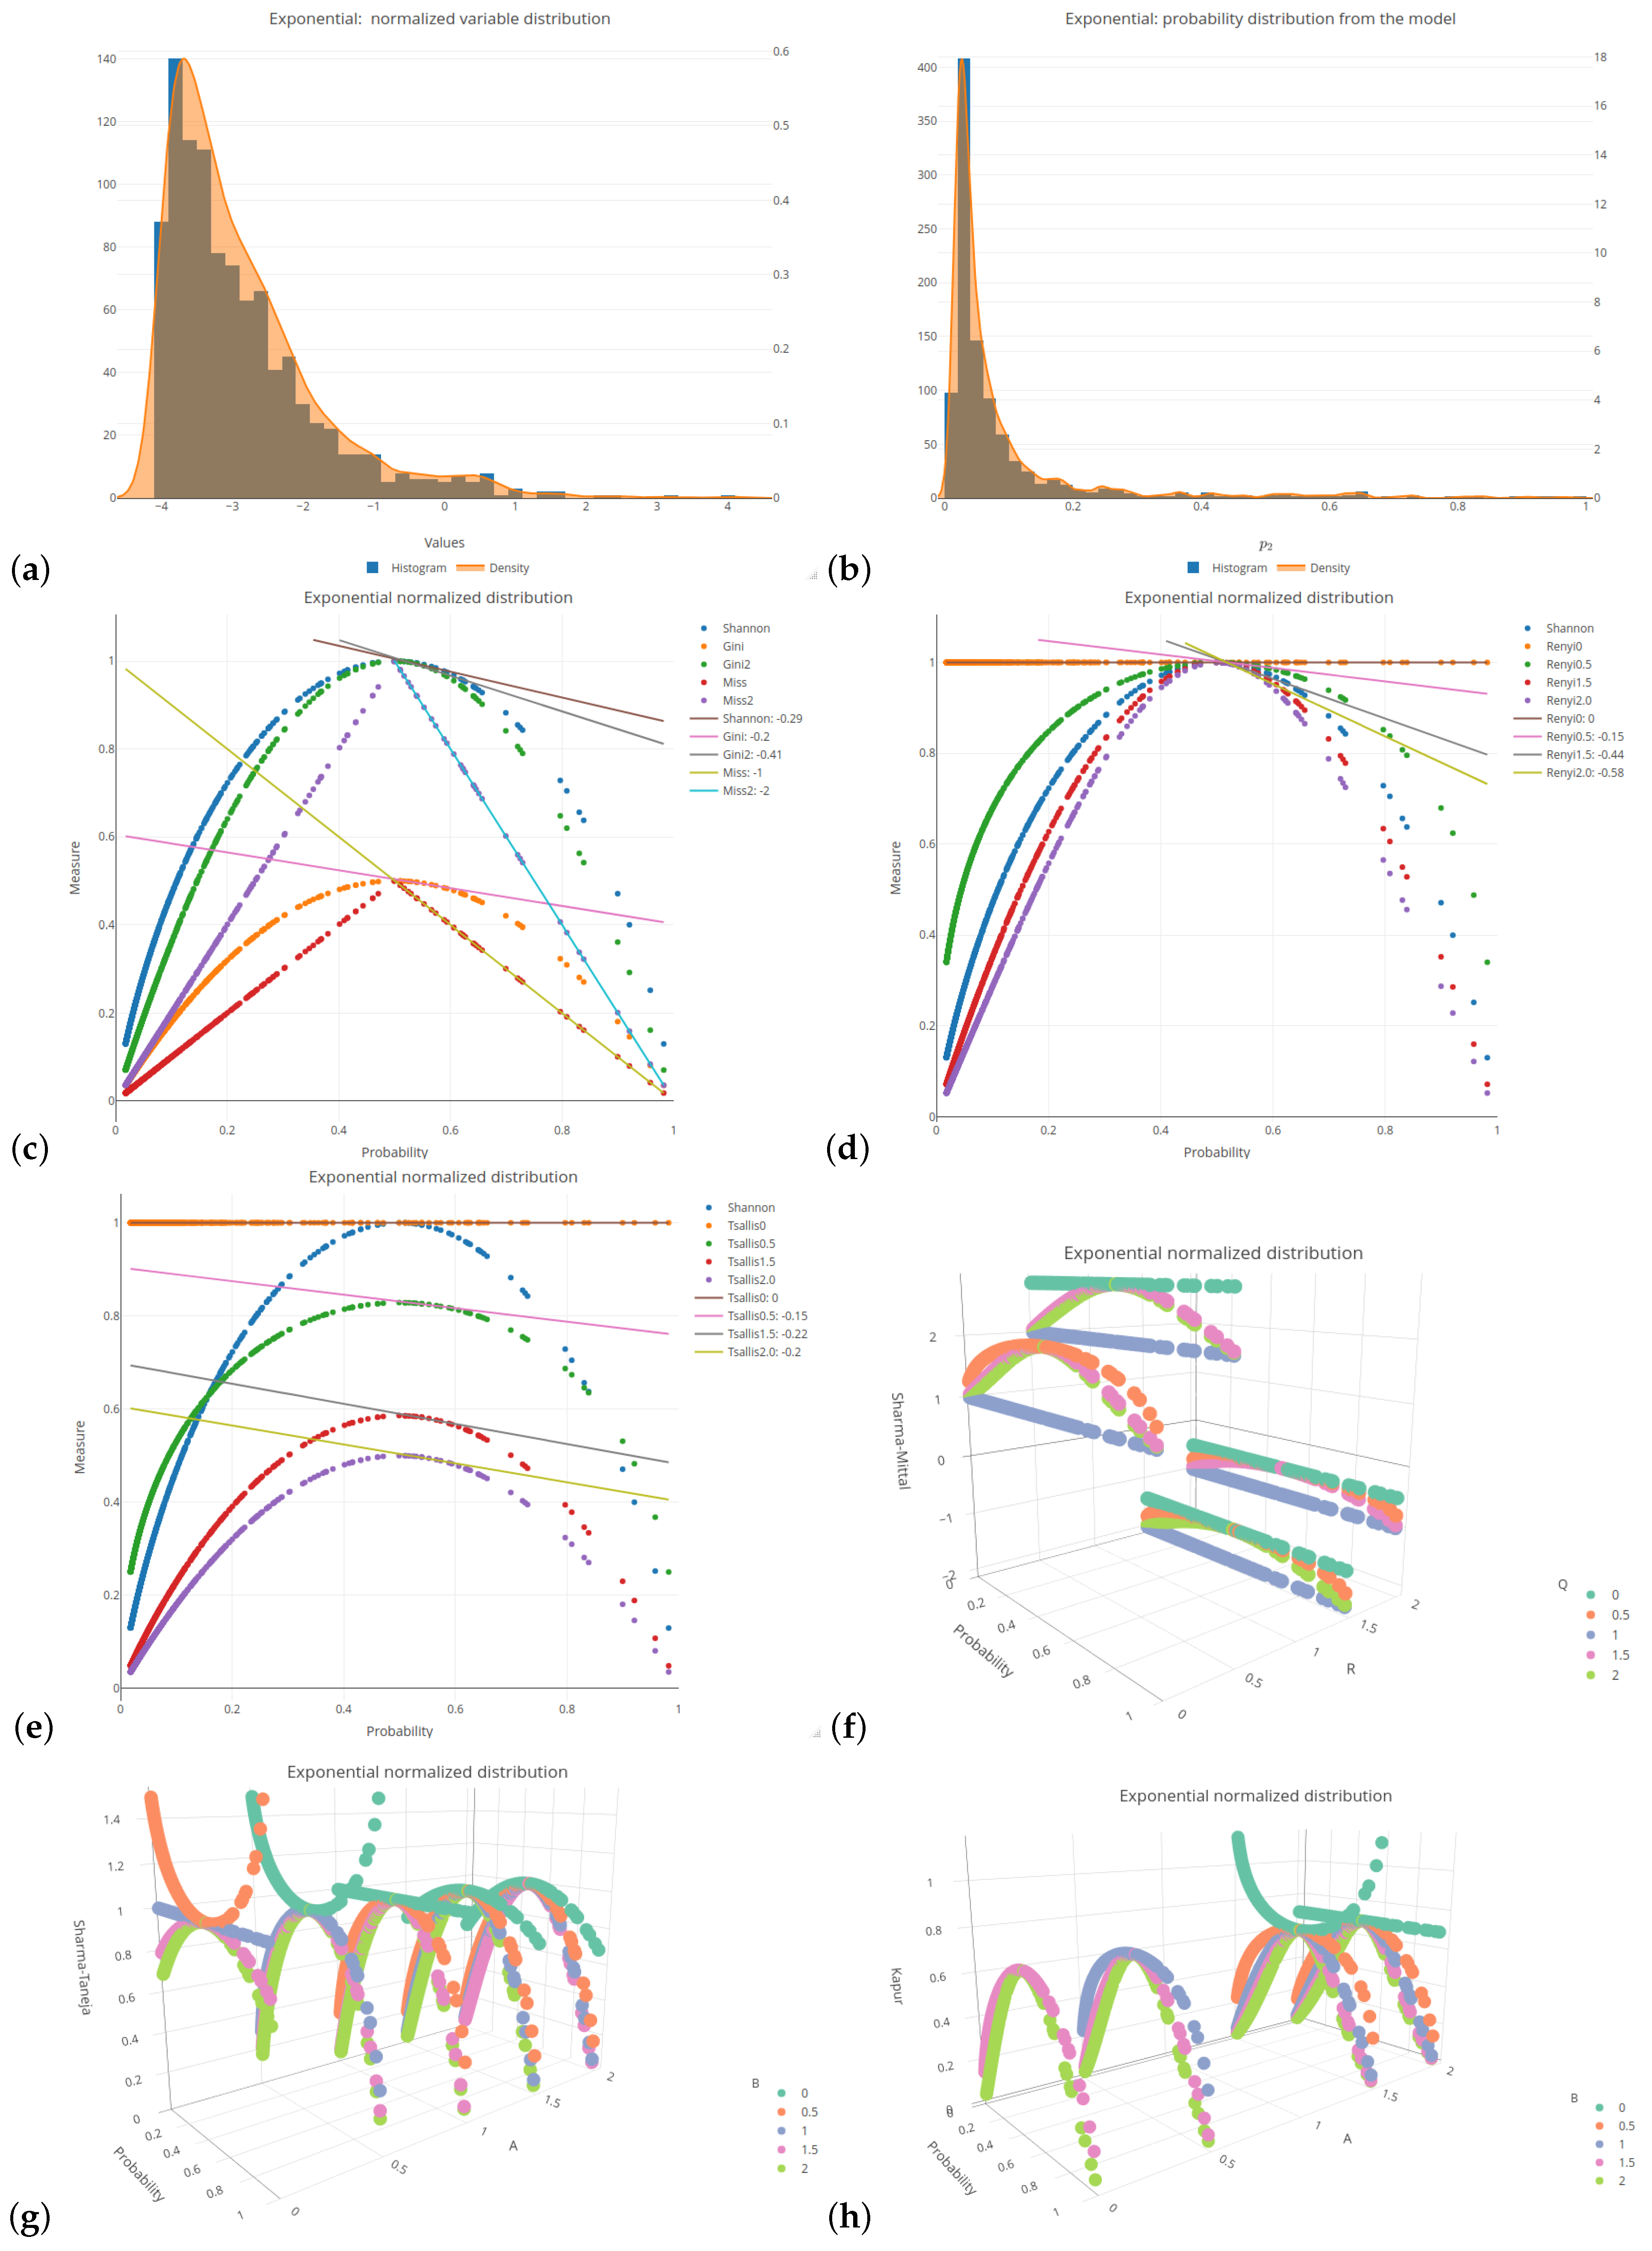
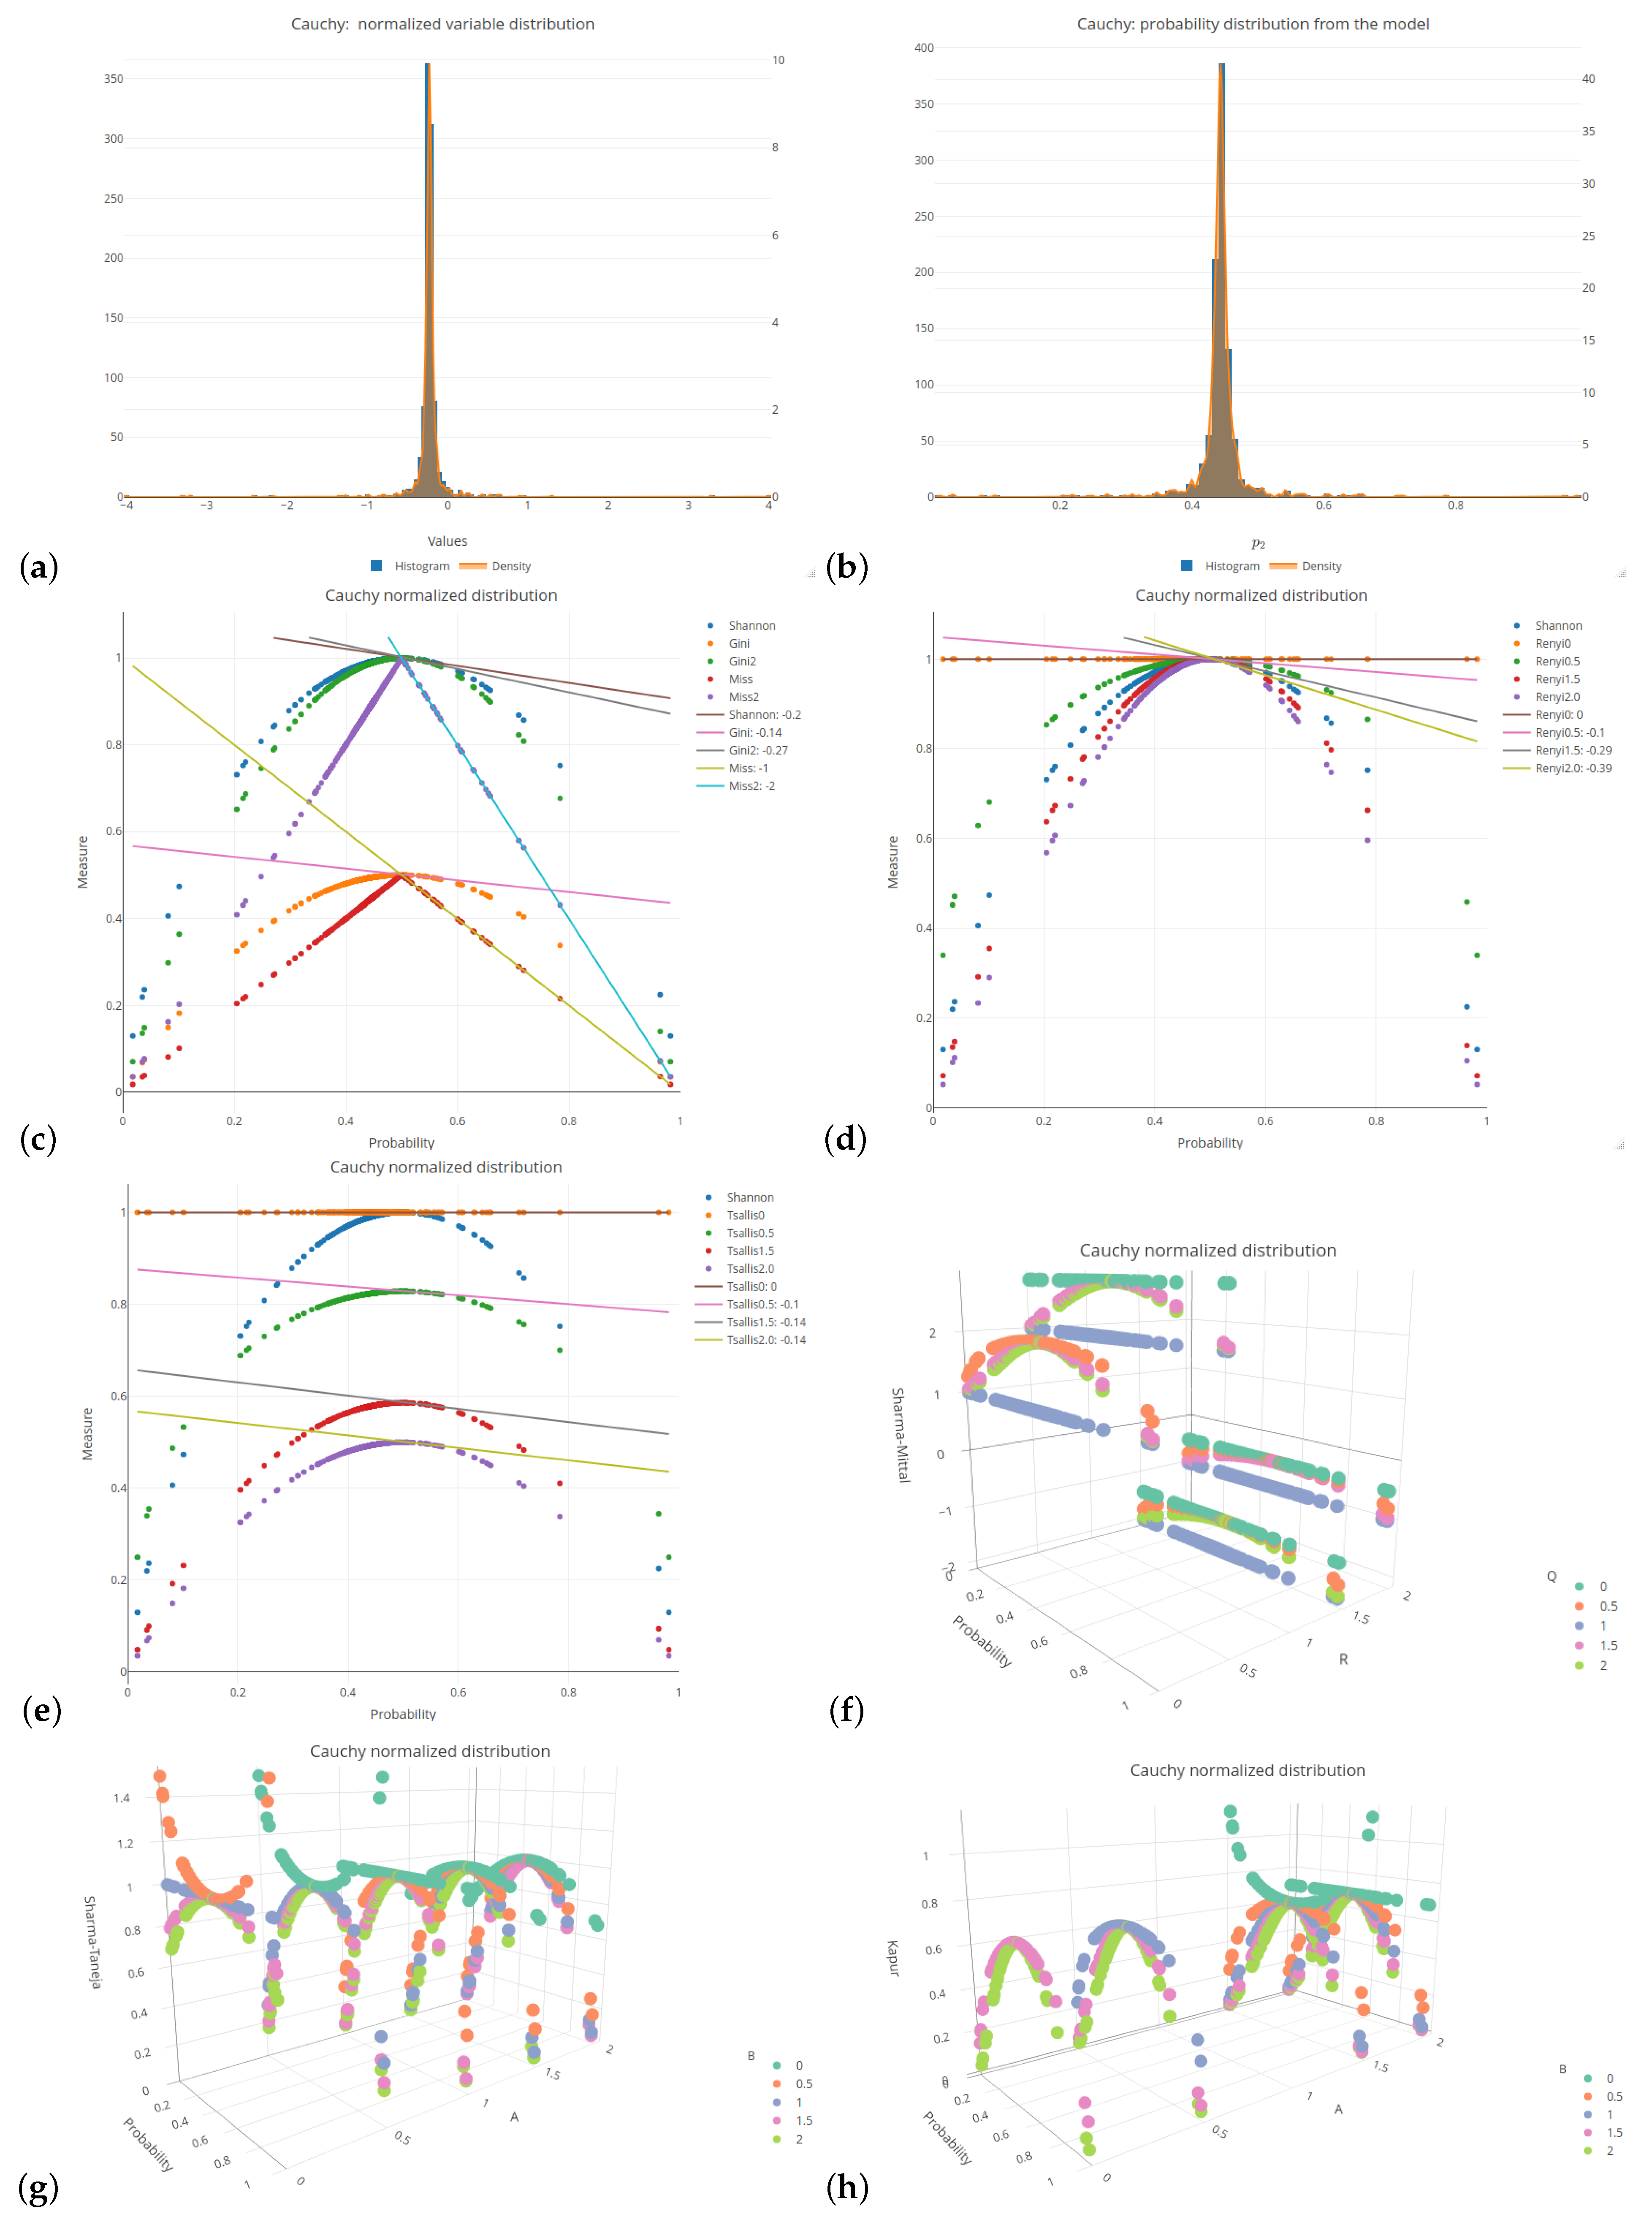
All of the six distributions, selected as the probability distributions of the explanatory variables in our logistic regression model, are presented in the same format (see
Figure 1 and
Figure A2,
Figure A3,
Figure A4,
Figure A5 and
Figure A6). Subplots (a) and (b) of these figures depict a histogram related to the selected distributions of the explanatory variables values and a histogram of the probabilities related to a response (target) variable of the specified logistic model, respectively. Subplots (c)–(h) of the mentioned figures present the values of various impurity (entropy) measures obtained for different sets of parameters. They include the Shannon, Gini, and missclassification (denoted as Miss) measures. In order to compare the Gini and Miss measures with the Shannon measure, the first two measures were properly rescaled (multiplied by 2). The following combinations of parameters were used for the considered entropy measures:
for the Rényi and Tsallis entropies,
and
for the Sharma–Mittal entropy, and
and
for the Sharma–Taneja and Kapur entropies. Note that, due to the conditions imposed on the parameters in the formulas for entropy measures, certain combinations are not allowed. Consequently, they are not displayed in the graphs.
The 2D graphs, showing the values of the selected impurity measures, are included with the added tangent lines at the point of
(see also
Table 2). They illustrate the rate of decline (the regression slope) in the values of the considered measures in the tied or ambiguous situations. This involved estimation of the linear regression for the probability values ranging from
to
. In the case of two-parameter measures, the corresponding slopes are collected in
Table 3,
Table 4 and
Table 5.
Let us consider the most popular probability distribution—the normal distribution. This case is presented in
Figure 1 and
Table 2. The Shannon entropy is depicted in three subfigures, since it is the impurity measure that is commonly present in most of the available software.
Figure 1c shows a faster decline in the Shannon entropy values compared to the Gini measure in the middle part of the graph. This is further indicated by the comparison of the slope values relating to the corresponding lines (
compared to
). The Rényi entropy has a greater slope if the parameter
q increases (see
Figure 1d); after exceeding a value of 1, it is greater than in the Shannon entropy case. In the case of the Tsallis entropy, as shown in
Figure 1e, there is no clear upward or downward trend if we change the value of parameter
q, but the slope of the curve is always smaller than for the Shannon entropy. The Rényi entropy expands and contracts sideways with respect to the Shannon entropy, always maintaining a maximum value of 1, whereas the Tsallis entropy fluctuates in comparison to the Shannon entropy, trough decreasing and increasing its maximum value.
In order to improve visual clarity, the regression curves have not been placed in
Figure 1f–h. Instead of depicting them, slopes of the regression curves are given in
Table 3,
Table 4 and
Table 5. The minus sign indicates a situation where the measure cannot be calculated for a given combination of parameters due to the constraints on the parameter values in Formulas (
15)–(
19). In order to highlight the relationships between the slopes, we introduced the color saturation for individual values. The green color illustrates the highest values, while the red one shows the lowest values. It is important to notice that the terms ‘highest/lowest values’ should be understood as a distance from 0 but not as a tendency towards verticality. No matter what the value of parameter
r is set to in the Sharma–Mittal entropy, setting 1 or 2 as the values of parameter
q will result in constant measurement values (see
teal blue and
royal blue colors in
Figure 1f). This combination cannot be used to train a tree. Changing the parameter values will affect the range of values of this measure, from
to 3 on the vertical axis. The decision tree learning algorithm aims to find a partition that minimizes the impurity as much as possible. This is particularly important at the edges of the graph where the probability values are 0 and 1. Consequently, there are certain combinations of parameters for the Sharma–Taneja entropy that should be avoided, even though the theory does not explicitly prohibit them. This is depicted by the two parabolas in the top-left corner of
Figure 1g, with values that increase as the classification quality improves. A similar trend can be observed in the last
Figure 1h, illustrating the Kapur entropy. When looking at the 3D graphs related to the last three entropies, it is evident that if parameter
q or parameter
increase, then the corresponding curves are pulled inward, which results in steeper tangents. The graphs for the remaining five distributions can be found in
Appendix A.
Let us now delve into a more detailed discussion of the results presented in
Table 2,
Table 3,
Table 4 and
Table 5. In
Table 2, the extreme values of 0 and
have been excluded from the color scale in order to better capture small differences between the slope values. In the columns, the distributions of the variables are arranged based on the observed trend in the slope coefficient from the highest to the lowest values. The Cauchy distribution generates the most horizontal regression line with the largest slope, creating a greater distance between its values and the other distributions, compared to the other distributions. On the right-hand side of
Table 2, there are two beta distributions (one two-modal and one right-skewed) that produce the most vertical slope angles. Regardless of the impurity measure (and its parameter), the minimum value is approximately 62% of the maximum value, e.g., for the Shannon entropy, it equals
. The distribution ordering (in rows) remains the same as before for the other three tables (
Table 3,
Table 4 and
Table 5), i.e., we observe the same dependencies. For the Sharma–Mittal entropy, the smallest values are grouped in the upper-right corner of
Table 3. The slope increases if the parameter
r decreases and the parameter
q increases. For the Sharma–Taneja entropy, the symmetry of slope with respect to the diagonal is seen in
Table 4—the slope value decreases if both parameters increase. A similar trend to that of the Sharma–Taneja measure is observed in the case of the Kapur entropy (see
Table 5).
6.2. Sensitivity Analysis of Entropy Parameters
In order to simulate the datasets according to the formulas in (
30) and (
31) and the commands from Listing 2, the following simple linear combination was created avoid increasing or decreasing impacts of a single variable:
where, for a given
l,
is an empirical realization (observation) of a feature
from a random vector space
for a given probability distribution. The same weight 1 is assigned to each variable, i.e., the regression coefficient for each variable is determined as 1. The formed linear combination, which is the input of our model, resulted in the selection of 31% observations with a label of
and 69% observations with a label of
(see Listing 2).
| Listing 2. Code for an assignment of the return labels of a target variable Y. |
![Entropy 26 01020 i002]() |
In order to examine the behavior of the obtained results, we conducted a sensitivity analysis of an algorithm with respect to the input parameter values. For each algorithm combination run, we considered different values of the input parameters. The following combinations of the entropy parameters were used: for the Rényi and Tsallis entropies,
q ranged from 0 to 5, with a step of
; for the Sharma–Mittal entropy,
q and
r ranged from 0 to 5, with a step of
; and for the Sharma–Taneja and Kapur entropies,
and
ranged from 0 to 5, with a step of
. As mentioned earlier, some parameter combinations were not allowed. The hyper-parameters for an algorithm were set as follows: the minimum number of observations that must exist in a leaf
, i.e., 1%, 5%, and 10% of the observations in the dataset; the depth of the tree
. The overfitting method
leafcut was set as in [
15,
17]. The simulation was performed in a five-fold validation regime with a predefined seed of the random number generator. According to the ratio
, where
k is the number of folds, each training sample consisted of 80% of the total number of observations, while the remaining 20% formed the validation sample.
The number of different combinations of input parameters is 5796. Each combination was additionally checked on five cross-validation partitions, which gives a total of 28,980 algorithm runs.
In order to ensure the consistency and clarity of our work’s argumentation, we have included partial results based on the fixed input hyper-parameters of the algorithm. The detailed results can be replicated and viewed using the provided source code (
https://github.com/KrzyGajow/entropyMeasures/blob/main/Entropy.R, accessed on 14 October 2024).
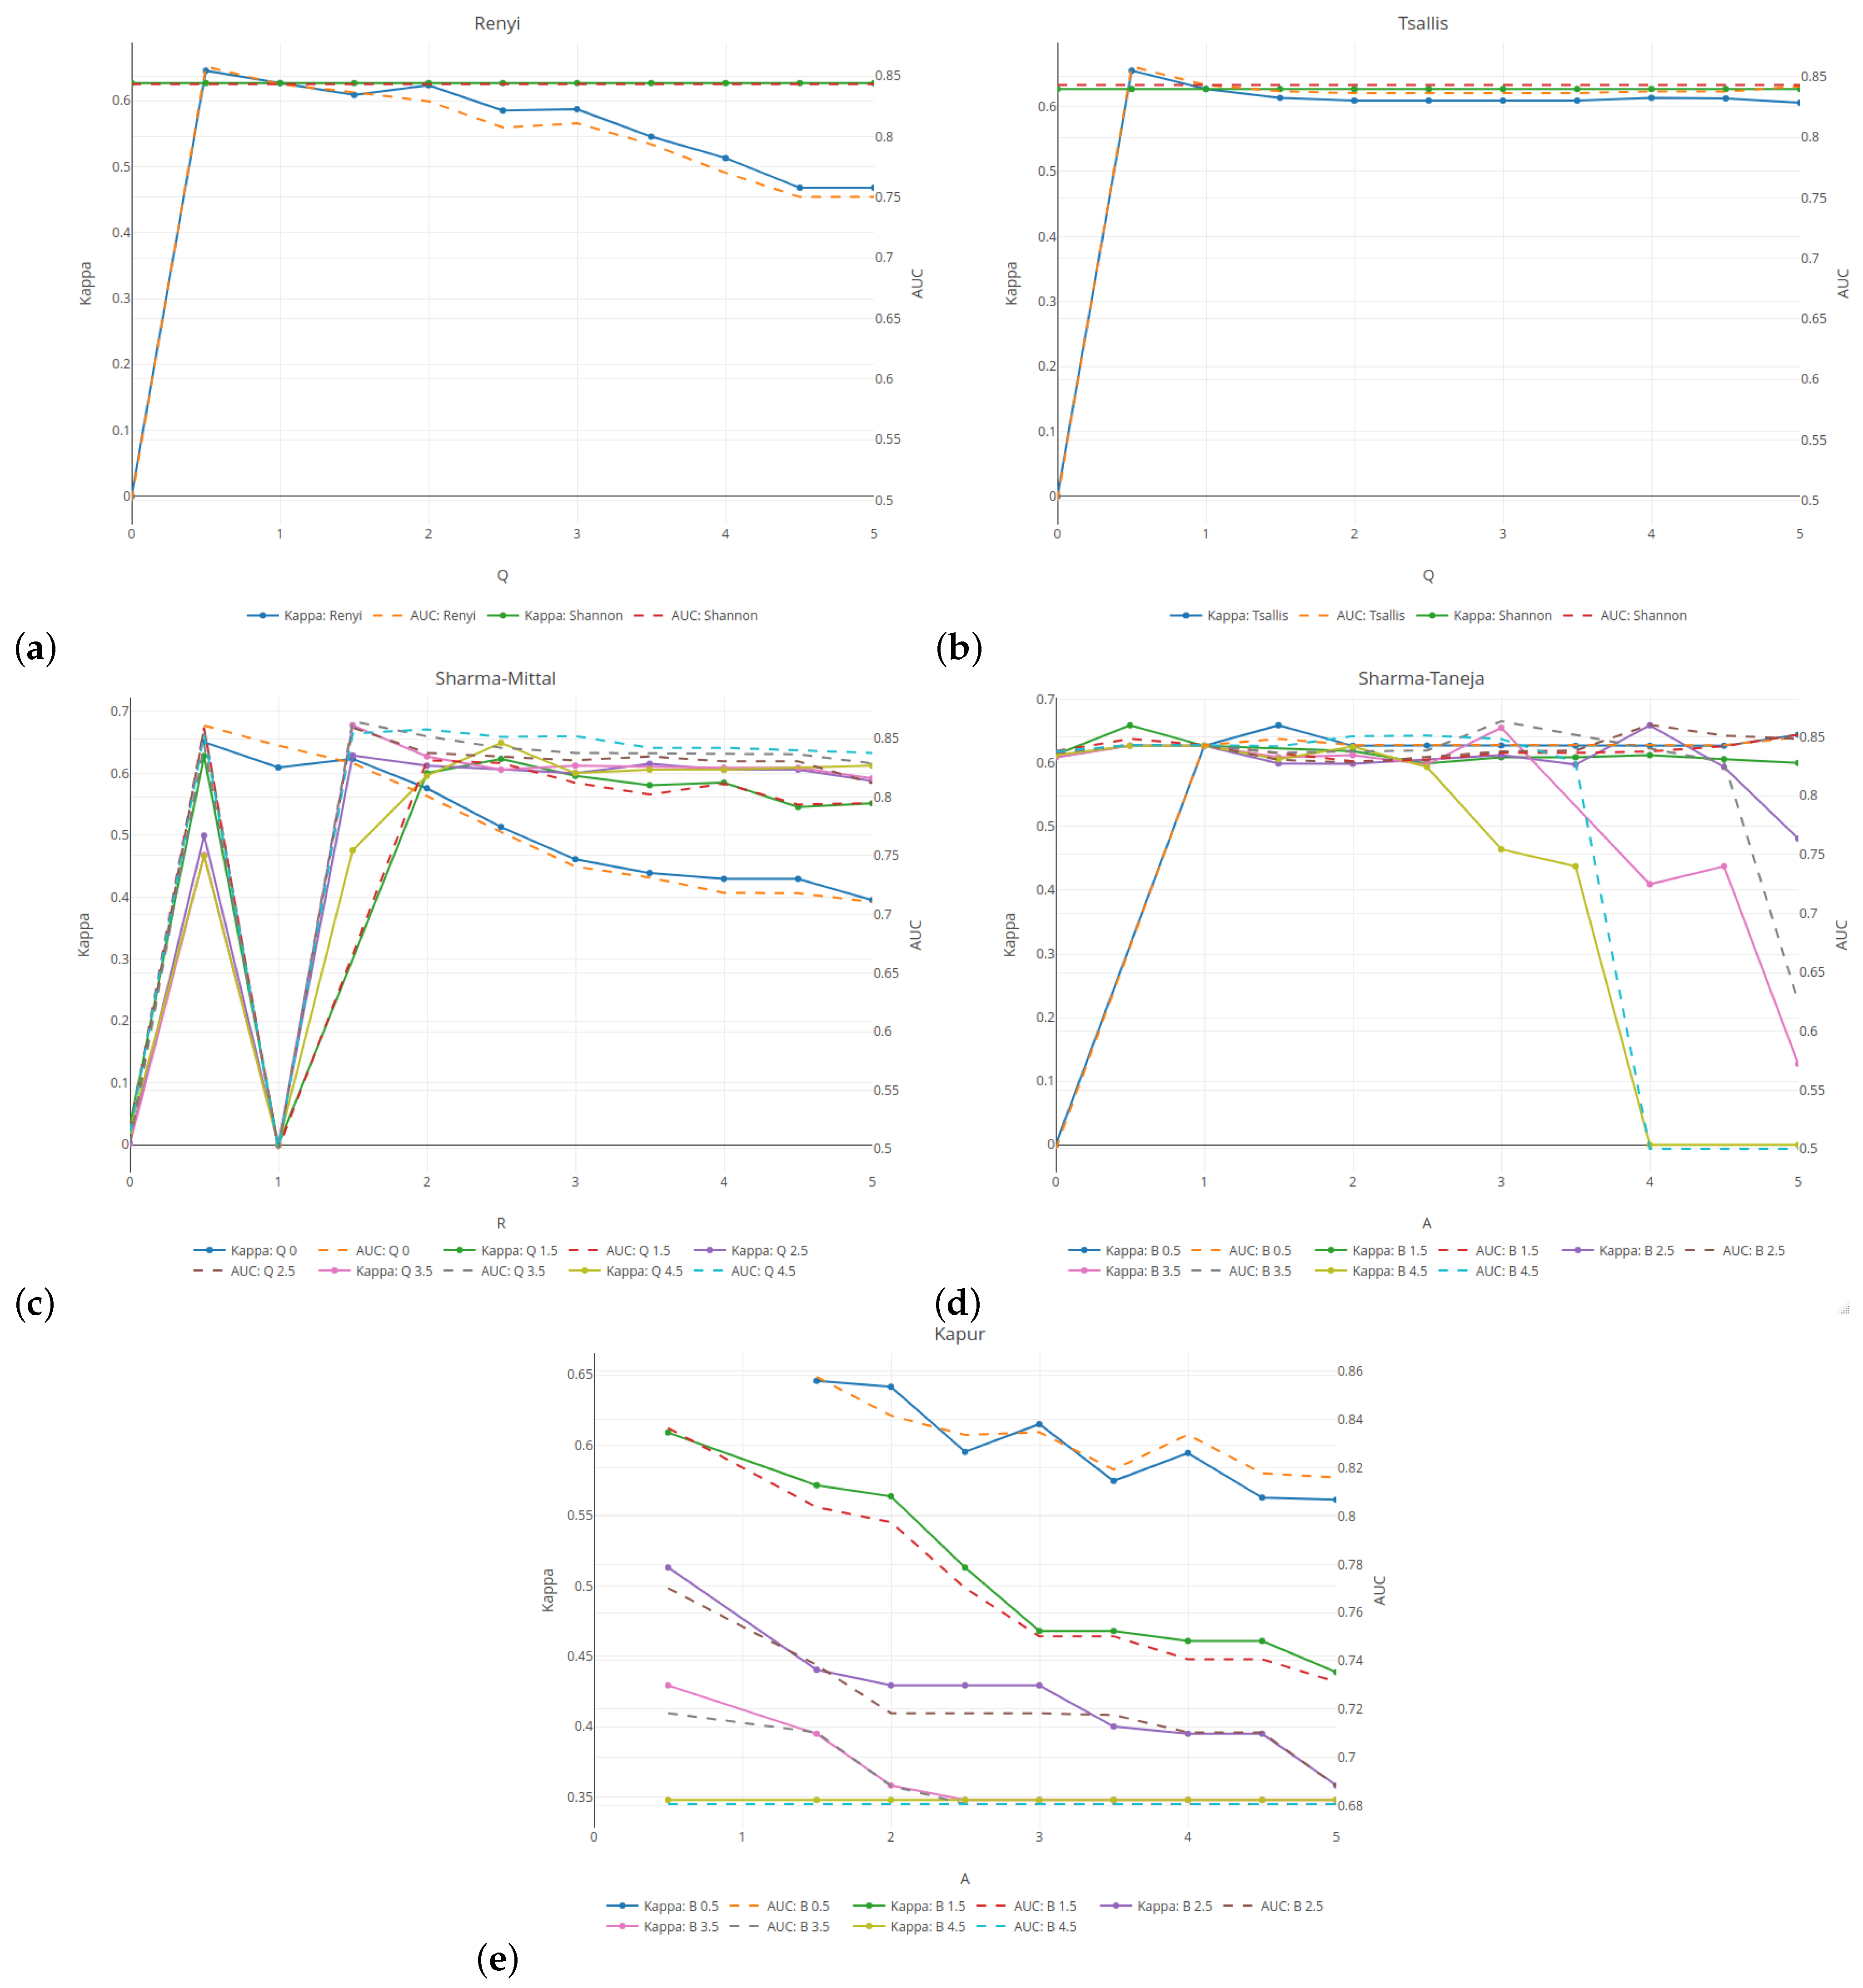
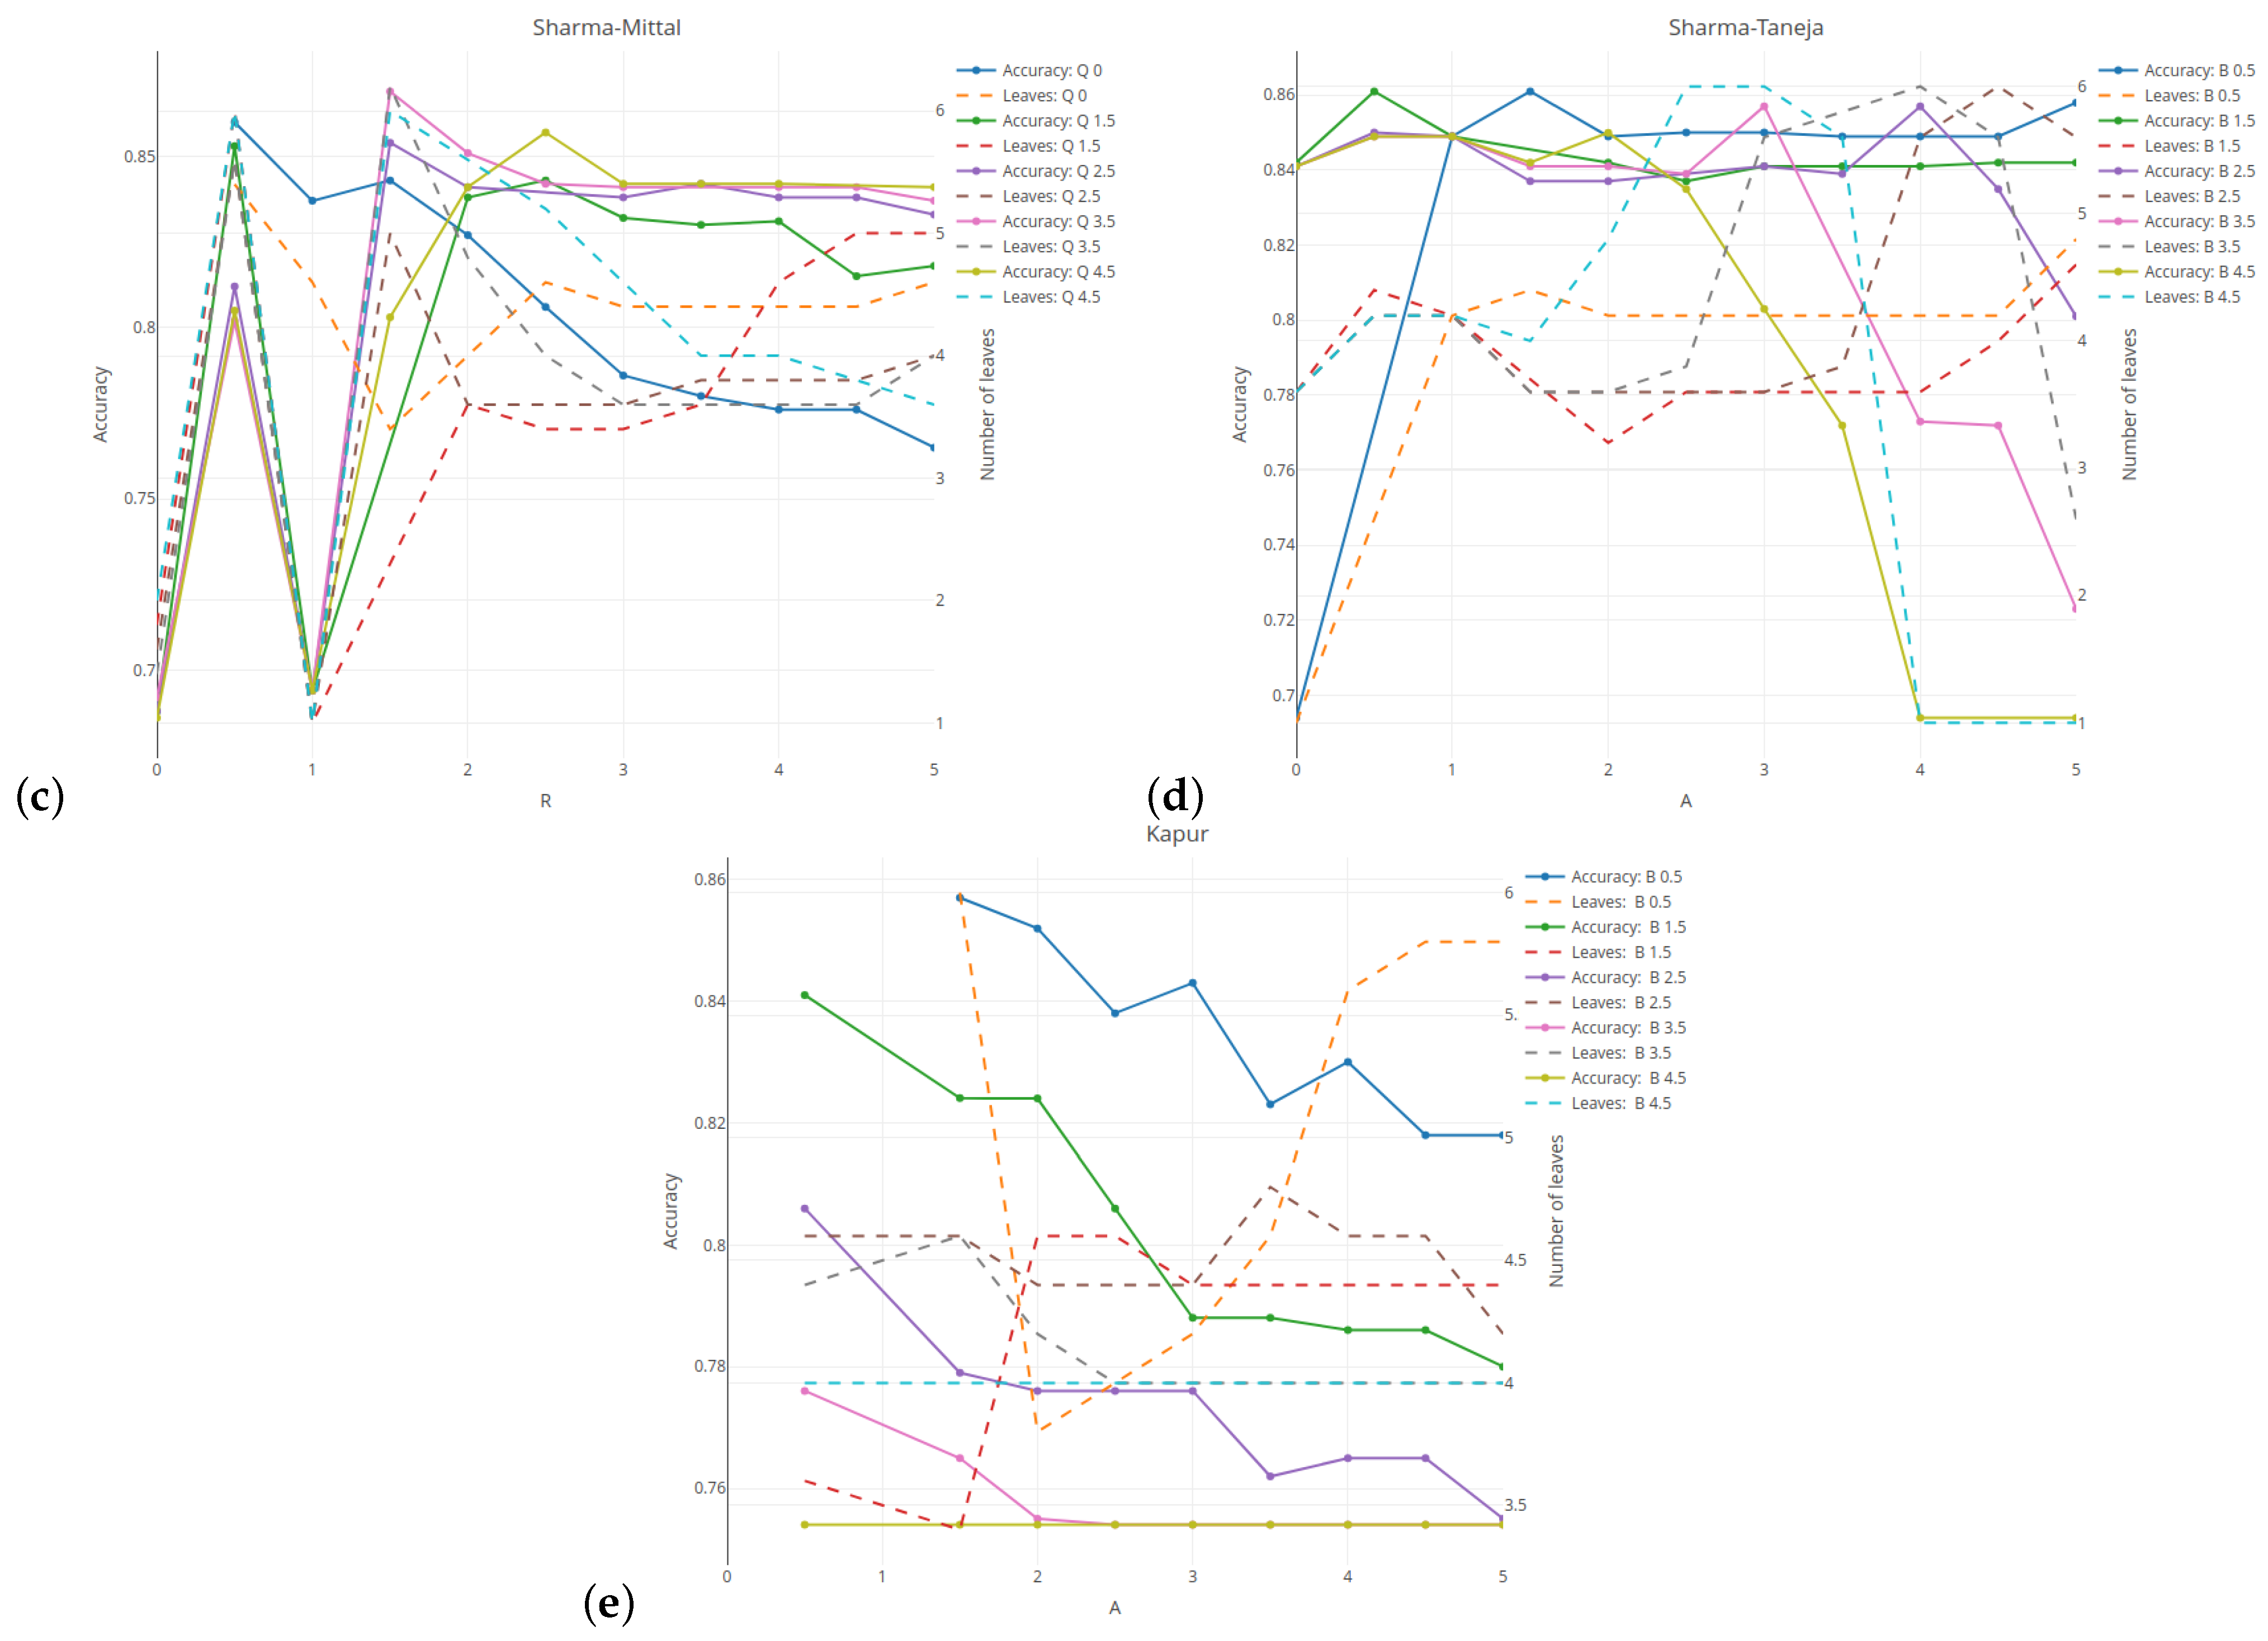
Figure 2 illustrates the relationship between the classification quality (on the left vertical axis) and the tree complexity measured by the number of leaves (on the right vertical axis) for five selected entropies. Here, the results are given for the minimum number of observations set as 5% and the tree depth set as 5. The results are averaged over five cross-validation runs of the validation sample. For the Rényi and Tsallis entropies (see
Figure 2a,b), the values of the parameter
q are given on the horizontal axis. The results related to the classification quality are presented in the form of a solid line, while the numbers of leaves in the tree are presented as a dashed line.
For comparative purposes, the green and red horizontal lines indicate the results for the case when the Shannon entropy has been taken into account. The average quality classification for the Shannon entropy is lower than 85% for a tree with an average of
leaves. In
Section 6.1, we discovered the inward shrinking and expanding properties of the Rényi entropy. This behavior strongly affects the shape of the measure with respect to the probability, which is reflected in the the regression slope. As shown in
Figure 2a, this greatly influences the results. With an increase in the parameter
q, the tree loses its predictive power (see
blue line). The complexity of the tree follows a U-shaped pattern. For
q set at 2, the tree has almost the same classification quality as the Shannon entropy, but the number of leaves is on average
smaller. When using the Tsallis entropy, the shape is slightly distorted, but only the scale of values changes. This leads to a slightly lower classification quality of 85%, with a tree that has on average
fewer leaves. The results are consistent and are not highly dependent on the parameter
q when it is above
. For both entropies, a better classification quality than for the Shannon entropy is obtained for
q = 0.5, but the complexity of a tree is higher.
The Sharma–Mittal entropy-based results (see
Figure 2c) show two cases when the tree does not divide the root at all (
r = 0 or 1). The best classification—of above 87%—is observed for
r = 1.5 and
q = 3.5 (see
violet–red line). However, it is obtained at the expense of the tree’s size. The optimal balance between the quality and the tree size is attained for
3.5 and
q = 4.5, which results in an almost 85% accuracy (see
spring-green line) with four or fewer leaves (see
cyan dashed line). As shown in subfigure
Figure 2d, using the Sharma–Taneja entropy with parameter
set as 0 (see
yellow–orange dashed line) or above
(see
cyan dashed line) does not form a tree. Setting parameter
as greater than or equal to 1 and parameter
as
yields results that are similar to those for the Shannon entropy in both the classification quality and the number of tree leaves. This is due to the fact that if we examine the relevant part of
Figure 2g (see
yellow–orange dots) and
Figure 2c (see
royal blue dots), we observe that both curves share similar properties. Simultaneous increases in both parameters lead to a deterioration of the classification quality and the tree’s growth. Due to the restricted parameter combinations, some curves start in the middle of
Figure 2e. A decrease in the classification quality is observed for each value of parameter
if the values of parameter
increase.
The remaining results showing the Kappa and AUC measures used for unbalanced data sets are shown in
Figure A7 from
Appendix A.
6.3. Interactive Learning
In the current section, we will present the interactive learning procedure only for the Shannon entropy and avoid considering the other entropy measures, since adding the other cases would unnecessarily increase the size and the complexity of our paper.
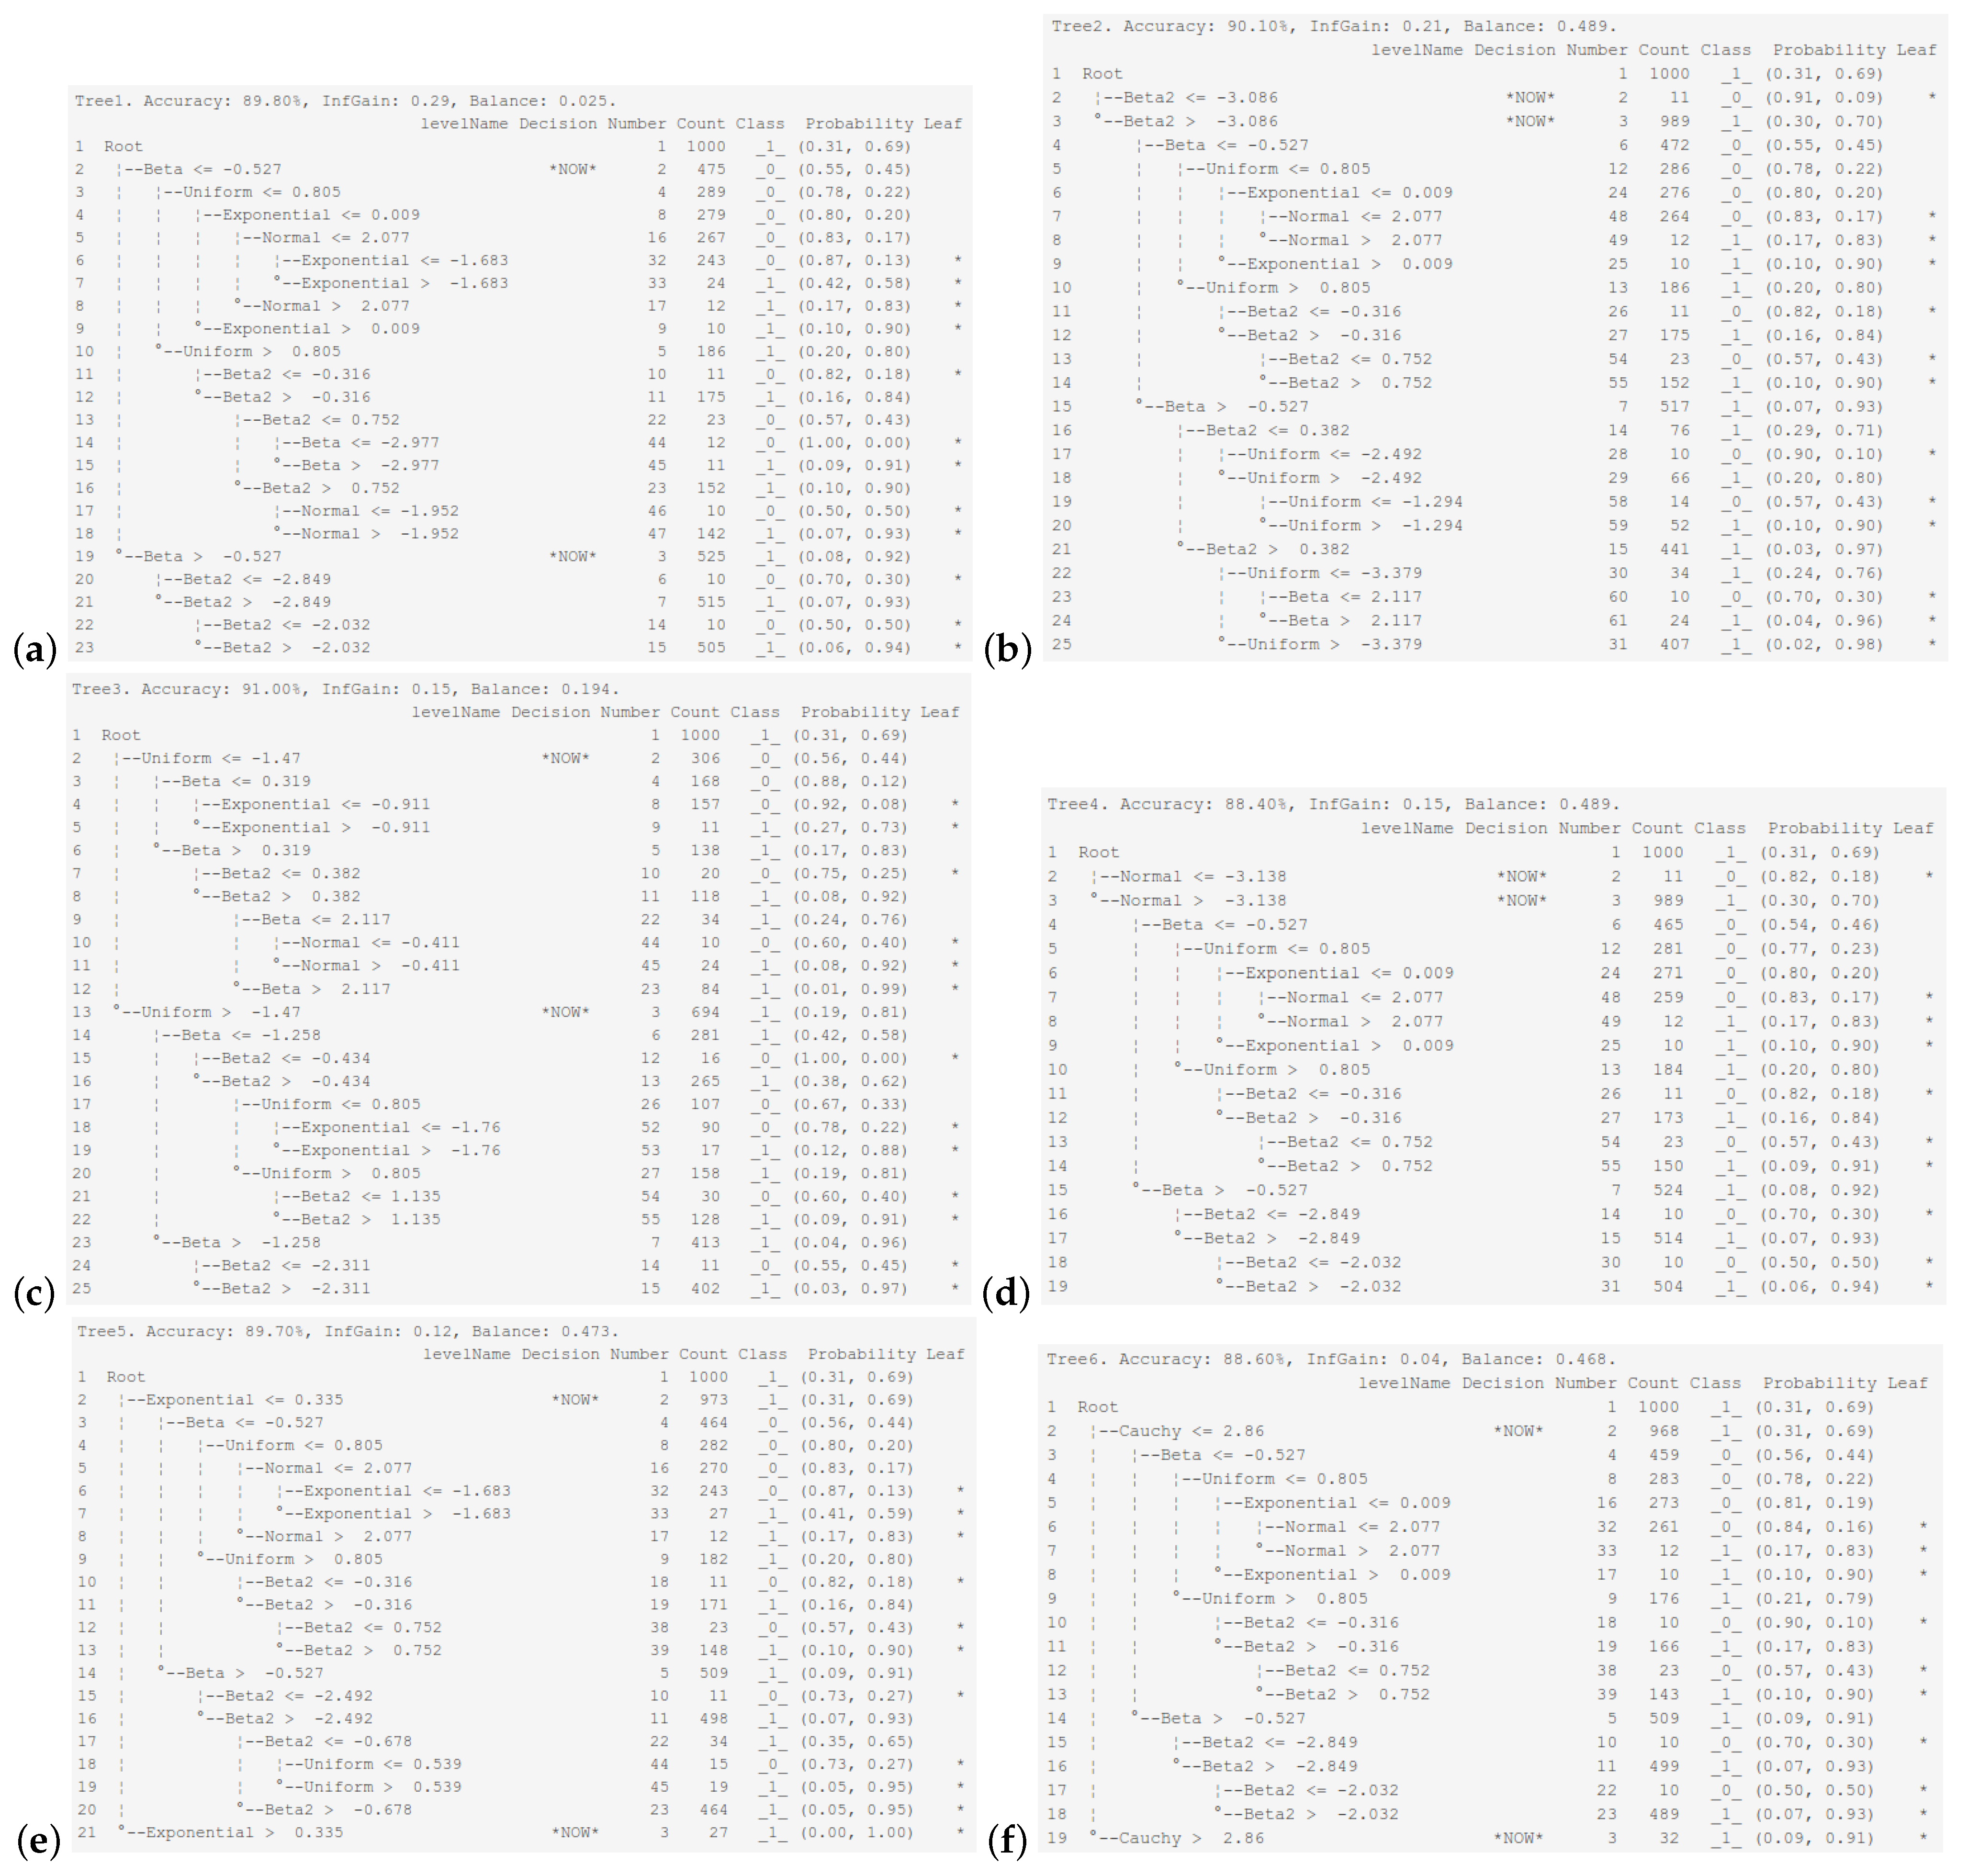
Figure 3 displays the final tree structure obtained in the interactive learning mode after selecting one of the six explanatory variables for the initial root split. The tree was built using the default hyper-parameter settings. The maximum tree depth is 5, and the minimum number of observations in a leaf is 10. The Shannon entropy is used as the impurity measure, the best split is chosen at the attribute level, and the ambiguity threshold is set at 1, which means that a decision will always be made by an expert. The decision column following the tree structure indicates where an expert’s decision is made, as indicated by the text
*NOW*. The most effective discriminating explanatory variable is the beta distribution, with an information gain of
and a classification accuracy of 89.90%.
Figure 3a depicts the case of the beta explanatory variable, also showing the theoretical tree trained entirely in an automatic mode. The next explanatory variables in the ranking, made with respect to the discriminatory power (at the root division level), are the Beta2, uniformly, normally, exponentially, and Cauchy-distributed random variables. This order is largely consistent with the regression slope decline rates ranking discussed earlier. This good discriminatory power of the beta-distributed explanatory variable and the tendency towards the construction of a balanced tree result from the U-shaped nature of the beta distribution, which pushes objects from two classes to the opposite distribution tails. Returning to the dependencies in
Table 2, the slope of the beta-distributed variable for the Shannon entropy is the largest, which means that this variable separates the two populations in the fastest possible way.
Our study shows that the probability distributions of the explanatory variables for which the best balanced trees are obtained are the beta and uniform distributions. That is because, based on the histograms of the probability distributions (responses presented in subplots (b)), both of the mentioned distributions are U-shaped bimodal distributions, whereas imposing that explanatory variables have some of the remaining probability distributions leads to the construction of chain-like trees with numerous small terminal nodes.
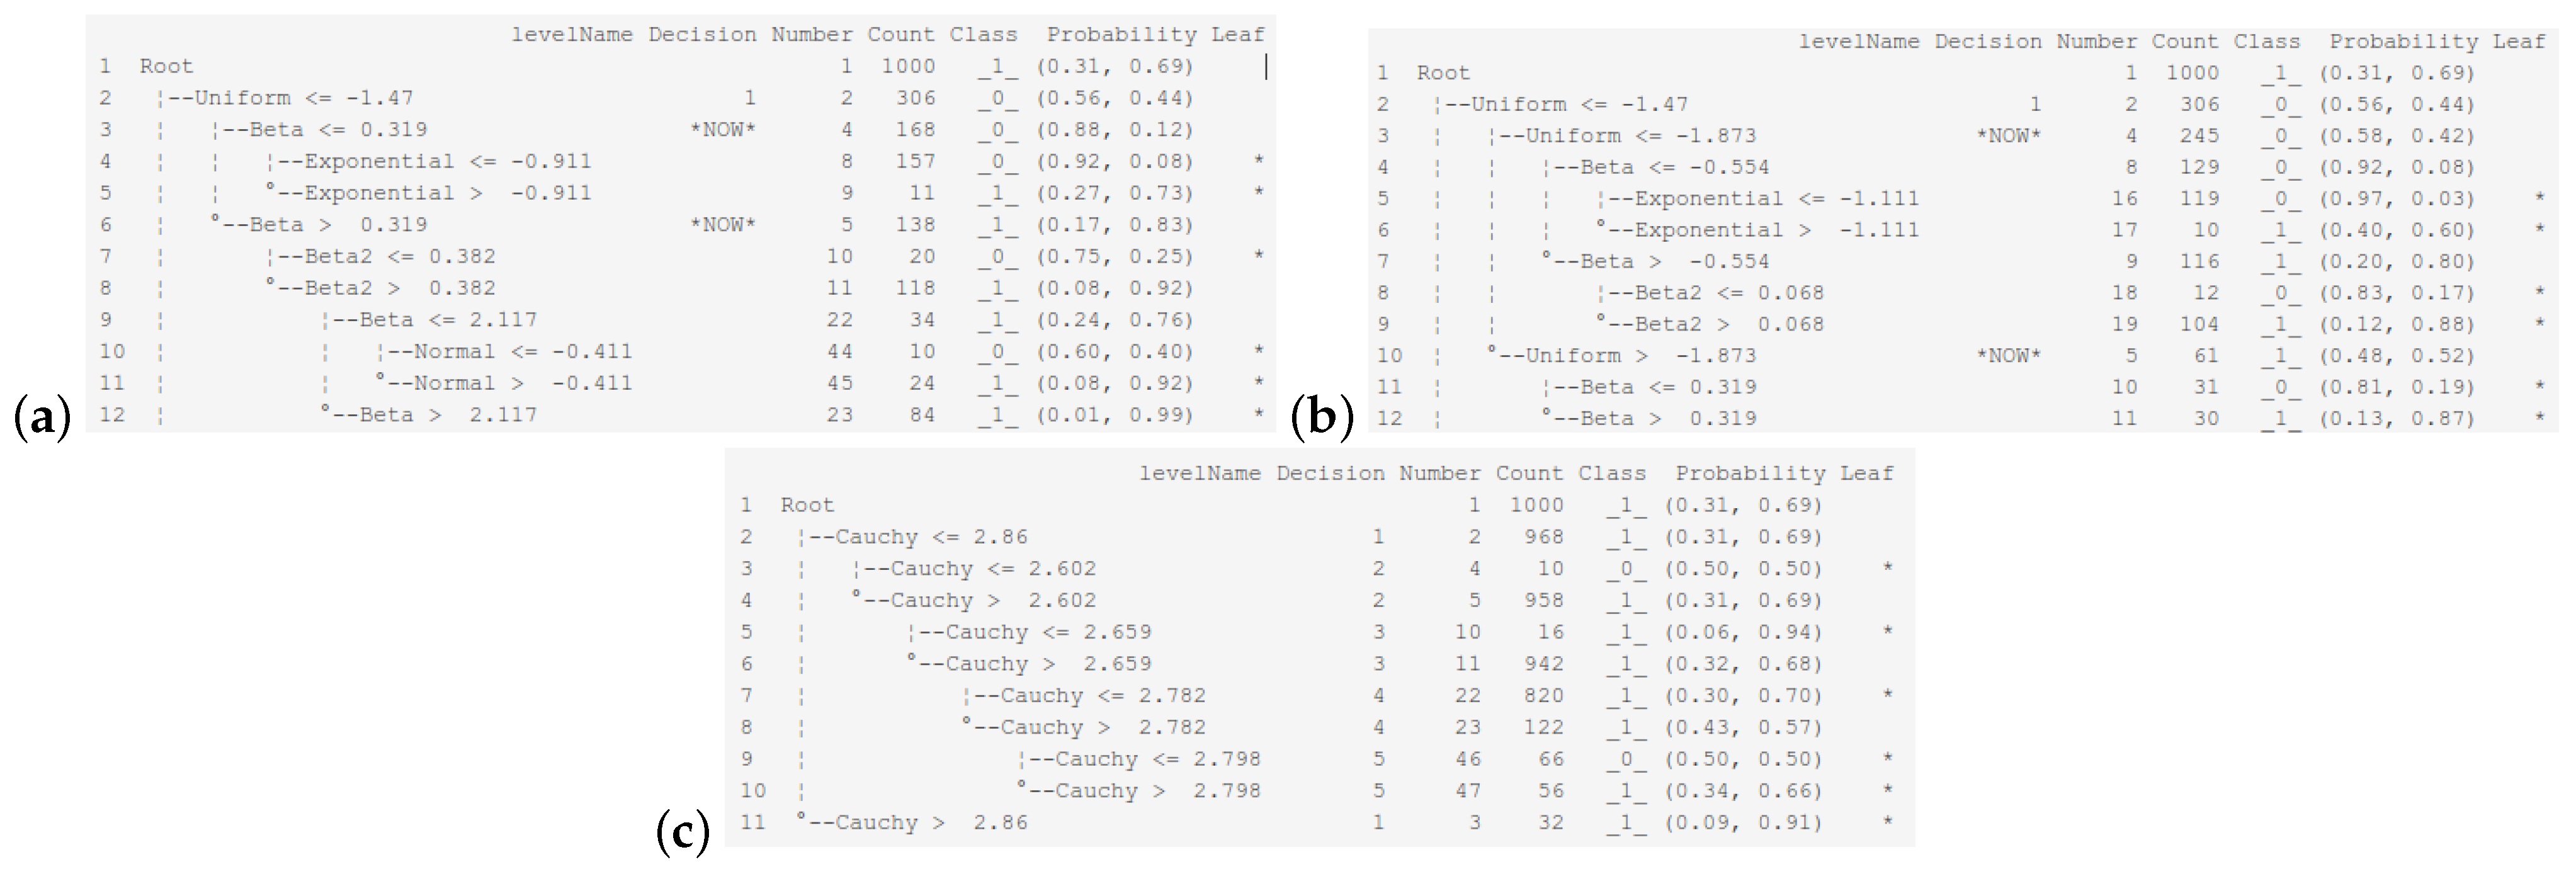
Let us analyze the tree structure obtained by choosing the uniform distribution as the explanatory variable distribution used in the first tree’s partition. In the first node (see the upper part of
Figure 3c), we have almost a tie situation regarding the probability vector for both classes. The second node overrepresents class
, since it contains 81% of the observations from that class. While splitting a node with the condition ≤ at the next sublevel, the best variable turns out to be of the beta distribution, which is followed by the cases when the best variable has the exponential, Beta2, normal, Cauchy, and uniform distributions. Assuming that the first and last distributions from the corresponding ranking are the distributions of variables used in the tree-building process, we obtain the most balanced trees, as depicted in
Figure 4a,b.
In turn, if we consider a variable with the Cauchy distribution in the first tree’s partition, then the second partition has the same order of potential subsequent partitions as in the root. While selecting the worst variable for splitting until the very end of the tree training, we observe that it is always the same variable with the Cauchy distribution. The final tree structure is a chain with single small branches, which are leaves (without perfect classifications) coming from the main subtree, as shown in
Figure 4c. The quality of the obtained tree is only 69%. It seems as if the root had not been divided at all, and all observations were assigned to class
.


