
The Role of Thermodynamic and Informational Entropy in Improving Real Estate Valuation Methods

Abstract
1. Introduction
2. Literature Review
3. Value State Balance
4. Entropy Weights Method
5. An Empirical Demonstration
6. Conclusions
Funding
Institutional Review Board Statement
Data Availability Statement
Conflicts of Interest
References
- Beum, A.; Mackmin, D. The Income Approach to Property Valuation; Routledge: London, UK, 1989. [Google Scholar]
- Bilga, P.S.; Singh, S.; Kumar, R. Optimization of energy consumption response parameters for turning operation using Taguchi method. J. Clean. Prod. 2016, 137, 1406–1417. [Google Scholar] [CrossRef]
- Wiltshaw, D.G. Econometric, linear programming and valuation. J. Prop. Res. 1991, 8, 123–132. [Google Scholar] [CrossRef]
- Richard, M.B.; Silas, J.E. Basic Real Estate Appraisal, 4th ed.; Prentice Hall: Upper Saddle River, NJ, USA, 1998. [Google Scholar]
- Marshall, A. Principles of Economics, 8th ed.; MacMillan Company Ltd.: London, UK, 1890. [Google Scholar]
- Hurd, R.M. Principles of City Land Values; The Record and Guide: New York, NY, USA, 1903. [Google Scholar]
- Babcock, F.M. The Appraisal of Real Estate; The Macmillan Company: New York, NY, USA, 1924. [Google Scholar]
- Bonbright, J.C. The Valuation of Property: A Treatise on the Appraisal of Property for Different Legal Purposes; McGraw-Hill: New York, NY, USA, 1937. [Google Scholar]
- Ratcliff, R.U. Modern Real Estate Valuation, Theory and Application; Democrat Press: Wisconsin, WI, USA, 1965. [Google Scholar]
- Wendt, P.F. Real Estate Appraisal: A Critical Analysis of Theory and Practice; Holt: New York, NY, USA, 1956. [Google Scholar]
- Burton, J.H. Evolution of the Income Approach; American Institute of Real Estate Appraisers: Chicago, IL, USA, 1982. [Google Scholar]
- Cannon, M.Y. The role of the real estate appraiser and assessor in valuing real property for ad valorem assessment purposes. Apprais. J. 2002, 70, 214–219. [Google Scholar]
- Özdilek, Ü. Scientific basis of value and valuation. J. Revenue Pricing Manag. 2019, 18, 266–277. [Google Scholar] [CrossRef]
- McGreal, S.; Adair, A.; McBurney, D.; Patterson, D. Neural networks: The prediction of residential values. J. Prop. Valuat. Invest. 1998, 16, 57–70. [Google Scholar] [CrossRef]
- McCluskey, W. Predictive accuracy of machine learning models for the mass appraisal of residential property. N. Z. Val. J. 1996, 16, 41–47. [Google Scholar]
- Wilson, I.D.; Paris, S.D.; Ware, J.A.; Jenkins, D.H. Residential property price time series estimation with neural networks. Knowl.-Based Syst. 2002, 15, 335–341. [Google Scholar] [CrossRef]
- Sayer, J.; Moohan, J. An analysis and evaluation of hedonic price valuations in local leasehold office markets. In Proceedings of the 13th Pacific-Rim Real Estate Society Conference, Fremantle, Australia, 21–24 January 2007. [Google Scholar]
- Appraisal Institute. The Appraisal of Real Estate, 13th ed.; Appraisal Institute: Chicago, IL, USA, 2008. [Google Scholar]
- Pagourtzi, E.; Assimakopoulos, V.; Hatzichristos, T.; French, N. Real estate appraisal: A review of valuation methods. J. Prop. Invest. Financ. 2003, 21, 383–401. [Google Scholar] [CrossRef]
- Copiello, S.; Bonifaci, P. Depreciated Replacement Cost: Improving the Method Through a Variant Based on Three Cornerstones. Real Estate Manag. Valuat. 2018, 26, 33–47. [Google Scholar] [CrossRef]
- Mundy, B.M. The Scientific Method and the Appraisal Process. Apprais. J. 1992, 60, 493–499. [Google Scholar]
- Pomykacz, M. Relationships between the Overall Property and Its Parts, and the Three Approaches to Value. Apprais. J. 2009, 77, 66–76. [Google Scholar]
- Weilenmann, M.; Kraemer, L.; Faist, P.; Renner, R. Axiomatic Relation between Thermodynamic and Information-Theoretic Entropies. Phys. Rev. Lett. 2016, 117, 260601. [Google Scholar] [CrossRef] [PubMed]
- Clapp, J.M.; Giaccotto, C. Evaluating house price forecasts. J. Real Estate Res. 2002, 24, 1–25. [Google Scholar] [CrossRef]
- Joslin, A. An investigation into the expression of uncertainty in property valuation. J. Prop. Invest. Financ. 2005, 23, 269–285. [Google Scholar] [CrossRef]
- Pace, R.K.; Barry, R.; Gilley, O.; Sirmans, C.F. A method for spatial-temporal forecasting with an application to real estate prices. Int. J. Forecast. 2000, 16, 229–246. [Google Scholar] [CrossRef]
- Sirmans, S.G.; Macpherson, D.A.; Zietz, E.N. The Composition of Hedonic Pricing Models. J. Real Estate Lit. 2005, 13, 3–43. [Google Scholar] [CrossRef]
- Pryce, G. Housing submarkets and the lattice of substitution. Urban Stud. 2013, 50, 2682–2699. [Google Scholar] [CrossRef]
- Kelly, J.L. A New Interpretation of Information Rate. Bell Syst. Tech. J. 1956, 35, 917–926. [Google Scholar] [CrossRef]
- Martin, W. Theories of Judgment: Psychology, Logic, Phenomenology; Cambridge University Press: Cambridge, UK, 2008. [Google Scholar]
- Davis, H.T. The Theory of Econometrics; The Principia Press: Bloomington, IA, USA, 1941. [Google Scholar]
- Theil, H. Economics and Information Theory; North Holland: Amsterdam, The Netherlands, 1967. [Google Scholar]
- Jaynes, E.T. Information Theory and Statistical Mechanics. Phy. Rev. Ser. II 1957, 106, 620–630. [Google Scholar] [CrossRef]
- Maxwell, J.C. A Treatise on Electricity and Magnetism; Clarendon Press: Oxford, UK, 1873; Volume I. [Google Scholar]
- Boltzmann, L. Verhältniss zur Fernwirkungstheorie, Specielle Fälle der Elektrostatik, Stationären Strömung und Induction; Johann Ambrosius Barth: Leipzig, Germany, 1893; Volume 2. (In German) [Google Scholar]
- Shannon, C.E. A mathematical theory of communication. Bell Syst. Tech. J. 1948, 27, 379–423. [Google Scholar] [CrossRef]
- Wiener, N. Cybernetics; MIT Press: Cambridge, MA, USA, 1948. [Google Scholar]
- Akerlof, G. The Market for ‘Lemons’: Quality Uncertainty and the Market Mechanism. Q. J. Econ. 1970, 84, 488–500. [Google Scholar] [CrossRef]
- He, D.; Wang, X.; Li, S.; Lin, J.; Zhao, M. Identification of multiple faults in rotating machinery based on minimum entropy deconvolution combined with spectral kurtosis. Mech. Syst. Signal Process. 2016, 81, 235–249. [Google Scholar] [CrossRef]
- Wang, C.-Y.; Lee, S.-J. Regional Population Forecast and Analysis Based on Machine Learning Strategy. Entropy 2021, 23, 656. [Google Scholar] [CrossRef] [PubMed]
- Campbell, J. Grammatical Man: Information, Entropy, Language, and Life; Simon and Schuster: New York, NY, USA, 1982. [Google Scholar]
- Golan, A. Information and entropy econometrics: A review and synthesis. Found. Trends Econ. 2006, 2, 1–145. [Google Scholar] [CrossRef]
- Bretó, C.; Espinosa, P.; Hernández, P.; Pavía, J.M. An Entropy-Based Machine Learning Algorithm for Combining Macroeconomic Forecasts. Entropy 2009, 21, 1015. [Google Scholar] [CrossRef]
- Donaldson-Matasci, M.C.; Bergstrom, C.T.; Lachmann, M. The fitness value of information. Oikos 2010, 119, 219–230. [Google Scholar] [CrossRef]
- Demirel, Y.; Gerbaud, V. Nonequilibrium Thermodynamics: Transport and Rate Processes in Physical, Chemical and Biological Systems; Elsevier: Amsterdam, The Netherlands, 2019. [Google Scholar]
- Piasini, E.; Panzeri, S. Information Theory in Neuroscience. Entropy 2019, 21, 62. [Google Scholar] [CrossRef] [PubMed]
- Sanford, J.C. Genetic Entropy; Feed My Sheep Foundation: Marietta, GA, USA, 2014. [Google Scholar]
- Friston, K. Free Energy Principle for Biological Systems. Entropy 2012, 14, 2100–2121. [Google Scholar] [CrossRef]
- Seiler, J.P.; Dan, O.; Tüscher, O.; Loewenstein, Y.; Rumpel, S. Experienced entropy drives choice behavior in a boring decision-making task. Sci. Rep. 2022, 12, 3162. [Google Scholar] [CrossRef]
- Dyer, J.A.; Sarin, R.K. Measurable multi-attribute value functions. Oper. Res. 1979, 27, 810–822. [Google Scholar] [CrossRef]
- Zanakis, S.H.; Solomon, A.; Wishart, N.; Dublish, S. Multi-attribute decision making: A simulation comparison of select methods. Eur. J. Oper. Res. 1998, 107, 507–529. [Google Scholar] [CrossRef]
- Kaila, V.R.I.; Annila, A. Natural selection for least action. Proc. R. Soc. A 2008, 464, 3055–3070. [Google Scholar] [CrossRef]
- Miller, E.K. The prefrontal cortex and cognitive control. Nat. Rev. Neurosci. 2000, 1, 59–65. [Google Scholar] [CrossRef] [PubMed]
- Arrow, K.J. Uncertainty and the Welfare Economics of Medical Care. Am. Econ. Rev. 1963, 53, 941–973. [Google Scholar]
- Jaynes, E.T. Information Theory and Statistical Mechanics II. Phy. Rev. Ser. II 1957, 108, 171–190. [Google Scholar] [CrossRef]
- Grossman, S.; Stiglitz, J. On the impossibility of informationally efficient markets. Am. Econ. Rev. 1980, 70, 393–408. [Google Scholar]
- Özdilek, Ü. Value order in disorder. Int. J. Dyn. Control 2022, 10, 1395–1414. [Google Scholar] [CrossRef]
- Molgedey, L.; Ebeling, W. Local order, entropy and predictability of financial time series. Eur. Phys. J. B 2000, 107, 733–737. [Google Scholar] [CrossRef]
- Bentes, S.; Menezes, R.; Mendes, D.A. Long memory and volatility clustering: Is the empirical evidence consistent across stock markets? Phys. A 2008, 387, 3826–3830. [Google Scholar] [CrossRef]
- Zhou, R.; Cai, R.; Tong, G. Applications of Entropy in Finance: A Review. Entropy 2013, 15, 4909–4931. [Google Scholar] [CrossRef]
- Fama, E.F. The Behavior of Stock-Market Prices. J. Bus. 1965, 38, 34–105. [Google Scholar] [CrossRef]
- Ivkovic, Z.; Weisbenner, S. Local does as local is: Information content of the geography of individual investors’ common stock investments. J. Financ. 2005, 60, 267–306. [Google Scholar] [CrossRef]
- Schrödinger, E. What Is life? And Mind and Matter; Cambridge University Press: Cambridge, UK, 1967. [Google Scholar]
- Jeffery, K.; Pollack, R.; Rovelli, C. On the Statistical Mechanics of Life: Schrödinger Revisited. Entropy 2019, 21, 1211. [Google Scholar] [CrossRef]
- Applebaum, D. Probability and Information, an Integrated Approach; Cambridge University Press: Cambridge, UK, 1996. [Google Scholar]
- Georgescu-Roegen, N. The Entropy Law and the Economic Process; Harvard University Press: Cambridge, MA, USA, 1971. [Google Scholar]
- Natal, J.; Ávila, I.; Tsukahara, V.B.; Pinheiro, M.; Maciel, C.D. Entropy: From Thermodynamics to Information Processing. Entropy 2021, 23, 1340. [Google Scholar] [CrossRef] [PubMed]
- Page, S.E. The Model Thinker; Basic Books: New York, NY, USA, 2018. [Google Scholar]
- Bailly, F.; Longo, G. Mathematics and the Natural Sciences; Imperial College Press: London, UK, 2011. [Google Scholar]
- D’Espargnat, B. On Physics and Philosophy; Princeton University Press: Oxford, UK, 2002. [Google Scholar]
- Westphal, M.; Brannath, W. Evaluation of multiple prediction models: A novel view on model selection and performance assessment. Stat. Methods Med. Res. 2020, 29, 1728–1745. [Google Scholar] [CrossRef] [PubMed]
- Rothe, S.; Kudszus, B.; Söffker, D. Does Classifier Fusion Improve the Overall Performance? Numerical Analysis of Data and Fusion Method Characteristics Influencing Classifier Fusion Performance. Entropy 2019, 21, 866. [Google Scholar] [CrossRef]
- Yin, R.K. Case Study Research: Design and Methods, 4th ed.; Sage Publications: California, UK, 2009. [Google Scholar]
- Ott, J.B.; Boerio-Goates, J. Chemical Thermodynamics: Advanced Applications; Academic Press: Amsterdam, The Netherlands, 2000. [Google Scholar]
- Goshtasby, A.A.; Nikolov, S. Image fusion: Advances in the state of the art. Inf. Fusion 2007, 8, 114–118. [Google Scholar] [CrossRef]
- Ma, J.; Yong, M.; Chang, L. Infrared and visible image fusion methods and applications: A survey. Inf. Fusion 2019, 45, 153–178. [Google Scholar] [CrossRef]
- Saaty, T.L.; Vargas, L.G. Inconsistency and rank preservation. J. Math. Psychol. 1984, 28, 205–214. [Google Scholar] [CrossRef]
- Green, P.E.; Srinivasna, V. Conjoint analysis in consumer research: Issues and outlook. J. Consum. Res. 1978, 5, 103–123. [Google Scholar] [CrossRef]
- Dyer, R.F.; Forman, E.H. Group decision support with the Analytic Hierarchy Process. Decis. Support Sys. 1992, 8, 99–124. [Google Scholar] [CrossRef]
- Akaike, H. A new look at the statistical model identification. IEEE Trans. Autom. Control 1974, 19, 716–723. [Google Scholar] [CrossRef]
- Schwarz, G.E. Estimating the dimension of a model. Ann. Stat. 1978, 6, 461–464. [Google Scholar] [CrossRef]
- Juusola, M.; de Polavieja, G.G. The rate of information transfer of naturalistic stimulation by graded potentials. J. Gen. Physiol. 2003, 122, 191–206. [Google Scholar] [CrossRef]
- Panzeri, S.; Treves, A. Analytical estimates of limited sampling biases in different information measures. Netw. Bristol Engl. 1996, 7, 87–107. [Google Scholar] [CrossRef]
- Paninski, L. Estimation of Entropy and Mutual Information. Neural Comput. 2003, 15, 1191–1253. [Google Scholar] [CrossRef]
- Nemenman, I.; Bialek, W.; de Ruyter van Steveninck, R. Entropy and information in neural spike trains: Progress on the sampling problem. Phys. Rev. E Stat. Nonlinear Soft Matter Phys. 2004, 69, 056111. [Google Scholar] [CrossRef]
- Chan, L.K.; Kao, H.P.; Ng, A.; Wu, M.L. Rating the importance of customer needs in quality function deployment by fuzzy and entropy methods. Int. J. Product. Res. 1999, 37, 2499–2518. [Google Scholar] [CrossRef]
- Safaai, H.; Onken, A.; Harvey, C.D.; Panzeri, S. Information estimation using nonparametric copulas. Phys. Rev. E 2018, 98, 053302. [Google Scholar] [CrossRef]
- Panzeri, S.; Senatore, R.; Montemurro, M.A.; Petersen, R.S. Correcting for the sampling bias problem in spike train information measures. J. Neurophysiol. 2007, 98, 1064–1072. [Google Scholar] [CrossRef]
- Cover, T.; Thomas, J. Elements of Information Theory, 2nd ed.; Wiley: Hoboken, NJ, USA, 2006. [Google Scholar]
- Xin, J.G.; Du, Y. Main variables influencing residential property values. In Proceedings of the 5th International Structural Engineering and Construction Conference, Shunan, Japan, 26–28 September 2007. [Google Scholar]
- Gnat, S. Measurement of entropy in the assessment of homogeneity of areas valued with the Szczecin Algorithm of Real Estate Mass Appraisal. J. Econ. Manag. 2019, 38, 89–106. [Google Scholar] [CrossRef]
- Hwang, C.L.; Masud, A.S.M. Multiple Objective Decision Making Methods and Applications; Springer: Amsterdam, The Netherlands, 1979. [Google Scholar]
- Boris, S.M.; Treiman, J.S.; Quiji, Z. An Extended Extremal Principle with Applications to Multiobjective Optimization. SIAM J. Optim. 2003, 14, 359–379. [Google Scholar] [CrossRef]
- Miettinen, K. Nonlinear Multiobjective Optimization; Kluwer: Boston, MA, USA, 1999. [Google Scholar]
- Kumar, R.; Bilga, P.S.; Singh, S. Multi objective optimization using different methods of assigning weights to energy consumption responses, surface roughness and material removal rate during rough turning operation. J. Clean. Prod. 2017, 164, 45–57. [Google Scholar] [CrossRef]
- Malczewski, J. GIS and Multicriteria Decision Analysis; John Wiley & Sons: Hoboken, NJ, USA, 1999. [Google Scholar]
- Deng, H.; Yeh, C.H.; Willis, R.J. Inter-company comparison using modified TOPSIS with objective weights. Comput. Oper. Res. 2000, 27, 963–973. [Google Scholar] [CrossRef]
- Dai, F.G.; Xiao, G.F.; Huan, J.C. Evaluation Model Using the AHP of Ecological Environmental Quality of Jiuyuangou Watershed in the Loess Plateau. Adv. Mater. Res. 2011, 356–360, 2571–2574. [Google Scholar] [CrossRef]
- Choo, E.U.; Bertram, S.; Wedley, W.C. Interpretation of criteria weights in multicriteria decision making. Comput. Ind. Eng. 1999, 37, 527–541. [Google Scholar] [CrossRef]
- Ghosh, R.; Verma, B. A hierarchical method for finding optimal architecture and weights using evolutionary least square based learning. Int. J. Neural Syst. 2003, 13, 13–24. [Google Scholar] [CrossRef]
- Takeda, E.; Cogger, K.; Yu, P. Estimating criterion weights using eigenvectors: A comparative study. Eur. J. Oper. Res. 1987, 29, 360–369. [Google Scholar] [CrossRef]
- Gordon, T.J. The delphi method in futures research methodology. AC/UNC Millenum Proj. 1994, 2, 1–30. [Google Scholar]
- Rao, R.V. Decision Making in the Manufacturing Environment: Using Graph Theory and Fuzzy Multiple Attribute Decision Making Methods; Springer Science & Business Media: Amsterdam, The Netherlands, 2007. [Google Scholar]
- Andersen, T.; Pedersen, B.H.; Dissing, I.; Astrup, A.; Henriksen, J.H. A randomized comparison of horizontal and vertical banded gastroplasty: What determines weight loss? Scand. J. Gastroenterol. 1989, 24, 186–192. [Google Scholar] [CrossRef]
- Hwang, C.-L.; Yoon, K. Methods for Multiple Attribute Decision Making. In Multiple Attribute Decision Making; Springer: Amsterdam, The Netherlands, 1981; pp. 58–191. [Google Scholar]
- Likun, W.; Baohui, M. Application of TOPSIS method based on variation coefficient weight on water resource classification. South-to-North Water Trans. Water Sci. Tech. 2007, 5, 24–27. [Google Scholar]
- Wang, J.-J.; Jing, Y.; Zhang, C.-F.; Zhao, J.-H. Review on multi-criteria decision analysis aid in sustainable energy decision-making. Renew. Sustain. Energy Rev. 2009, 13, 2263–2278. [Google Scholar] [CrossRef]
- Peng, B.; Shaorong, S.; Ruo, H.U. The Evaluation Model of Extended Value Engineering Based on the Method of Entropy and Double Base Points. Value Eng. 2004, 2, 54–57. [Google Scholar]
- Zhou, S.; Wang, F.; Zhang, Z. Evaluation of Real Estate Venture Capital Based on Entropy Double Base Points Method. In Proceedings of the 2009 International Conference on Electronic Commerce and Business Intelligence, Beijing, China, 6–7 June 2009. [Google Scholar] [CrossRef]
- Lam, K.C.; Yu, C.Y.; Lam, C.K. Support vector machine and entropy-based decision support system for property valuation. J. Prop. Res. 2009, 26, 213–233. [Google Scholar] [CrossRef]
- Lam, K.C.; Yu, C.Y.; Lam, K.Y. An Artificial Neural Network and Entropy Model for Residential Property Price Forecasting in Hong. J. Prop. Res. 2008, 25, 321–342. [Google Scholar] [CrossRef]
- Salois, M.J.; Moss, C.B. An Information Approach to the Dynamics in Farm Income: Implications for Farmland Markets. Entropy 2011, 13, 38–52. [Google Scholar] [CrossRef]
- Sekaran, S. Measurement: Scaling, reliability, validity. In Research Methods for Business: A Skill Building Approach; Wiley: Hoboken, NJ, USA, 2003. [Google Scholar]
- Turner, C.K. A principle of intentionality. Front. Psychol. 2017, 8, 137. [Google Scholar] [CrossRef]
- Özdilek, Ü. On Price, Cost, and Value. Apprais. J. 2010, 78, 70–80. [Google Scholar]
- Hutcheon, P.D. Value Theory: Toward Conceptual Clarification. Br. J. Soc. 1972, 23, 172–187. [Google Scholar] [CrossRef]
- Lizieri, C. Towers of Capital: Office Markets and International Financial Services; Blackwell-Wiley: Oxford, UK, 2009. [Google Scholar]
- Vlaev, I.; Chater, N.; Stewart, N.; Brown, G.D. Does the brain calculate value? Trends Cogn. Sci. 2011, 15, 546–554. [Google Scholar] [CrossRef]
- Söllner, F. A reexamination of the role of thermodynamics for environmental economics. Ecol. Econ. 1997, 22, 175–201. [Google Scholar] [CrossRef]
- Landreth, H.; Colander, D.C. History of Economic Thought, 4th ed.; Houghton Mifflin Company: Boston, MA, USA, 2002. [Google Scholar]
- Hayn-Leichsenring, G.U. The Ambiguity of Artworks—A Guideline for Empirical Aesthetics Research with Artworks as Stimuli. Front. Psychol. 2017, 8, 1857. [Google Scholar] [CrossRef] [PubMed]
- Jia, T.; Macare, C.; Gonzalez, D.A.; Tao, C.; Ji, X.; Ruggeri, B.; Nees, F.; Banaschewski, T.; Barker, G.J.; Bokde, A.L.W.; et al. Neural basis of reward anticipation and its genetic determinants. Proc. Nat. Acad. Sci. USA 2016, 113, 3879–3884. [Google Scholar] [CrossRef] [PubMed]
- Özdilek, Ü. Value Expectation, Expression and Estimation. J. Creat. Value 2016, 2, 245–256. [Google Scholar] [CrossRef]
- Screpanti, E.; Zamagi, S. An Outline of the History of Economic Thought, 2nd ed.; Oxford University Press: Oxford, UK, 2005. [Google Scholar]
- Pirgmaier, E. The Value of Value Theory for Ecological Economics. Ecol. Econ. 2021, 179, 106790. [Google Scholar] [CrossRef]
- Özdilek, U. Value Is a (Quantum) State. J. Creat. Value 2020, 6, 34–46. [Google Scholar] [CrossRef]
- Baumol, W.J. Unnatural Value: Or Art Investment as Floating Crap Game. Am. Econ. Rev. 1986, 76, 10–14. [Google Scholar] [CrossRef]
- Goetzmann, W.N. Accounting for taste: Art and the financial markets over three centuries. Am. Econ. Rev. 1993, 83, 1370–1376. [Google Scholar]
- Berlyne, D.E. Novelty, Complexity, and Hedonic Value. Percept. Psychophys. 1971, 8, 279–286. [Google Scholar] [CrossRef]
- Özdilek, Ü. Land Value: Seven Major Questions in the Analysis of Urban Land Values. Am. J. Econ. Soc. 2011, 70, 30–49. [Google Scholar] [CrossRef]
- Rice, H. The Value of Developed Land Considered Vacant and Unimproved. Real Estate Rev. 1982, 37, 45–50. [Google Scholar]
- Özdilek, Ü. An overview of the enquiries on the issue of apportionment of value between land and improvements. J. Prop. Res. 2011, 29, 69–84. [Google Scholar] [CrossRef]
- Ratcliff, R.U. A Neoteric View of the Appraisal Function. Apprais. J. 1965, 35, 167–175. [Google Scholar]
- Hodges, M.B. Three Approaches? Apprais. J. 1993, 61, 553–564. [Google Scholar]
- Kumar, R.; Singh, S.; Bilga, P.S.; Singh, J.; Singh, S.; Scutaru, M.-L.; Pruncu, C.I. Revealing the benefits of entropy weights method for multi-objective optimization in machining operations: A critical review. J. Mater. Res. Technol. 2021, 10, 1471–1492. [Google Scholar] [CrossRef]
- Singh, V.P. The Entropy Theory as a Tool for Modeling and Decision-Making in Environmental and Water Resources; Texas A&M University Libraries: Station, TX, USA, 2000. [Google Scholar]
- Srdjevic, B.; Medeiros, Y.; Faria, A. An objective multi-criteria evaluation of water management scenarios. Water Resour. Manag. 2004, 18, 35–54. [Google Scholar] [CrossRef]
- Zhu, Y.; Tian, D.; Yan, F. Effectiveness of entropy weight method in decision-making. Math. Probl. Eng. 2020, 2020, 3564835. [Google Scholar] [CrossRef]
- Rao, R.; Yadava, V.J.O. Multi-objective optimization of Nd: YAG laser cutting of thin superalloy sheet using grey relational analysis with entropy measurement. Opt. Laser Technol. 2009, 41, 922–930. [Google Scholar] [CrossRef]
- Furuichi, S. Information Theoretical Properties of Tsallis Entropies. J. Math. Phys. 2006, 47, 023302. [Google Scholar] [CrossRef]
- Havrda, J.; Charvát, F. Quantifcation method of classifcation processes. Concept of structural a-entropy. Kybernetika 1967, 3, 30–35. [Google Scholar]
- Tsallis, C. Possible Generalization of Boltzmann & Gibbs Statistics. J. Stat. Phys. 1998, 52, 479. [Google Scholar] [CrossRef]
- Shim, J.W. Entropy formula of N-body system. Sci. Rep. 2020, 10, 14029. [Google Scholar] [CrossRef] [PubMed]
- Kullback, S.; Leibler, R.A. On information and sufficiency. Ann. Math. Stat. 1951, 22, 79–86. [Google Scholar] [CrossRef]
- Shiller, R.J. Irrational Exuberance, 3rd ed.; Princeton University Press: Princeton, NJ, USA, 2015. [Google Scholar]
- Orrell, D. Quantum Economics: The New Science of Money; Icon Books: Duxford, UK, 2019; ISBN 9781785785085. [Google Scholar]


| Response | Method A SCA | Method B CSA | Method C ICA |
|---|---|---|---|
| 1 | 285,425 | 204,963 | 243,519 |
| 2 | 298,389 | 170,446 | 236,968 |
| 3 | 223,802 | 154,940 | 225,295 |
| 4 | 240,973 | 191,293 | 348,844 |
| 5 | 335,451 | 244,491 | 314,565 |
| 6 | 329,842 | 332,542 | 158,925 |
| 7 | 349,707 | 336,634 | 95,488 |
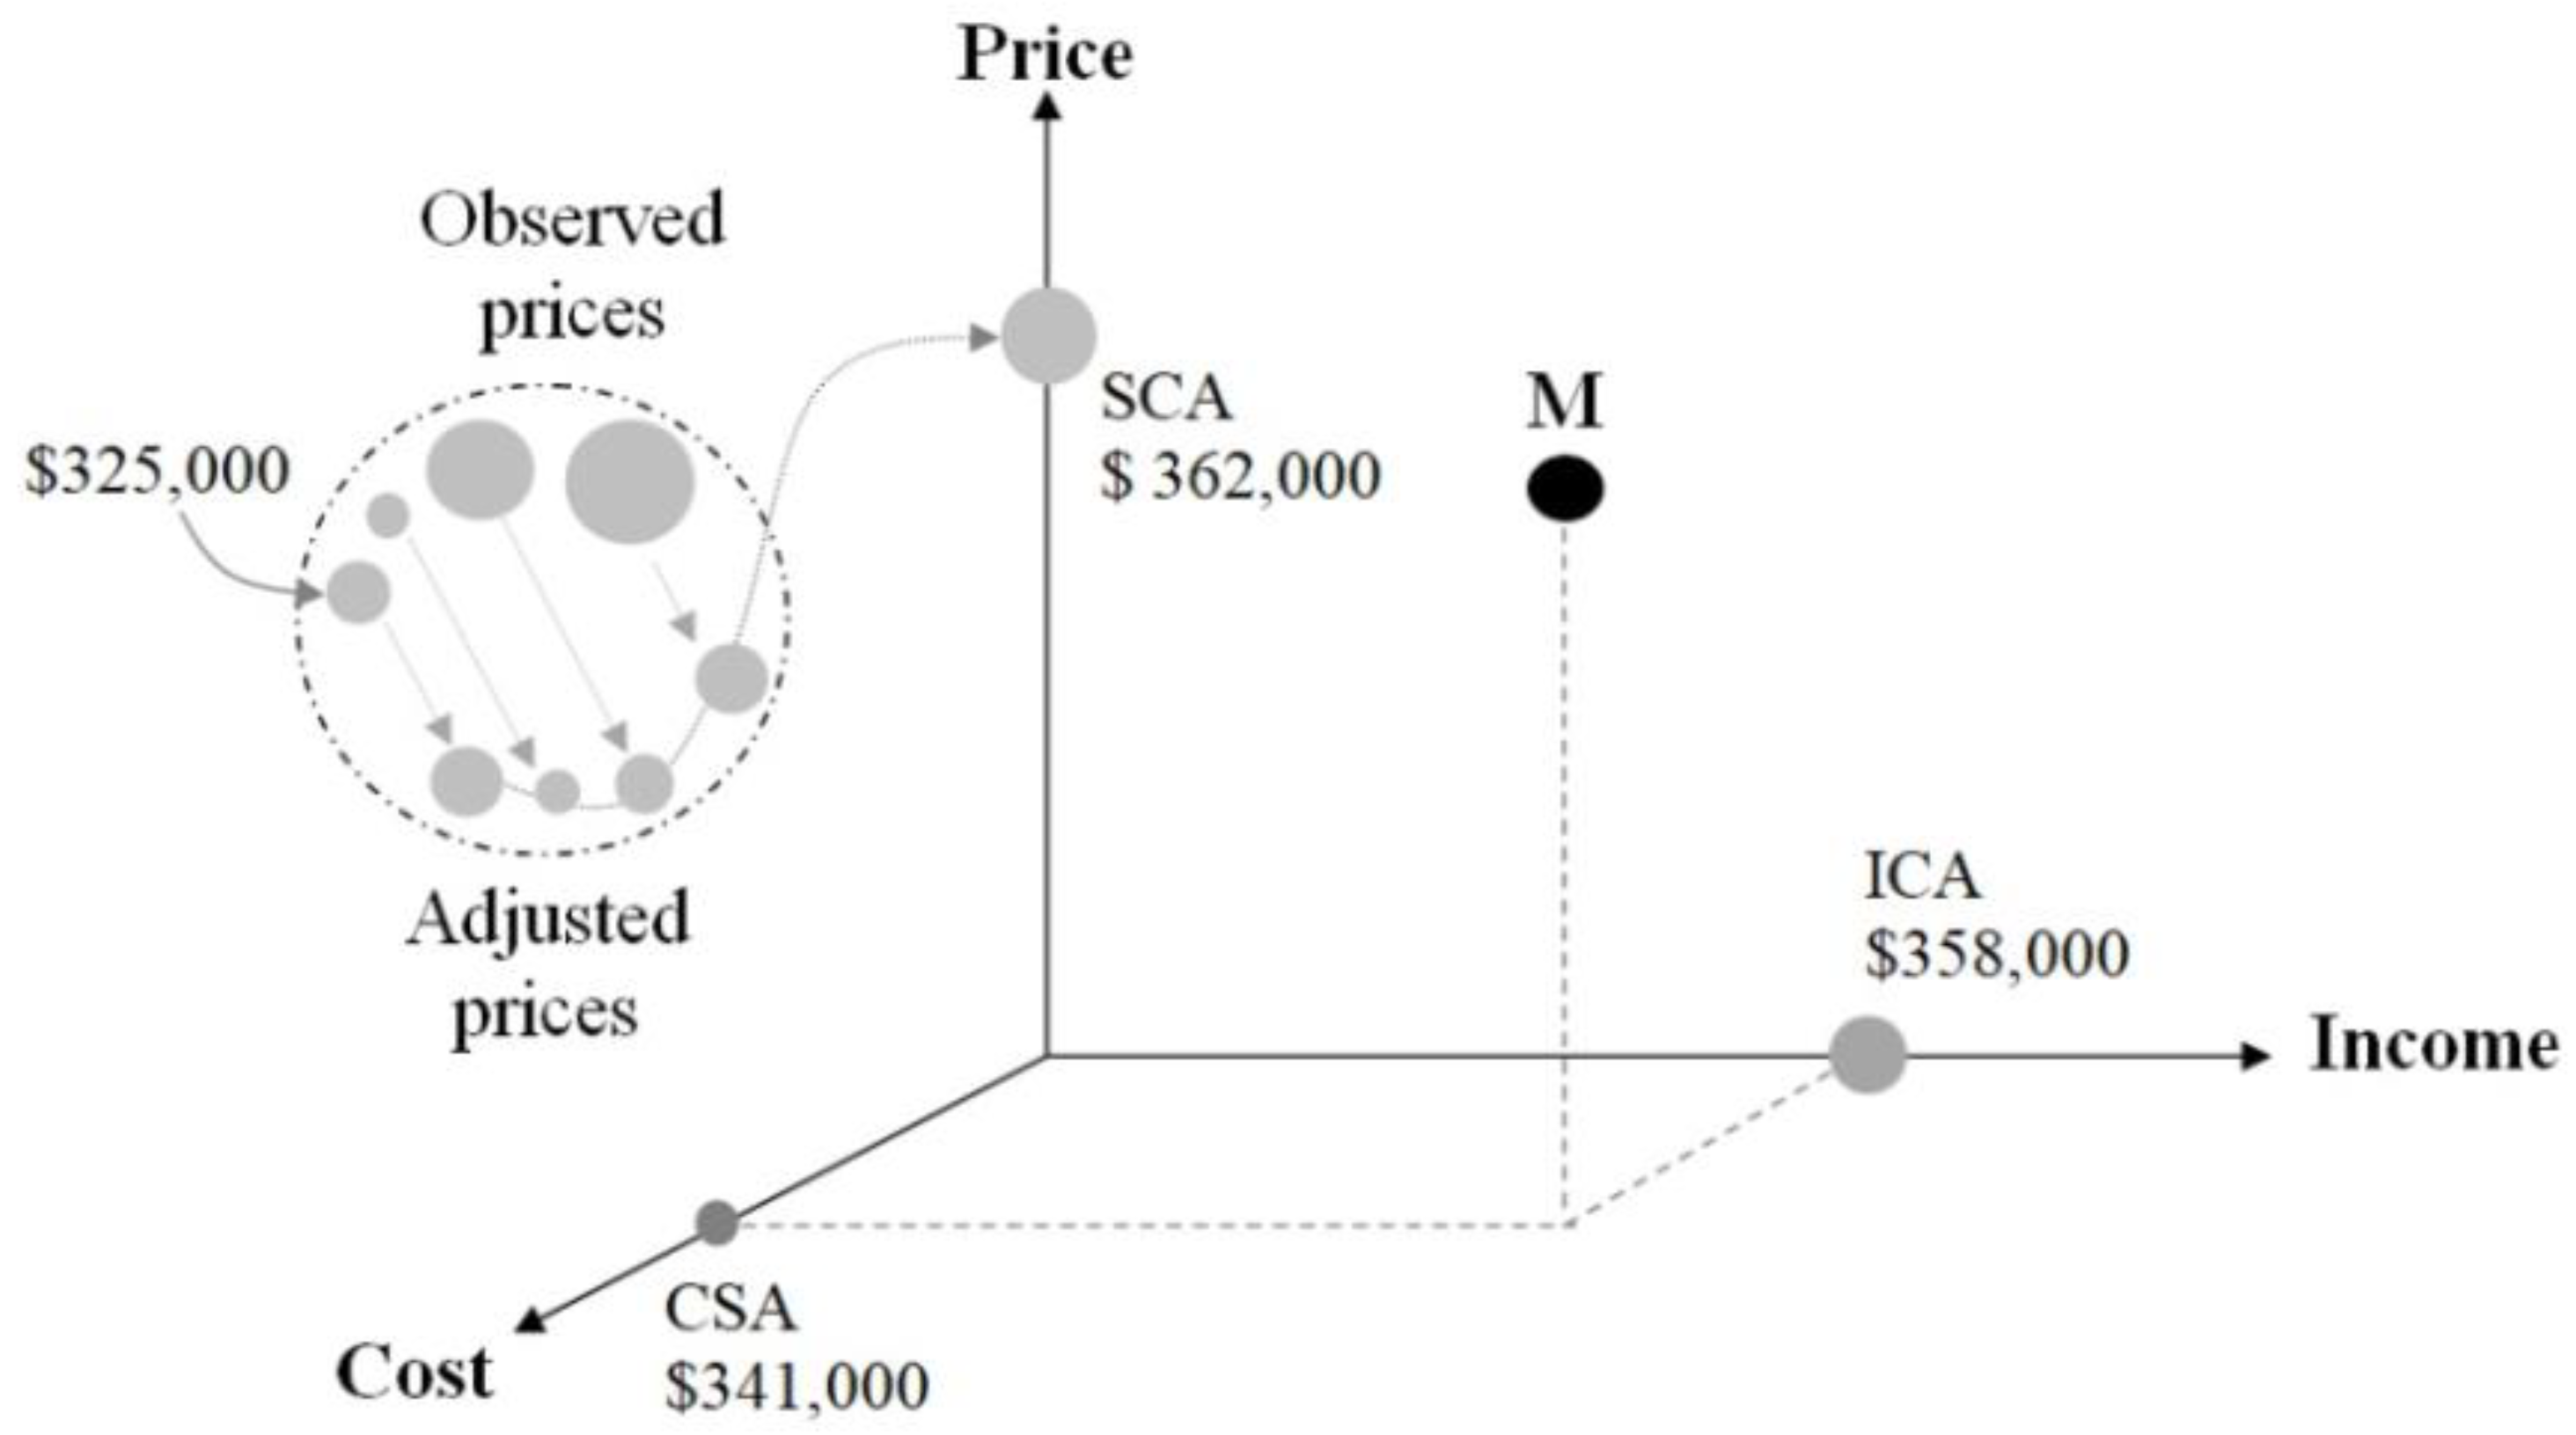
| 8 | 361,660 | 341,000 | 358,000 |
| 9 | 335,700 | 310,398 | 198,564 |
| 10 | 373,234 | 344,628 | 410,248 |
| Average | 313,418 | 263,133 | 259,042 |
| Maximum | 373,234 | 344,628 | 410,248 |
| Minimum | 223,802 | 154,940 | 95,488 |
| Exp. No. | SCA Normalized | CSA Normalized | ICA Normalized | SCA Norm. Probability | CSA Norm. Probability | ICA Norm. Probability | SCA Entropy | CSA Entropy | ICA Entropy |
|---|---|---|---|---|---|---|---|---|---|
| 1 | 0.765 | 0.595 | 0.392 | 0.091 | 0.078 | 0.090 | −0.218 | −0.199 | −0.216 |
| 2 | 0.799 | 0.495 | 0.403 | 0.095 | 0.065 | 0.092 | −0.224 | −0.177 | −0.220 |
| 3 | 0.600 | 0.450 | 0.424 | 0.071 | 0.059 | 0.097 | −0.188 | −0.167 | −0.226 |
| 4 | 0.646 | 0.555 | 0.274 | 0.077 | 0.073 | 0.063 | −0.197 | −0.191 | −0.173 |
| 5 | 0.899 | 0.709 | 0.304 | 0.107 | 0.093 | 0.069 | −0.239 | −0.221 | −0.185 |
| 6 | 0.884 | 0.965 | 0.601 | 0.105 | 0.126 | 0.137 | −0.237 | −0.261 | −0.273 |
| 7 | 0.937 | 0.977 | 1.000 | 0.112 | 0.128 | 0.228 | −0.245 | −0.263 | −0.337 |
| 8 | 0.969 | 0.989 | 0.267 | 0.115 | 0.130 | 0.061 | −0.249 | −0.265 | −0.170 |
| 9 | 0.899 | 0.901 | 0.481 | 0.107 | 0.118 | 0.110 | −0.239 | −0.252 | −0.243 |
| 10 | 1.000 | 1.000 | 0.233 | 0.119 | 0.131 | 0.053 | −0.253 | −0.266 | −0.156 |
| SUM | 8.397 | 7.635 | 4.377 | 1.000 | 1.000 | 1.000 | −2.290 | −2.262 | −2.199 |
| Fomulas and Calculations | Sum | |||
|---|---|---|---|---|
| −2.2905 | −2.2619 | −2.1992 | ||
| 0.4343 | 0.4343 | 0.4343 | ||
| 0.9947 | 0.9823 | 0.9551 | ||
| 0.1662 | 0.1648 | −0.1614 | ||
| 0.8285 | 0.8176 | 1.1165 | 2.763 | |
| Weight (w) | 0.2999 | 0.2959 | 0.4041 | 1.000 |
| Weight (w) in % | 30.0 | 29.6 | 40.4 | |
| Maximum of PCI | 373,234 | 344,628 | 410,248 | |
| Contributions | 111,937 | 101,990 | 165,800 | 379,727 |
| Exp. No. | Entropy SCA | Entropy CSA | Entropy ICA | Pi | Ln(pi + 1) − Ln(pi) | Yi = Pi*^(Ln(pi + 1) − Ln(pi)) | 1/Yi | ||
|---|---|---|---|---|---|---|---|---|---|
| 1 | −0.218 | −0.199 | −0.216 | 0.000 | 0.710 | 0.500 | 2.000 | ||
| 2 | −0.224 | −0.177 | −0.220 | 0.693 | 0.693 | 0.480 | 2.081 | ||
| 3 | −0.188 | −0.167 | −0.226 | 1.099 | 0.405 | 0.445 | 2.245 | ||
| 4 | −0.197 | −0.191 | −0.173 | 1.386 | 0.288 | 0.399 | 2.507 | ||
| 5 | −0.239 | −0.221 | −0.185 | 1.609 | 0.223 | 0.359 | 2.784 | ||
| 6 | −0.237 | −0.261 | −0.273 | 1.792 | 0.182 | 0.327 | 3.061 | ||
| 7 | −0.245 | −0.263 | −0.337 | 1.946 | 0.154 | 0.300 | 3.334 | ||
| 8 | −0.249 | −0.265 | −0.170 | 2.079 | 0.134 | 0.278 | 3.601 | ||
| 9 | −0.239 | −0.252 | −0.243 | 2.197 | 0.118 | 0.259 | 3.864 | ||
| 10 | −0.253 | −0.266 | −0.156 | 2.303 | 0.105 | 0.243 | 4.122 | ||
| SUM of entropies | EW for SCA | EW for CSA | EW for ICA | ||||||
| −0.436 | −0.398 | −0.432 | 0.603 | 0.562 | 0.271 | 1.436 | 0.420 | 0.392 | 0.189 |
| −0.466 | −0.369 | −0.457 | 0.632 | 0.534 | 0.296 | 1.462 | 0.433 | 0.365 | 0.202 |
| −0.423 | −0.374 | −0.508 | 0.589 | 0.539 | 0.346 | 1.475 | 0.400 | 0.366 | 0.235 |
| −0.495 | −0.478 | −0.435 | 0.661 | 0.643 | 0.273 | 1.577 | 0.419 | 0.408 | 0.173 |
| −0.666 | −0.615 | −0.515 | 0.832 | 0.779 | 0.354 | 1.966 | 0.423 | 0.397 | 0.180 |
| −0.725 | −0.800 | −0.834 | 0.892 | 0.965 | 0.673 | 2.530 | 0.352 | 0.381 | 0.266 |
| −0.816 | −0.877 | −1.124 | 0.982 | 1.042 | 0.963 | 2.987 | 0.329 | 0.349 | 0.322 |
| −0.897 | −0.954 | −0.614 | 1.064 | 1.118 | 0.453 | 2.635 | 0.404 | 0.424 | 0.172 |
| −0.925 | −0.974 | −0.938 | 1.091 | 1.139 | 0.776 | 3.006 | 0.363 | 0.379 | 0.258 |
| −1.045 | −1.097 | −0.643 | 1.211 | 1.262 | 0.482 | 2.955 | 0.410 | 0.427 | 0.163 |
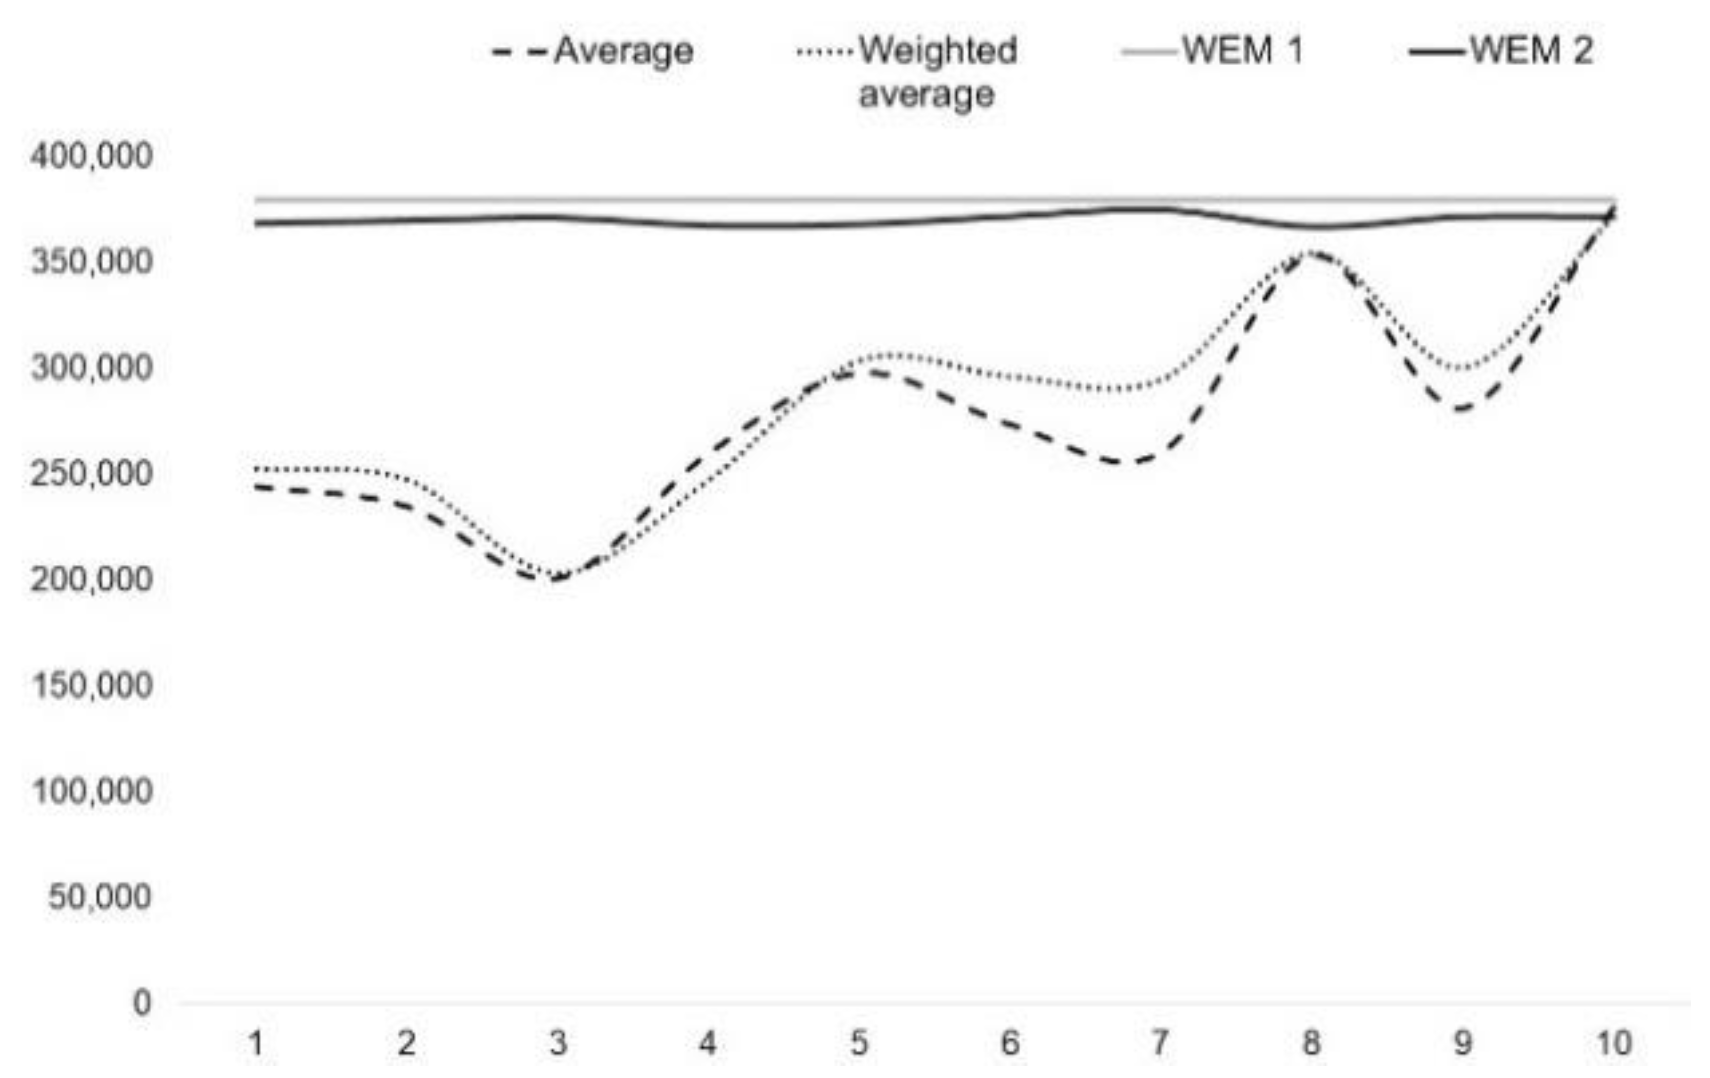
| Real Estate Appraisal | EWM | WEM 2 Adjustments | ||||
|---|---|---|---|---|---|---|
| Average | Weighted Average | WEM 1 | WEM 2 | Adjust. for SCA | Adjust. for CSA | Adjust. for ICA |
| 244,636 | 252,905 | 379,727 | 369,012 | 156,649 | 134,976 | 77,387 |
| 235,268 | 247,722 | 379,727 | 370,275 | 161,446 | 125,845 | 82,985 |
| 201,346 | 203,442 | 379,727 | 371,464 | 149,166 | 126,000 | 96,298 |
| 260,370 | 247,643 | 379,727 | 367,991 | 156,428 | 140,458 | 71,104 |
| 298,169 | 303,986 | 379,727 | 368,555 | 158,021 | 136,666 | 73,867 |
| 273,770 | 296,469 | 379,727 | 372,170 | 131,550 | 131,466 | 109,153 |
| 260,609 | 294,941 | 379,727 | 375,192 | 122,711 | 120,200 | 132,281 |
| 353,553 | 354,730 | 379,727 | 367,450 | 150,677 | 146,294 | 70,478 |
| 281,554 | 300,682 | 379,727 | 371,952 | 135,439 | 130,585 | 105,928 |
| 376,037 | 372,055 | 379,727 | 371,952 | 152,944 | 147,217 | 66,888 |
| 278,531 | 287,458 | 379,727 | 370,601 | 147,503 | 133,971 | 88,637 |
Disclaimer/Publisher’s Note: The statements, opinions and data contained in all publications are solely those of the individual author(s) and contributor(s) and not of MDPI and/or the editor(s). MDPI and/or the editor(s) disclaim responsibility for any injury to people or property resulting from any ideas, methods, instructions or products referred to in the content. |
© 2023 by the author. Licensee MDPI, Basel, Switzerland. This article is an open access article distributed under the terms and conditions of the Creative Commons Attribution (CC BY) license (https://creativecommons.org/licenses/by/4.0/).
Share and Cite
Özdilek, Ü. The Role of Thermodynamic and Informational Entropy in Improving Real Estate Valuation Methods. Entropy 2023, 25, 907. https://doi.org/10.3390/e25060907
Özdilek Ü. The Role of Thermodynamic and Informational Entropy in Improving Real Estate Valuation Methods. Entropy. 2023; 25(6):907. https://doi.org/10.3390/e25060907
Chicago/Turabian StyleÖzdilek, Ünsal. 2023. "The Role of Thermodynamic and Informational Entropy in Improving Real Estate Valuation Methods" Entropy 25, no. 6: 907. https://doi.org/10.3390/e25060907
APA StyleÖzdilek, Ü. (2023). The Role of Thermodynamic and Informational Entropy in Improving Real Estate Valuation Methods. Entropy, 25(6), 907. https://doi.org/10.3390/e25060907