
Visual Sorting of Express Packages Based on the Multi-Dimensional Fusion Method under Complex Logistics Sorting
Abstract
:1. Introduction
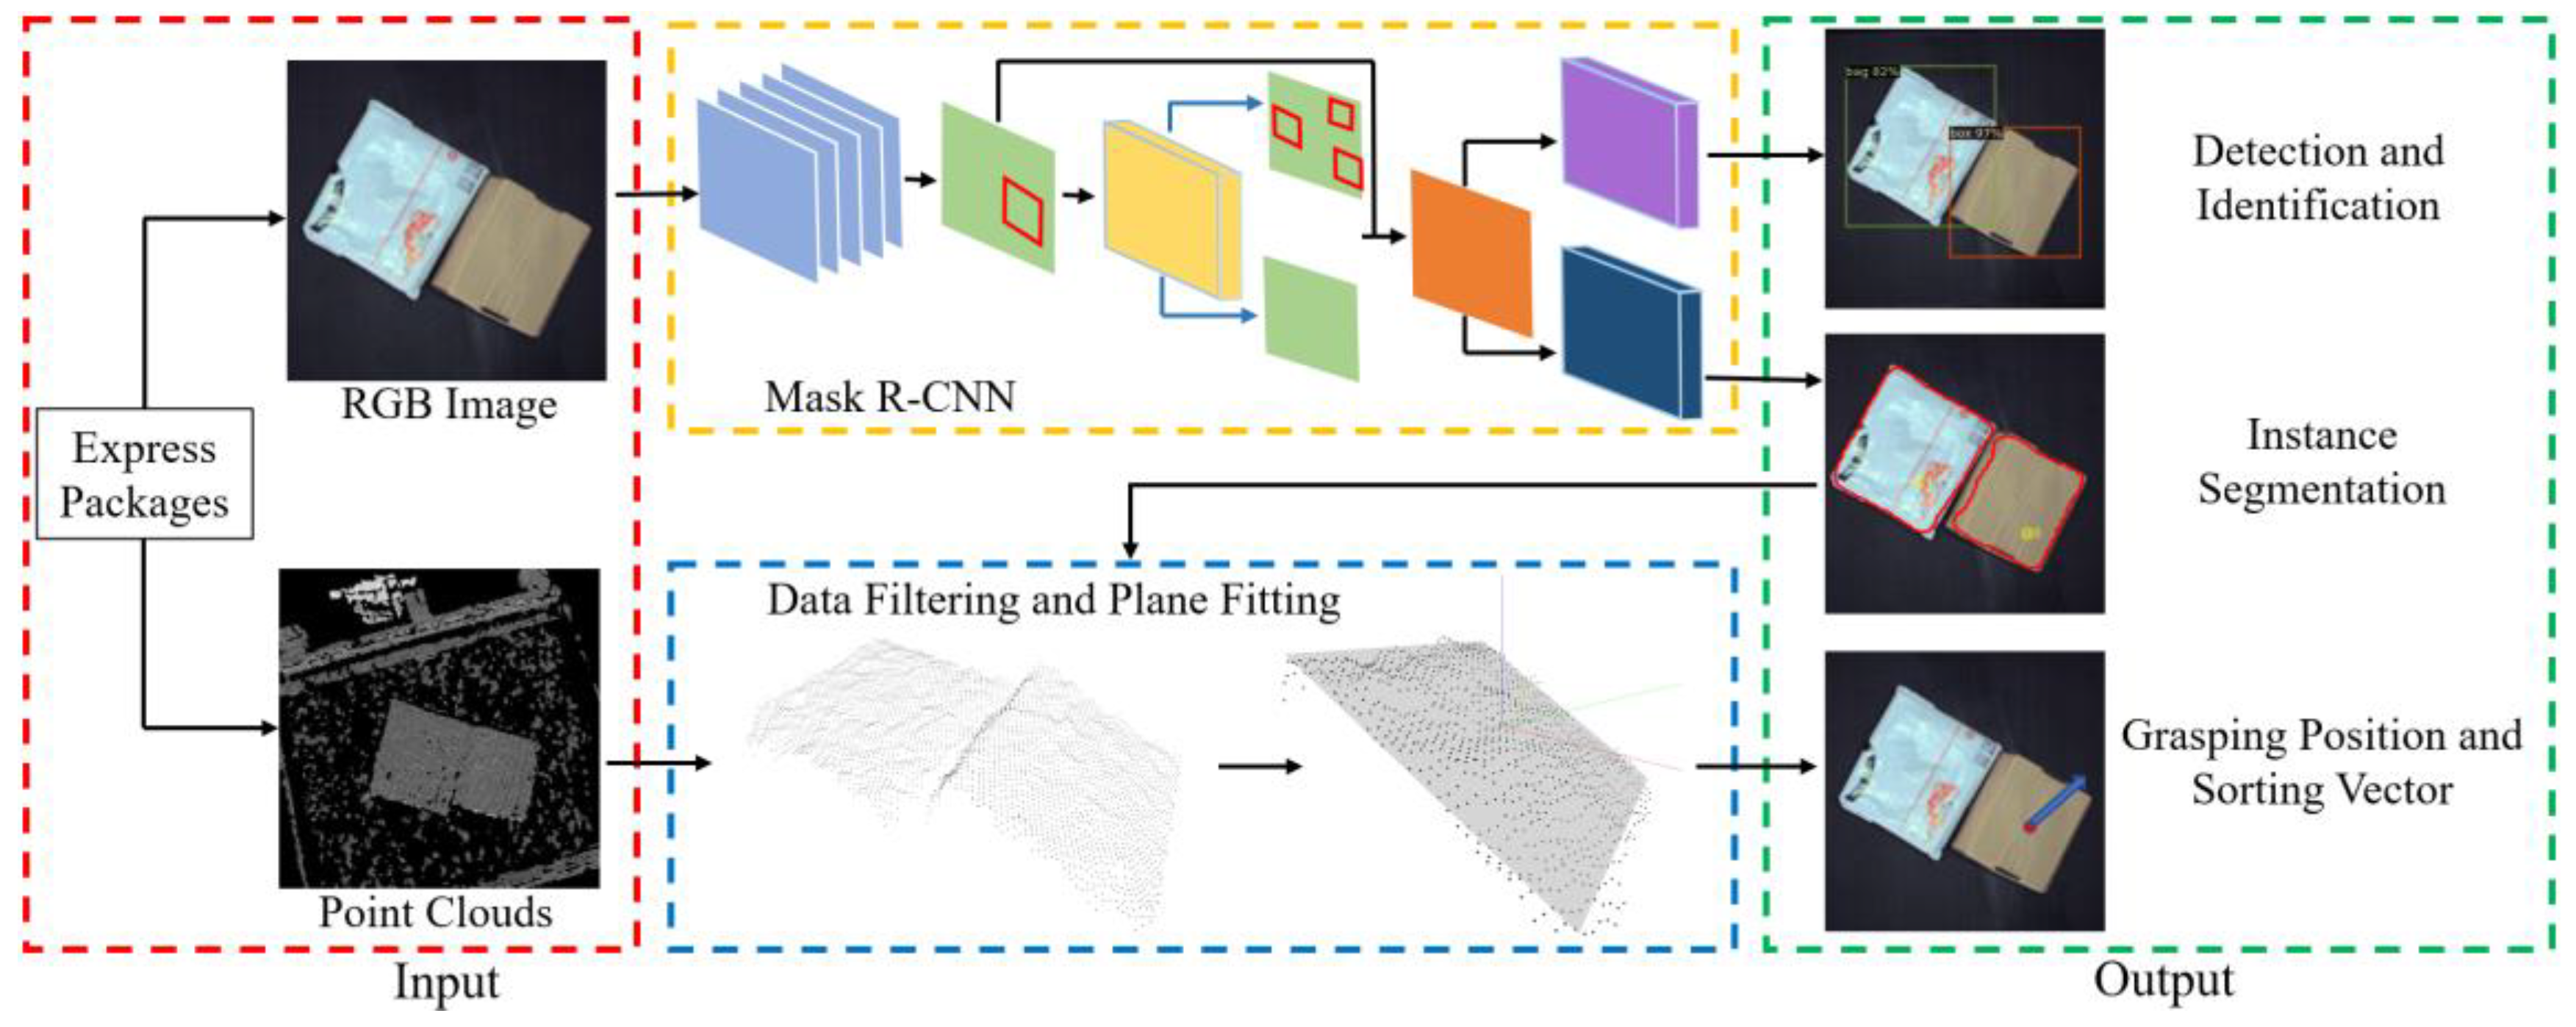
2. Method
2.1. Detection on Express Packages
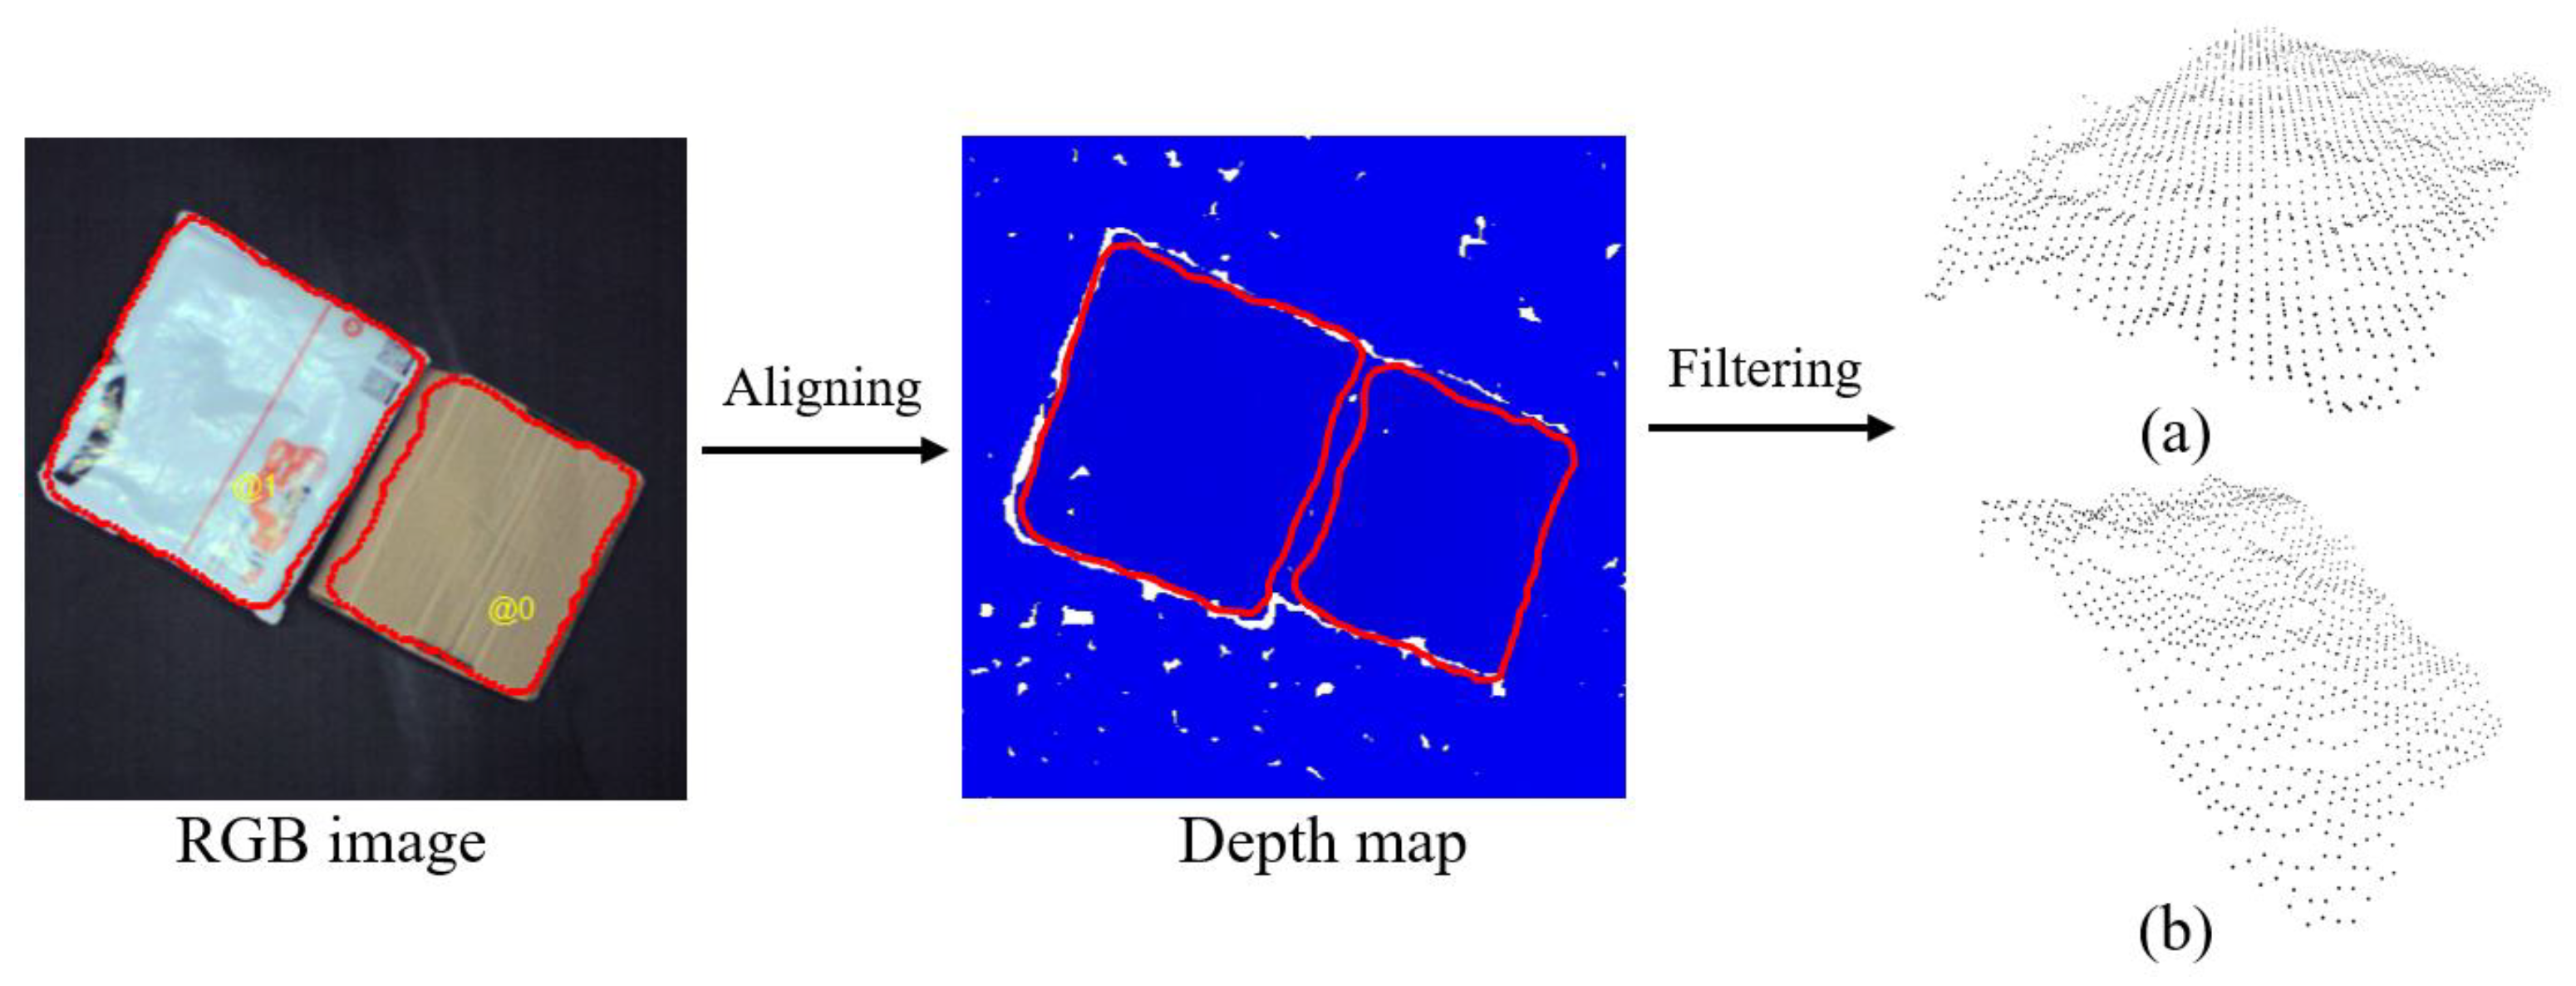
2.2. Method for Point Cloud Data Filtering
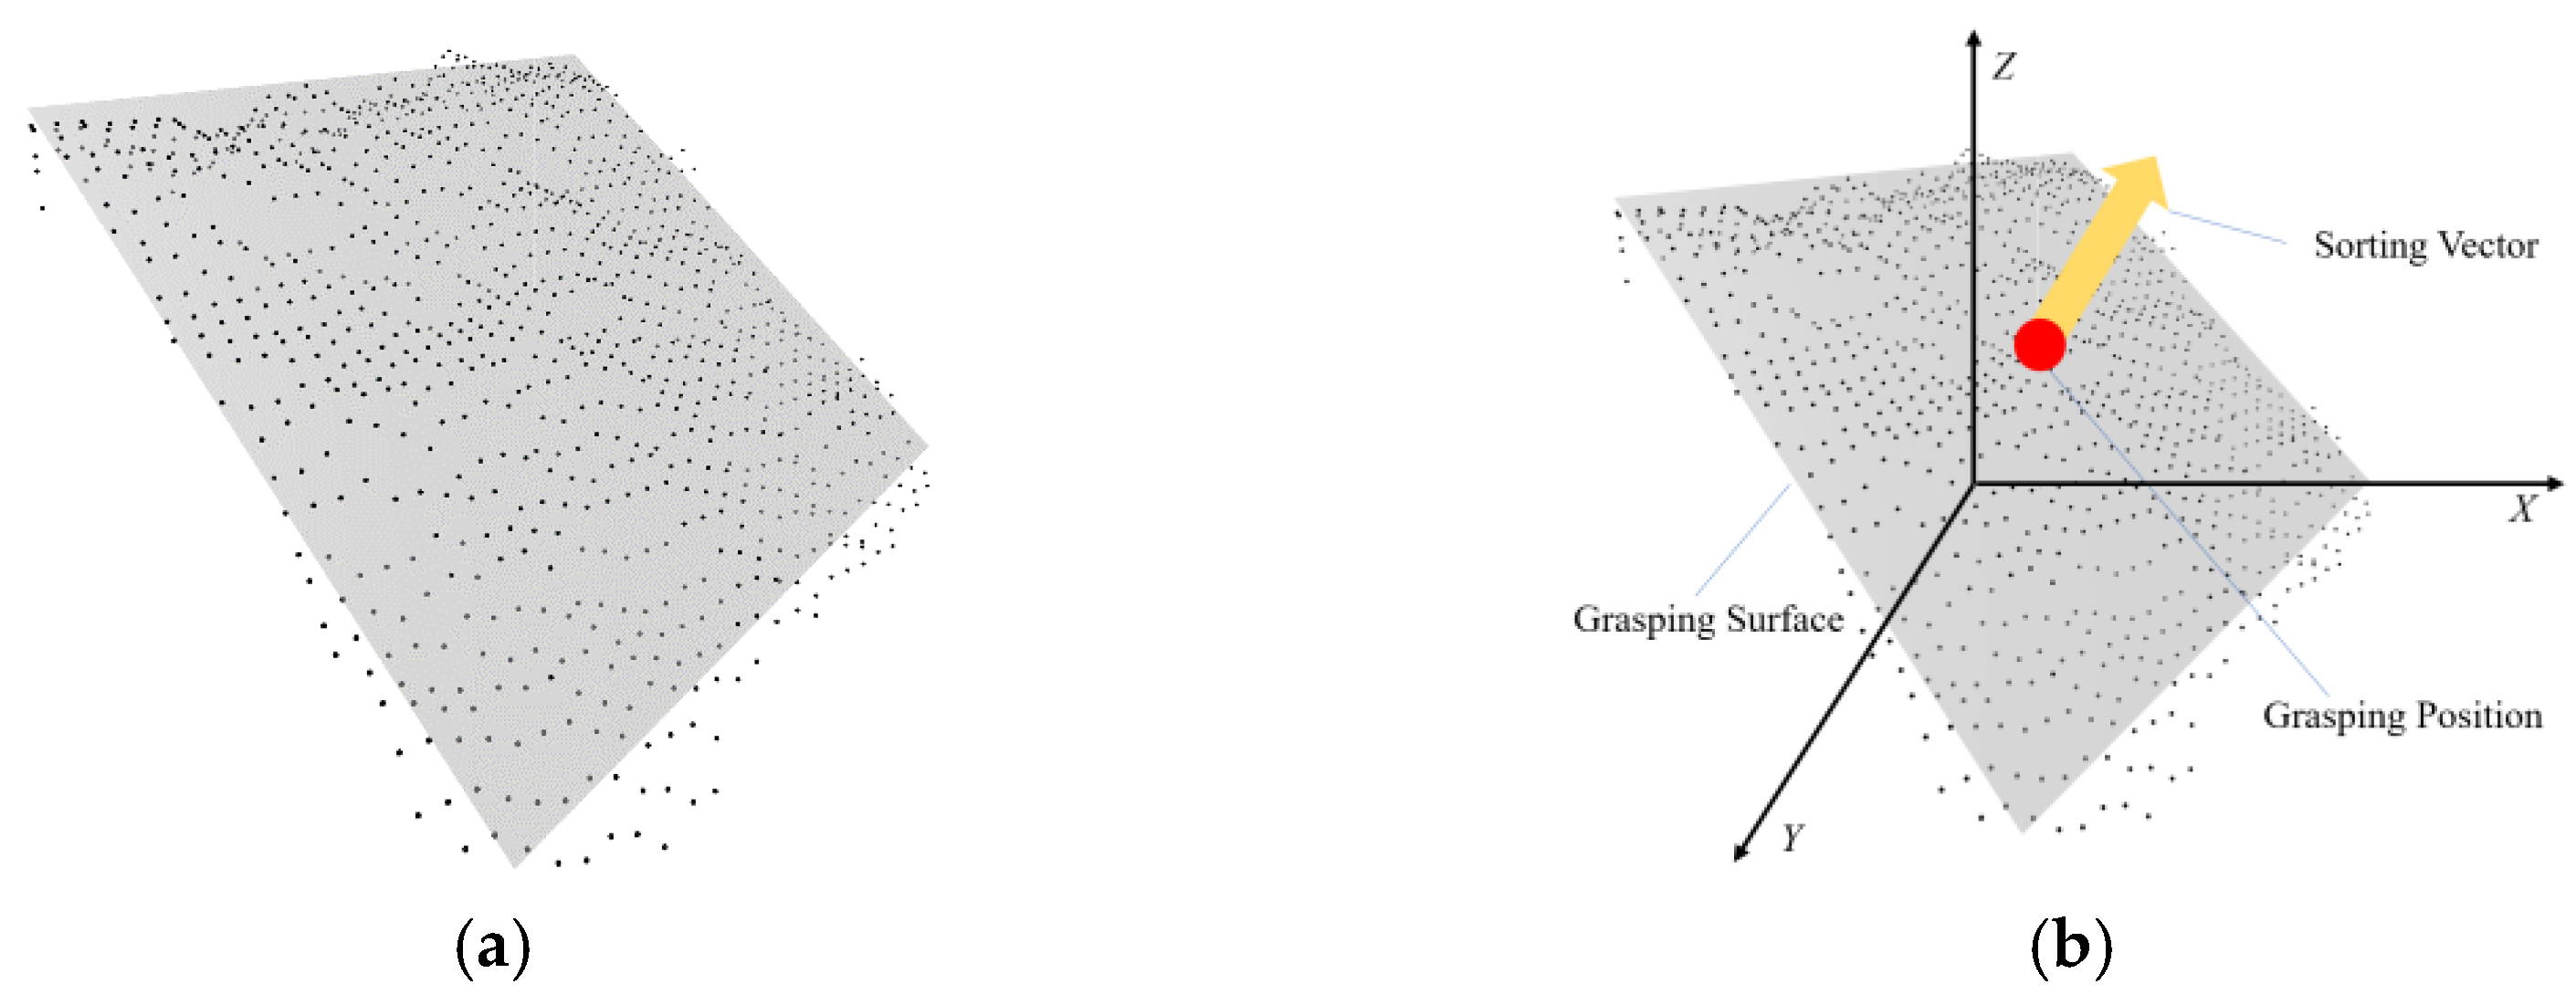
2.3. Plane Fitting and Sorting Information
3. Experiment and Analysis
3.1. Experiment on Mask R-CNN
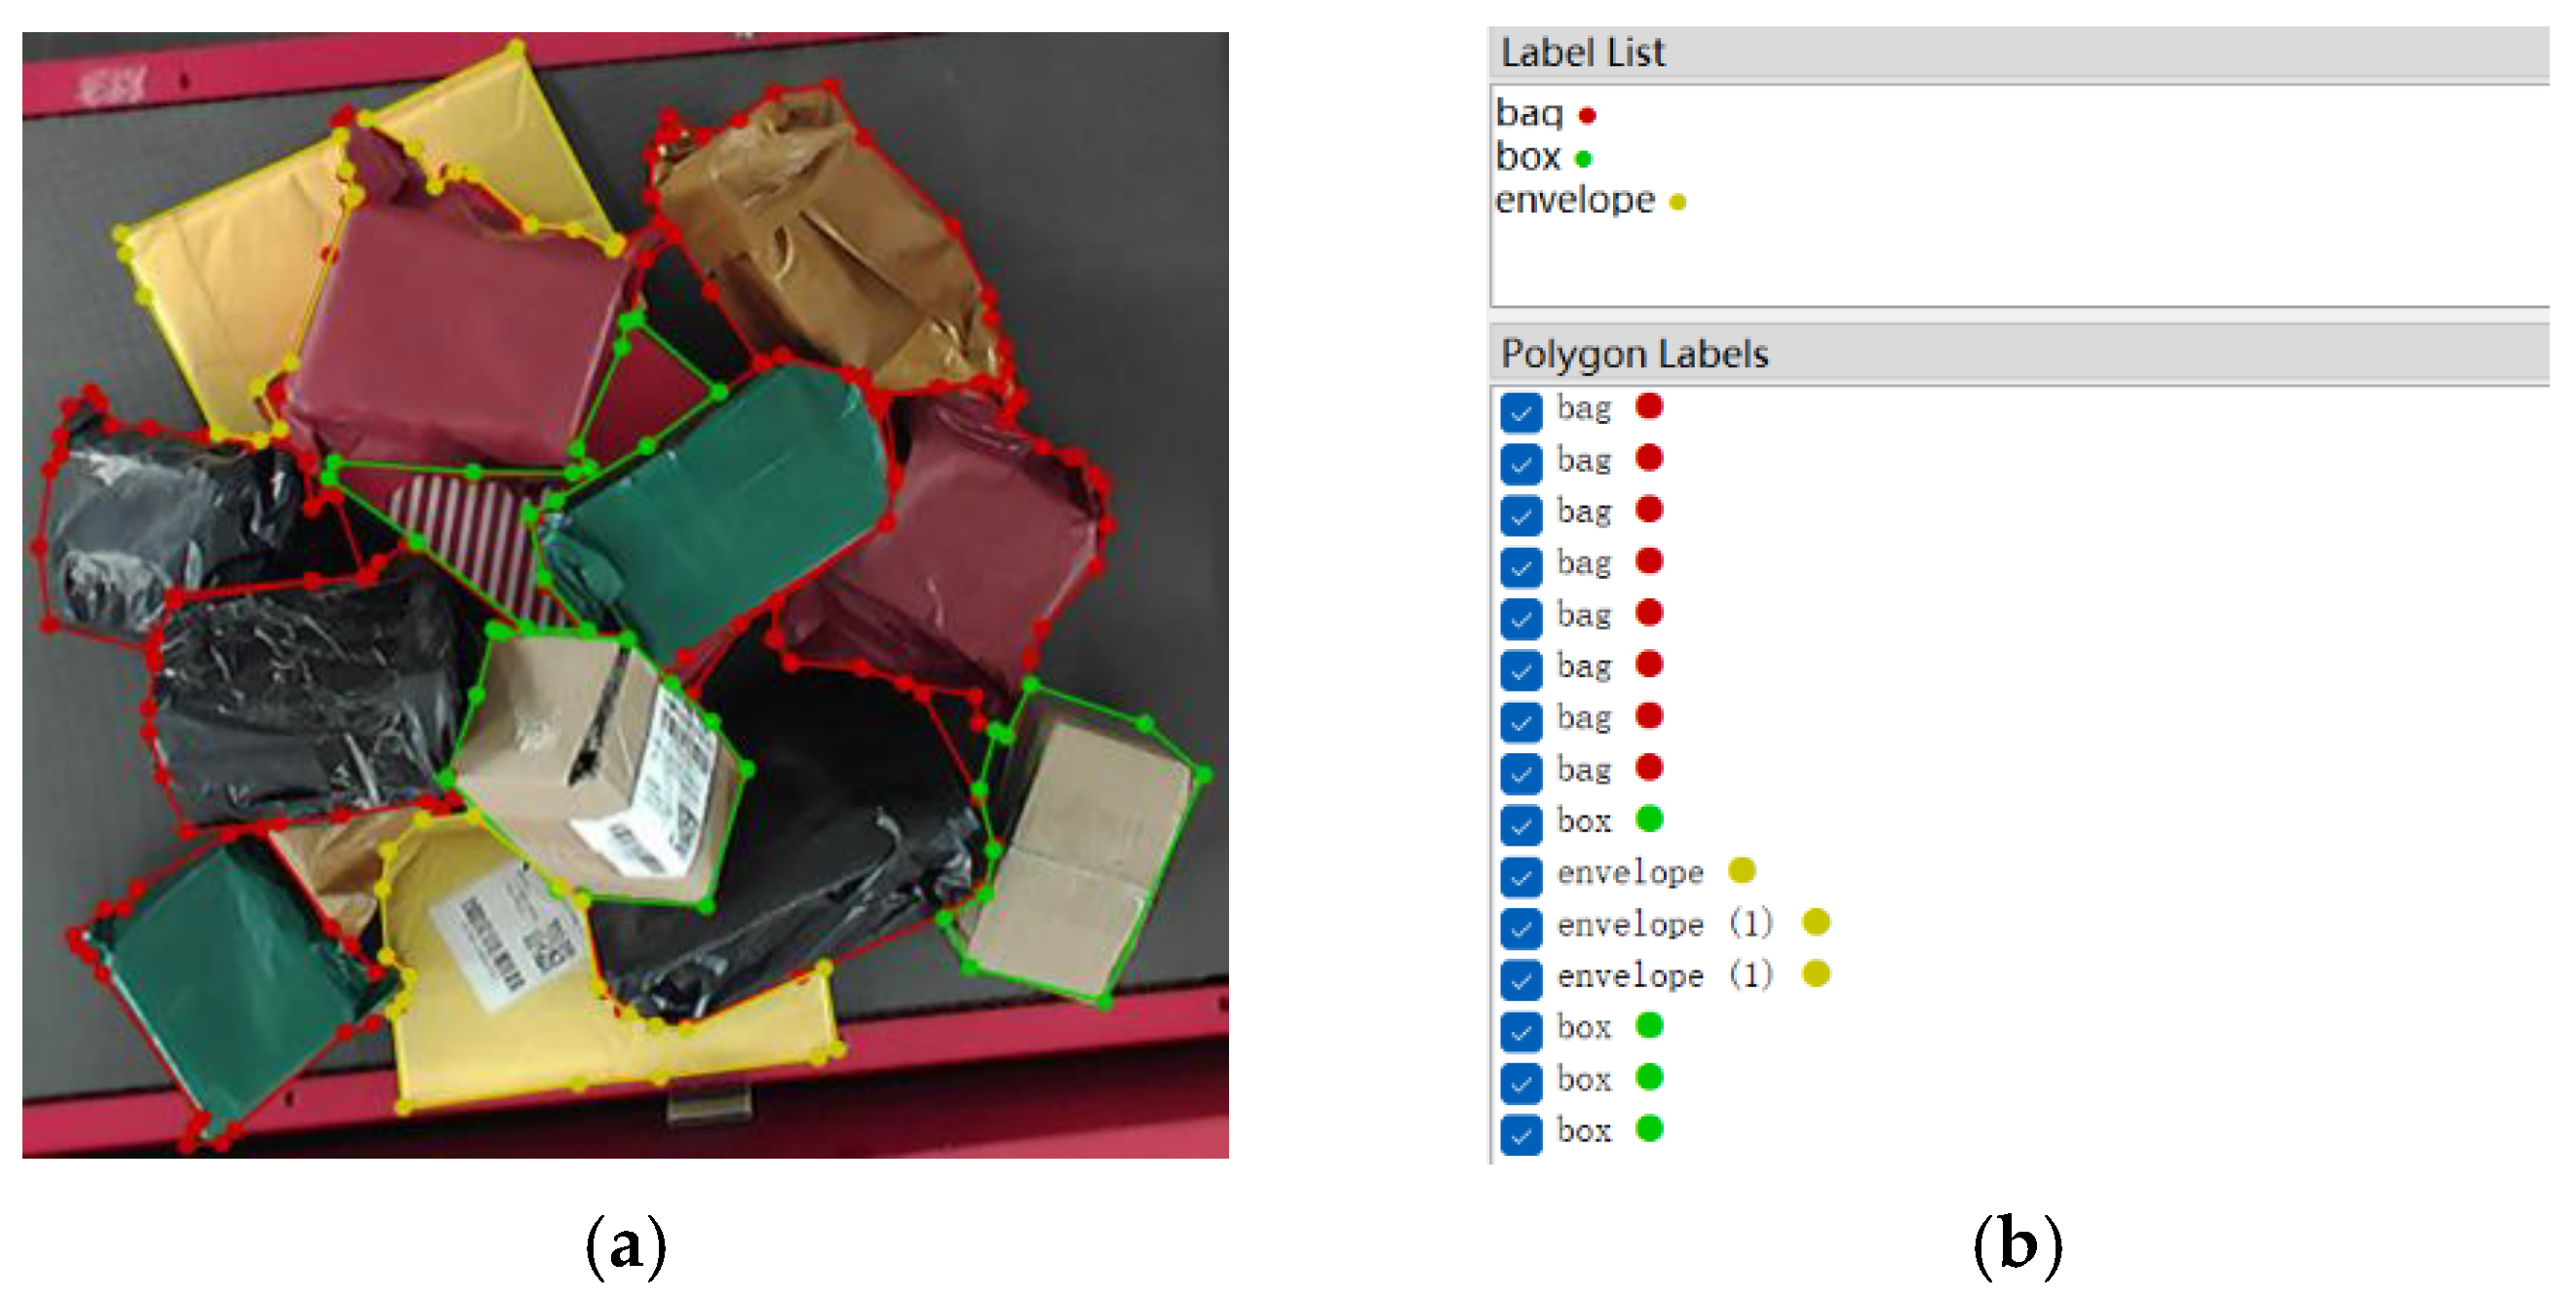
3.1.1. Data Processing and Dataset
3.1.2. Experiment Environment and Evaluation Indexes
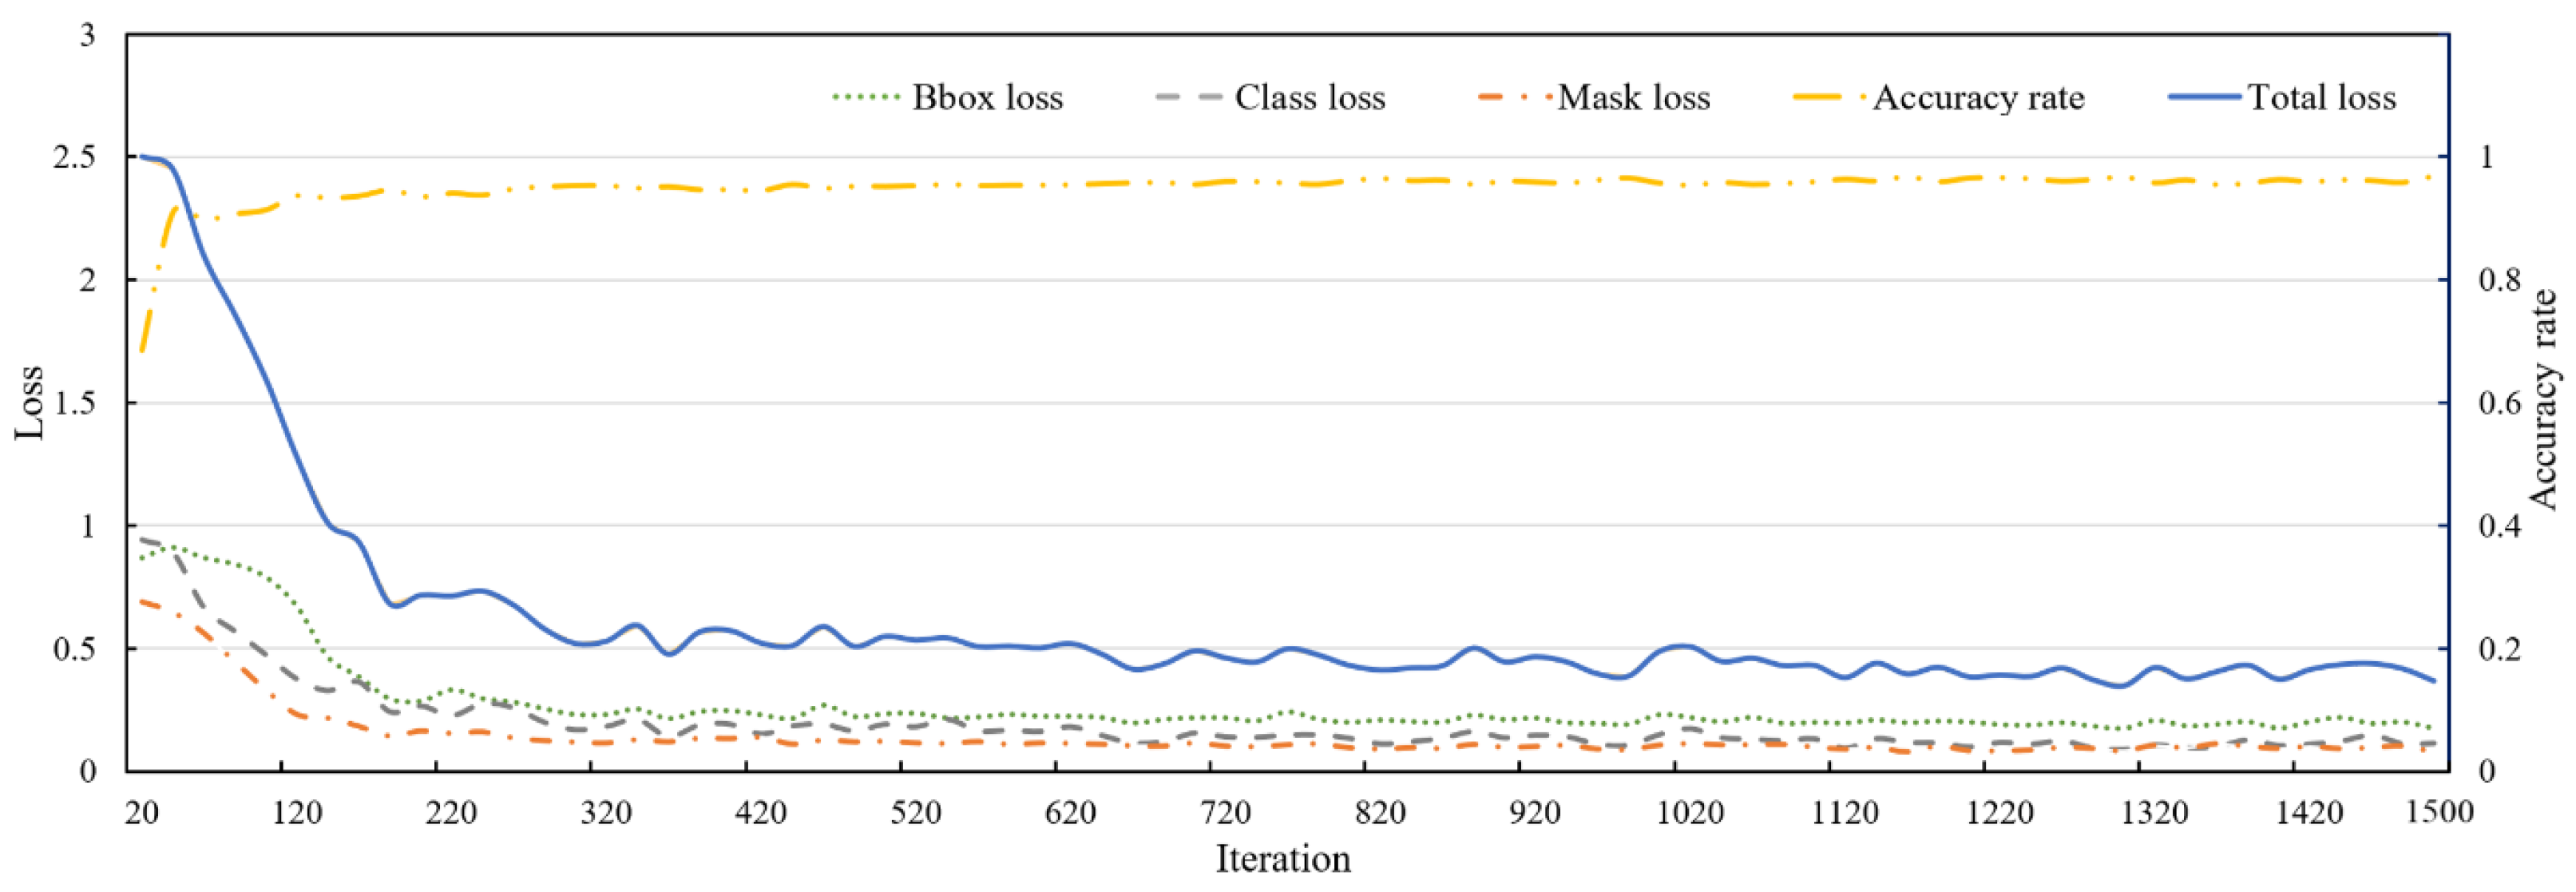
3.1.3. Model Training
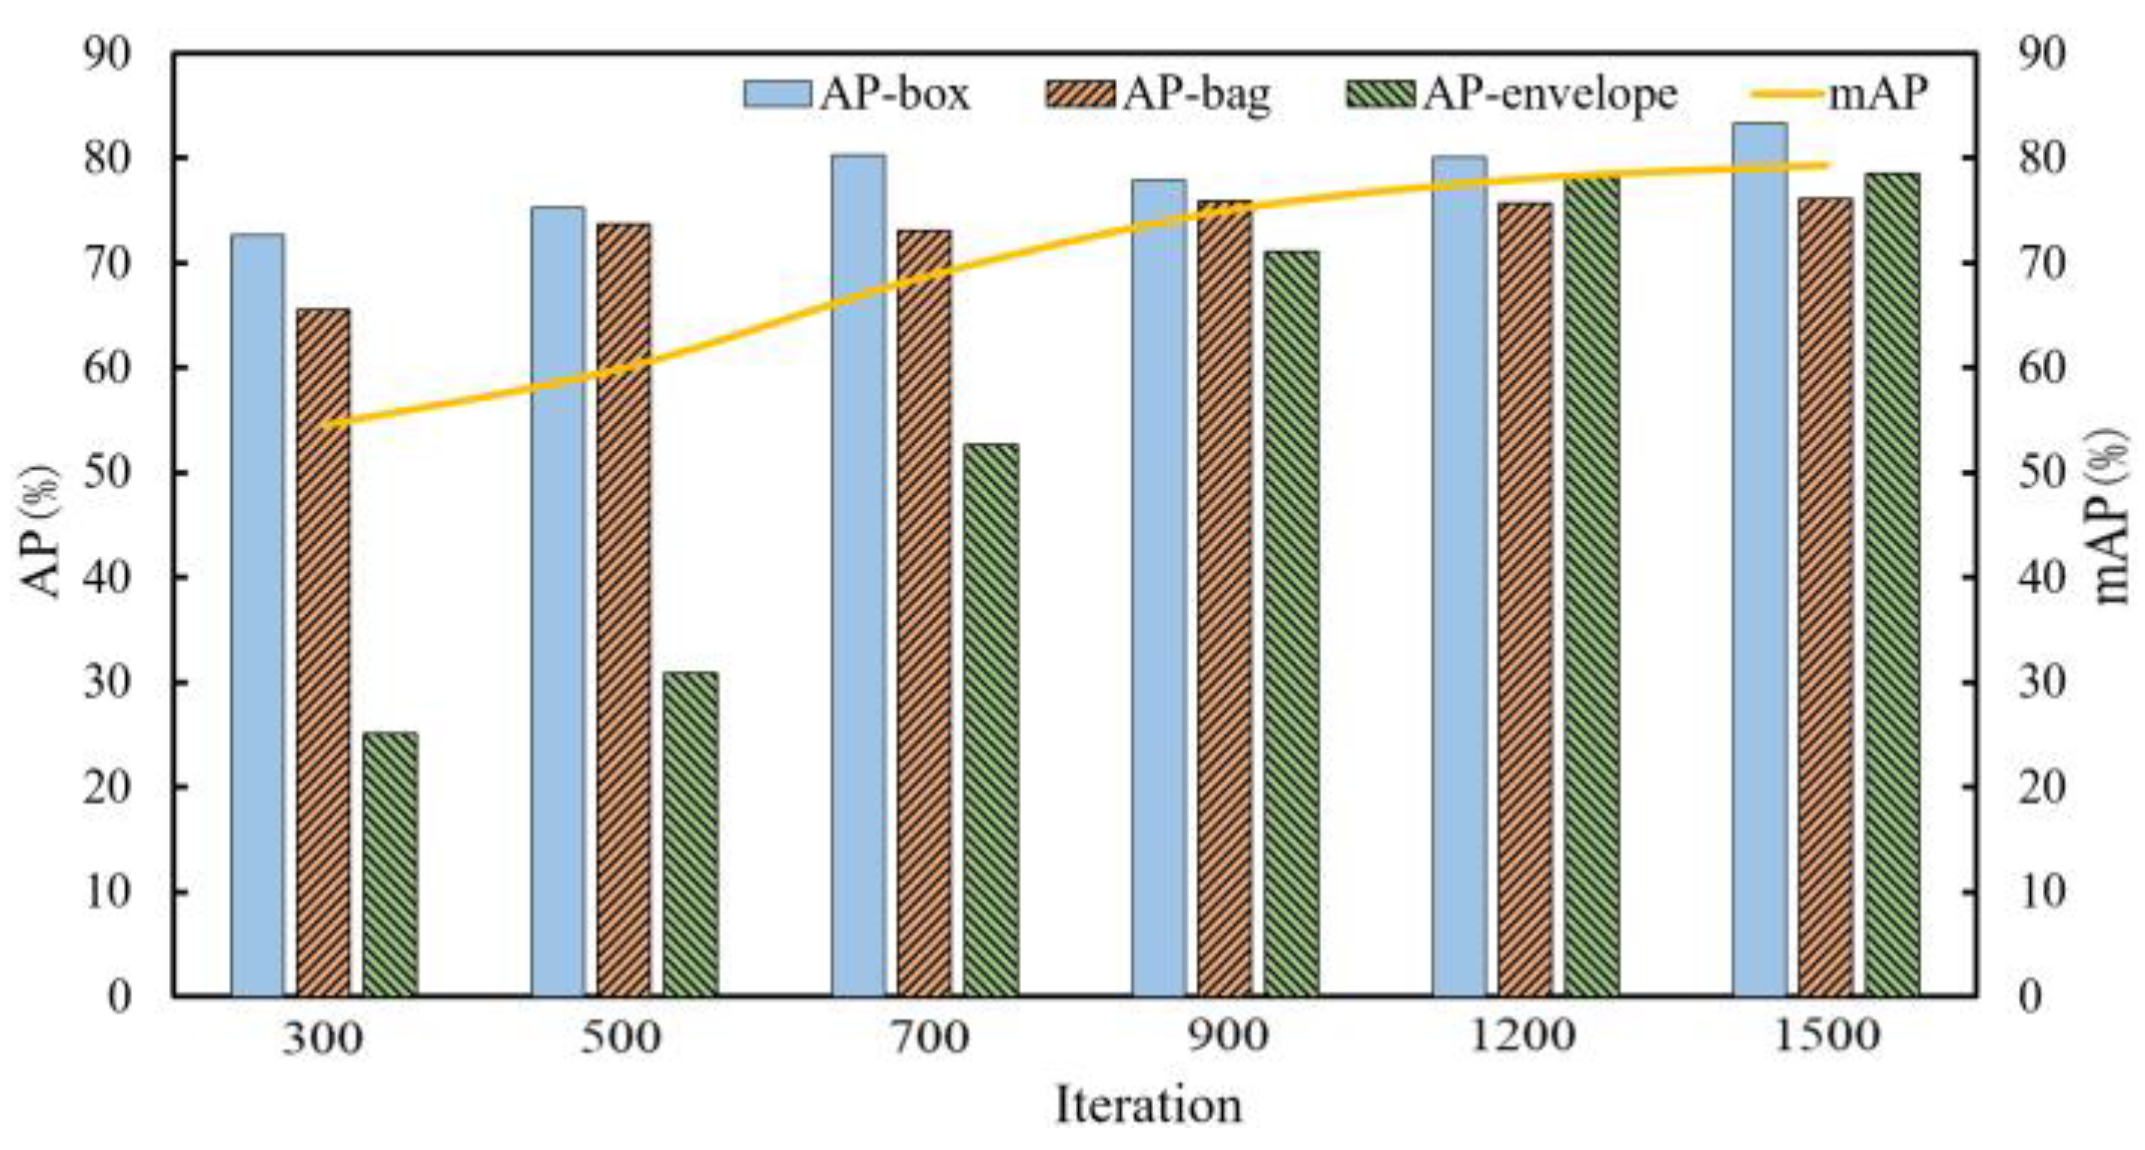
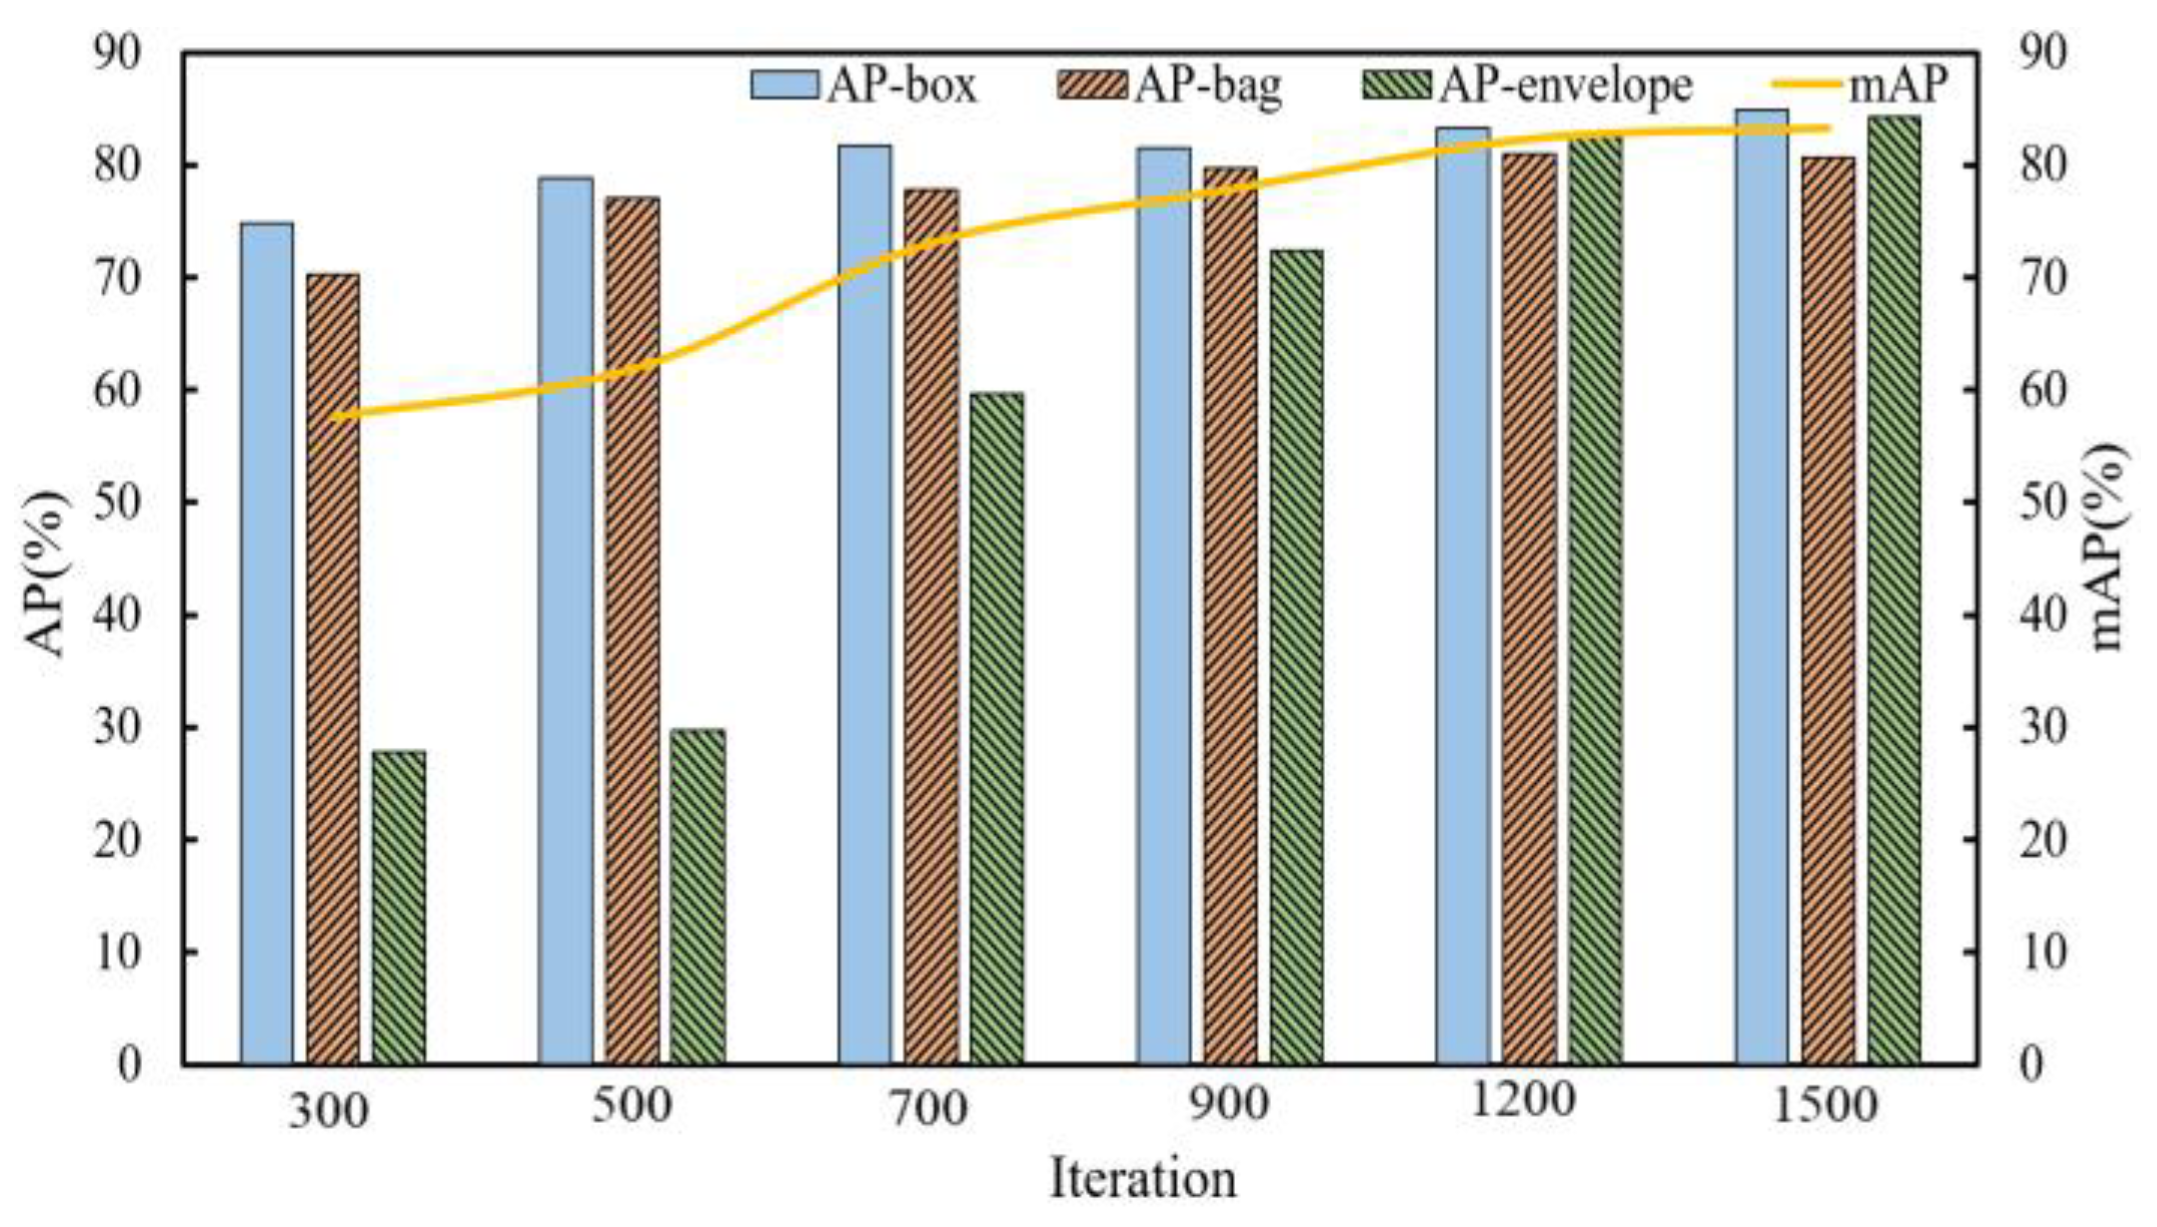
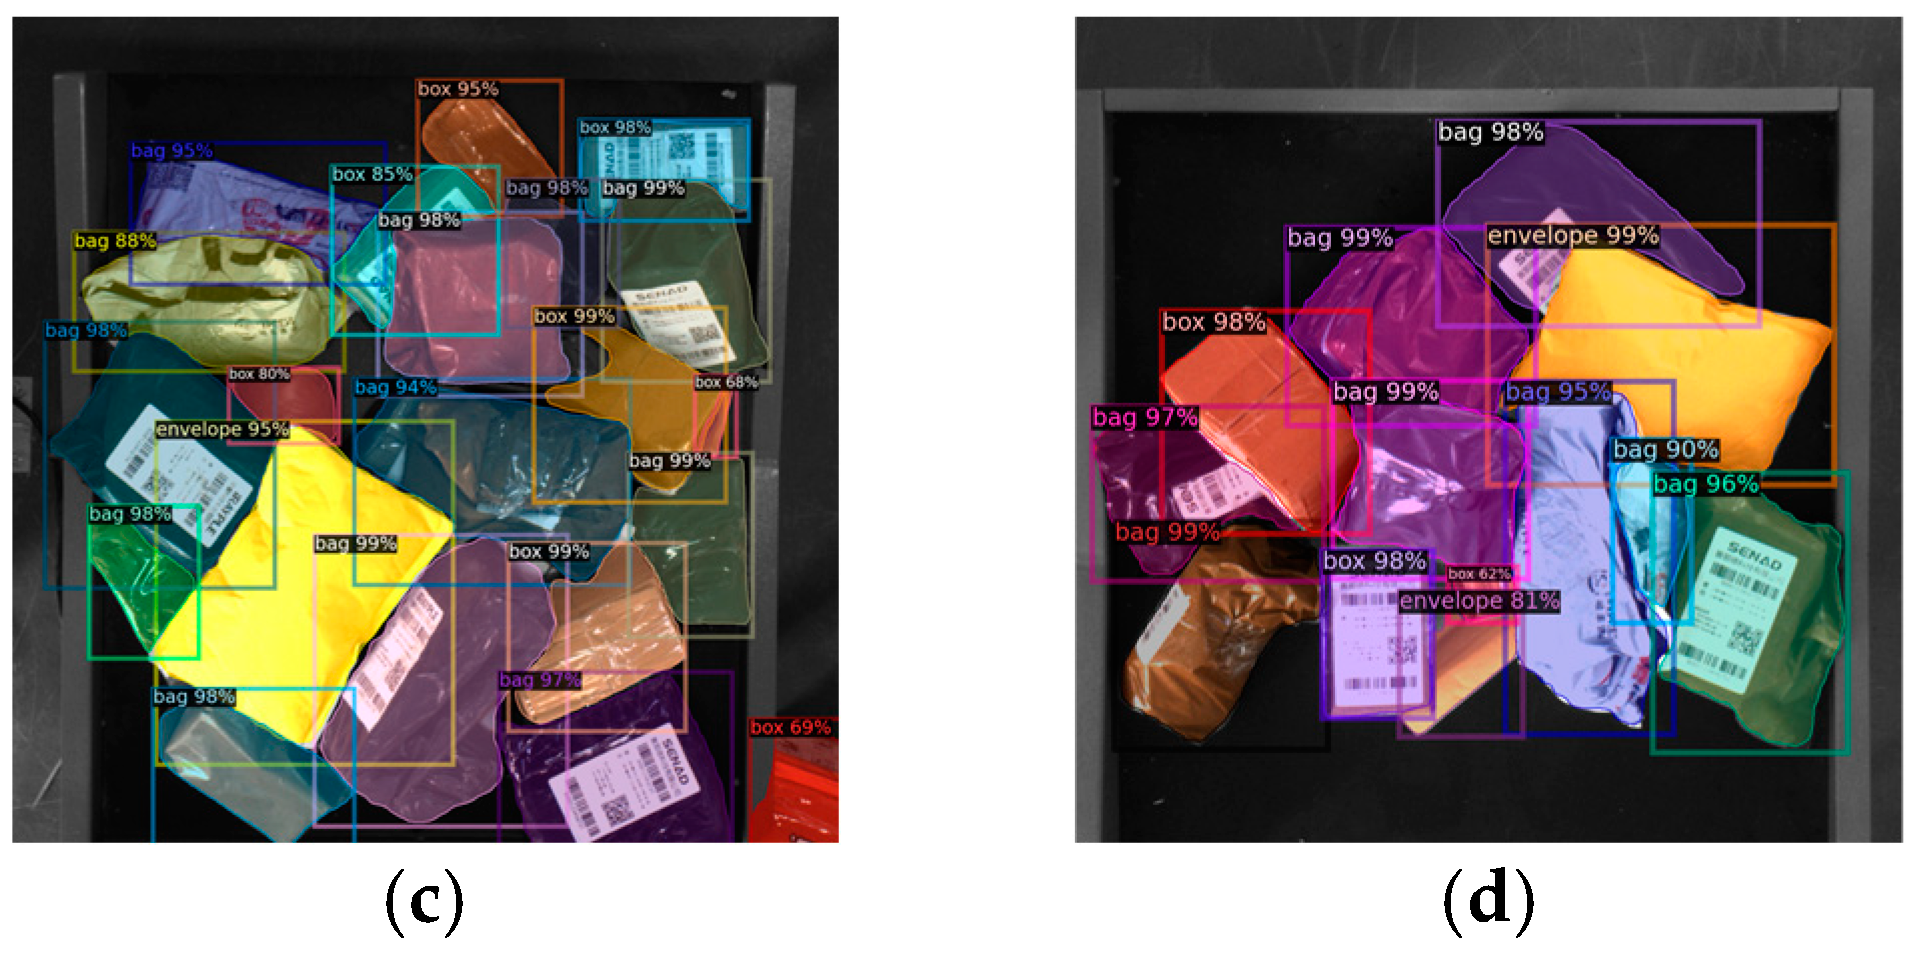
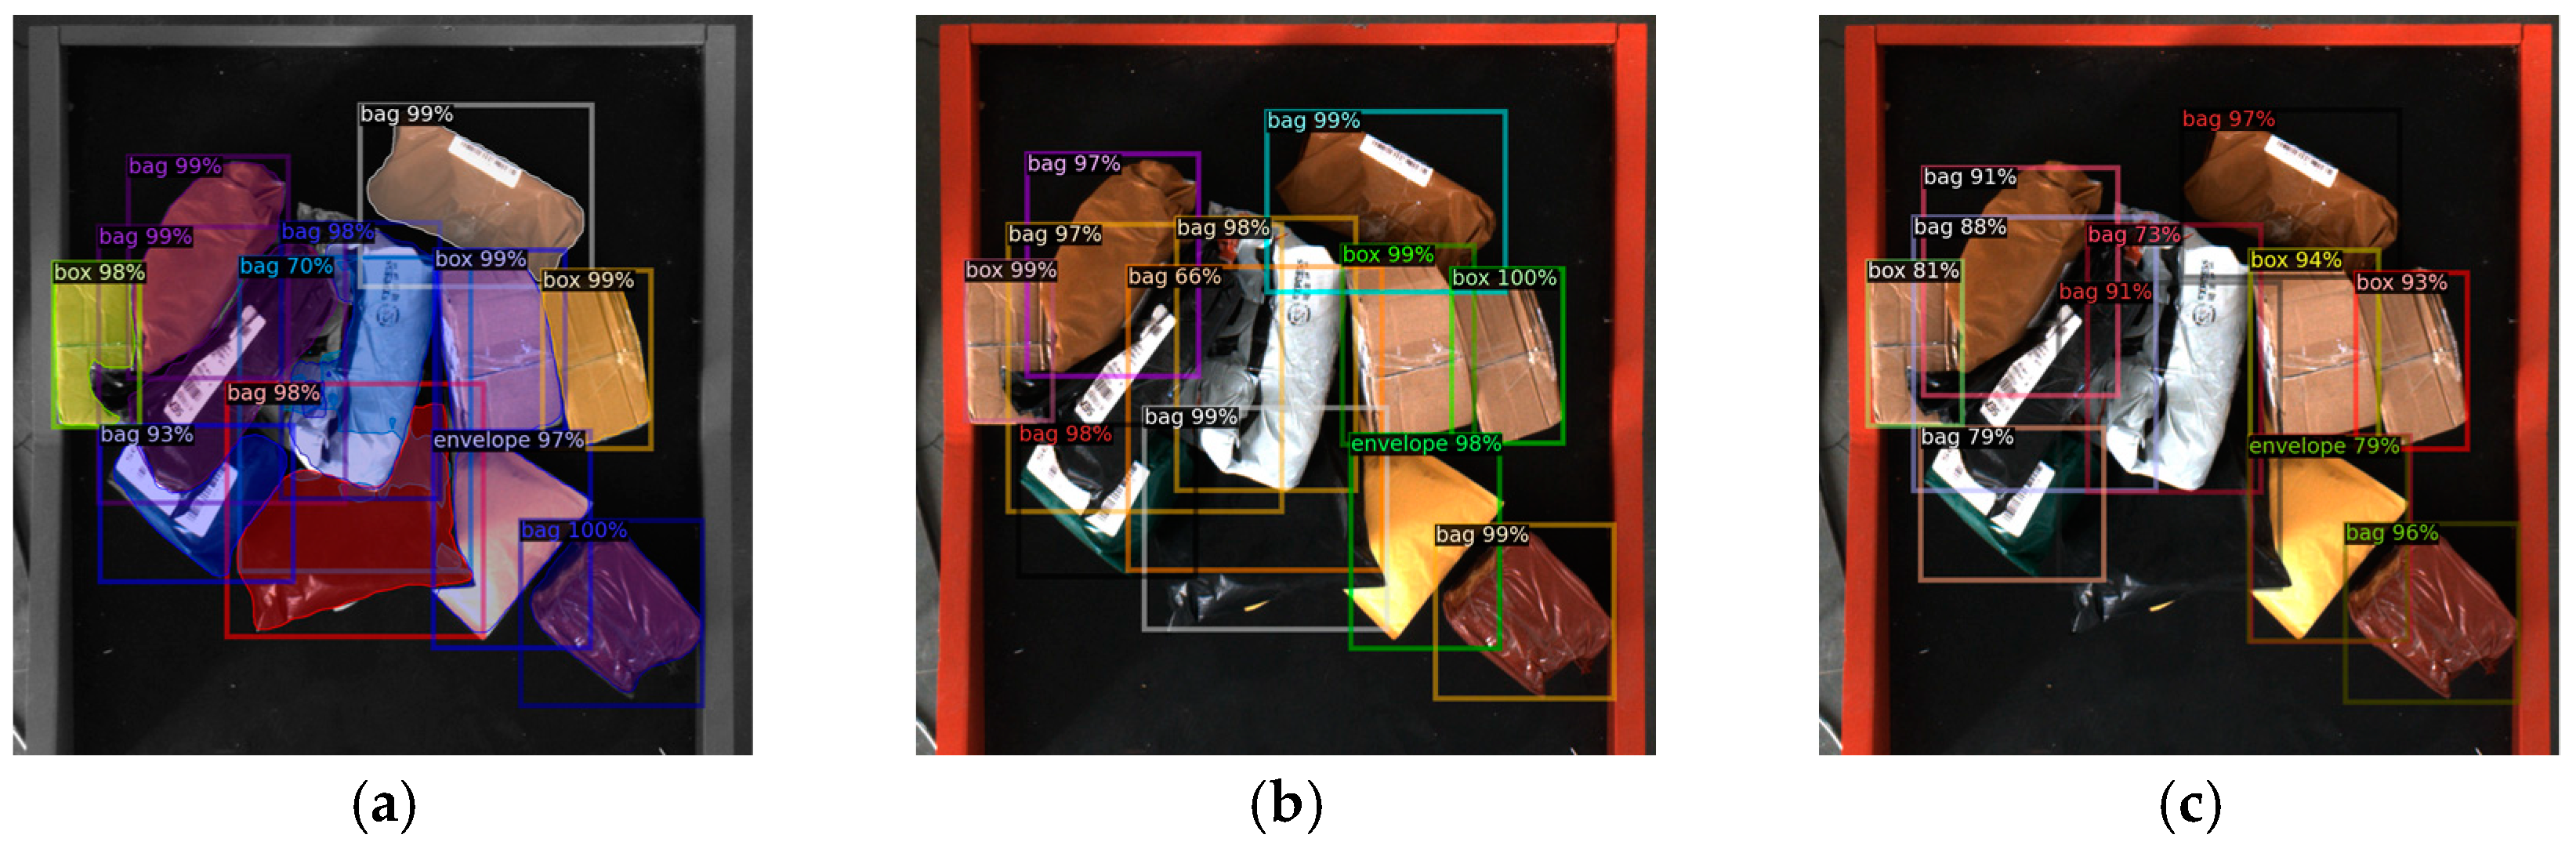
3.1.4. Model Validating and Testing
- (1)
- Model validating
- (2)
- Comparative analysis of hyperparameter
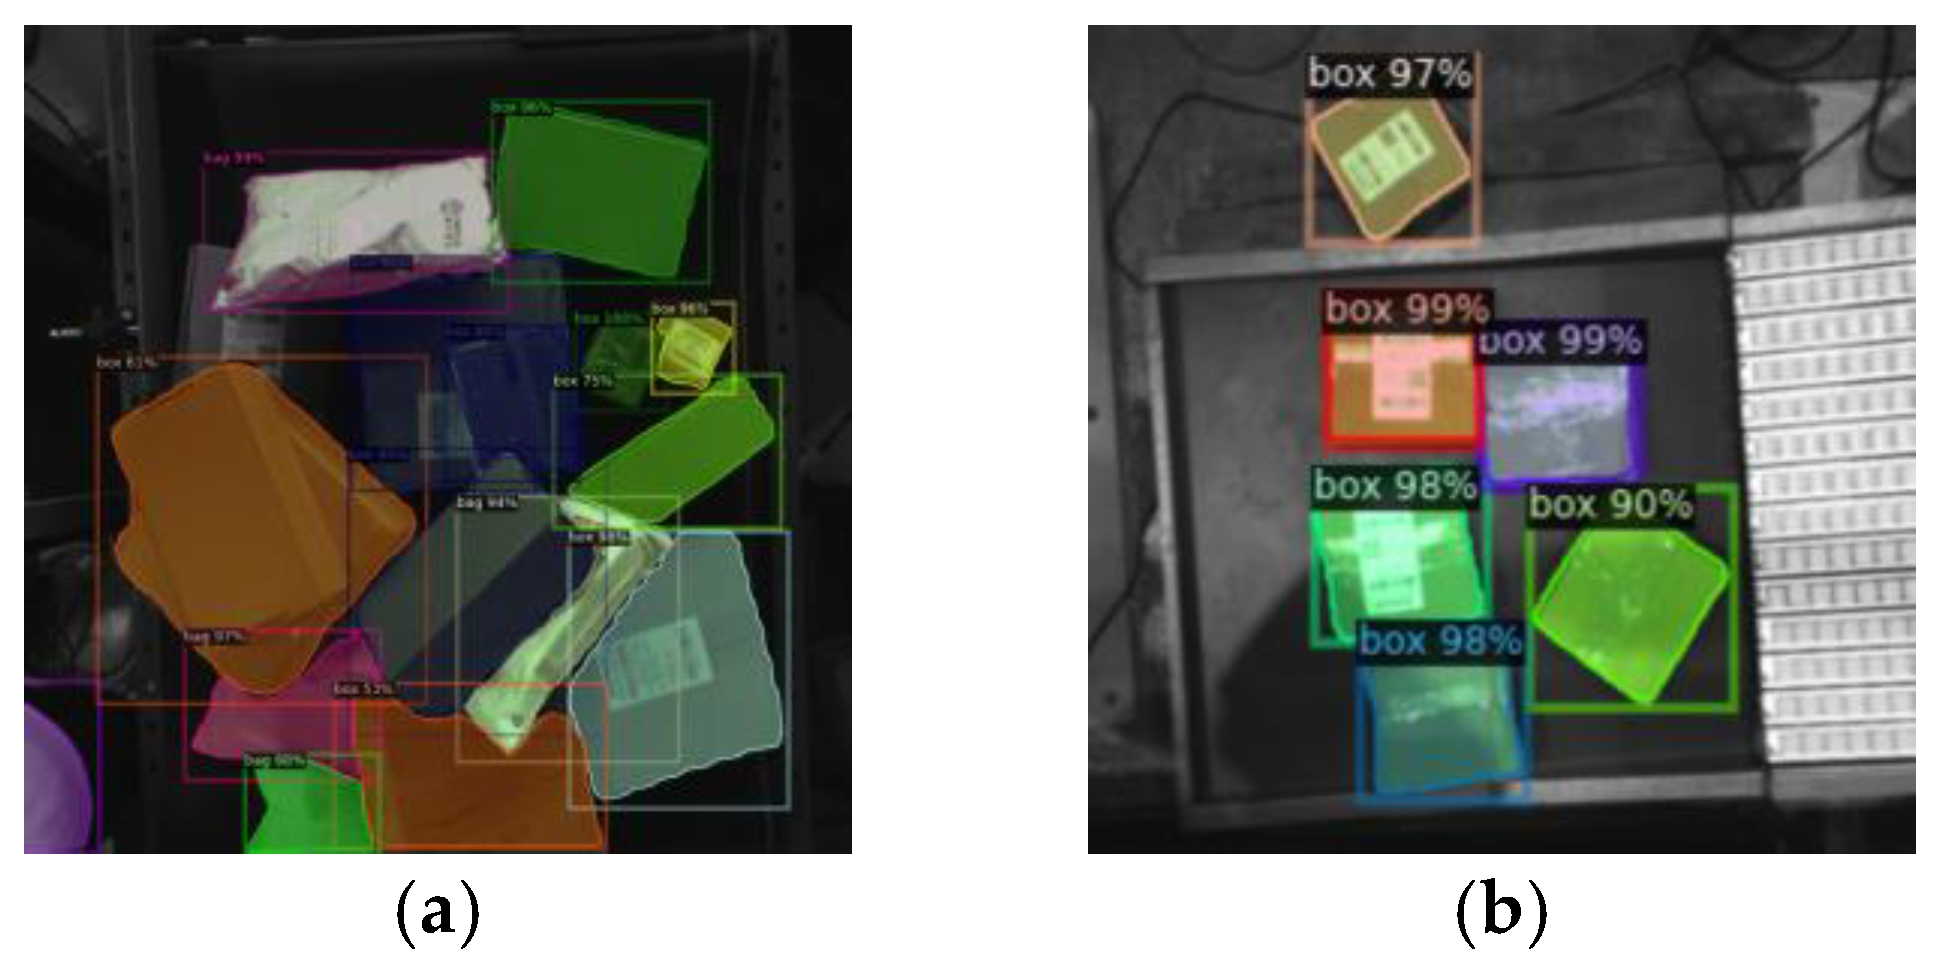
- (3)
- Model testing
3.1.5. Performance Comparison with Classical Object Detection Algorithms
3.2. Robot Sorting Experiment
4. Conclusions
- (1)
- The Mask R-CNN was evaluated for detection accuracy, achieving higher precision in object detection and having advantages in instance segmentation compared with previous classical object detection algorithms. The results show that Mask R-CNN can provide accurate detection information in MDFM.
- (2)
- Based on accurate detection results, combined with precise vector sorting and optimal grasping position, the sorting success rate of the MDFM reaches 97.2%, proving the stability and applicability of the proposed sorting method.
- (3)
- The method is conducive to improving the sorting efficiency of express packages under complex logistics sorting, and provides technical conditions for realizing comprehensive automation and high efficiency of sorting in complex scenes, which has important application value.
Author Contributions
Funding
Institutional Review Board Statement
Informed Consent Statement
Data Availability Statement
Conflicts of Interest
References
- Pan, Z.; Jia, Z.; Jing, K.; Ding, Y.; Liang, Q. Manipulator package sorting and placing system based on computer vision. In Proceedings of the 32nd 2020 Chinese Control and Decision Conference, Hefei, China, 22–24 August 2020; pp. 409–414. [Google Scholar]
- Zhang, H.; Wang, K.; Wang, F. Advances and perspectives on applications of deep learning in visual object detection. Acta Autom. Sin. 2017, 43, 1289–1305. [Google Scholar]
- Ma, Z.; Zhu, X.; Sun, M.; Cao, Q. Autonomous picking robot system for logistics sorting task. Mach. Des. Res. 2019, 35, 10–16. [Google Scholar]
- Chen, X.; Li, Y.; Fan, J.; Wang, R. RGAM: A novel network architecture for 3D point cloud semantic segmentation in indoor scenes. Inf. Sci. 2021, 571, 87–103. [Google Scholar] [CrossRef]
- Zhang, L.; Xu, X.; Cao, C.; He, J.; Ran, Y.; Tan, Z.; Luo, M. Robot pose estimation method based on dynamic feature elimination image and point cloud fusion. Chin. J. Lasers 2022, 49, 58–69. [Google Scholar]
- Ning, T.; Wang, C.; Han, Y. Deep vision servo hand-eye coordination planning study for sorting robots. Symmetry 2022, 14, 152. [Google Scholar] [CrossRef]
- He, L.; Liu, G.; Tian, G.; Zhang, J.; Ji, Z. Efficient multi-view multi-target tracking using a distributed camera network. IEEE Sens. J. 2020, 20, 2056–2063. [Google Scholar] [CrossRef]
- Wang, Y.; Chen, T.; He, Z.; Wu, C. Review on the machine vision measurement and control technology for intelligent manufacturing equipment. Control. Theory Appl. 2015, 32, 273–286. [Google Scholar]
- Dalal, N.; Triggs, B. Histograms of oriented gradients for human detection. In Proceedings of the 2005 IEEE Computer Society Conference on Computer Vision and Pattern Recognition, San Diego, CA, USA, 20–26 July 2005; pp. 886–893. [Google Scholar]
- Lowe, D.G. Distinctive image features from scale-invariant keypoints. Int. J. Comput. Vis. 2004, 60, 91–110. [Google Scholar] [CrossRef]
- Murali, S.; Govindan, V.K.; Kalady, S. A survey on shadow detection techniques in a single image. Inf. Technol. Control. 2018, 47, 75–92. [Google Scholar] [CrossRef]
- Dhingra, G.; Kumar, V.; Joshi, H.D. Clustering-based shadow detection from images with texture and color analysis. Multimed. Tools Appl. 2021, 80, 33763–33778. [Google Scholar] [CrossRef]
- Chu, X.; Zhou, Z.; Deng, G.; Shao, S. Improved algorithm for intelligent detection of discontinuous edges of blurred images. J. Jilin Univ. 2019, 57, 875–881. [Google Scholar]
- Wei, Y.; Liu, X.; Liu, Y. Research on the application of high-efficiency detectors into the detection of prohibited item in X-ray images. Appl. Intell. 2022, 52, 4807–4823. [Google Scholar] [CrossRef]
- Li, T.; Huang, B.; Liu, J.; Jin, Q. Application of convolution neural network object detection algorithm in logistics warehouse. Comput. Eng. 2018, 44, 176–181. [Google Scholar] [CrossRef]
- Girshick, R.; Donahue, J.; Darrell, T.; Malik, J. Rich feature hierarchies for accurate object detection and semantic segmentation. In Proceedings of the 2014 IEEE Conference on Computer Vision and Pattern Recognition, Columbus, OH, USA, 23–28 June 2014; pp. 580–587. [Google Scholar]
- Girshick, R. Fast R-CNN. In Proceedings of the 2015 IEEE International Conference on Computer Vision, Santiago, Chile, 7–13 December 2015; pp. 1440–1448. [Google Scholar]
- Ren, S.; He, K.; Girshick, R.; Sun, J. Faster R-CNN: Towards real-time object detection with region proposal networks. IEEE Trans. Pattern Anal. Mach. Intell. 2017, 39, 1137–1149. [Google Scholar] [CrossRef] [PubMed]
- He, K.; Gkioxari, G.; Dollar, P.; Girshick, R. Mask R-CNN. IEEE Trans. Pattern Anal. Mach. Intell. 2020, 42, 386–397. [Google Scholar] [CrossRef] [PubMed]
- Liu, W.; Anguelov, D.; Erhan, D.; Szegedy, C.; Reed, S.; Fu, C.; Berg, A.C. SSD: Single shot multibox detector. In Proceedings of the 14th European Conference on Computer Vision, Amsterdam, The Netherlands, 11–14 October 2016; pp. 21–37. [Google Scholar]
- Redmon, J.; Divvala, S.; Girshick, R.; Farhadi, A. You only look once: Unified, real-time object detection. In Proceedings of the 2016 IEEE Conference on Computer Vision and Pattern Recognition, Las Vegas, NV, USA, 27–30 June 2016; pp. 779–788. [Google Scholar]
- Lin, T.Y.; Goyal, P.; Girshick, R.; He, K.; Dollar, P. Focal loss for dense object detection. IEEE Trans. Pattern Anal. Mach. Intell. 2020, 42, 318–327. [Google Scholar] [CrossRef] [PubMed]
- Zhang, J.; Meng, Y.; Chen, Z. A small target detection method based on deep learning with considerate feature and effectively expanded sample size. IEEE Access 2021, 9, 96559–96572. [Google Scholar] [CrossRef]
- Yang, Z.; Chen, J.; Xing, K.; Liu, M.; Gao, T. Small target detection algorithm based on improved DSSD. Comput. Technol. Dev. 2022, 32, 63–67. [Google Scholar]
- Sun, F.; Li, C.; Xie, Y.; Li, Z.; Yang, C.; Qi, J. Review of deep learning applied to occluded object detection. J. Front. Comput. Sci. Technol. 2022, 16, 1243–1259. [Google Scholar]
- Wu, X.; Qiu, T.; Wang, Y. Multi-object detection and segmentation for traffic scene based on improved Mask R-CNN. Chin. J. Sci. Instrum. 2021, 42, 242–249. [Google Scholar]
- Hwang, S.; Park, J.; Won, J.; Kwon, Y.; Kim, Y. Object detection for cargo unloading system based on fuzzy C means. CMC-Comput. Mater. Contin. 2022, 71, 4167–4181. [Google Scholar] [CrossRef]
- Gou, L.; Wu, S.; Yang, J.; Yu, H.; Lin, C.; Li, X.; Deng, C. Carton dataset synthesis method for loading-and-unloading carton detection based on deep learning. Int. J. Adv. Manuf. Technol. 2023, 124, 3049–3066. [Google Scholar] [CrossRef]
- Zuo, G.; Tong, J.; Liu, H.; Chen, W.; Li, J. Graph-based visual manipulation relationship reasoning network for robotic grasping. Front. Neurorobot. 2021, 15, 719731. [Google Scholar] [CrossRef]
- Han, S.; Liu, X.; Wang, G. Visual sorting method based on multi-modal information fusion. Appl. Sci. 2022, 12, 2946. [Google Scholar] [CrossRef]
- Han, X.; Liu, X.; Wang, G.; Han, S. Robotic sorting method in complex scene based on deep neural network. J. Beijing Univ. Posts Telecommun. 2019, 42, 22–28. [Google Scholar]
- Han, S.; Liu, X.; Han, X.; Wang, G.; Wu, S. Visual sorting of express parcels based on multi-task deep learning. Sensors 2020, 20, 6785. [Google Scholar] [CrossRef] [PubMed]
- Kolaman, A.; Malowany, D.; Hagege, R.R.; Guterman, H. Light Invariant Video Imaging for Improved Performance of Convolution Neural Networks. IEEE Trans. Circuits Syst. Video Technol. 2019, 29, 1584–1594. [Google Scholar] [CrossRef]
- Leung, H.; Chen, X.; Chen, Y. A deep-learning-based vehicle detection approach for insufficient and nighttime illumination conditions. Appl. Sci. 2019, 9, 4769. [Google Scholar] [CrossRef]
- Shao, X.; Wei, C.; Shen, Y.; Wang, Z. Feature enhancement based on CycleGAN for nighttime vehicle detection. IEEE Access 2021, 9, 849–859. [Google Scholar] [CrossRef]
- Anand, B.; Verma, H.; Thakur, A.; Alam, P.; Rajalakshmi., P. Evaluation of the quality of LiDAR data in the varying ambient light. In Proceedings of the 2022 IEEE Sensors Applications Symposium, Sundsvall, Sweden, 1–3 August 2022. [Google Scholar]
- Alba-Corpus, I.Y.; Flores-Fuentes, W.; Rodriguez-Quinonez, J.C.; Hernandez-Balbuena, D.; Gonzalez-Navarro, F.F.; Sergiyenko, O.; Alaniz-Plata, R. Detection of atypical data in point cloud of technical vision system using digital filtering. In Proceedings of the 2022 IEEE Mexican International Conference on Computer Science, Xalapa, Mexico, 24–26 August 2022. [Google Scholar]
- Ye, C.; Feng, W.; Wang, Q.; Wang, C.; Pan, B.; Xie, Y.; Hu, Y.; Chen, J. Laser stripe segmentation and centerline extraction based on 3D scanning imaging. Appl. Opt. 2022, 61, 5409–5418. [Google Scholar] [CrossRef]
- Zheng, C.; Chen, P.; Pang, J.; Yang, X.; Chen, C.; Tu, S.; Xue, Y. A mango picking vision algorithm on instance segmentation and key point detection from RGB images in an open orchard. Biosyst. Eng. 2021, 206, 32–54. [Google Scholar] [CrossRef]
- Li, H.; Dong, Y.; Xu, L.; Zhang, S.; Wang, J. Object detection method based on global feature augmentation and adaptive regression in IoT. Neural Comput. Appl. 2021, 33, 4119–4131. [Google Scholar] [CrossRef]
- Zhang, L.; Wang, L.; Jin, M.; Geng, X.; Shen, Q. Small object detection in remote sensing images based on attention mechanism and multi-scale feature fusion. Int. J. Remote Sens. 2022, 43, 3280–3297. [Google Scholar] [CrossRef]


| Target | Number | Proportion % |
|---|---|---|
| Box | 3489 | 52.059 |
| Bag | 2741 | 40.892 |
| Envelope | 472 | 13.528 |
| Total | 6702 | 100.00 |
| IoU Threshold | Bounding Box Regression mAP/% | Instance Segmentation mAP/% |
|---|---|---|
| 0.9 | 73.67 | 77.50 |
| 0.7 | 78.09 | 81.96 |
| 0.5 | 79.34 | 83.29 |
| 0.3 | 80.13 | 84.01 |
| 0.1 | 81.10 | 85.10 |
| AP-Box | AP-Bag | AP-Envelope | mAP | |
|---|---|---|---|---|
| Bounding Box Regression | 83.769 | 77.301 | 82.233 | 81.10 |
| Instance Segmentation | 85.555 | 81.844 | 87.899 | 85.10 |
| Method | Type | Bounding Box Regression mAP/% | Instance Segmentation mAP/% | Weight Size/M | Average Single Inference Time /ms |
|---|---|---|---|---|---|
| Mask R-CNN | Two-stage | 81.10 | √ | 334.86 | 198 |
| Faster R-CNN | Two-stage | 80.17 | - | 314.83 | 205 |
| RetinaNet | One-stage | 80.08 | - | 288.98 | 182 |
| Group | Results of Grasping | Sorting Success Rate (%) | |
|---|---|---|---|
| Success | Failure | ||
| 1 | 98 | 2 | 98 |
| 2 | 96 | 4 | 96 |
| 3 | 97 | 3 | 97 |
| 4 | 97 | 3 | 97 |
| 5 | 98 | 2 | 98 |
| Total | 486 | 14 | 97.2 |
| Group | Results of Grasping | Sorting Success Rate (%) | |
|---|---|---|---|
| Success | Failure | ||
| 1 | 90 | 10 | 90 |
| 2 | 91 | 9 | 91 |
| 3 | 89 | 11 | 89 |
| 4 | 89 | 11 | 89 |
| 5 | 87 | 13 | 87 |
| Total | 446 | 54 | 89.2 |
Disclaimer/Publisher’s Note: The statements, opinions and data contained in all publications are solely those of the individual author(s) and contributor(s) and not of MDPI and/or the editor(s). MDPI and/or the editor(s) disclaim responsibility for any injury to people or property resulting from any ideas, methods, instructions or products referred to in the content. |
© 2023 by the authors. Licensee MDPI, Basel, Switzerland. This article is an open access article distributed under the terms and conditions of the Creative Commons Attribution (CC BY) license (https://creativecommons.org/licenses/by/4.0/).
Share and Cite
Ren, C.; Ji, H.; Liu, X.; Teng, J.; Xu, H. Visual Sorting of Express Packages Based on the Multi-Dimensional Fusion Method under Complex Logistics Sorting. Entropy 2023, 25, 298. https://doi.org/10.3390/e25020298
Ren C, Ji H, Liu X, Teng J, Xu H. Visual Sorting of Express Packages Based on the Multi-Dimensional Fusion Method under Complex Logistics Sorting. Entropy. 2023; 25(2):298. https://doi.org/10.3390/e25020298
Chicago/Turabian StyleRen, Chuanxiang, Haowei Ji, Xiang Liu, Juan Teng, and Hui Xu. 2023. "Visual Sorting of Express Packages Based on the Multi-Dimensional Fusion Method under Complex Logistics Sorting" Entropy 25, no. 2: 298. https://doi.org/10.3390/e25020298
APA StyleRen, C., Ji, H., Liu, X., Teng, J., & Xu, H. (2023). Visual Sorting of Express Packages Based on the Multi-Dimensional Fusion Method under Complex Logistics Sorting. Entropy, 25(2), 298. https://doi.org/10.3390/e25020298