1. Introduction
The mathematical study of the storage, transmission, and quantification of information is known as information theory. The field of applied mathematics lies at the intersection of statistical mechanics, computer science, electrical engineering, probability theory, and statistics. A foundational method for determining the level of uncertainty in random events is provided by information theory. Its applications are many and are outlined in Shannon’s influential work [
1]. Entropy is an important parameter in information theory. The degree of uncertainty regarding the value of a random variable or the outcome of a random process is measured by entropy. For example, determining the outcome of a fair coin toss provides less information (lower entropy and lower uncertainty) than determining the outcome of a dice roll where six equally likely outcomes are obtained. Relative entropy, the error exponent, mutual information, and channel capacity are some other important metrics in information theory. Source coding, algorithmic complexity theory, algorithmic information theory, and information-theoretic security are important subfields of information theory.
Applications of the basic concepts of information theory include channel coding/error detection and correction and source coding/data compression. The development of the Internet, the compact disk, the viability of cell phones, and the Voyager space missions have all benefited greatly from its influence. Statistical inference, cryptography, neurobiology, perception, linguistics, thermophysics, molecular dynamics, quantum computing, black holes, information retrieval, intelligence, plagiarism detection, pattern recognition, anomaly detection, and even the creation of art are other areas where the theory has found application.
Probability theory and statistics form the basis of information theory, in which quantifiable data is usually expressed in the form of bits. Information measures of distributions associated with random variables are a frequent topic of discussion in information theory. Entropy is a crucial metric that serves as the basis for numerous other measurements. The information measure of a single random variable can be quantified thanks to entropy. Mutual information, which is defined as a measure of the joint information of two random variables and can be used to characterize their correlation, is another helpful idea. The first number sets a limit on the rate at which the data generated from independent samples with the given distribution can be successfully compressed. It is a property of the probability distribution of a random variable. The second number, which represents the maximum rate of reliable communication over a noisy channel in the limiting case of long block lengths, is a property of the joint distribution of two random variables when the joint distribution determines the channel statistics.
When analyzing a random variable (rv)
X that is non-negative and has a cumulative distribution function (cdf)
, which is continuous, and a probability density function (pdf)
, the Tsallis entropy of order
is an important measure, which is elucidated in [
2] as follows:
where
with
. Note that
in which
represents the right-continuous inverse of
F and
U is a random number (according to the uniform distribution) from the unit interval. The Tsallis entropy can yield nonpositive values in general, but appropriate choices of
can ensure non-negativity. It is worth noting that as
approaches one,
converges to the Shannon differential entropy as
, thereby signifying an important relationship.
In situations involving the analysis of the random lifetime
X of a newly introduced system,
is commonly used to quantify the unsureness inherent in a fresh unit. Despite this, there are cases where operators know the age of the system. To be more specific, assume that they are aware that the system has been in use during an interval time with a length
t. Then, they can calculate the amount of uncertainty in the residual lifetime after
t, i.e.,
, so that
X stands for the original lifetime of the system. In such cases, the conventional Tsallis entropy
does not provide the desired insight. Therefore, a novel quantity, the Tsallis entropy for the residual lifetime of the device of the lifetime unit under consideration, is introduced to address this limitation as follows:
in which
represents the pdf of
The term
corresponds to the reliability function (rf) of
X. The new dynamic information quantity takes into account the system’s age and provides a more accurate measure of uncertainty in scenarios where this temporal information is available. Several recent studies have contributed to the generalization of the new measure, as discussed in Nanda and Paul [
3], Rajesh and Sunoj [
4], Toomaj and Agh Atabay [
5], and the references therein.
Uncertainty is a pervasive feature found in various systems in nature, which is influenced by future events and even past events. This has led to the development of an interdependent concept of entropy that encapsulates the amount of uncertainty induced by incidents in the past. The past entropy is different from the residual entropy, in which the quantification of uncertainty is regarded to be influenced by events in the future. The study of entropy for past events and the relevant applications that have arisen have been accomplished by many researchers. The works carried out by Di Crescenzo and Longobardi [
6] and Nair and Sunoj [
7] have shed light on this topic. The research carried out by Gupta et al. [
8] on the aspects and use of past entropy for order statistics was helpful in this area. In particular, they studied and performed stochastic comparisons between the entropy of the remaining lifetime of a lifespan and the entropy of the past lifetime of the lifespan, where the lifespan was quantified with respect to an ordered random variable.
Consider an rv
X and assume it signifies the system’s lifetime. The pdf of
is
in which
Now, the past Tsallis entropy (PTE) as a function of
t, the time of an observation of past failure of the system, is recognized by (see, e.g., Kayid and Alshehri [
9])
for every
We emphasize that
has a wide range of possible values, from negative infinity to positive infinity. In the context of system failures,
serves as a metric to quantify the uncertainty related to the inactivity time of a system, especially if it has experienced a failure at time
t.
Extensive research has been conducted in the literature to explore Tsallis entropy’s numerous characteristics and statistical uses. For detailed insights, we recommend the work of Asadi et al. [
10], Nanda and Paul [
3], Zhang [
11], Maasoumi [
12], Abe [
13], Asadi et al. [
14], and the sources provided in these works. These sources provide comprehensive discussions on the topic and offer a deeper understanding of Tsallis entropy in various contexts.
In this paper, our main goal is to scrutinize the traits of PTE in terms of ordered variables. We focus on
, as
n identical random variables, which are independent and follow
F. The order statistic refers to the ordering of these sample values in ascending order so that
represents the
ith ordered variable. These statistics have important roles in various areas of probability and statistics, as they allow for the description of probability distributions, the evaluation of the fit of data to certain models, the quality control of products or processes, the analysis of the reliability of systems or components, and numerous other applications. For a thorough understanding of the theory and applications of order statistics, we recommend the comprehensive review by David and Nagaraja [
15]. The degree of predictability of an ordered random variable is usually related to its distribution; the entropy of this random variable can actually access this property. It is worth exploring the quantification of information for ordered random variables, including order statistics as a general class of statistics relevant to survival analysis and systems engineering. Aspects of information for order statistics have garnered significant attention from researchers in the literature. Several studies have explored various information properties associated with order statistics. For instance, Wong and Chen [
16] demonstrated that the discrepancy among the mean entropy of ordered variables and the empirical entropy remains unchanged. They further established that, for distributions which are symmetric, the entropy of ordered variables exhibits symmetry around the median. Park [
17] established some relations to acquire the entropy of ordered variables. Ebrahimi et al. [
18] studied the information features of ordered random variables using Shannon entropy and the Kullback–Leibler distance. Similarly, Abbasnejad and Arghami [
19] and Baratpour and Khammar [
20] obtained similar results for the Renyi and Tsallis entropy of ordered random variables, respectively. Despite these efforts, the Tsallis entropy of the past lifetime of ordered variables has not been considered in literature thus far. It is commonly known that the past Tsallis entropy can be used to measure the amount of information that can be gleaned from historical observations in order to improve the forecasts of future events. This motivates us to investigate aspects of the Tsallis entropy of the past lifetime distribution of order statistics. By building upon existing research, our study aims to contribute significantly to this area by examining the behaviors of past Tsallis entropy examples for ordered variables. By highlighting previous studies and emphasizing the gap in the literature regarding the investigation of past Tsallis entropy examples in order statistics, we establish the significance and novelty of our research.
The current work’s outcomes are organized as follows: In
Section 2, we derive the representation of PTE for order statistics denoted as
which is arisen from a sample taken from an arbitrary distribution recognized by cdf
We express this PTE on the basis of the PTE for ordered variables from a sample selected according to the law of uniform probability. We derive upper and lower bounds to approximate the PTE, since equations with exact solutions for the PTE of order statistics are frequently unavailable for many statistical models. We provide several illustrative examples to demonstrate the practicality and usefulness of these bounds. In addition, we scrutinize the monotonicity of the PTE for the extremum of a sample provided that some convenient conditions are satisfied. We find that the PTEs of the extremum of a random sample exhibit monotonic behavior as the sample’s number of individuals rises. However, we counter this observation by presenting a counterexample that demonstrates the nonmonotonic behavior of PTE for
based on
n. To further analyze the monotonic behavior, we examine the PTE of order statistics
with respect to the index of order statistics
Our results show that the PTE of
does not change monotonically with
i.
In what follows in the paper, the notations “
” and “
” will be used to indicate the usual stochastic order and the likelihood ratio order, respectively. For a more detailed discussion on definitions and properties of these stochastic orders, the reader can refer to Shaked and Shanthikumar [
21].
2. Past Tsallis Entropy of Order Statistics
Here, we acquire an expression that relates the PTE of the ordinal statistic to the PTE of an ordered random variable based on a set of values that are randomly generated according to the law of uniform probability. Let us consider the pdf and the rf of
denoted as
and
, respectively, where
. We have the following relationships:
in which
represents the complete beta function (see [
15] for more details). Additionally, the cdf of
, i.e., the function
, is derived as
where
represents the lower incomplete beta function. Hereafter, we shall write
to specifiy that the rv
Y follows a beta distribution truncated on
, which has density
In our context, we are concerned with the analysis of Tsallis entropy, which is measured by the cdf or pdf of the rv
. In this way, one quantifies the strength of the uncertainty induced by
in terms of how predictable the elapsed time since the failure time of a system is. In the reliability literature,
-out-of-
n structures have proven to be very useful for modeling the life lengths of typical systems. In such systems, the functionality is guaranteed only if at least
of the
n units or constituents in the system are operational. A system with separate component lifetimes is headed in this way. Furthermore, a consistent distribution of the component lifetimes is assumed. The lifetime of the components in the system is denoted by
. The lifetime of the system is determined by the ordered rv
, where the value of
i is the position of the order statistic. When
, this corresponds to a serial system, while
represents a parallel system. In the context of
-out-of-
n structures that have experienced failures before time
t, the PTE of
serves as a measure of entropy associated with the past lifetimes of the system. This dynamic entropy measure provides system designers with valuable insights into the entropy of the lifetime of systems with
-out-of-
n structures operating at a given time
t.
To increase the computational efficiency, we introduce a lemma that establishes the relationship the PTE of ordered uniformly distributed rvs has with the beta function in its imperfect form. From a practical perspective, this link is essential, since it makes the computation of PTE easier. Since it only requires a few simple computations, the demonstration of this lemma—which flows immediately from the definition of PTE—is not included here.
Lemma 1. Suppose we have drawn a random sample of size n from according to the law of uniform probability. Let we arrange the sample values in ascending order, where is the ith order statistic. Then, for all ,
with .
This lemma provides researchers and practitioners with a useful tool to work out the PTE of the ordered variables of a sample adopted from uniform distribution. The computation can be conveniently performed via the imperfect beta function. In
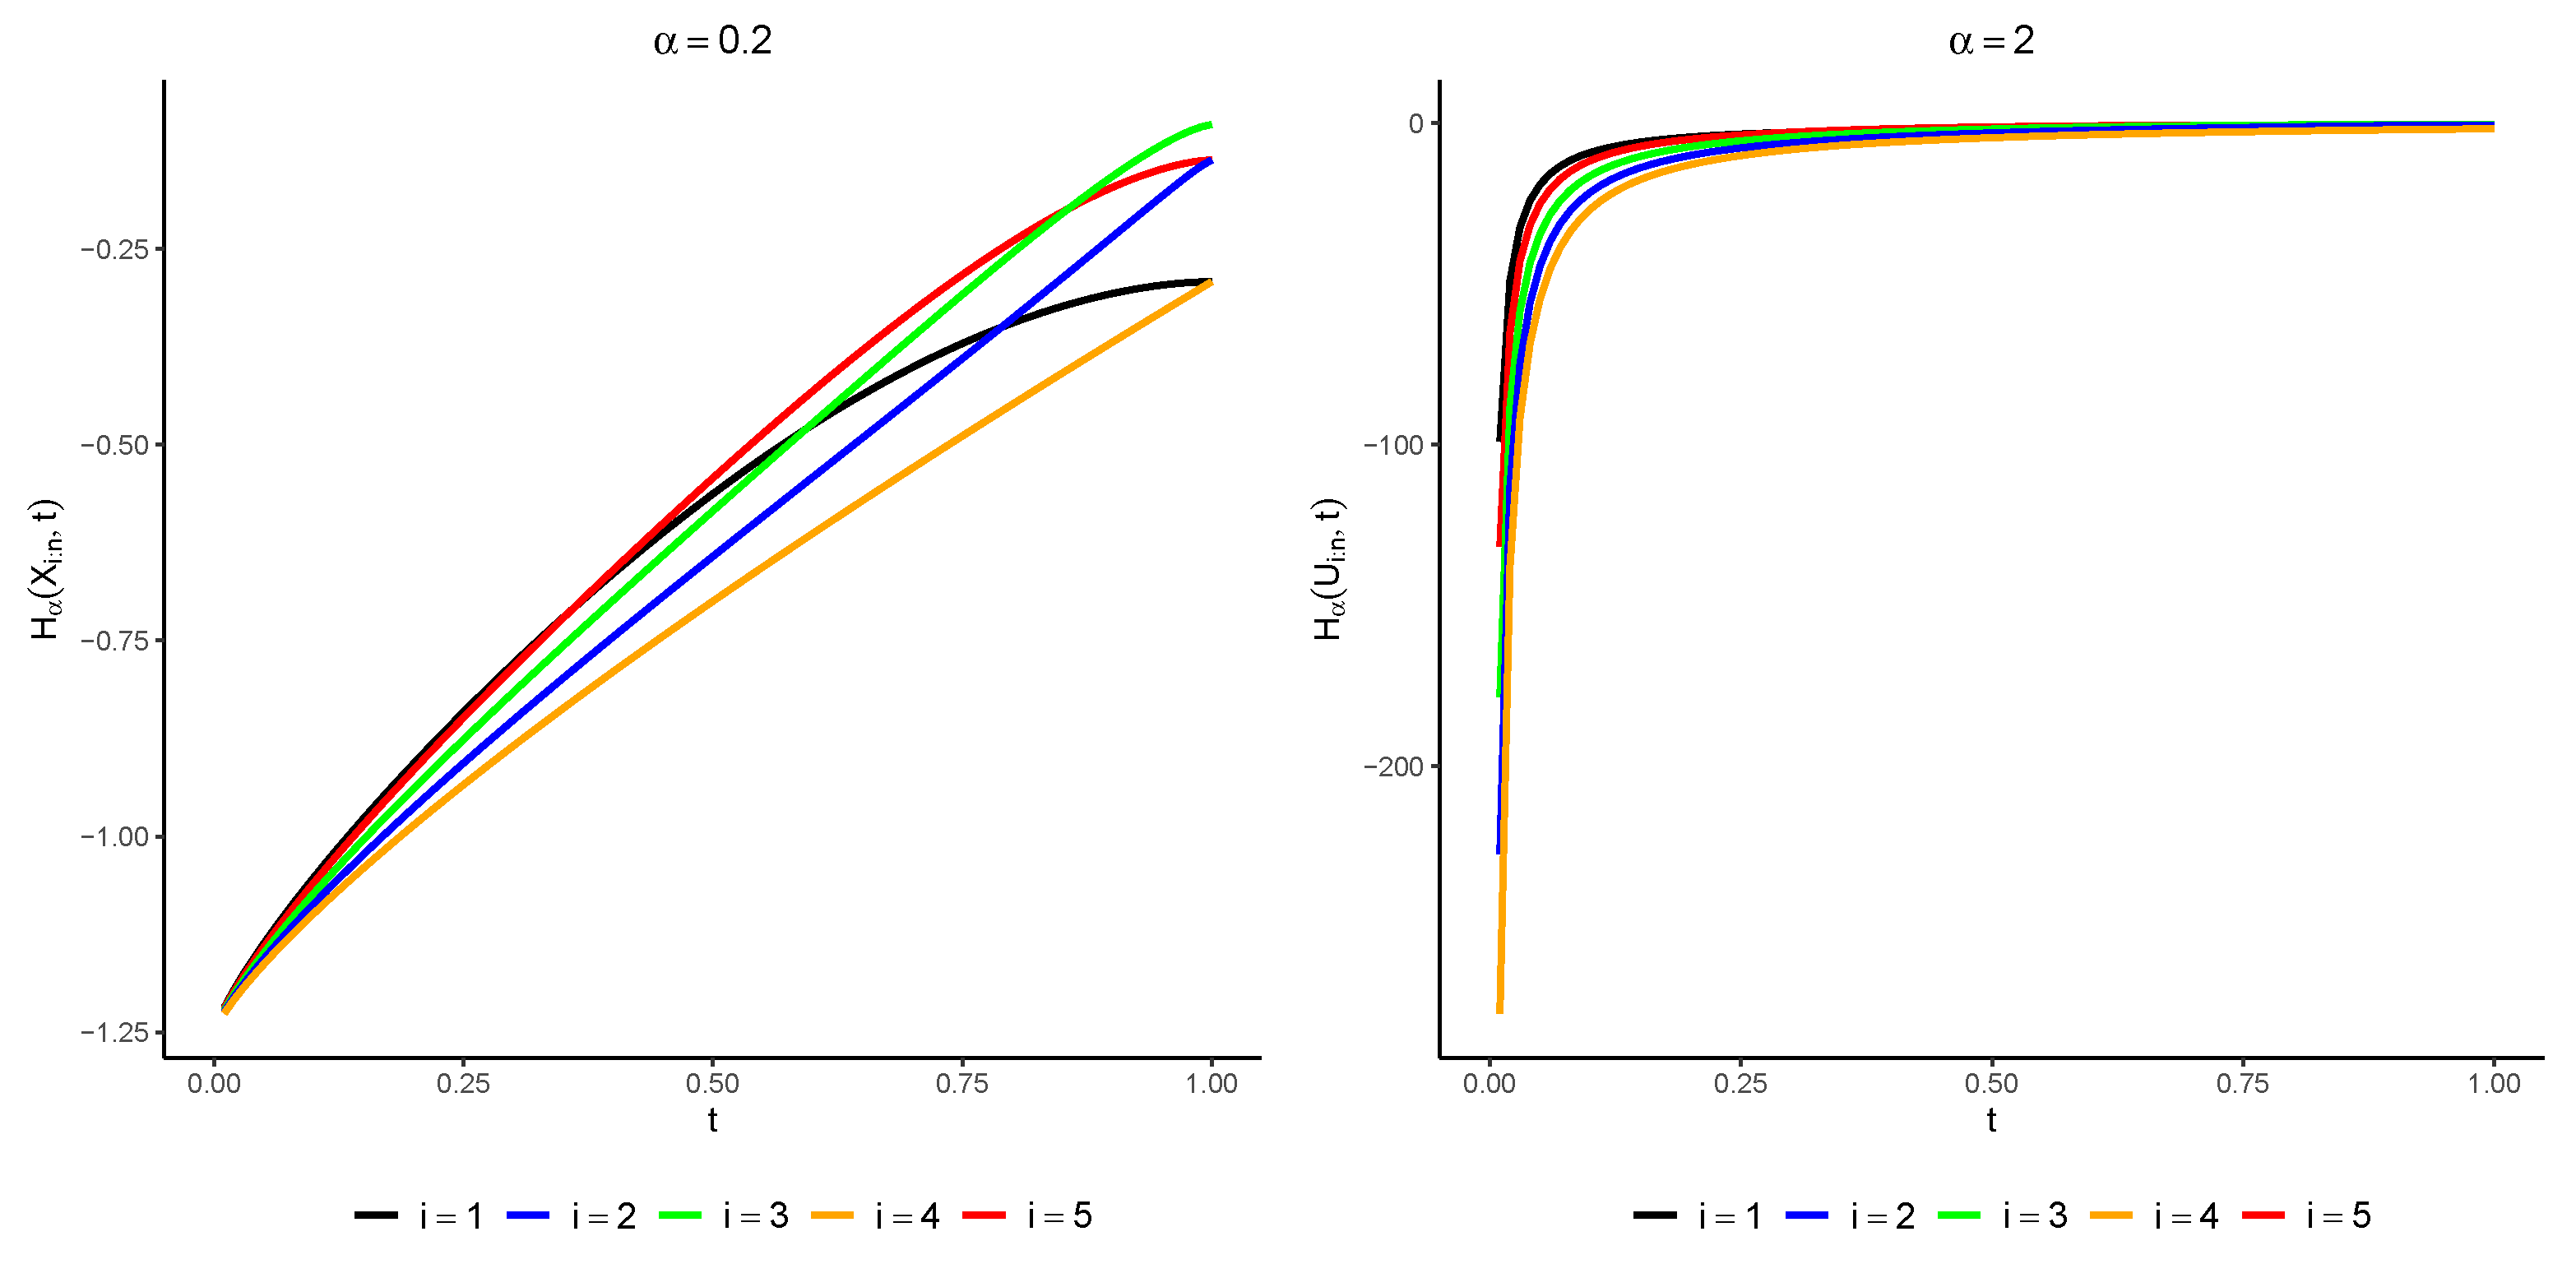
Figure 1, the plot of
is exhibited for various amounts of
, where
i takes the values
, and the total number of observations is
. The figure illustrates that there is no inherent monotonic relationship between the order statistics. The next theorem shows how the PTE of the order statistic
is related to the PTE of the order statistic calculated for a uniform distribution.
Theorem 1. The past Tsallis entropy of for all can be expressed as follows:so that Proof. Remember that
. By making the change in variables as
, based on the formulas given in (
2), (
4), and (
6), we obtain:
The recent equality above is due to Lemma 1. This finalizes the proof. □
Upon further calculation, it can be deduced that when the order
approaches unity in Equation (
8), the Shannon entropy of the
ith ordered variable from a set of random variables adopted from
F can be expressed as follows:
in which
. This specific result for
has previously been derived by Ebrahimi et al. [
18]. Next, we establish a fundamental result concerning the problem of monotonicity of the PTE of an rv
X, provided that
X fulfills the decreasing reversed hazard rate (DRHR) trait. More precisely, we say that
X possesses the DRHR if the reversed hazard rate (rhr) function it has, i.e., the function
, decreases monotonically for all
.
Lemma 2. If denotes the ith order statistic obtained from a sample following a DRHR distribution, then is also a DRHR.
Proof. We can express the rhr function of
as follows:
where
Under the assumption that
X is a DRHR, according to Equation (
10), the distribution of
is a DRHR if, and only if,
decreases in
. Evidently,
indeed decreases in
x, thus completing the proof. □
We now demonstrate how the behavior of the new information measure is influenced by the DRHR feature of X.
Theorem 2. If X induces the DRHR feature, then the Tsallis entropy increases in t for every .
Proof. The DRHR trait of the distribution of
X further induces that the distribution of
also has the DRHR trait, as stated in Lemma 2. The proof is obtained directly using Theorem 2 of the paper by Kayid et al. [
9]. □
Using an example, we illustrate the application of Theorems 1 and 2.
Example 1. We contemplate a distribution with the cdf
for
to be the distribution of the components’ lifetimes. It is evident that
for
. Using this information, we can derive the expression:
Furthermore, we can obtain:
Using Equation (
8), we deduce that
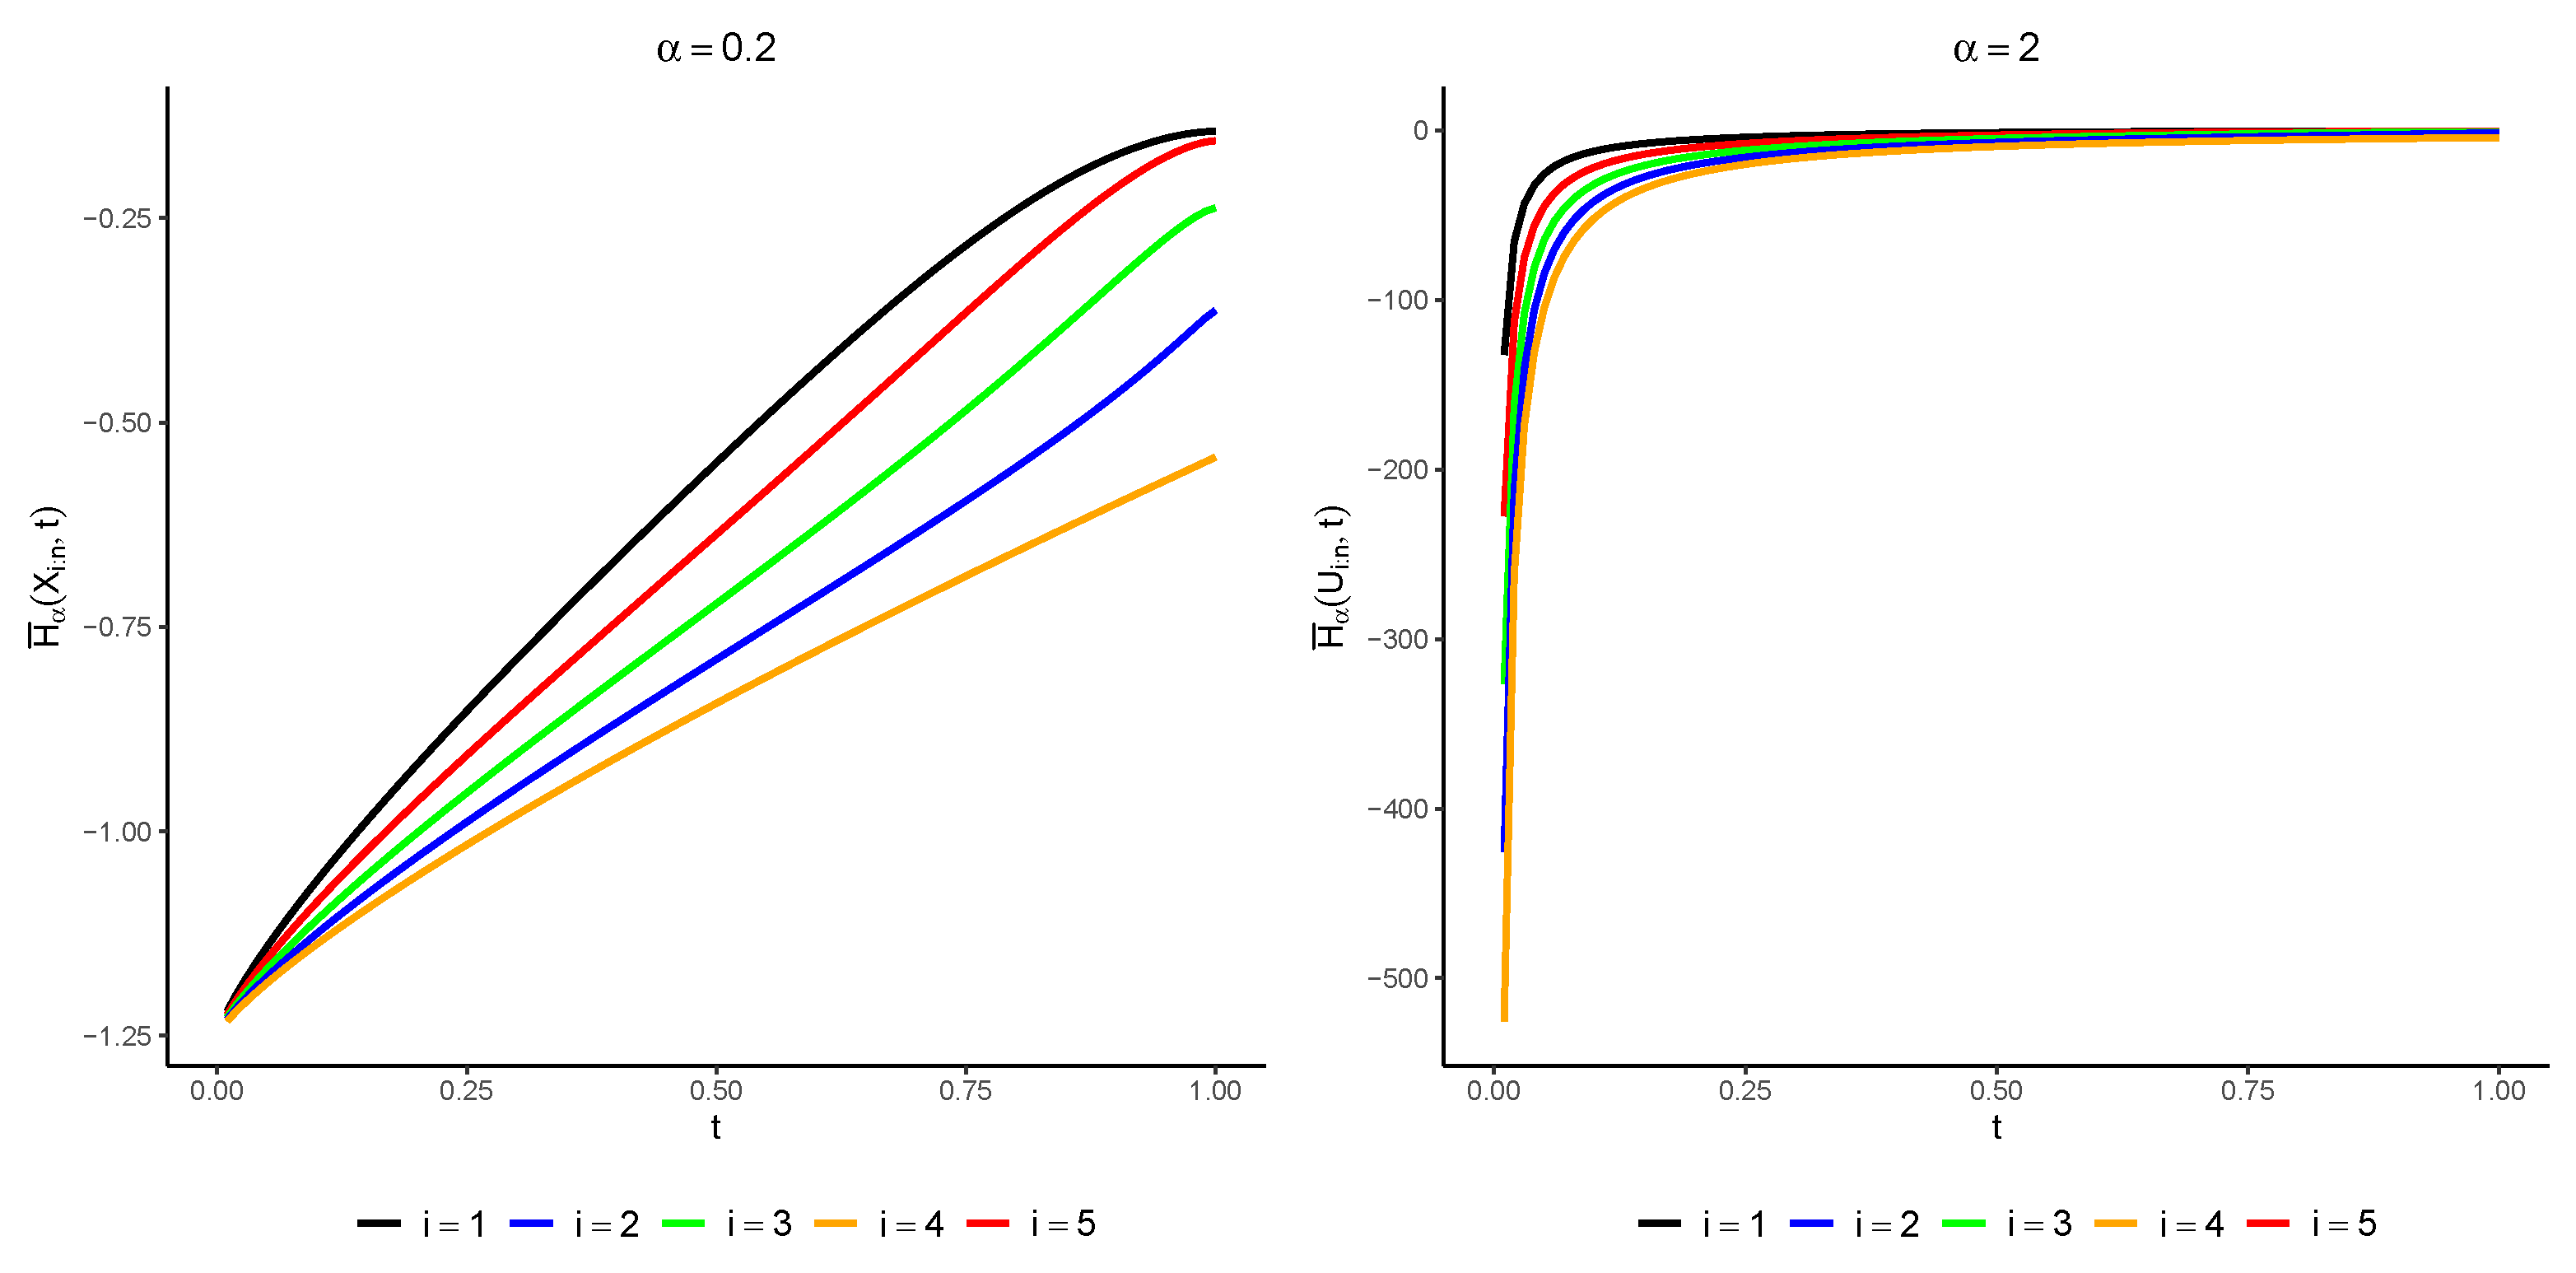
In
Figure 2, we have plotted
for various amounts of
with
and
. It can be observed that the PTR increases with
t, which aligns with the expectation from Theorem 2.
Unfortunately, convenient statements for the PTE of ordered rvs are not available in some situations for many distributions. Given this limitation, we are motivated to explore alternative approaches to characterizing the PTE of order statistics. We therefore propose to establish thresholds for the PTE of order statistics. To this end, we present the following theorem as a conclusive proof that provides valuable insight into the nature of these bounds and their applicability in practical scenarios.
Theorem 3. Consider a nonnegative rv X, which is continuous having pdf f and cdf Suppose we have in which m plays the role of the mode of the underlying distribution with density F such that . Then, for every we obtain Proof. Because for every
one has
one can write
The desired conclusion now clearly follows from the use of (
8). This concludes the proof of the theorem. □
The recent result introduces a boundary on the PTE of
, i.e., the function which is signified by
. This limiting value is expressed via the PTE of the ordered variable of a set of random variables selected according to the uniform probability law and, further, the mode of the distribution under consideration, which is represented by
m. This result yields a quantitative measure of the lower bound of the PTE with regard to the distribution mode and offers intriguing insights into the uncertainty features of
. Based on Theorem 4, we show the bound of the PTE on the ordered rvs for a few standard and reputable distributions in
Table 1.
The following result establishes an upper boundary condition for the new information measure of the system with parallel structure with regard to the rhr of the distribution under consideration.
Theorem 4. Let the distribution of X fulfill the DRHR trait. For , we have the inequalityin which is the rhr of X, which is a decreasing function by assumption. Proof. Since the distribution of X has a decreasing rhr function, thus Theorem 2 provides that
increases as t increases. Therefore, based on Theorem 3 of Kayid and Alshehri [
9], we have
in which
. Since
, the last inequality is easily obtained for
, and the proof is now complete. □
Next, we delve into the monotone behavior of the PTE of extreme order statistics with components whose lifetimes are uniformly distributed.
Lemma 3. In a system with parallel (series) structure in which components have random lifetimes following a uniform probability law, the PTE of the lifetime of the device is decreasing with respect to the components’ number.
Proof. We give the proof when the system operates in parallel. Analogous reasoning can be applied to a series system. Let us set two rvs
and
with densities
and
, respectively, which are given by the following:
Next, one obtains
Let us assume that
. Then, we suppose that the derivative of
with regard to
n is well defined. We have the following:
where
It is evident that for
:
where
It is readily seen that for
it holds that
is greater (less) than
in usual stochastic order. Consequently,
increases as
z grows; as an application of Theorem 1.A.3. of [
21], one has
. Hence, (
13) is positive (negative), and as a result,
decreases as
n grows. Consequently, it is deduced that the PTE of the life length of a system with parallel units decreases as the number of components increases. □
A large class of distributions consists of those that have density functions that decrease as the value increases. Some examples of these distributions are exponential, Pareto, and mixtures of distributions, among others. There are also distributions that have density functions that increase as the value increases like the power distribution. We will use the result from the previous lemma to establish the next theorem by which distributions that have density functions that are either increasing or decreasing are involved.
Theorem 5. Suppose that f is the pdf of the component’s lifetime in a parallel (series) system, and let f be an increasing (a decreasing) function. Then, the PTE of the system’s lifetime decreases as n grows.
Proof. Assuming that
then
indicates the density of
It is evident that
increases as
y grows. This in turn concludes that
is less than or equal to
in likelihood ratio order and, therefore,
is less than or equal to
in usual stochastic order also. In addition,
increases (decreases) as
x grows. Therefore,
From Theorem 3, for
, one obtains
The initial inequality is obtained by noting that
is nonnegative, whereas the last one is due to Lemma 3(i). Thus, we deduce that
for all
□
The following example shows that this Theorem does not work for all kinds of systems with an -out-of-n structure.
Example 2. We presume a system is operational when more than or equal to
of the
n components in the system are in operation. It is then not difficult to observe that the system’s random lifetime is
The components are assumed to have an identical distribution, which is uniform on
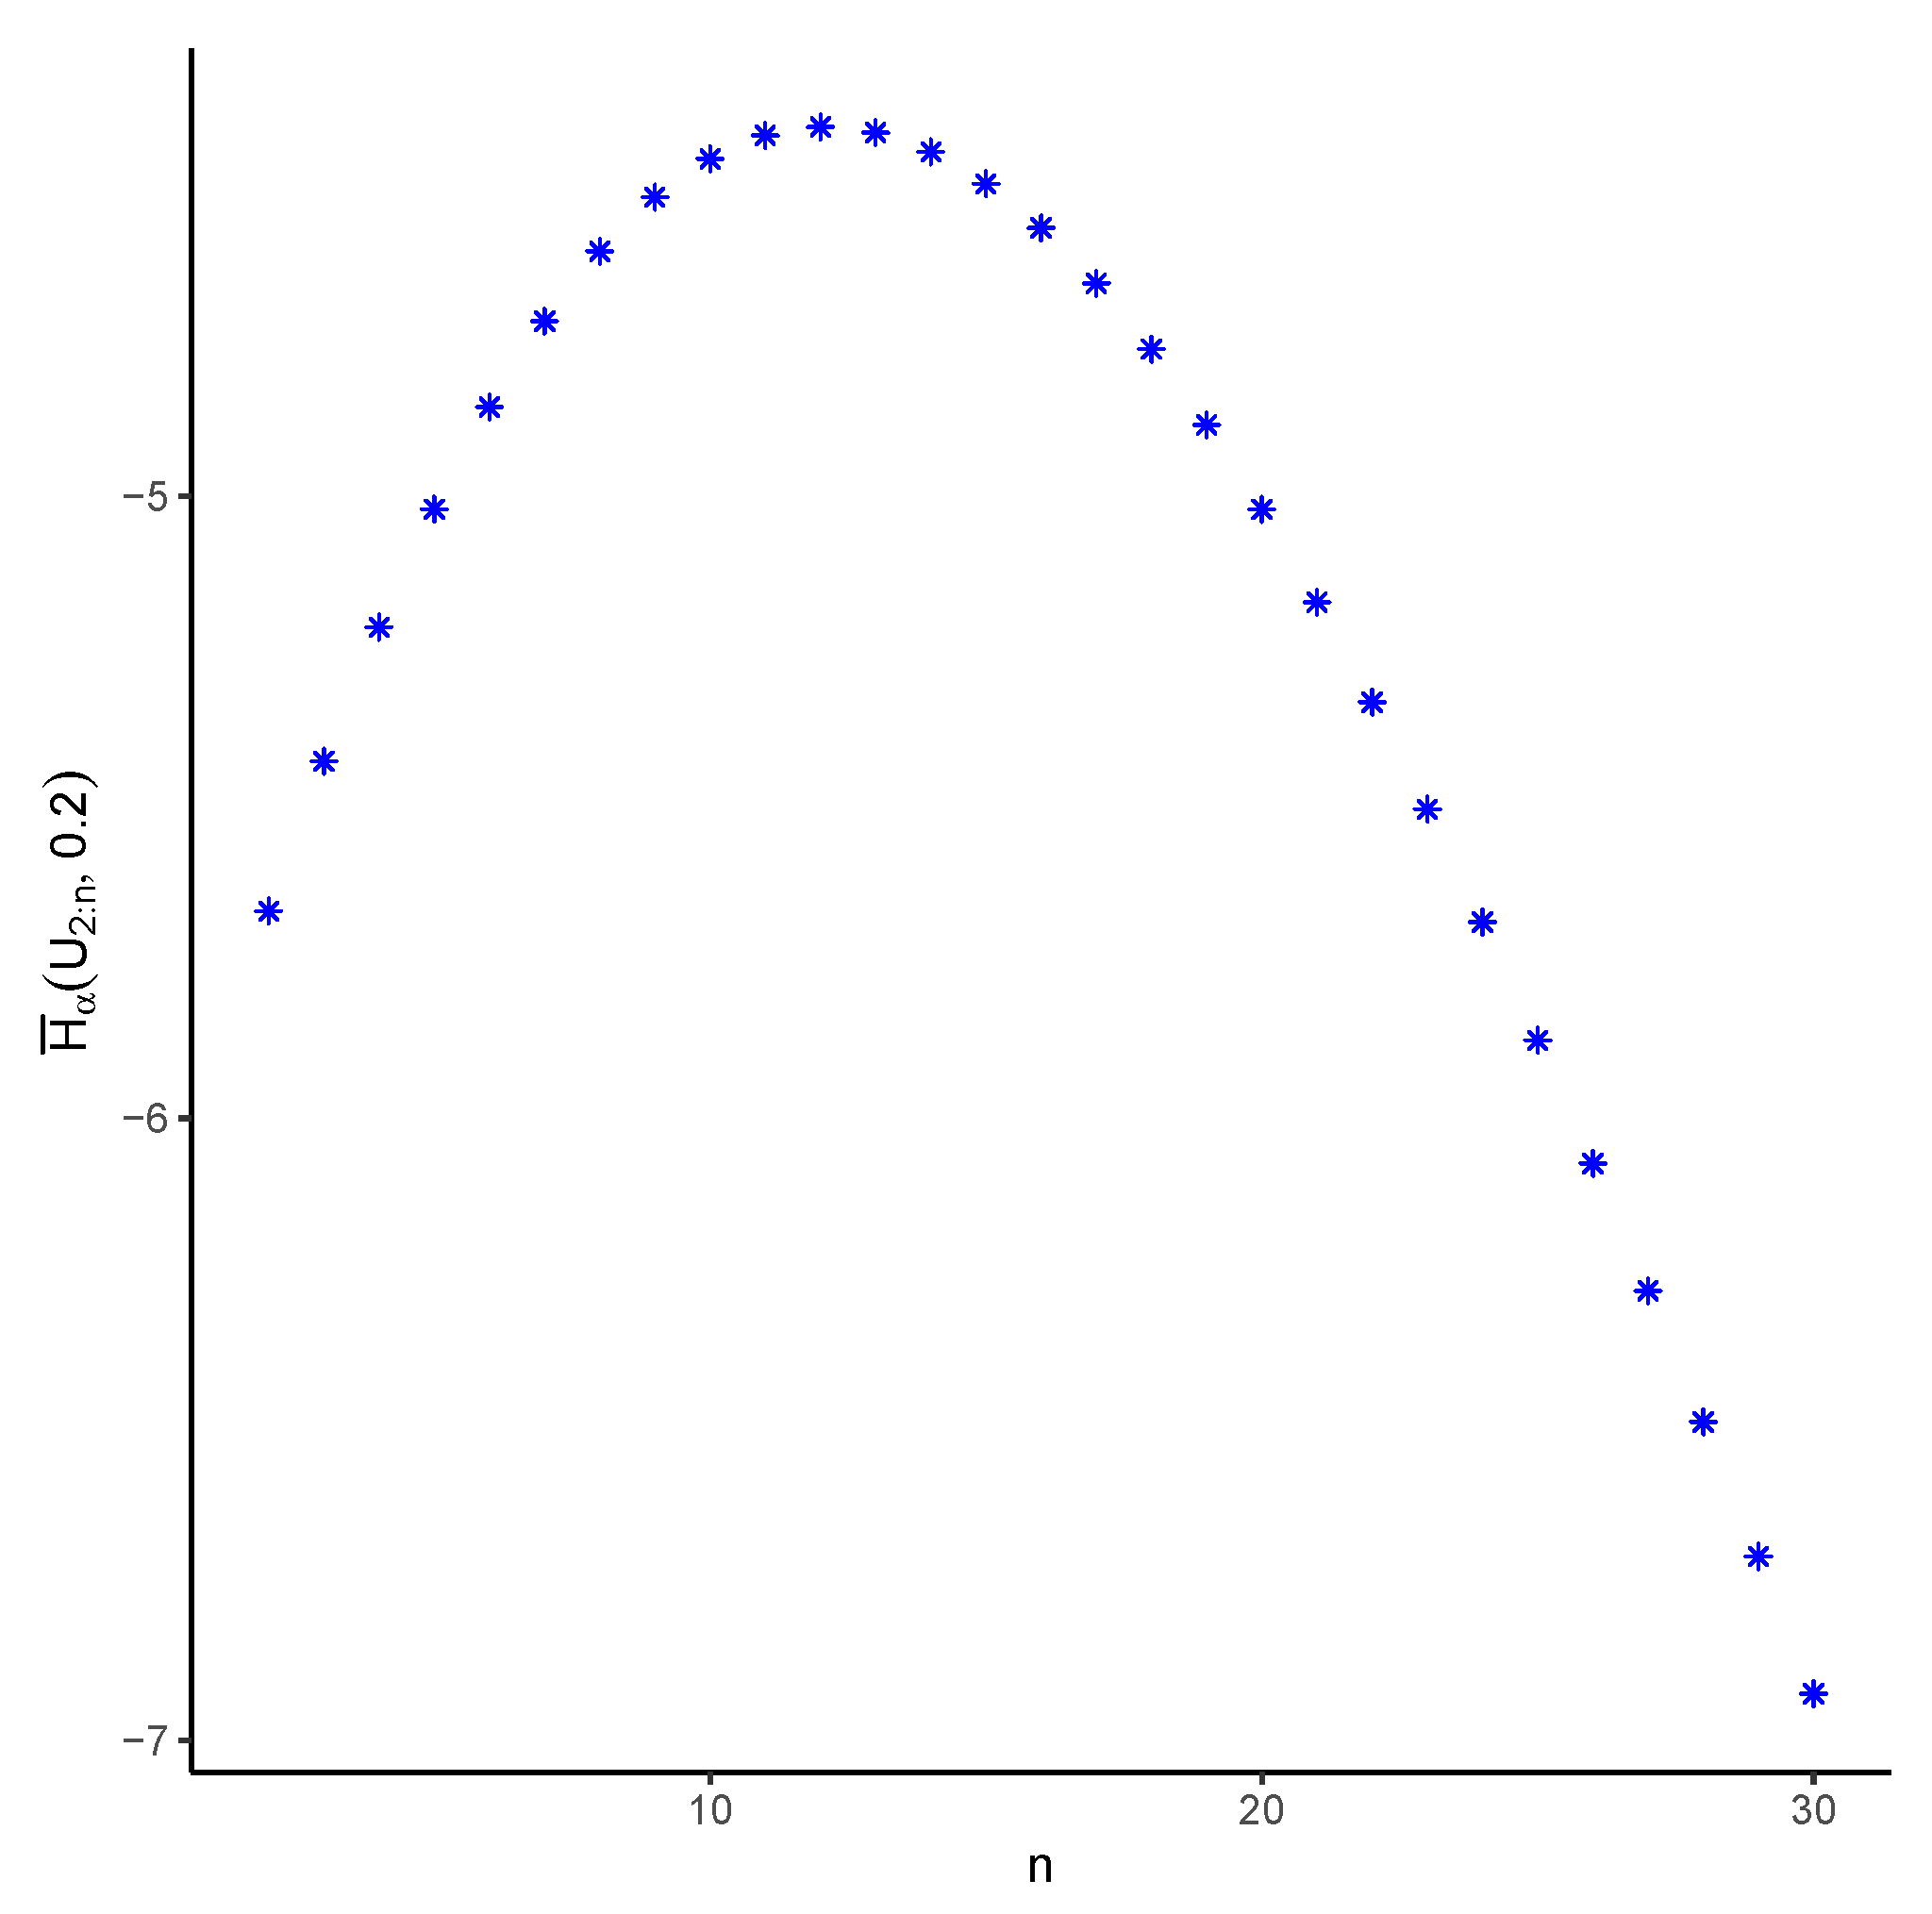
In
Figure 3, we see how the PTE of
changes with
n when
and
In fact, it is observed in the graph that the PTE of the system does not always decrease as
n increases. For example, it reveals that
is less than that of
for
.


