
Energy Analysis of Precooling Air Compressor System


Abstract
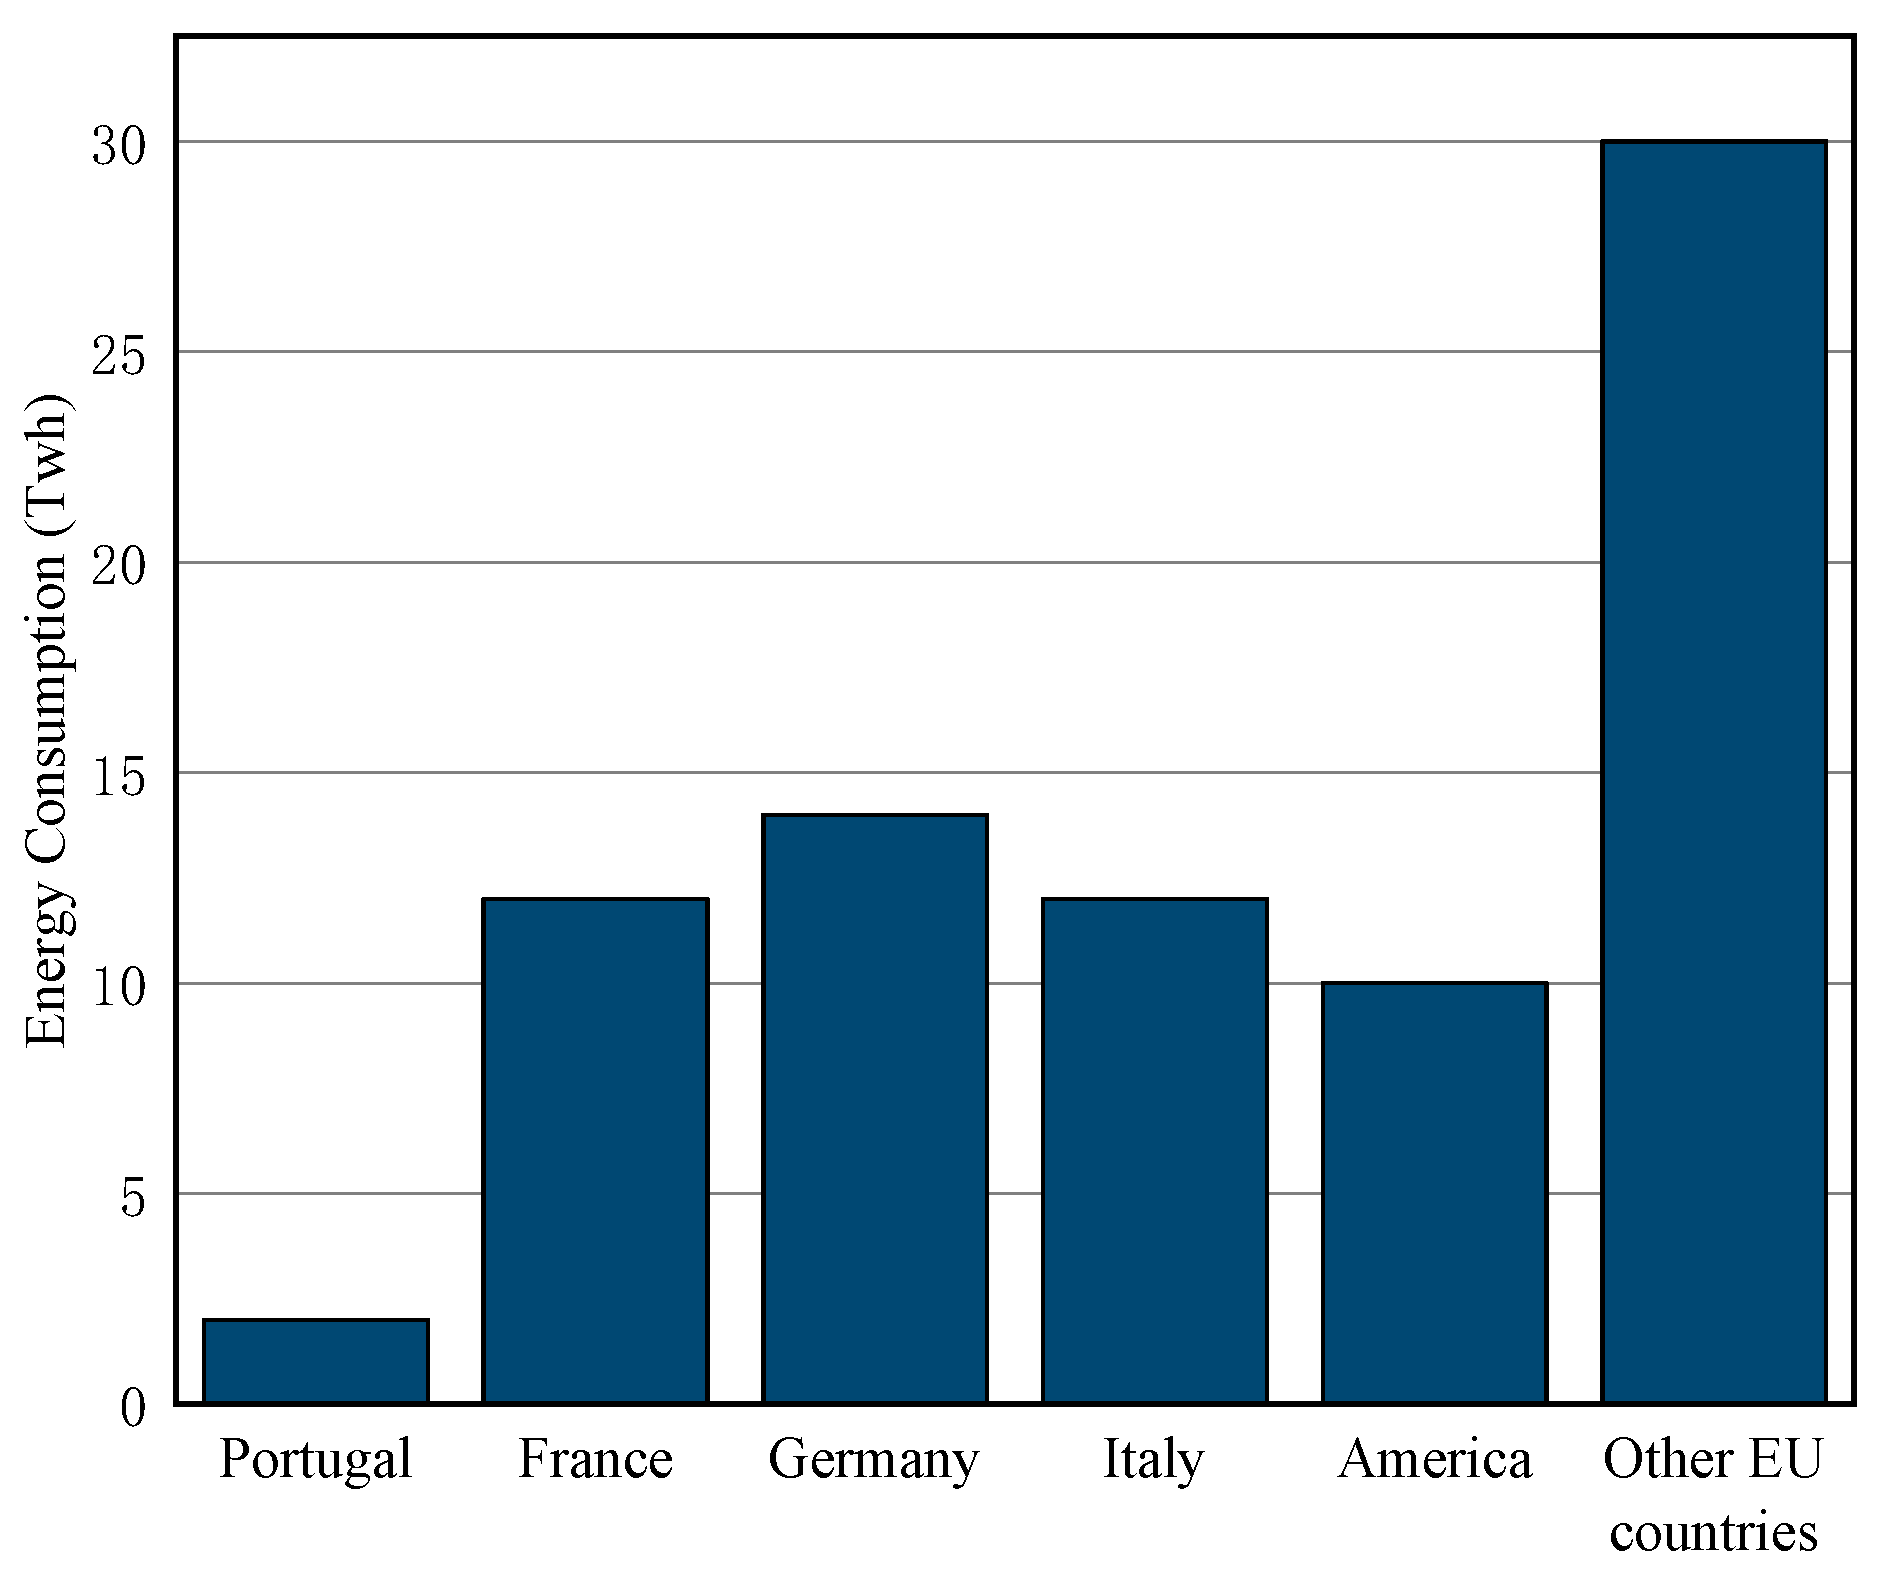
:1. Introduction
2. Basic Introduction of the Precooling Air Compressor System
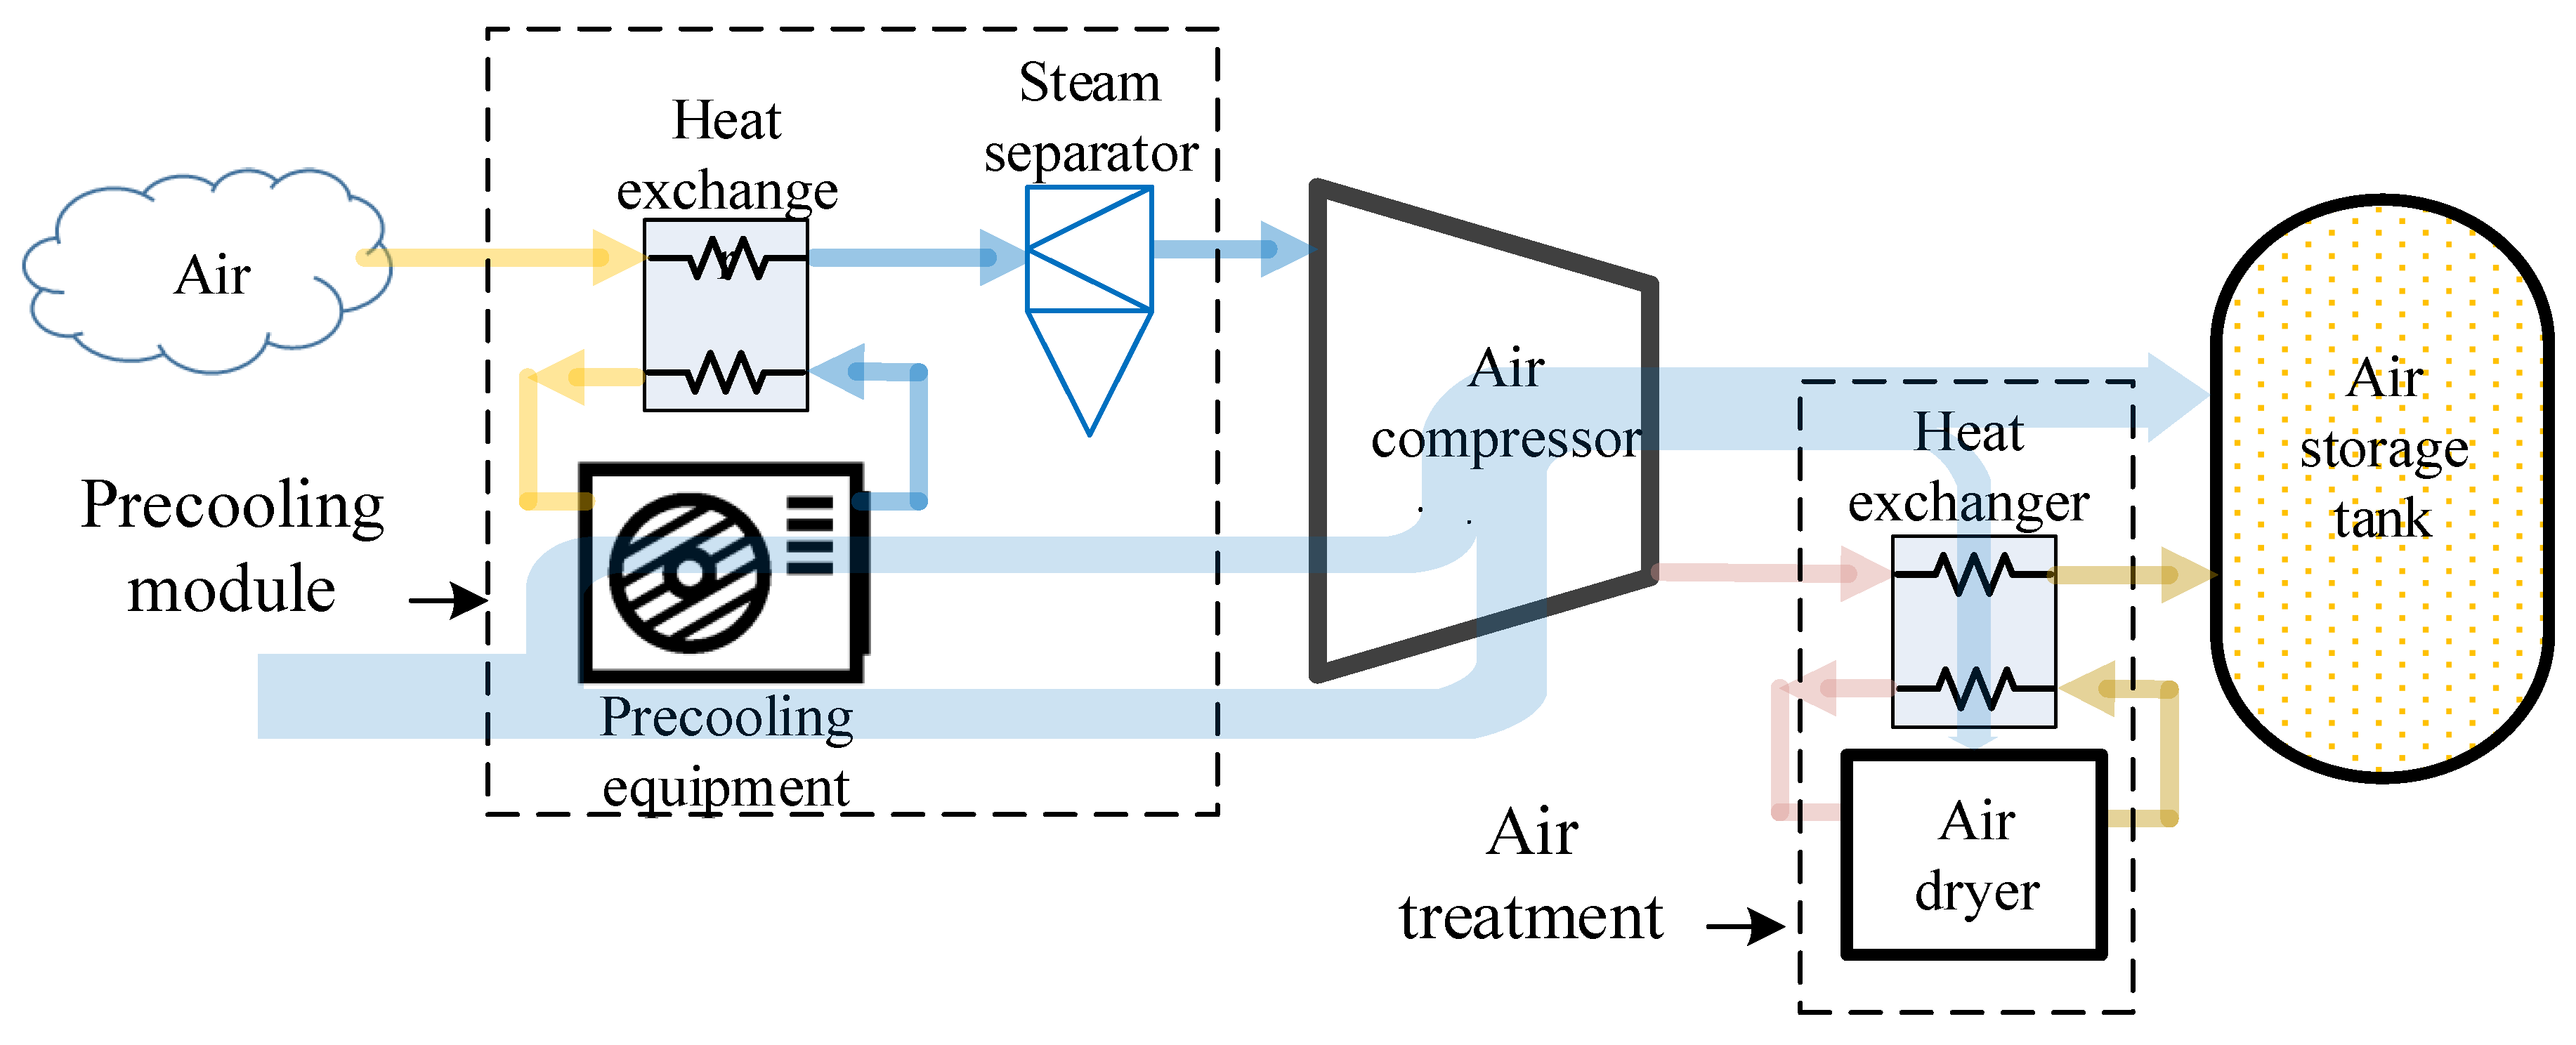
2.1. Precooling Air Compressor System
2.2. System Modeling
2.2.1. Traditional Air Compressor Modeling
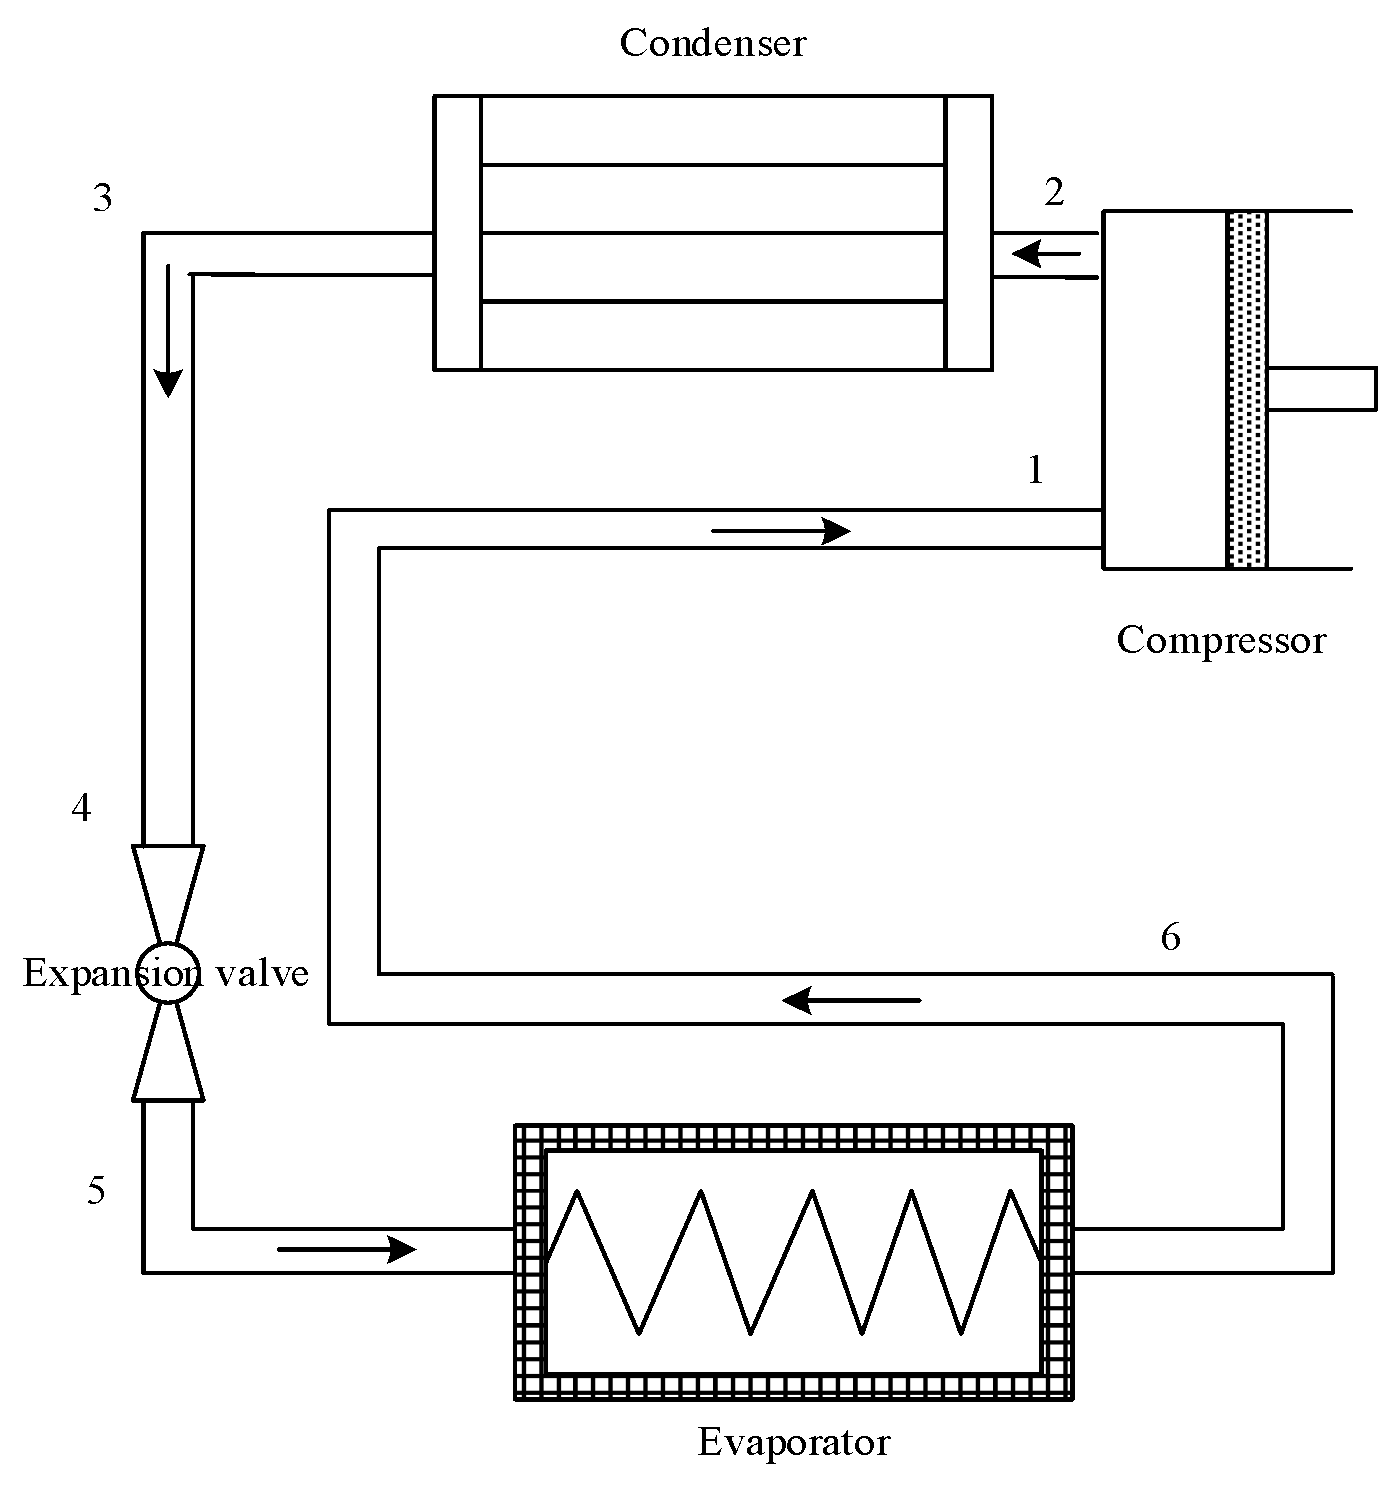
2.2.2. Precooling Module Modeling
- (1)
- All components in the precooling module are in a steady state.
- (2)
- The compression processes in the precooling module are reversible and have a given isentropic efficiency.
- (3)
- The throttling processes in the expansion valve are isenthalpic.
- (4)
- The refrigerant at the outlet of the condenser and evaporator is saturated.
- (5)
- The pressure loss and heat loss of the refrigerant in the refrigeration cycle are ignored.
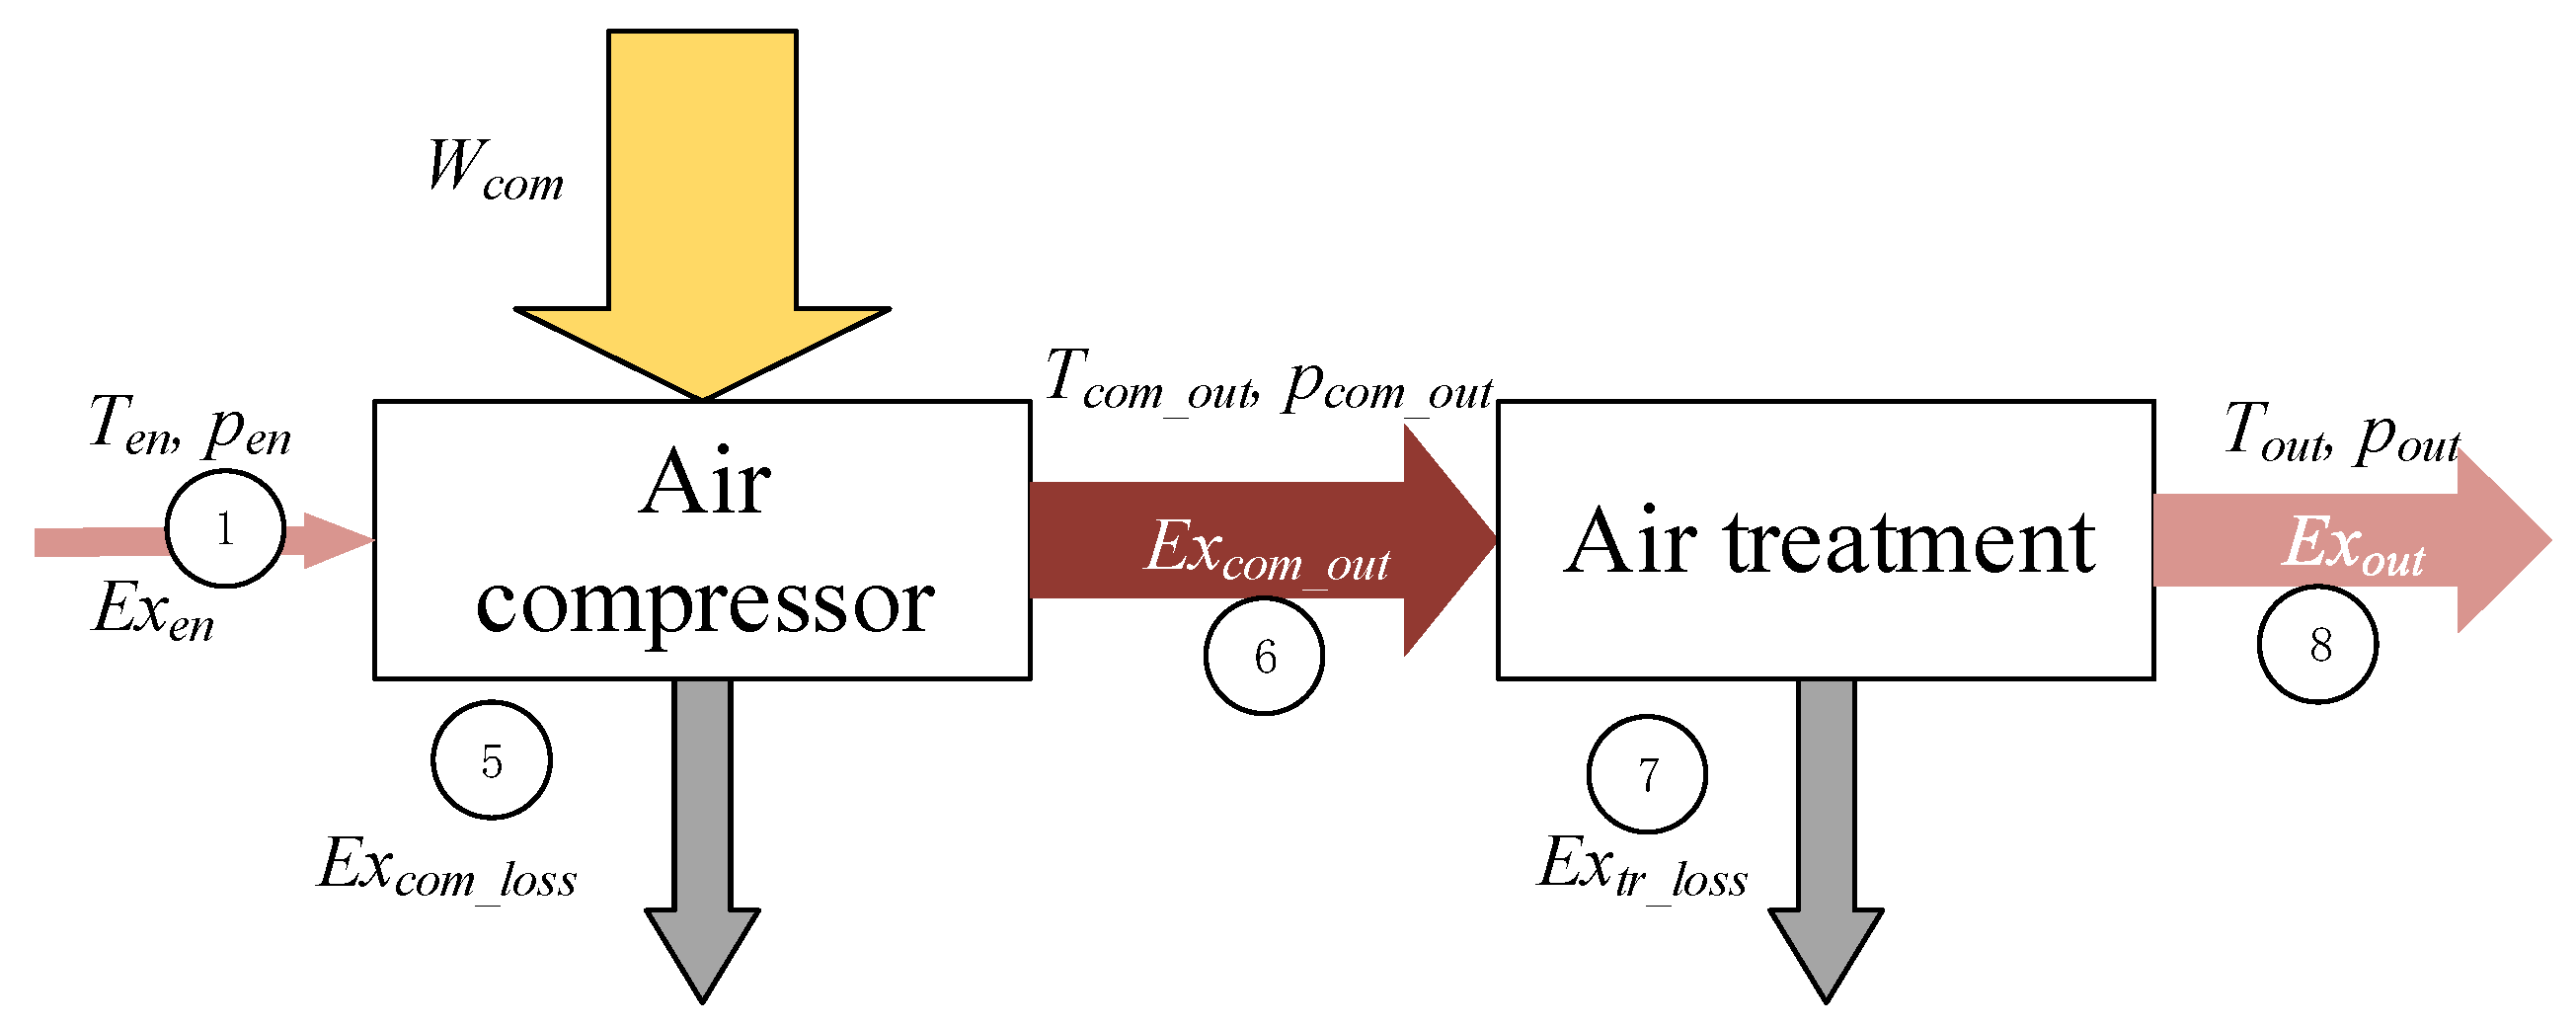
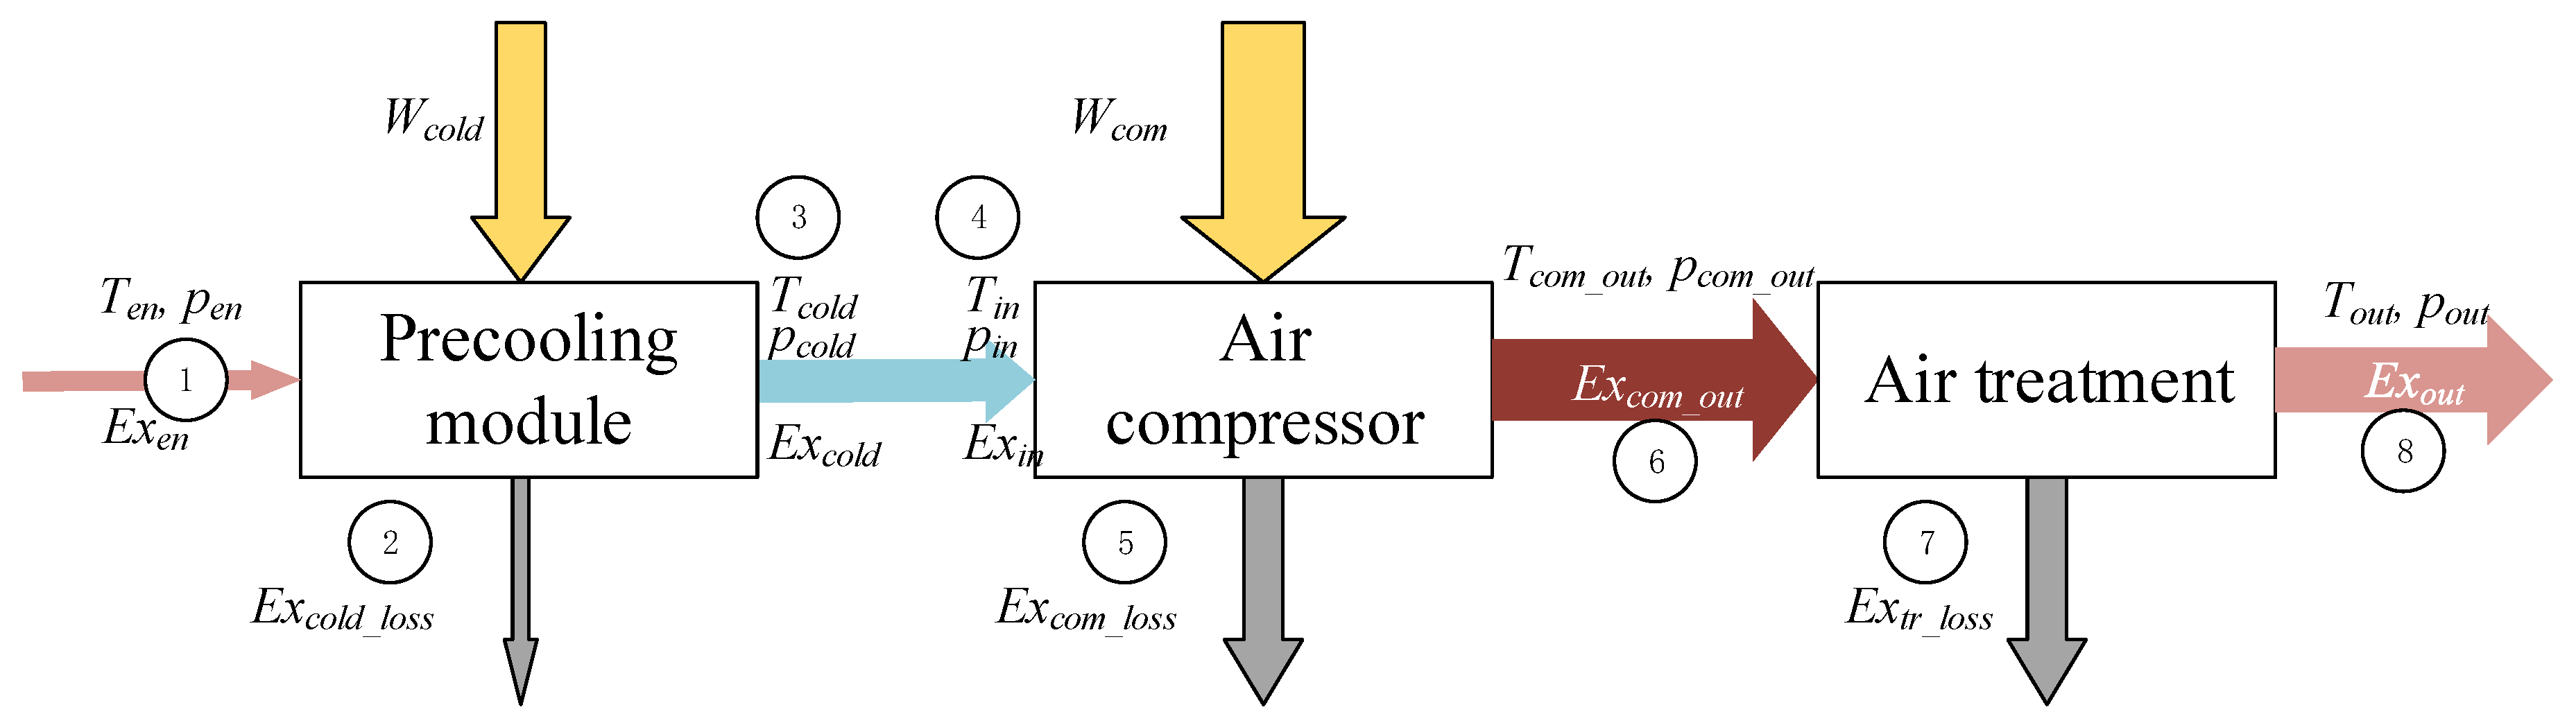
2.2.3. Exergy Analysis
2.3. Energy Efficiency Evaluation Index of the Air Compressor System
3. Theoretical Analysis and Results
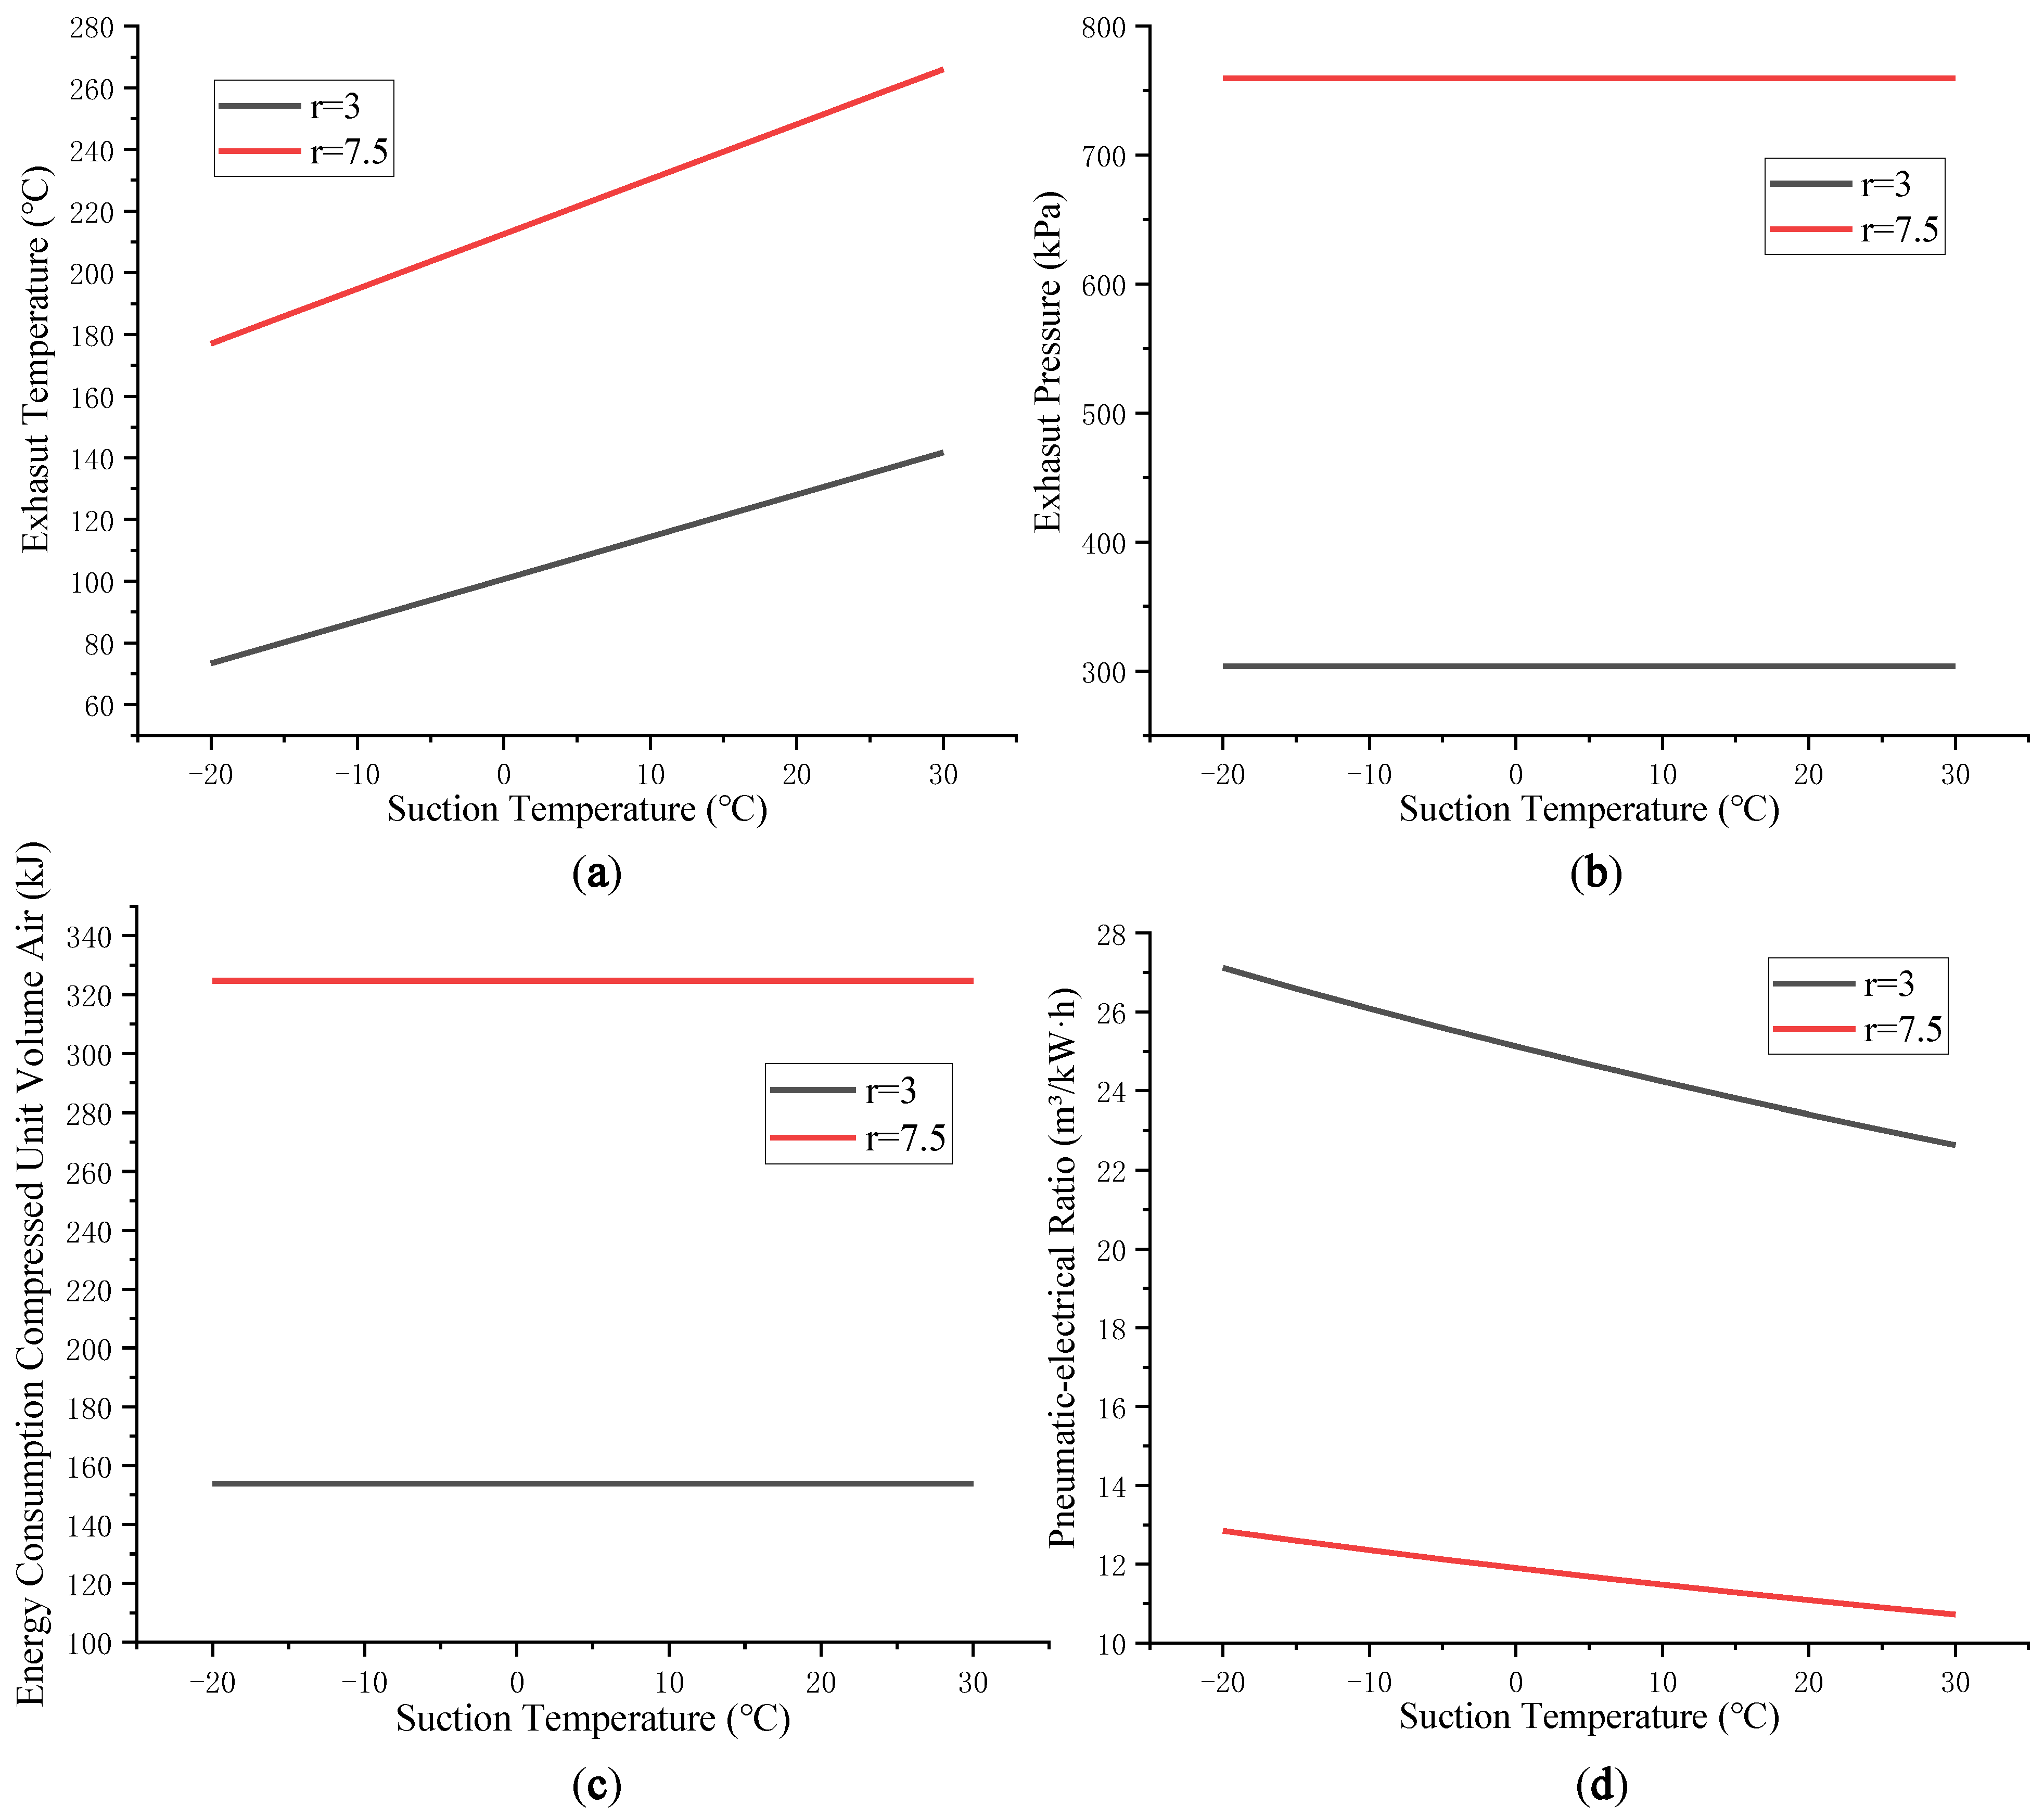
3.1. Effect of Suction Temperature Tin on the Air Compressor System
3.2. Effect of Temperatures on the Precooling Module
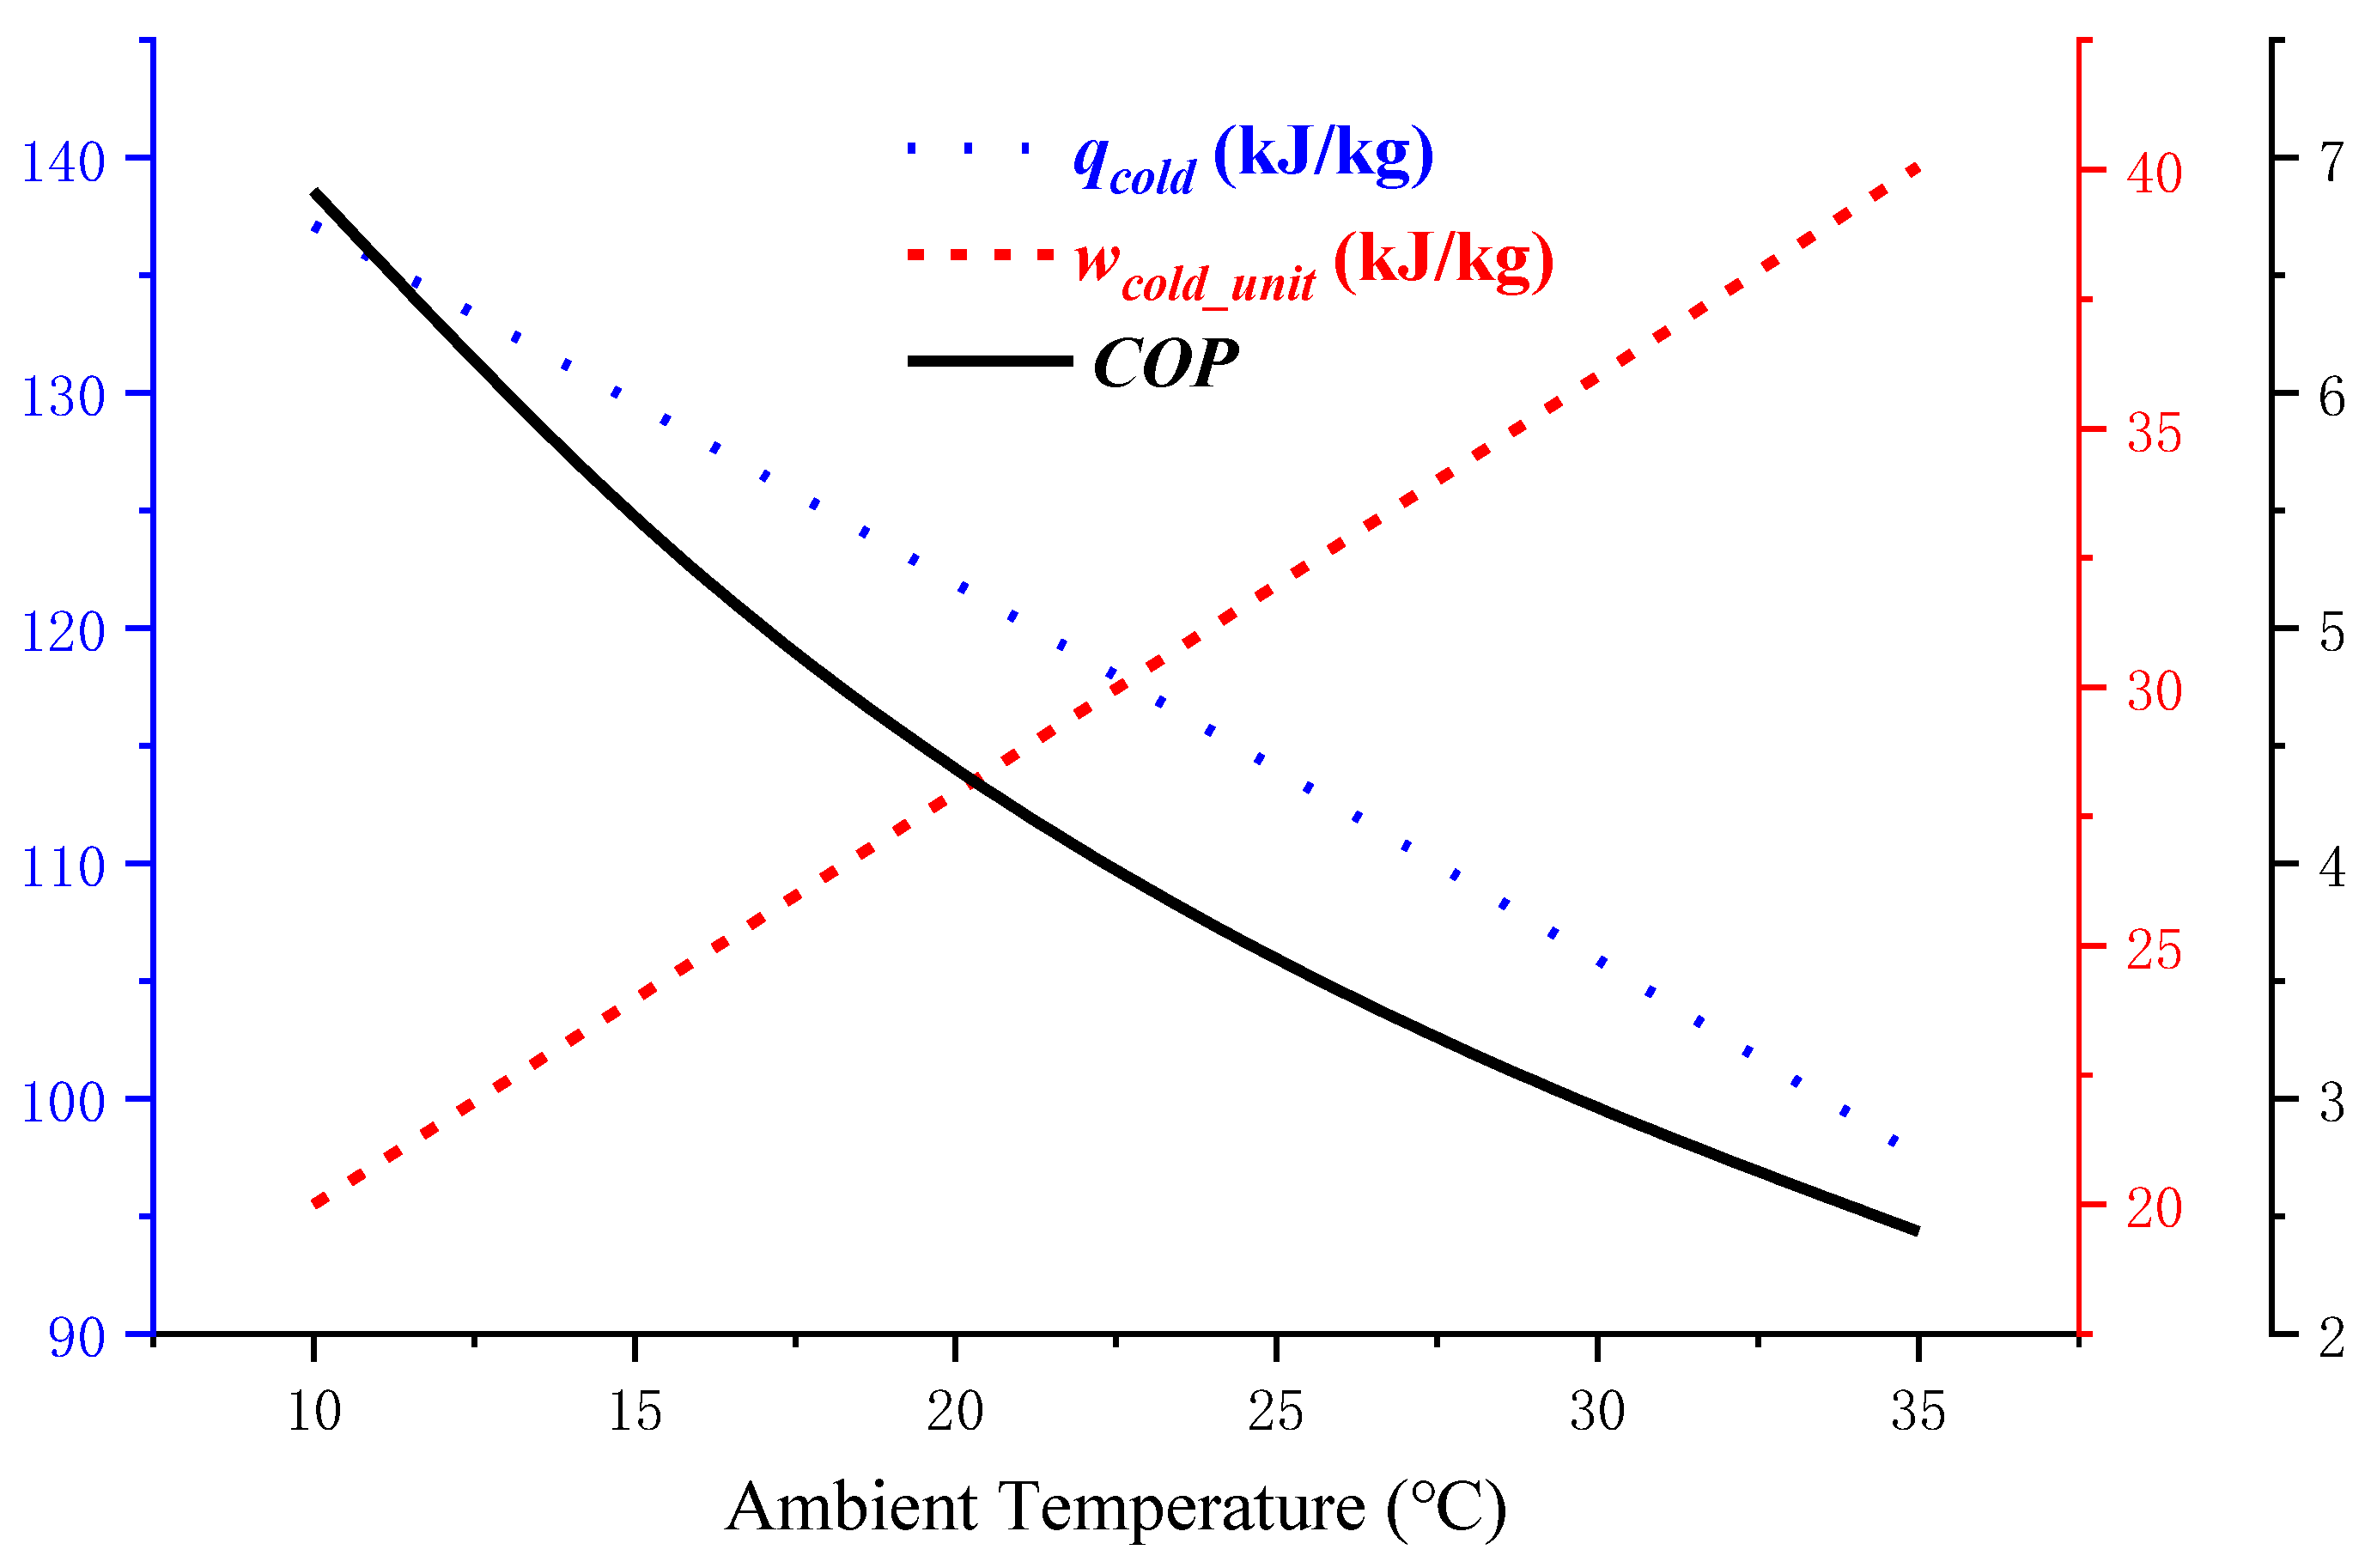
3.2.1. Impact of Ambient Temperature Ten on COP
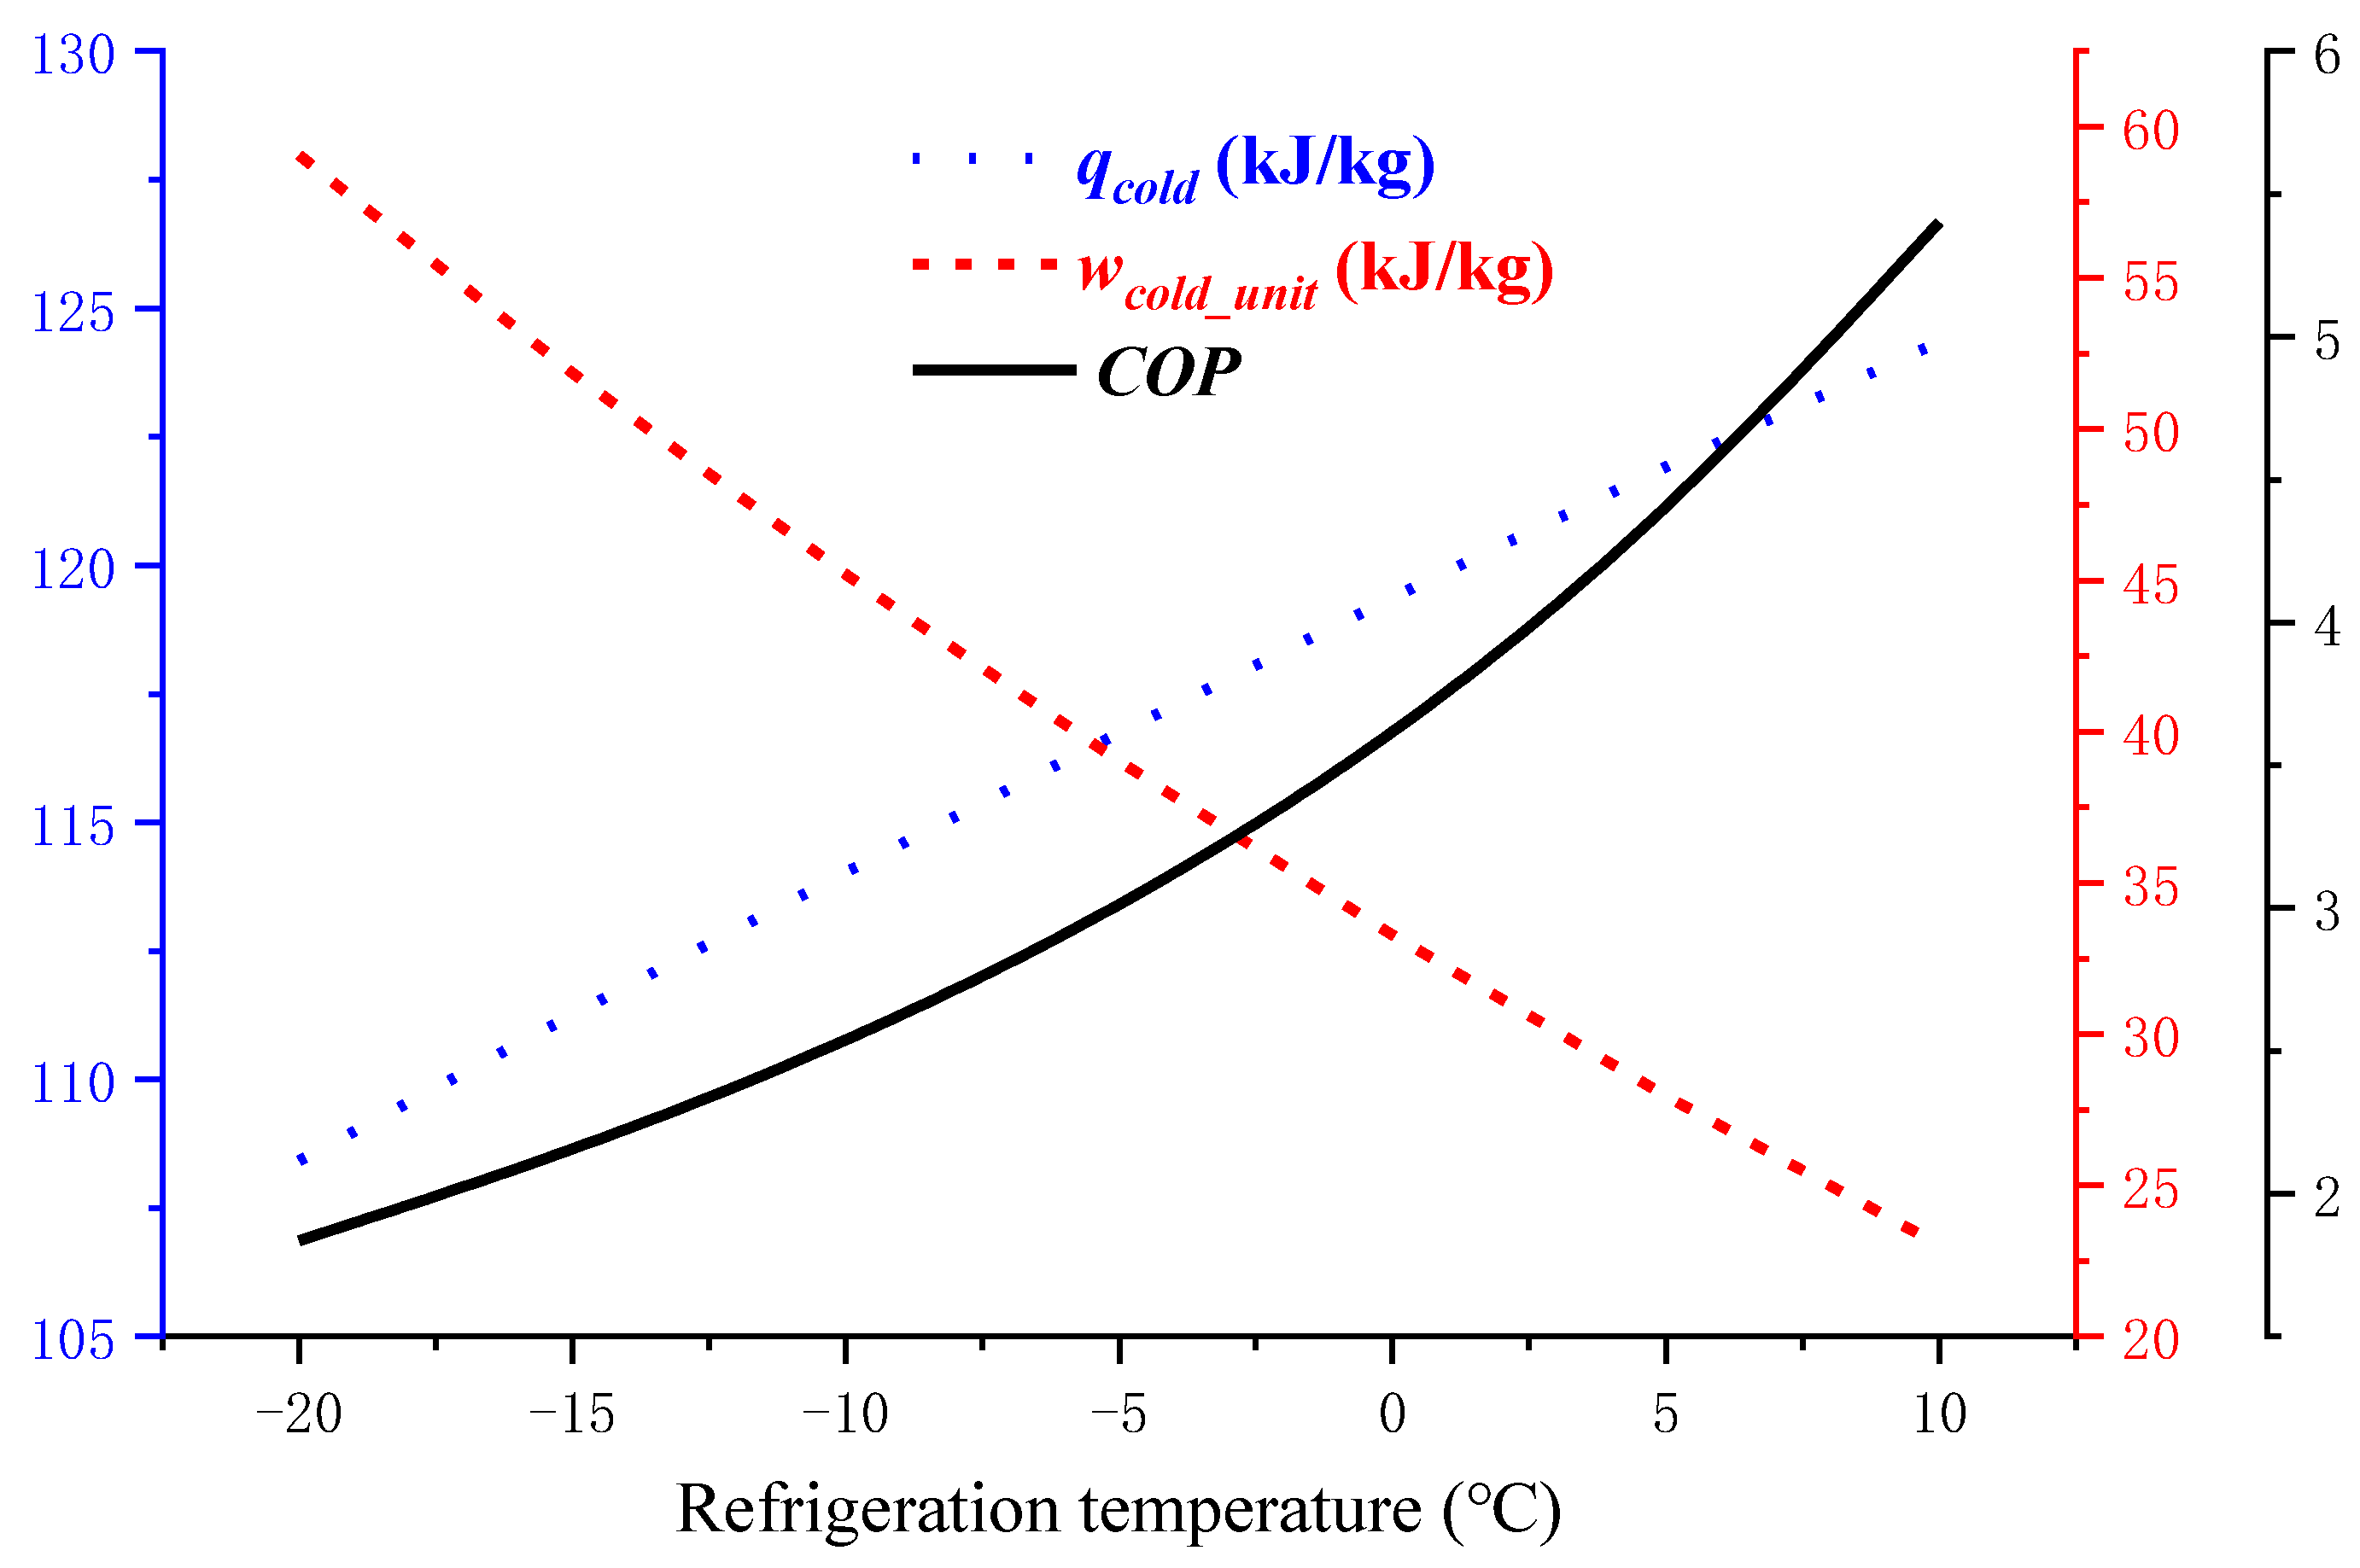
3.2.2. Impact of Refrigeration Temperature Tcold on COP
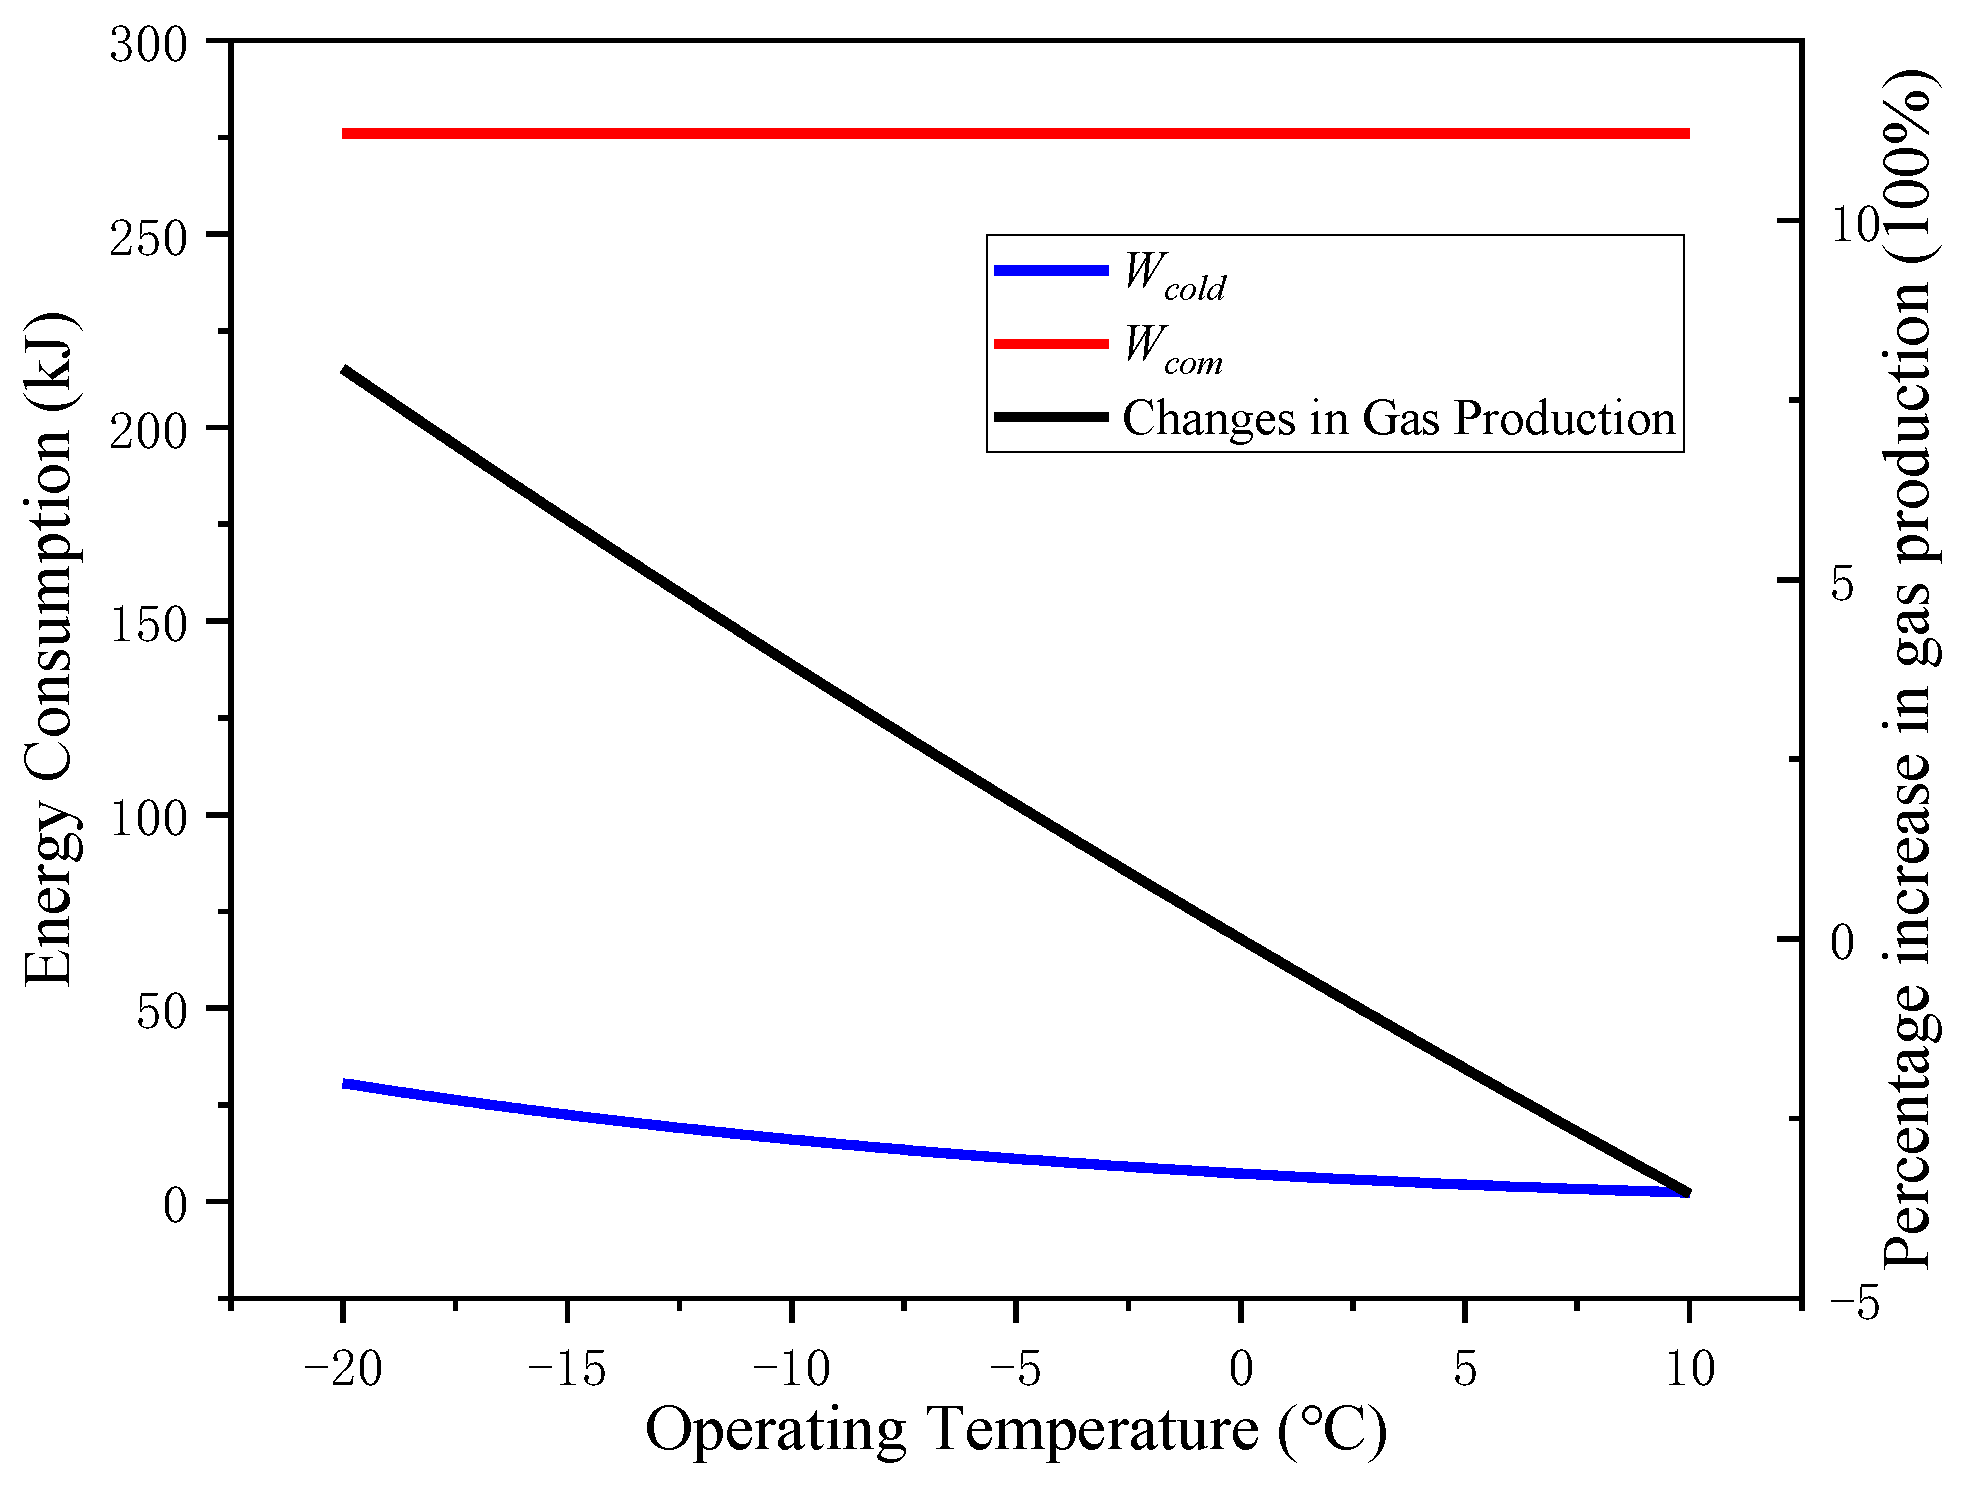
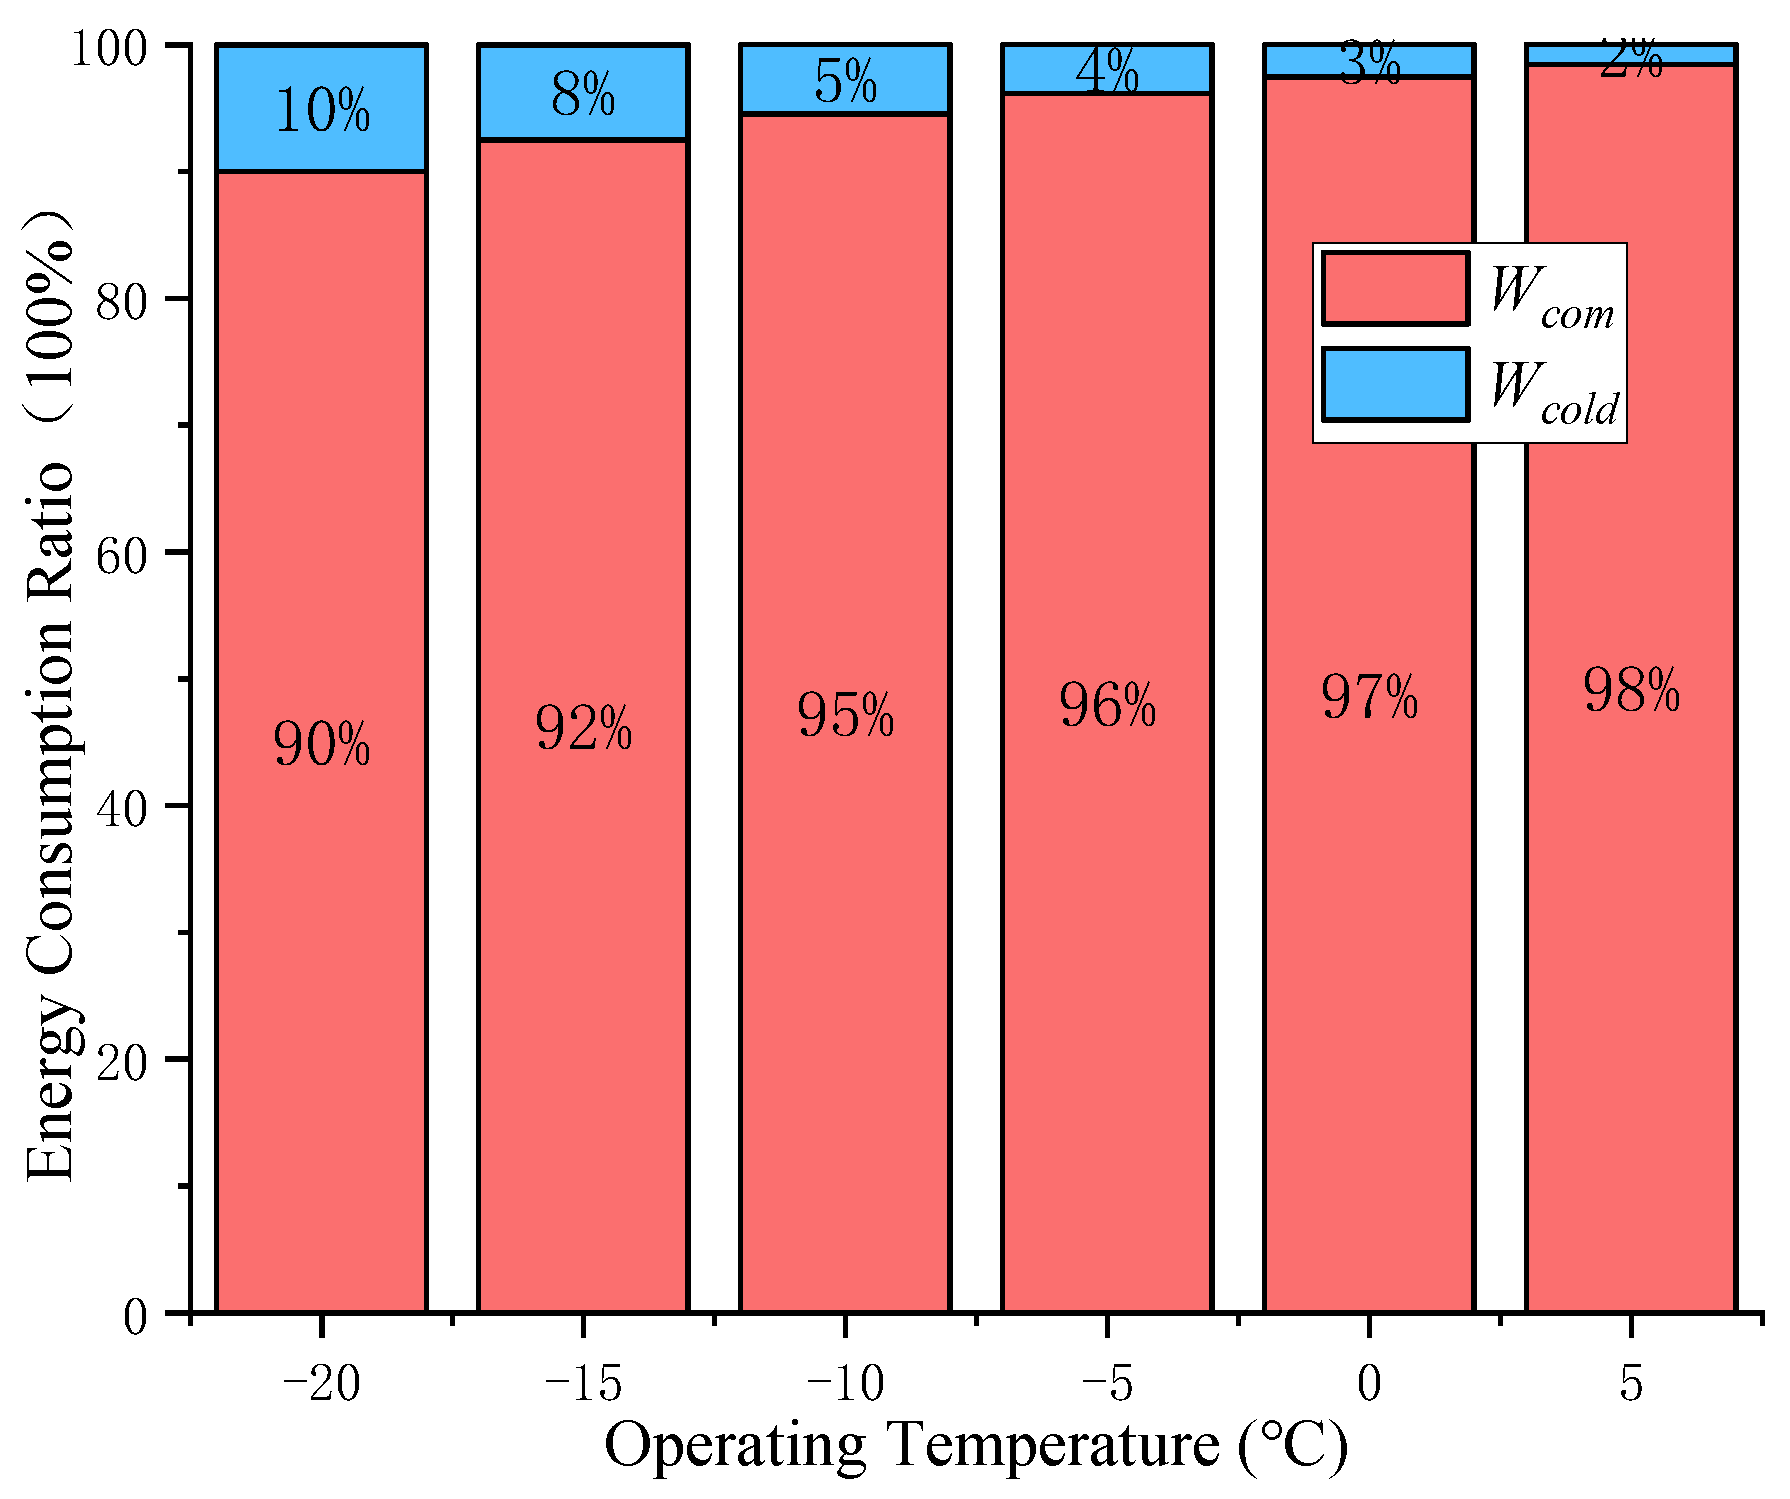
3.3. Effect of the Operating Temperature Top on the Precooling Air Compressor System
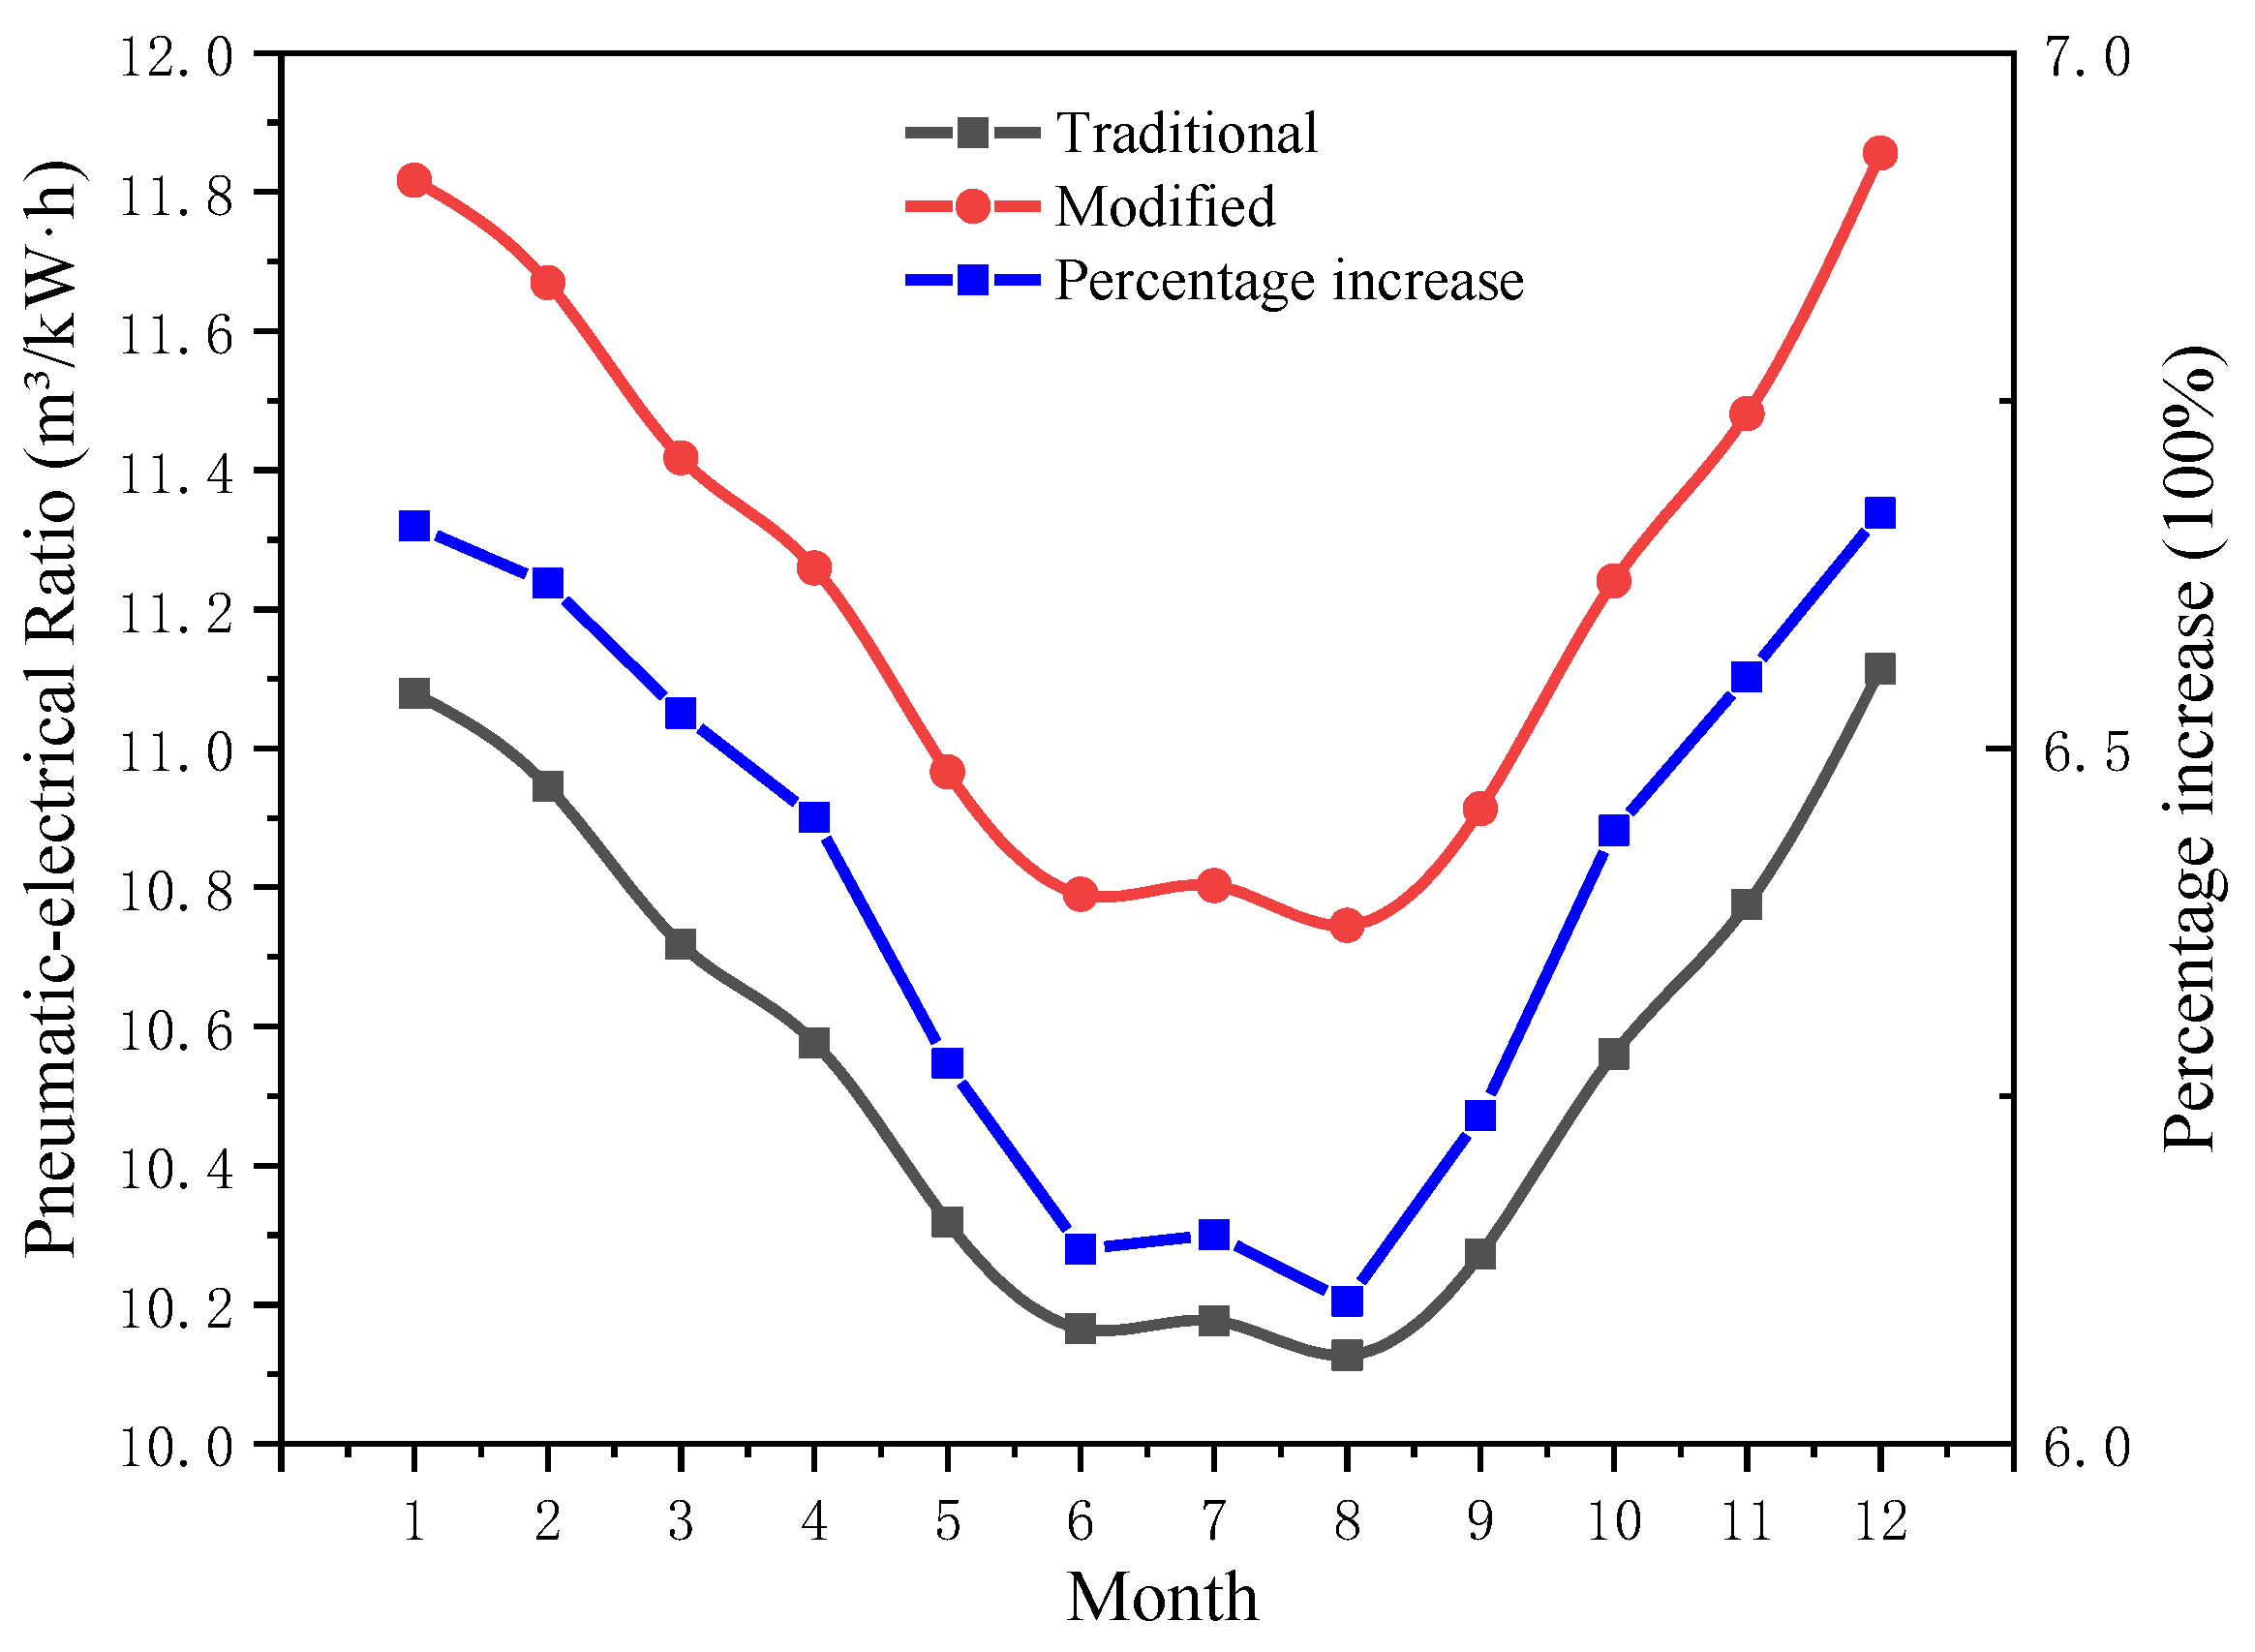
3.3.1. Difference in the Pneumatic-Electrical Ratio between the Precooling Air Compressor System and the Traditional Air Compressor System
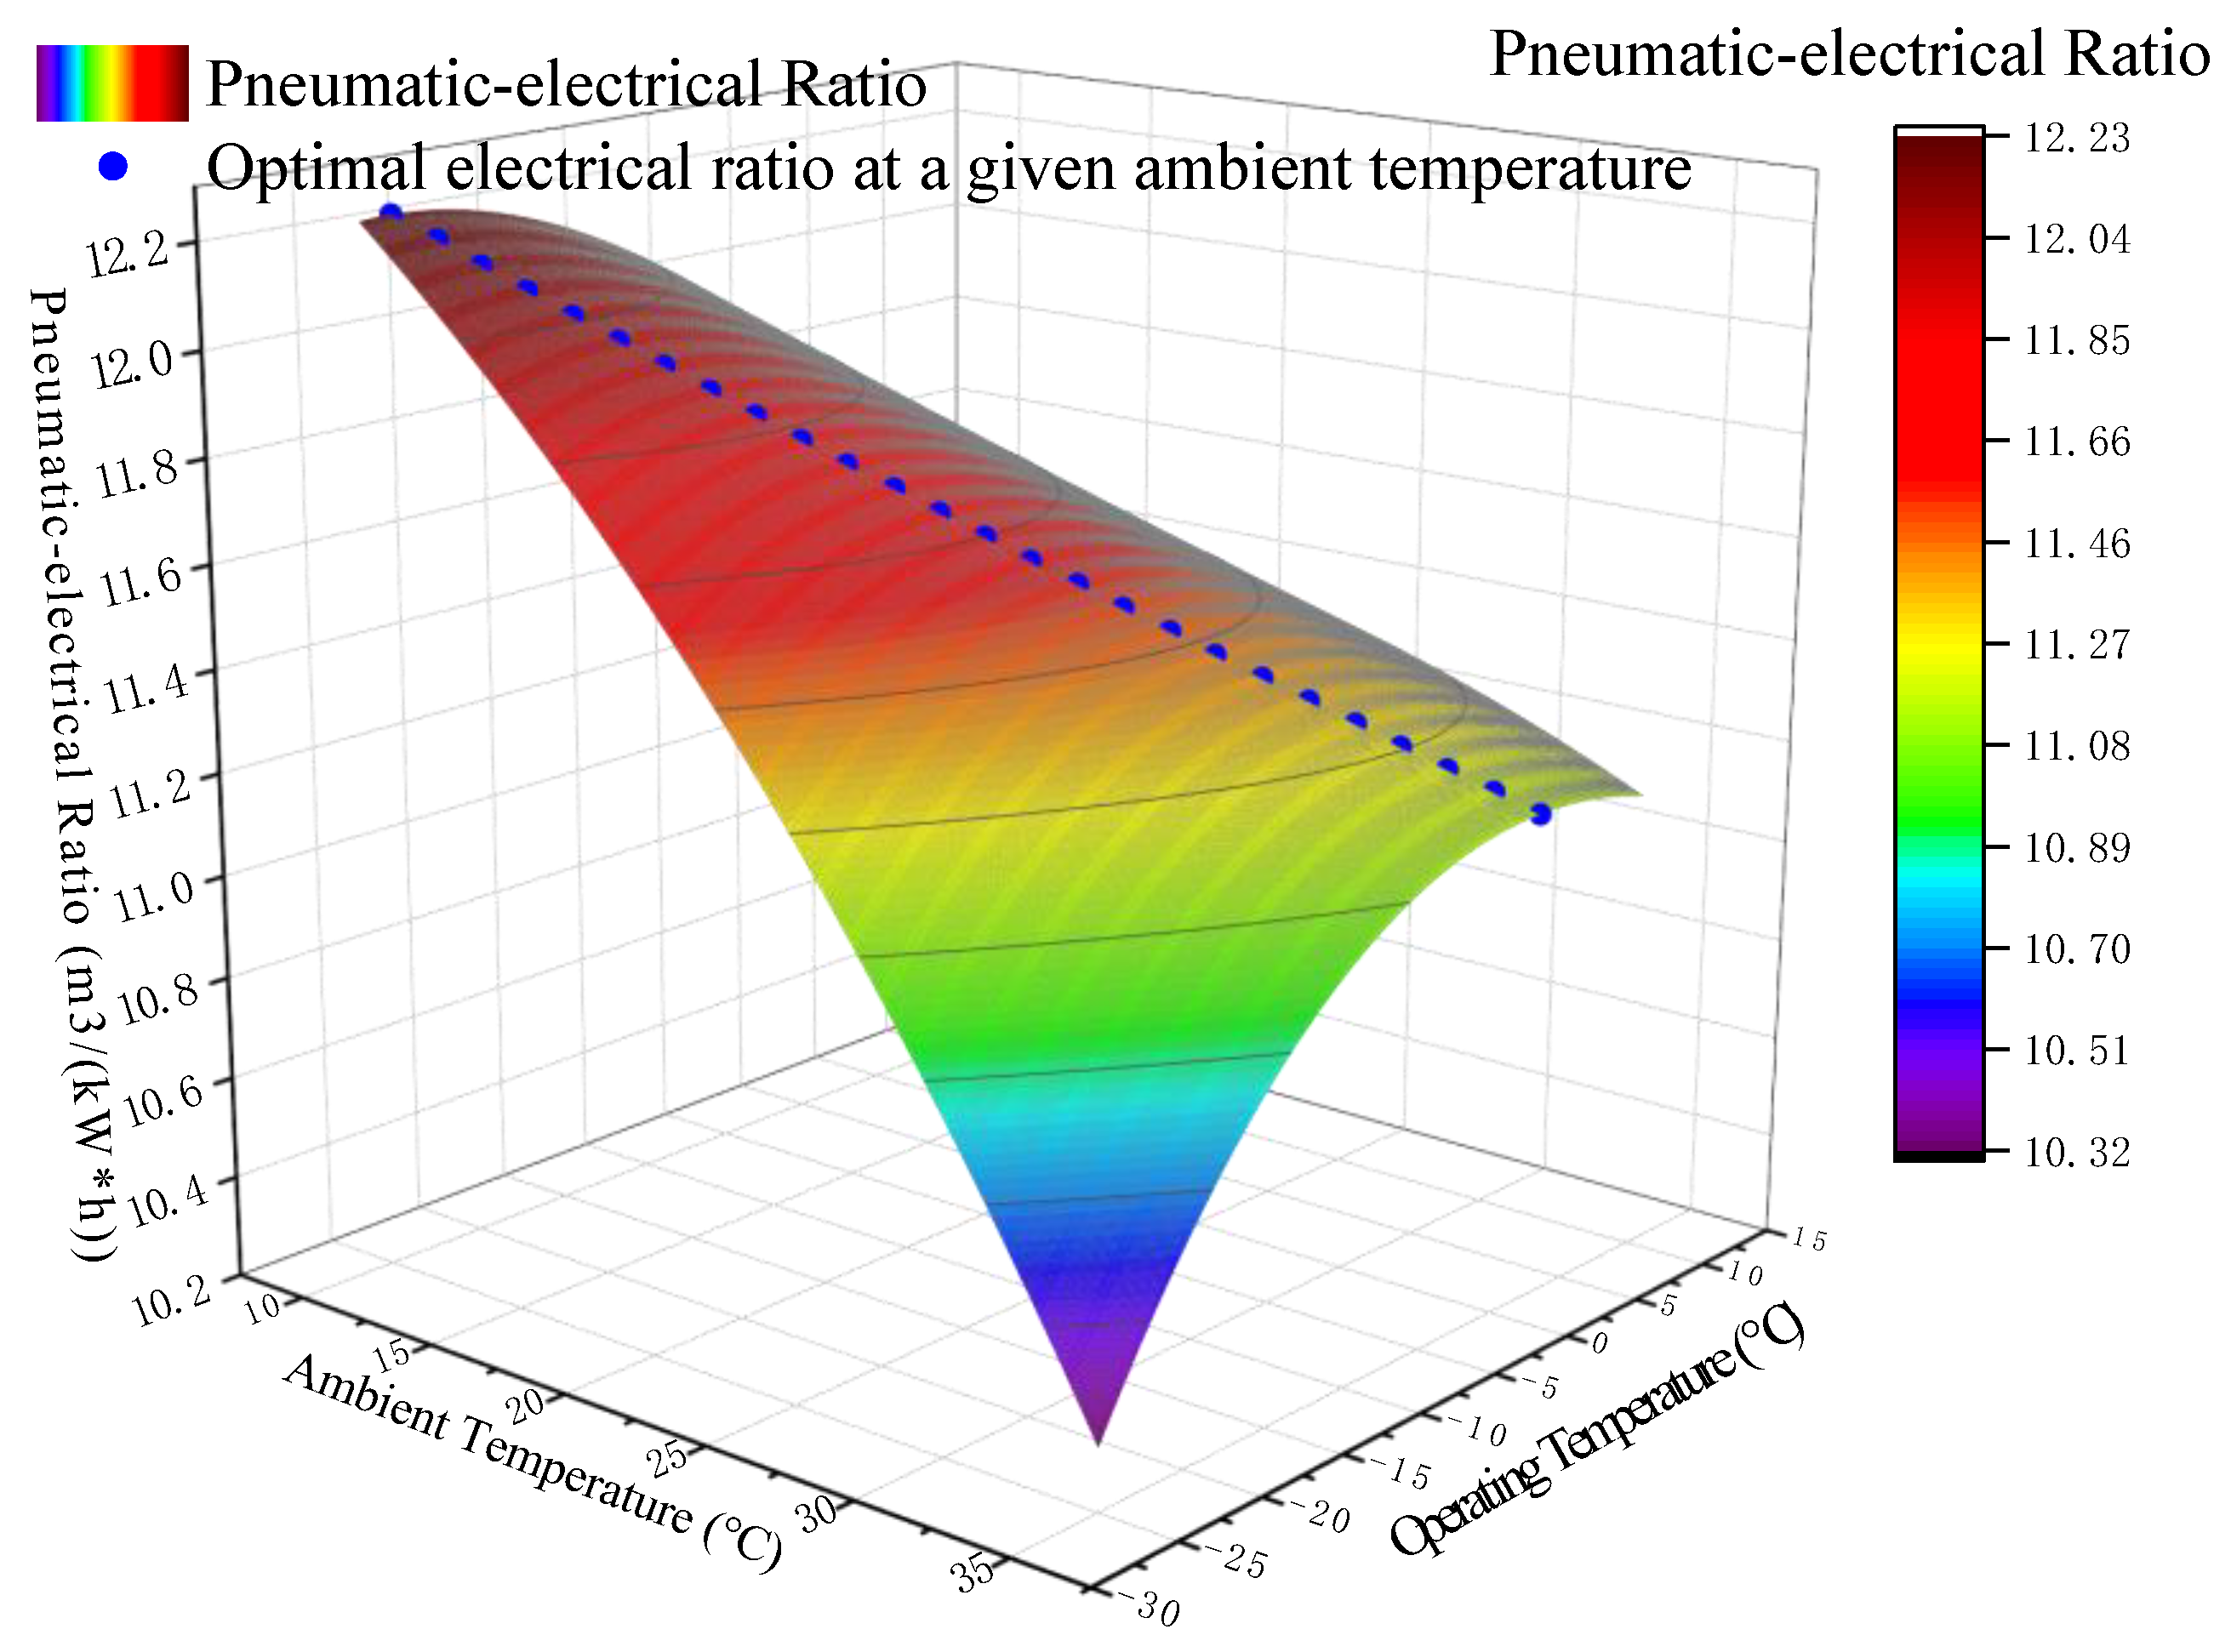
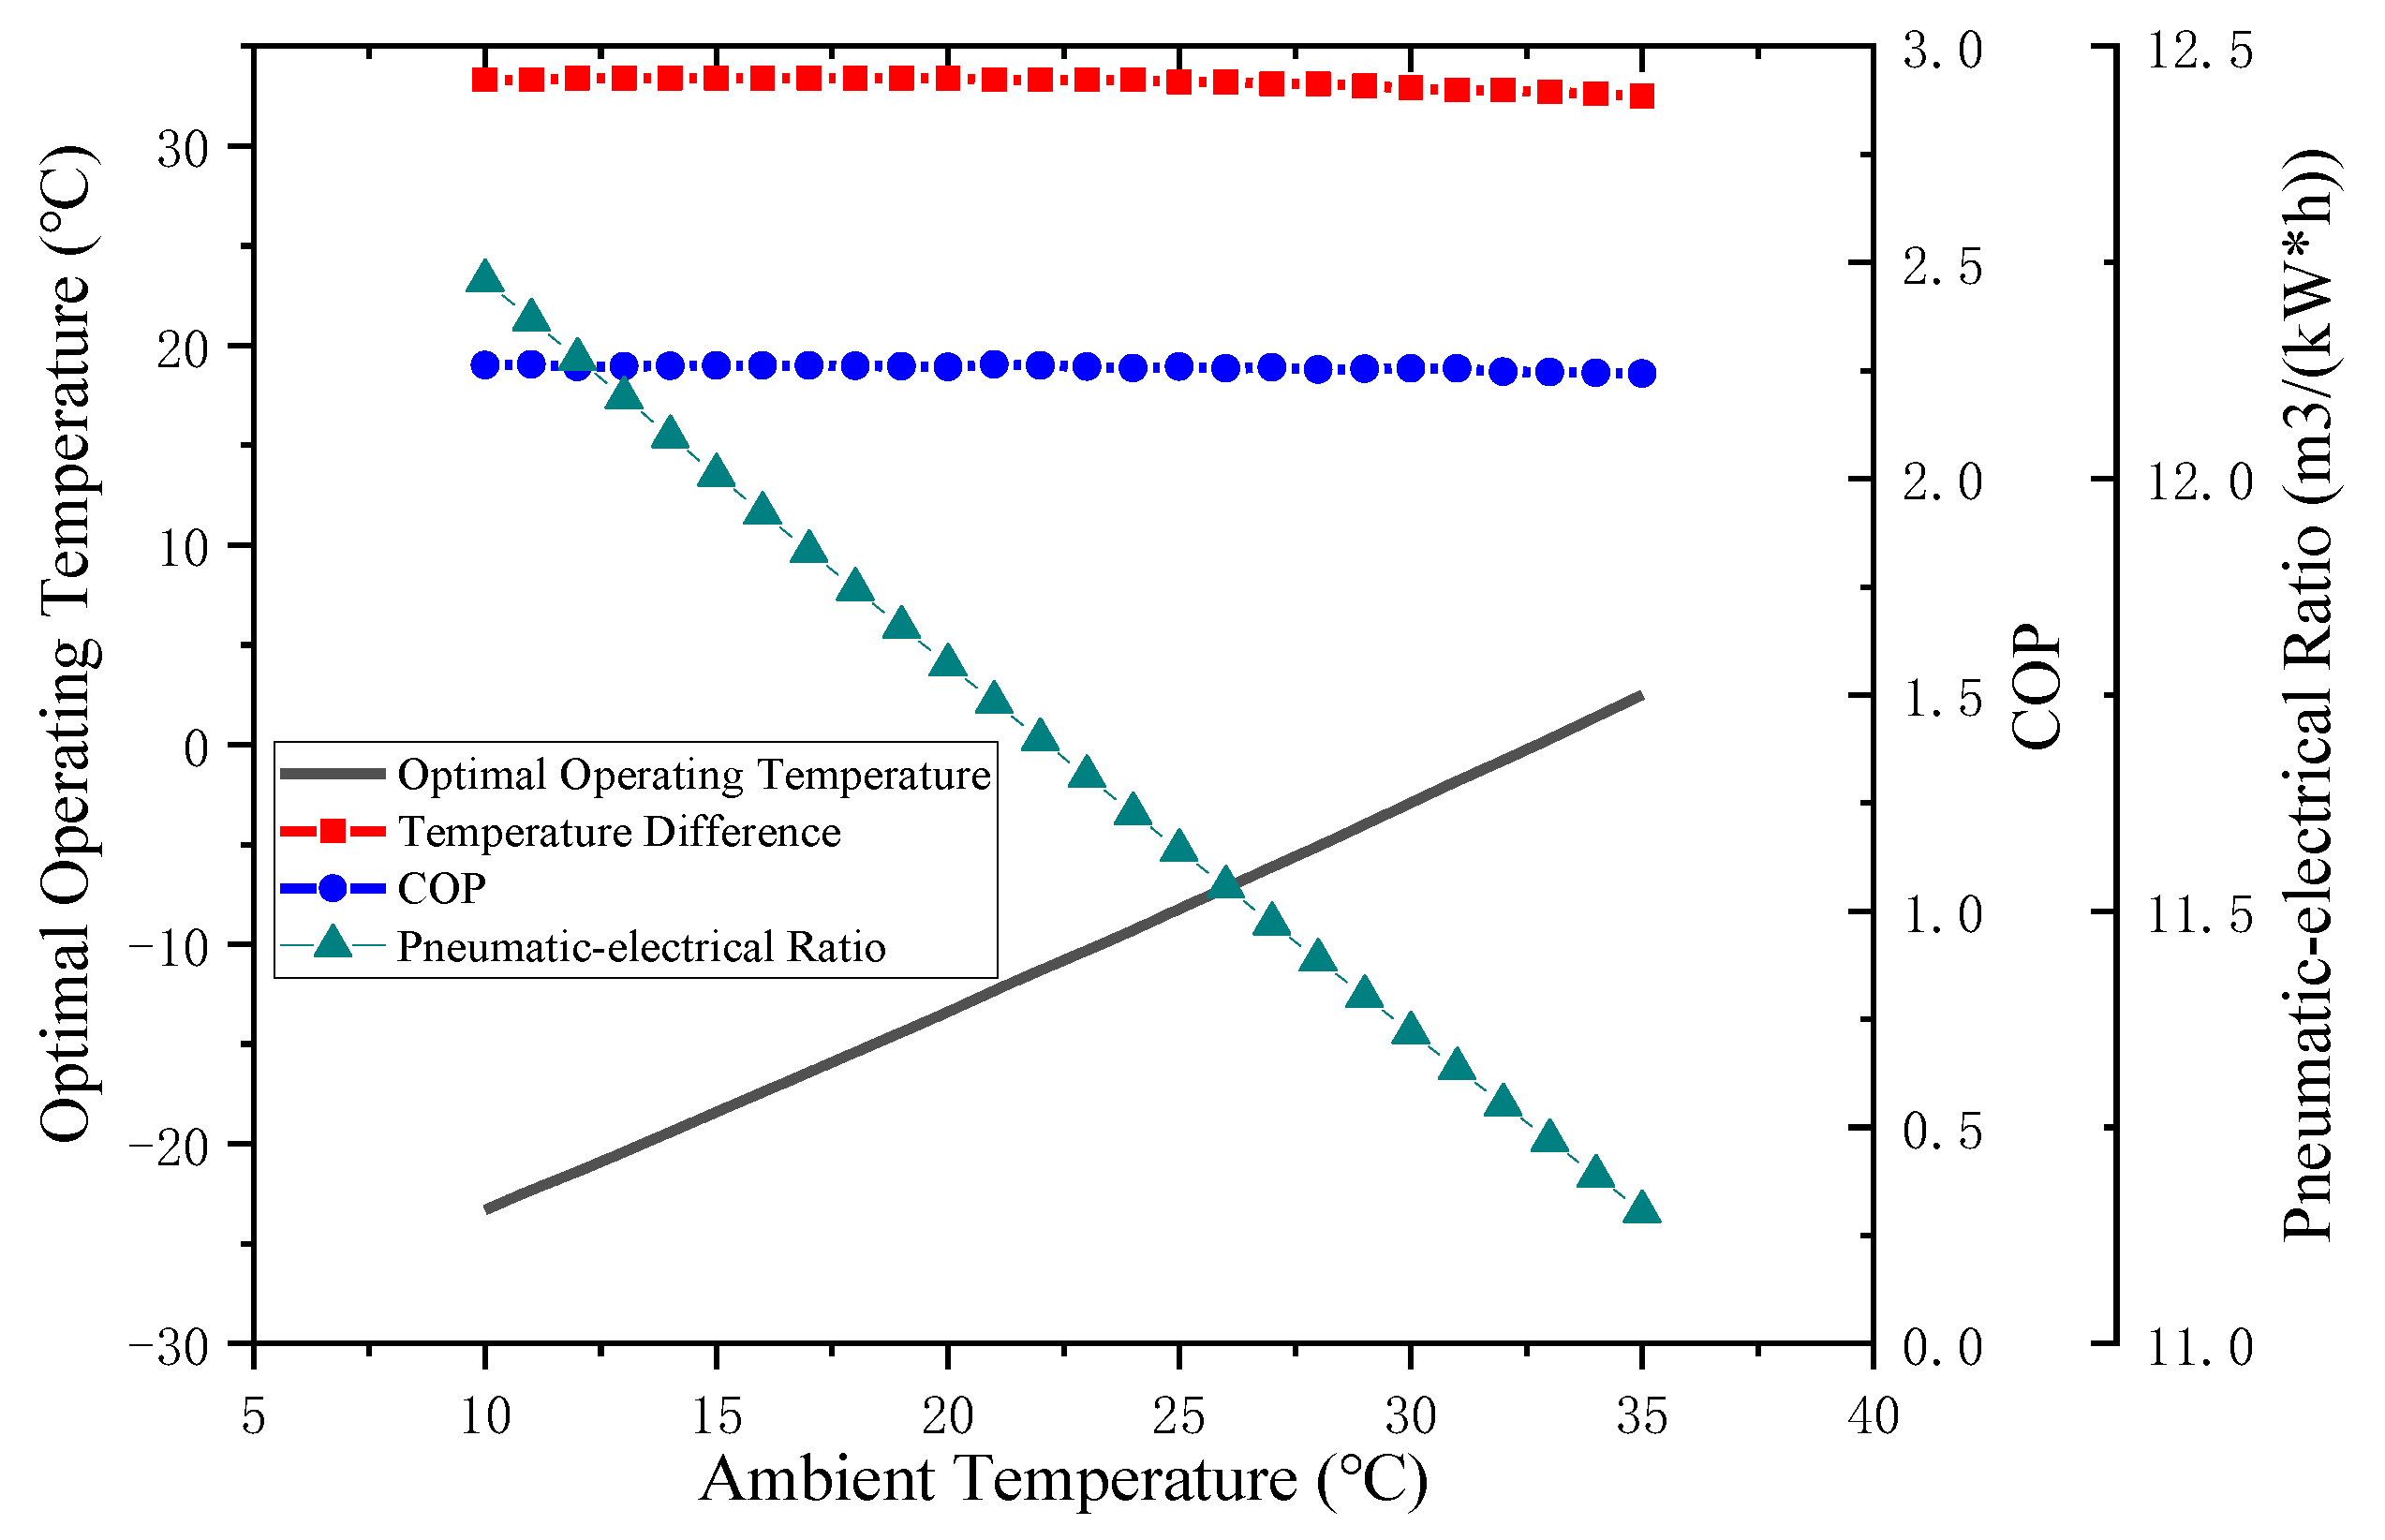
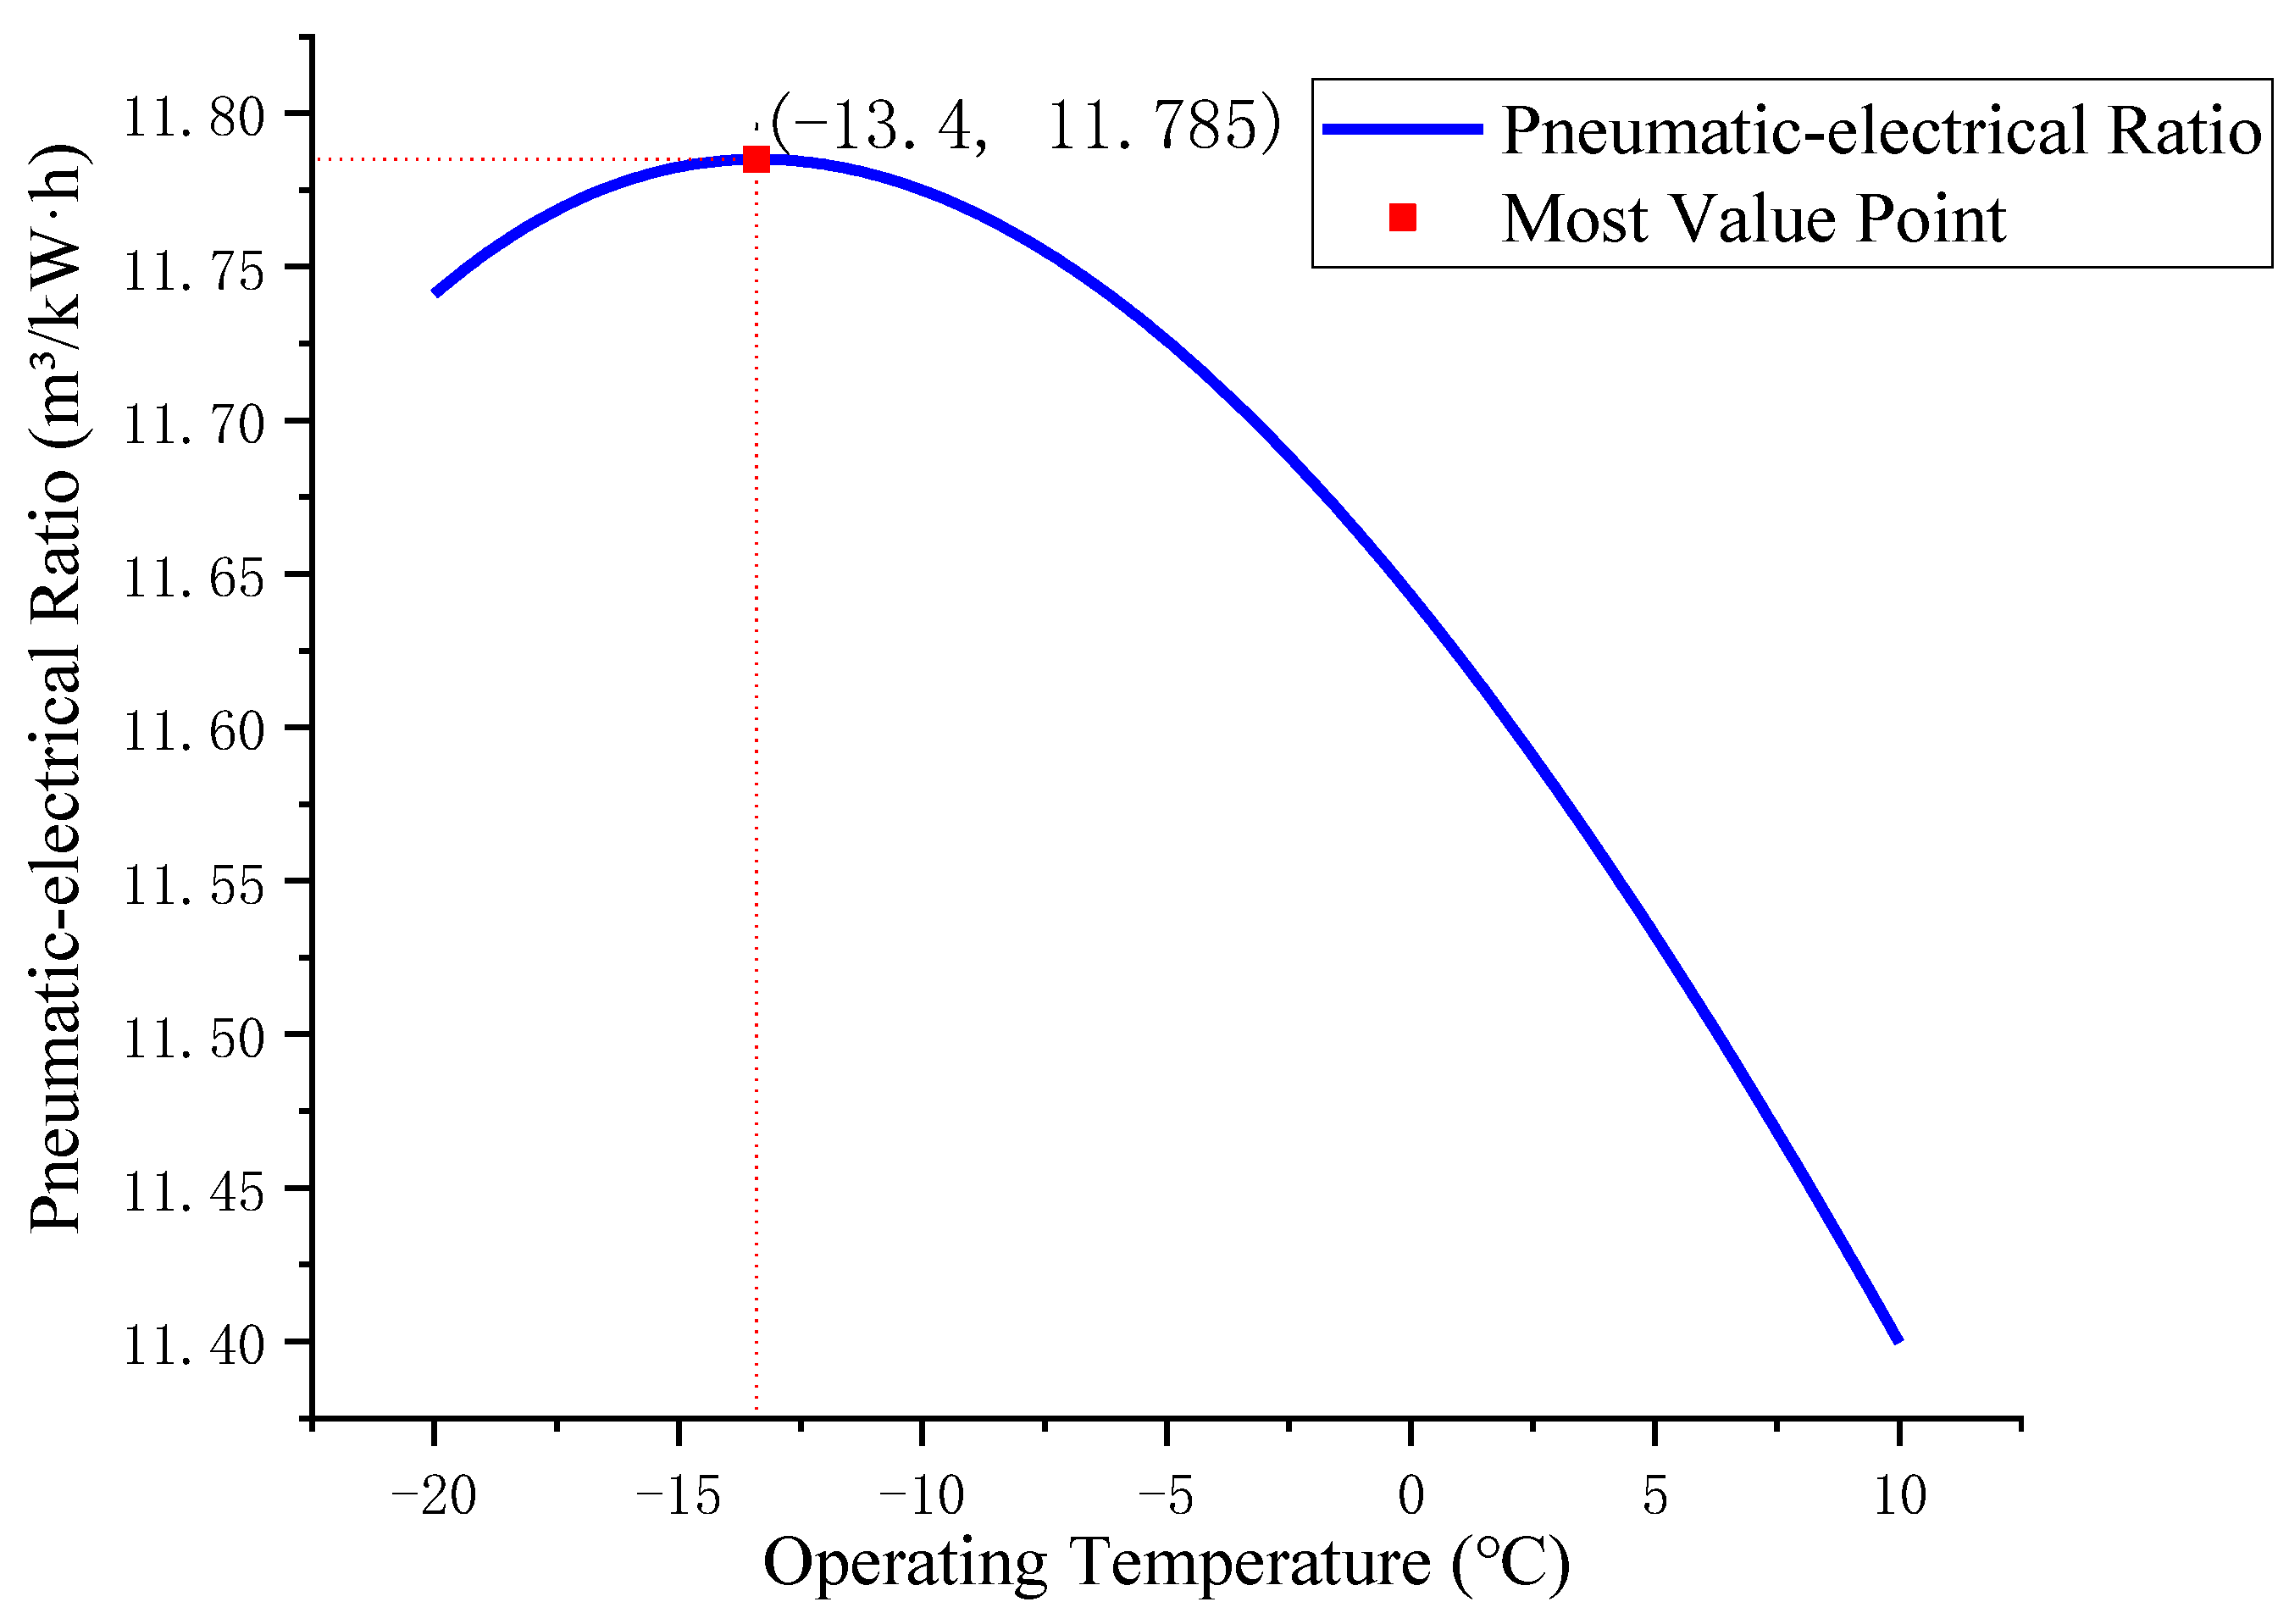
3.3.2. Selection of the Optimum Top for the Precooling Air Compressor System at Different Ten
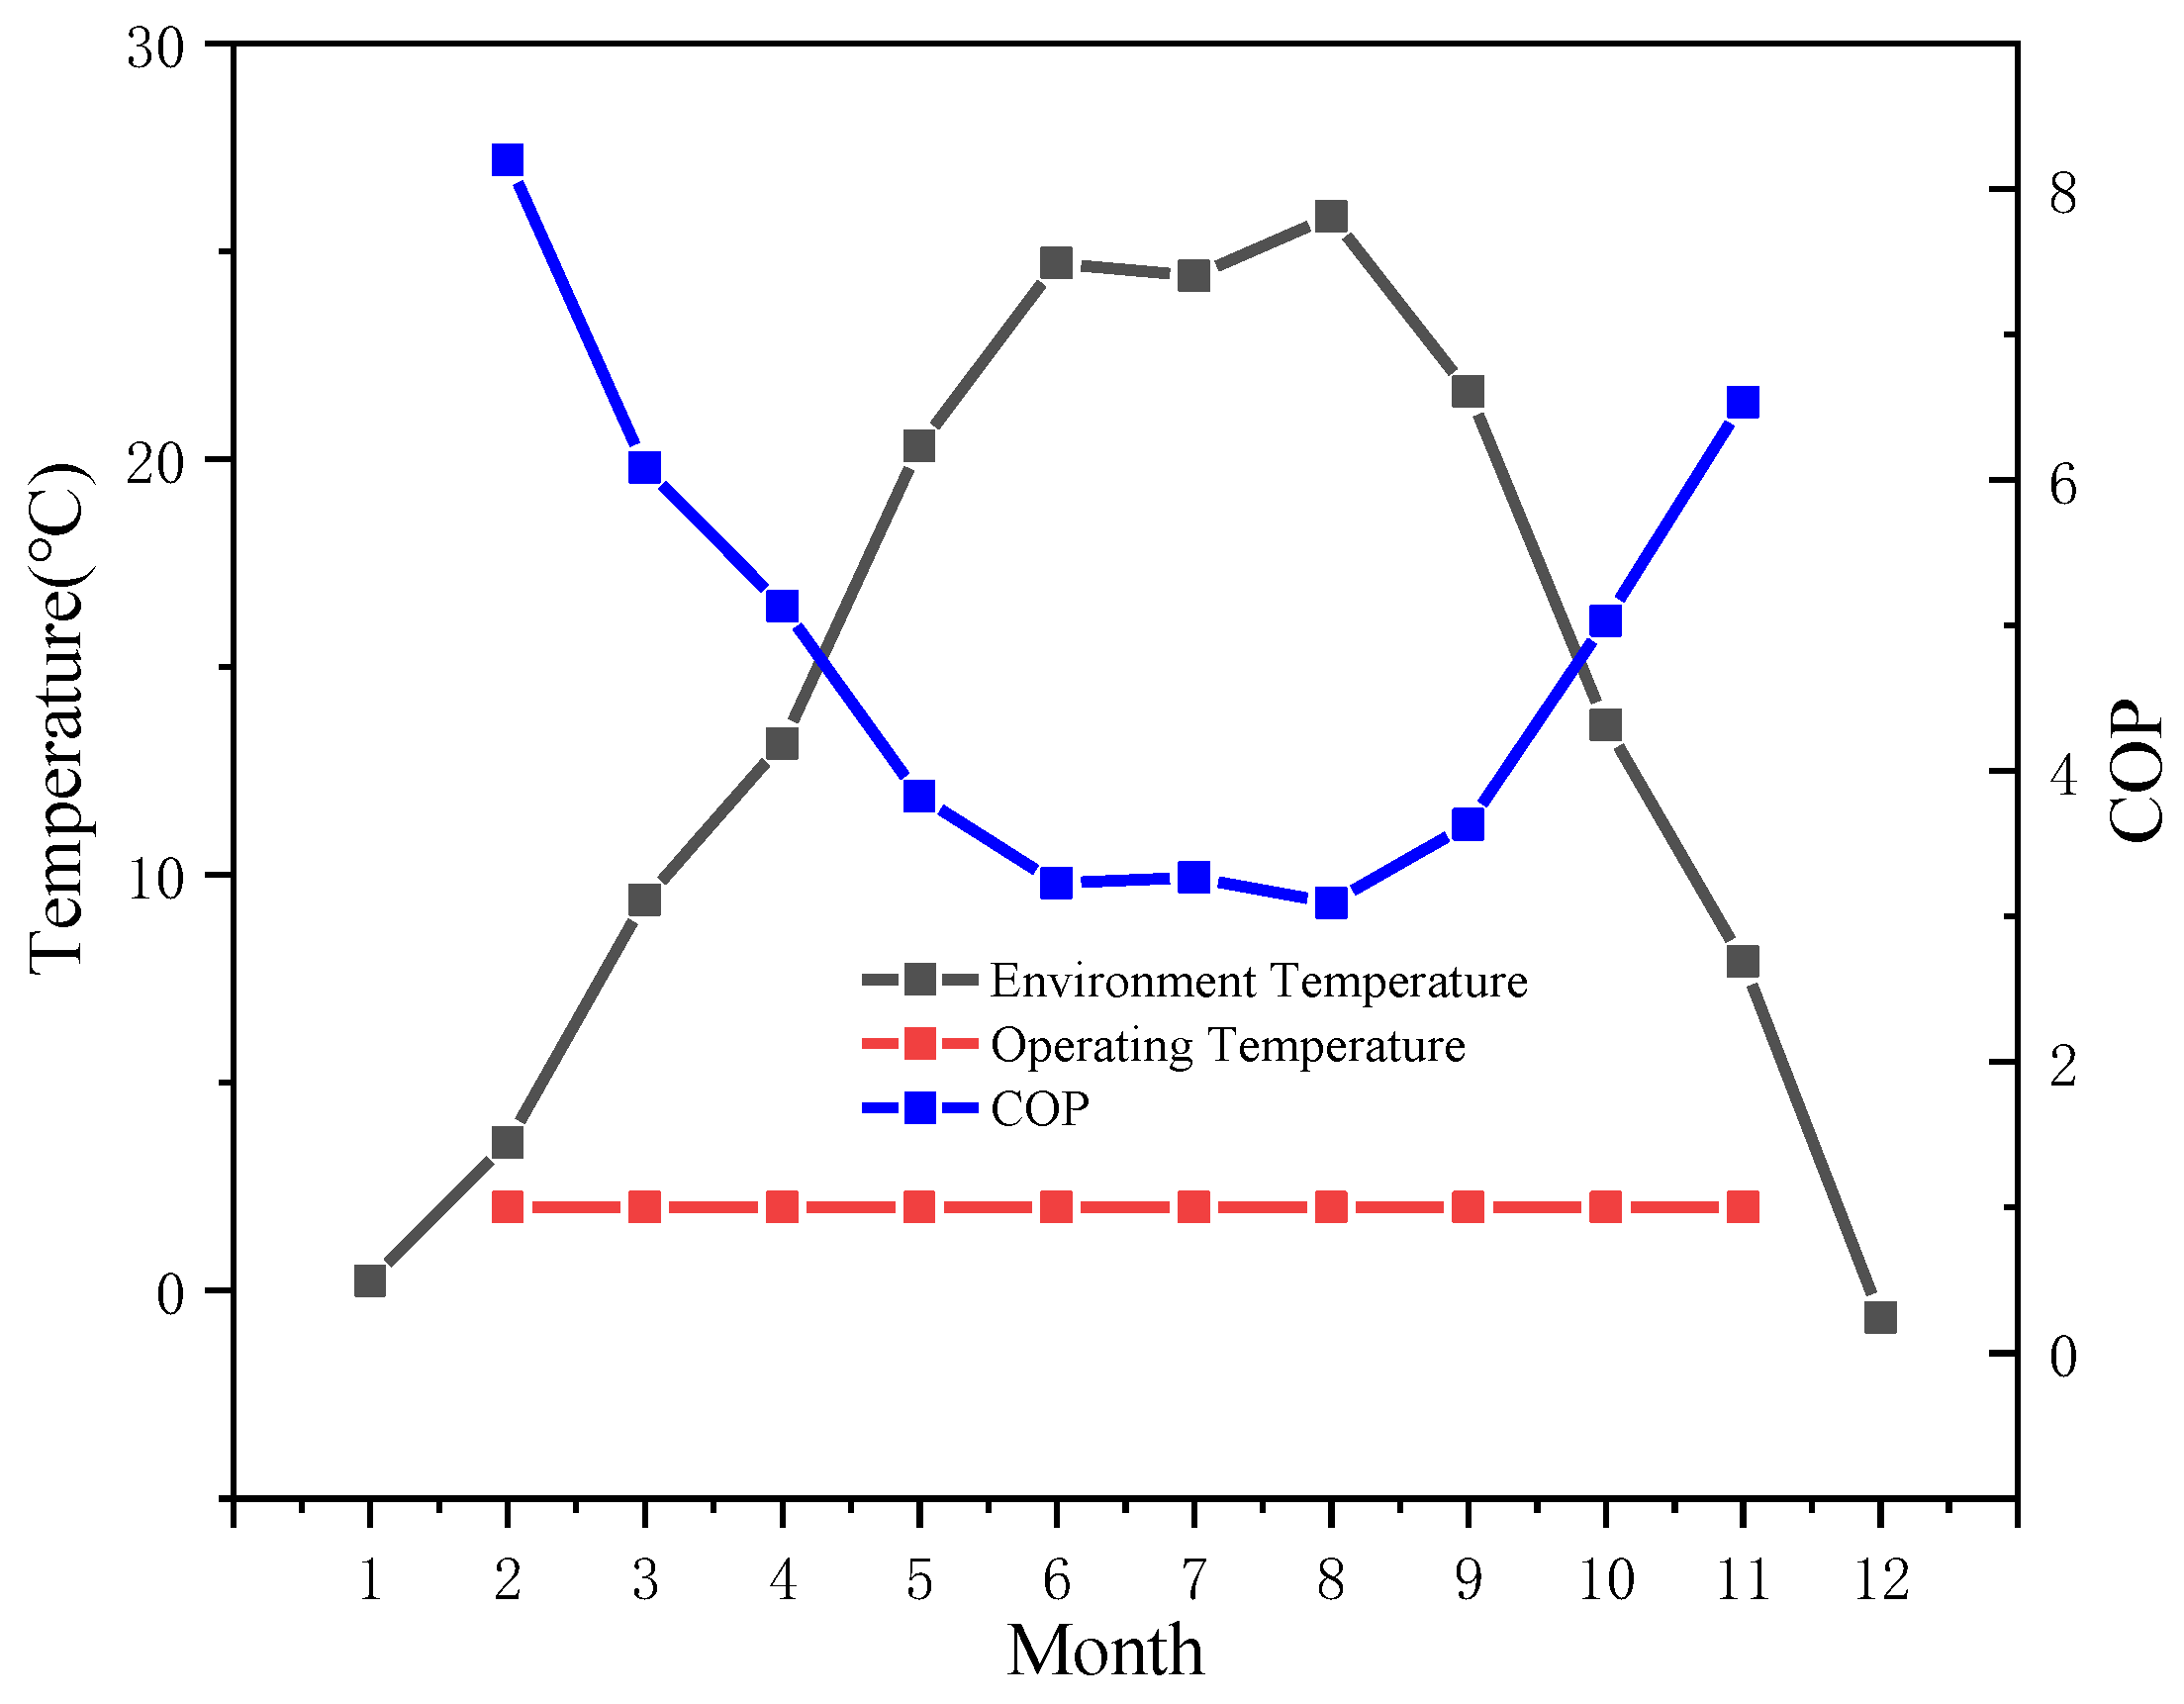
4. Seasonal Variation of the System in Different Regions
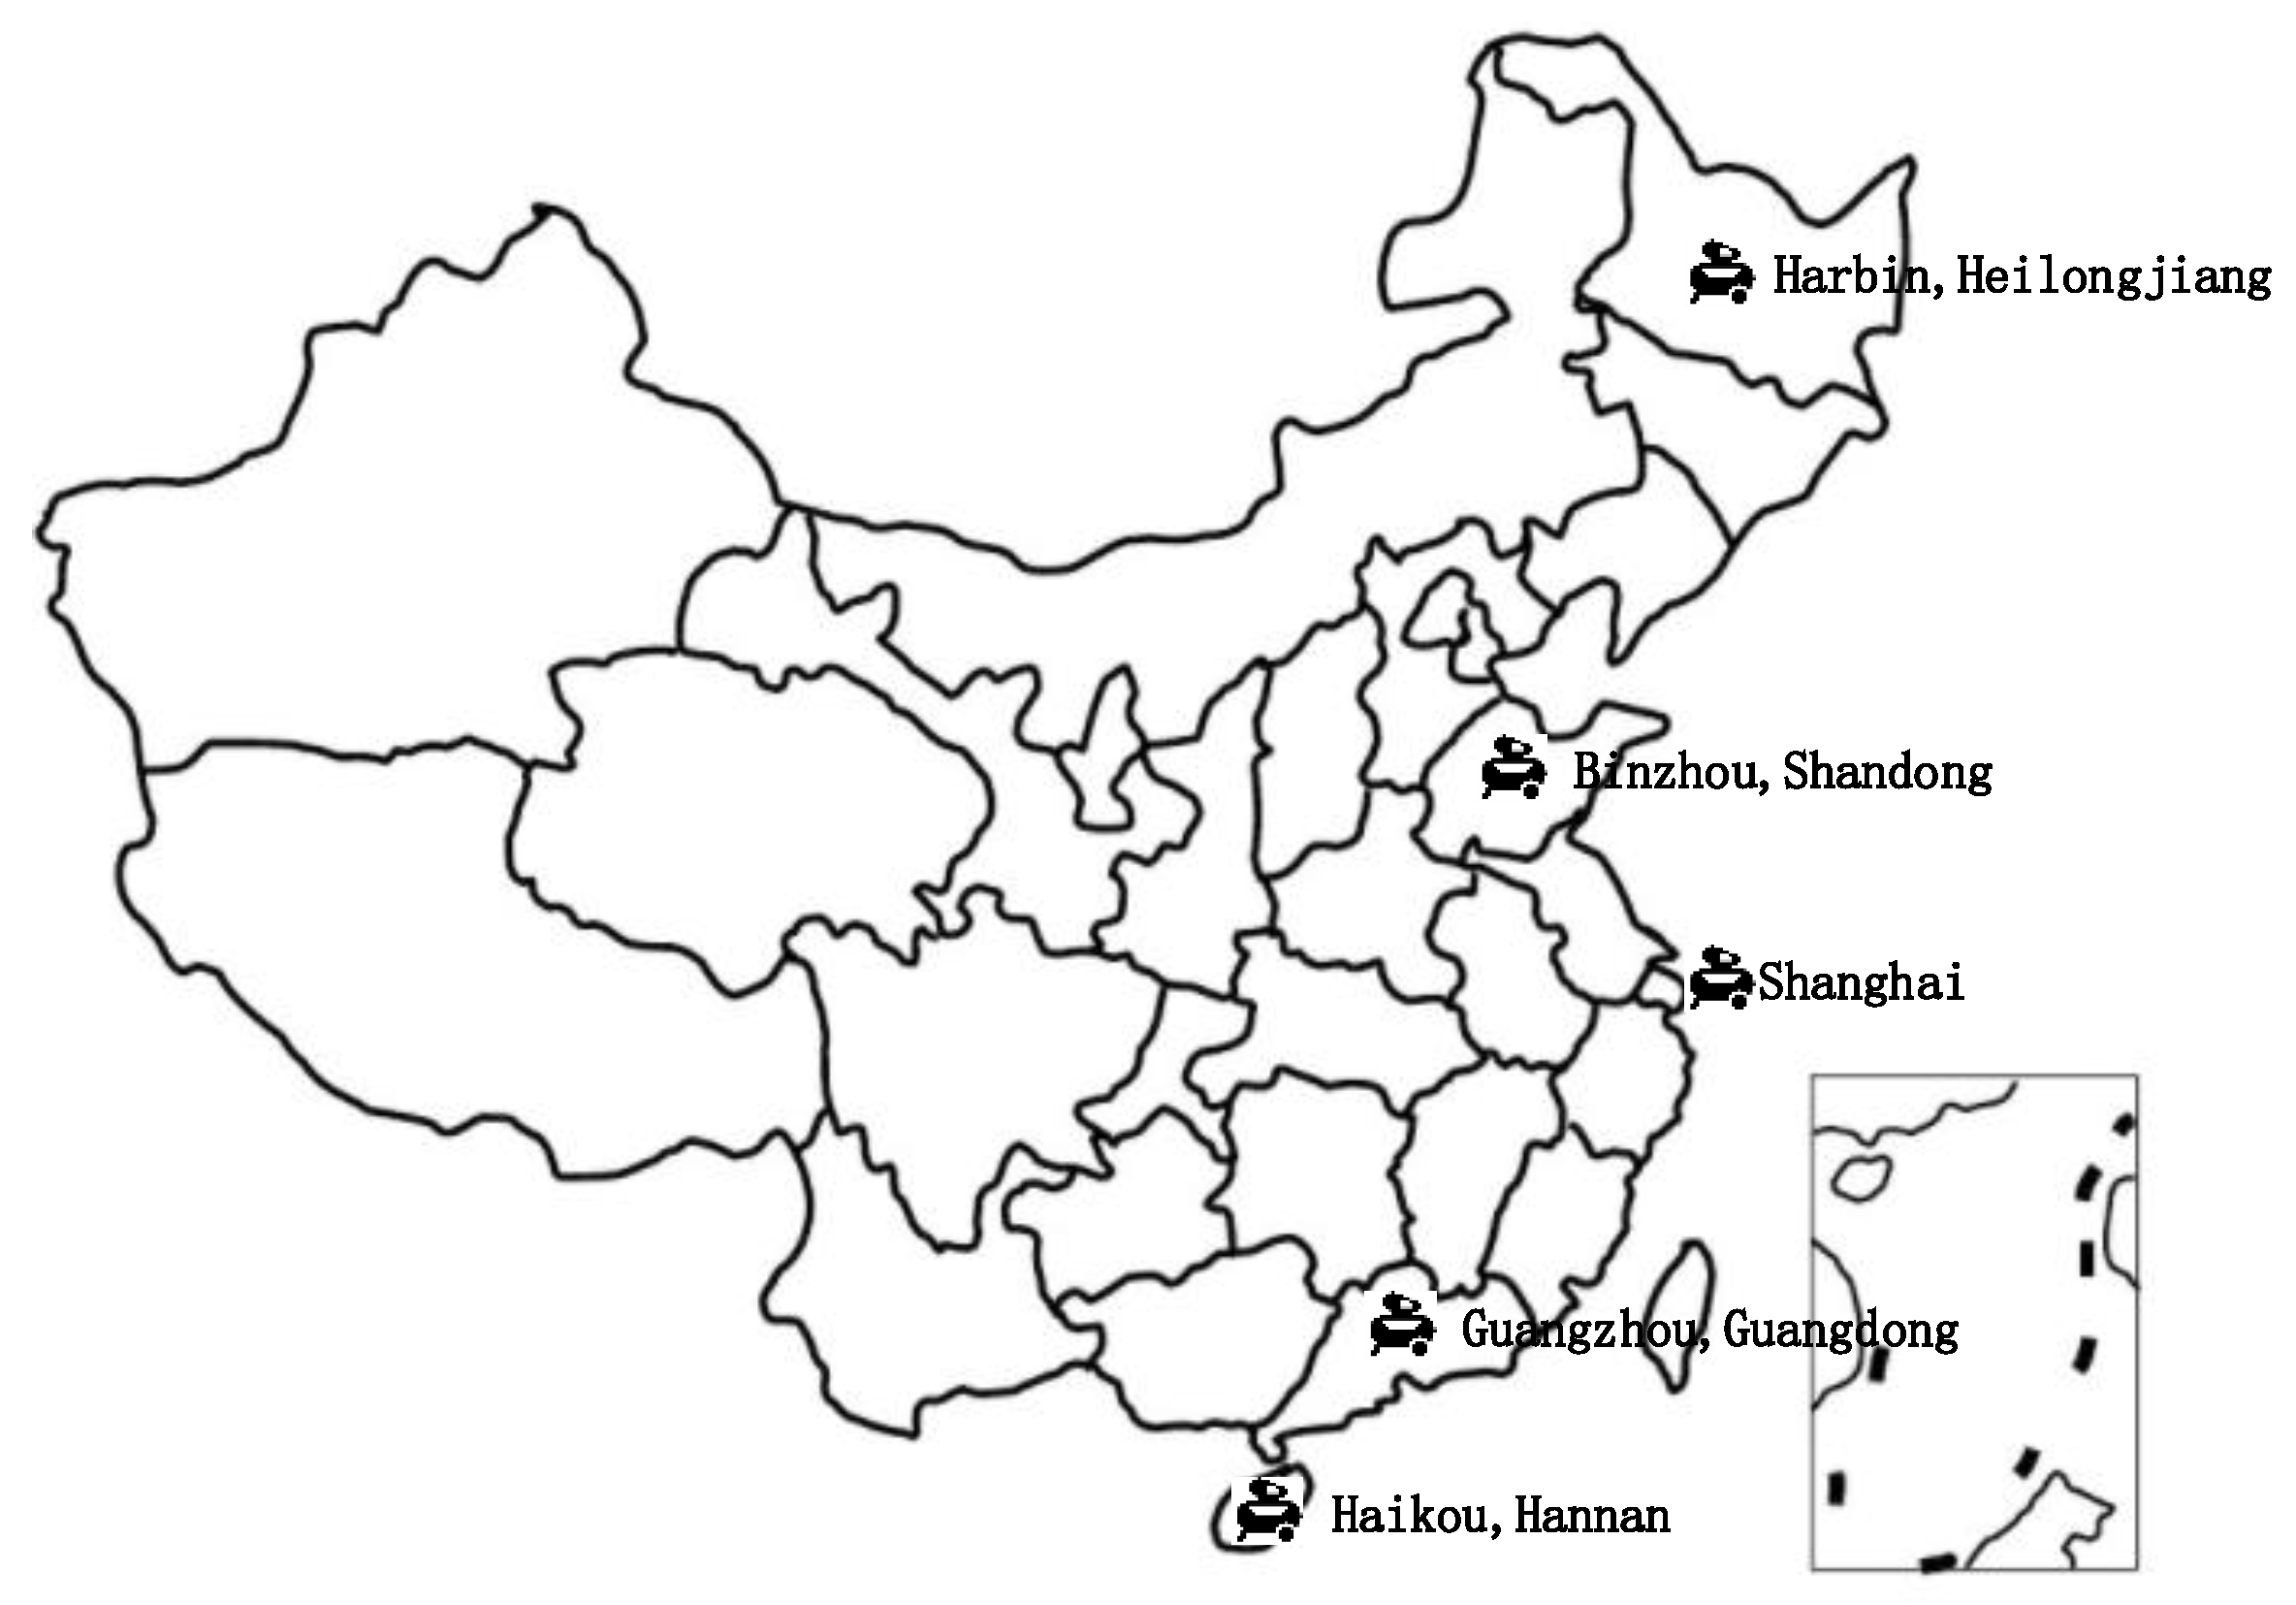
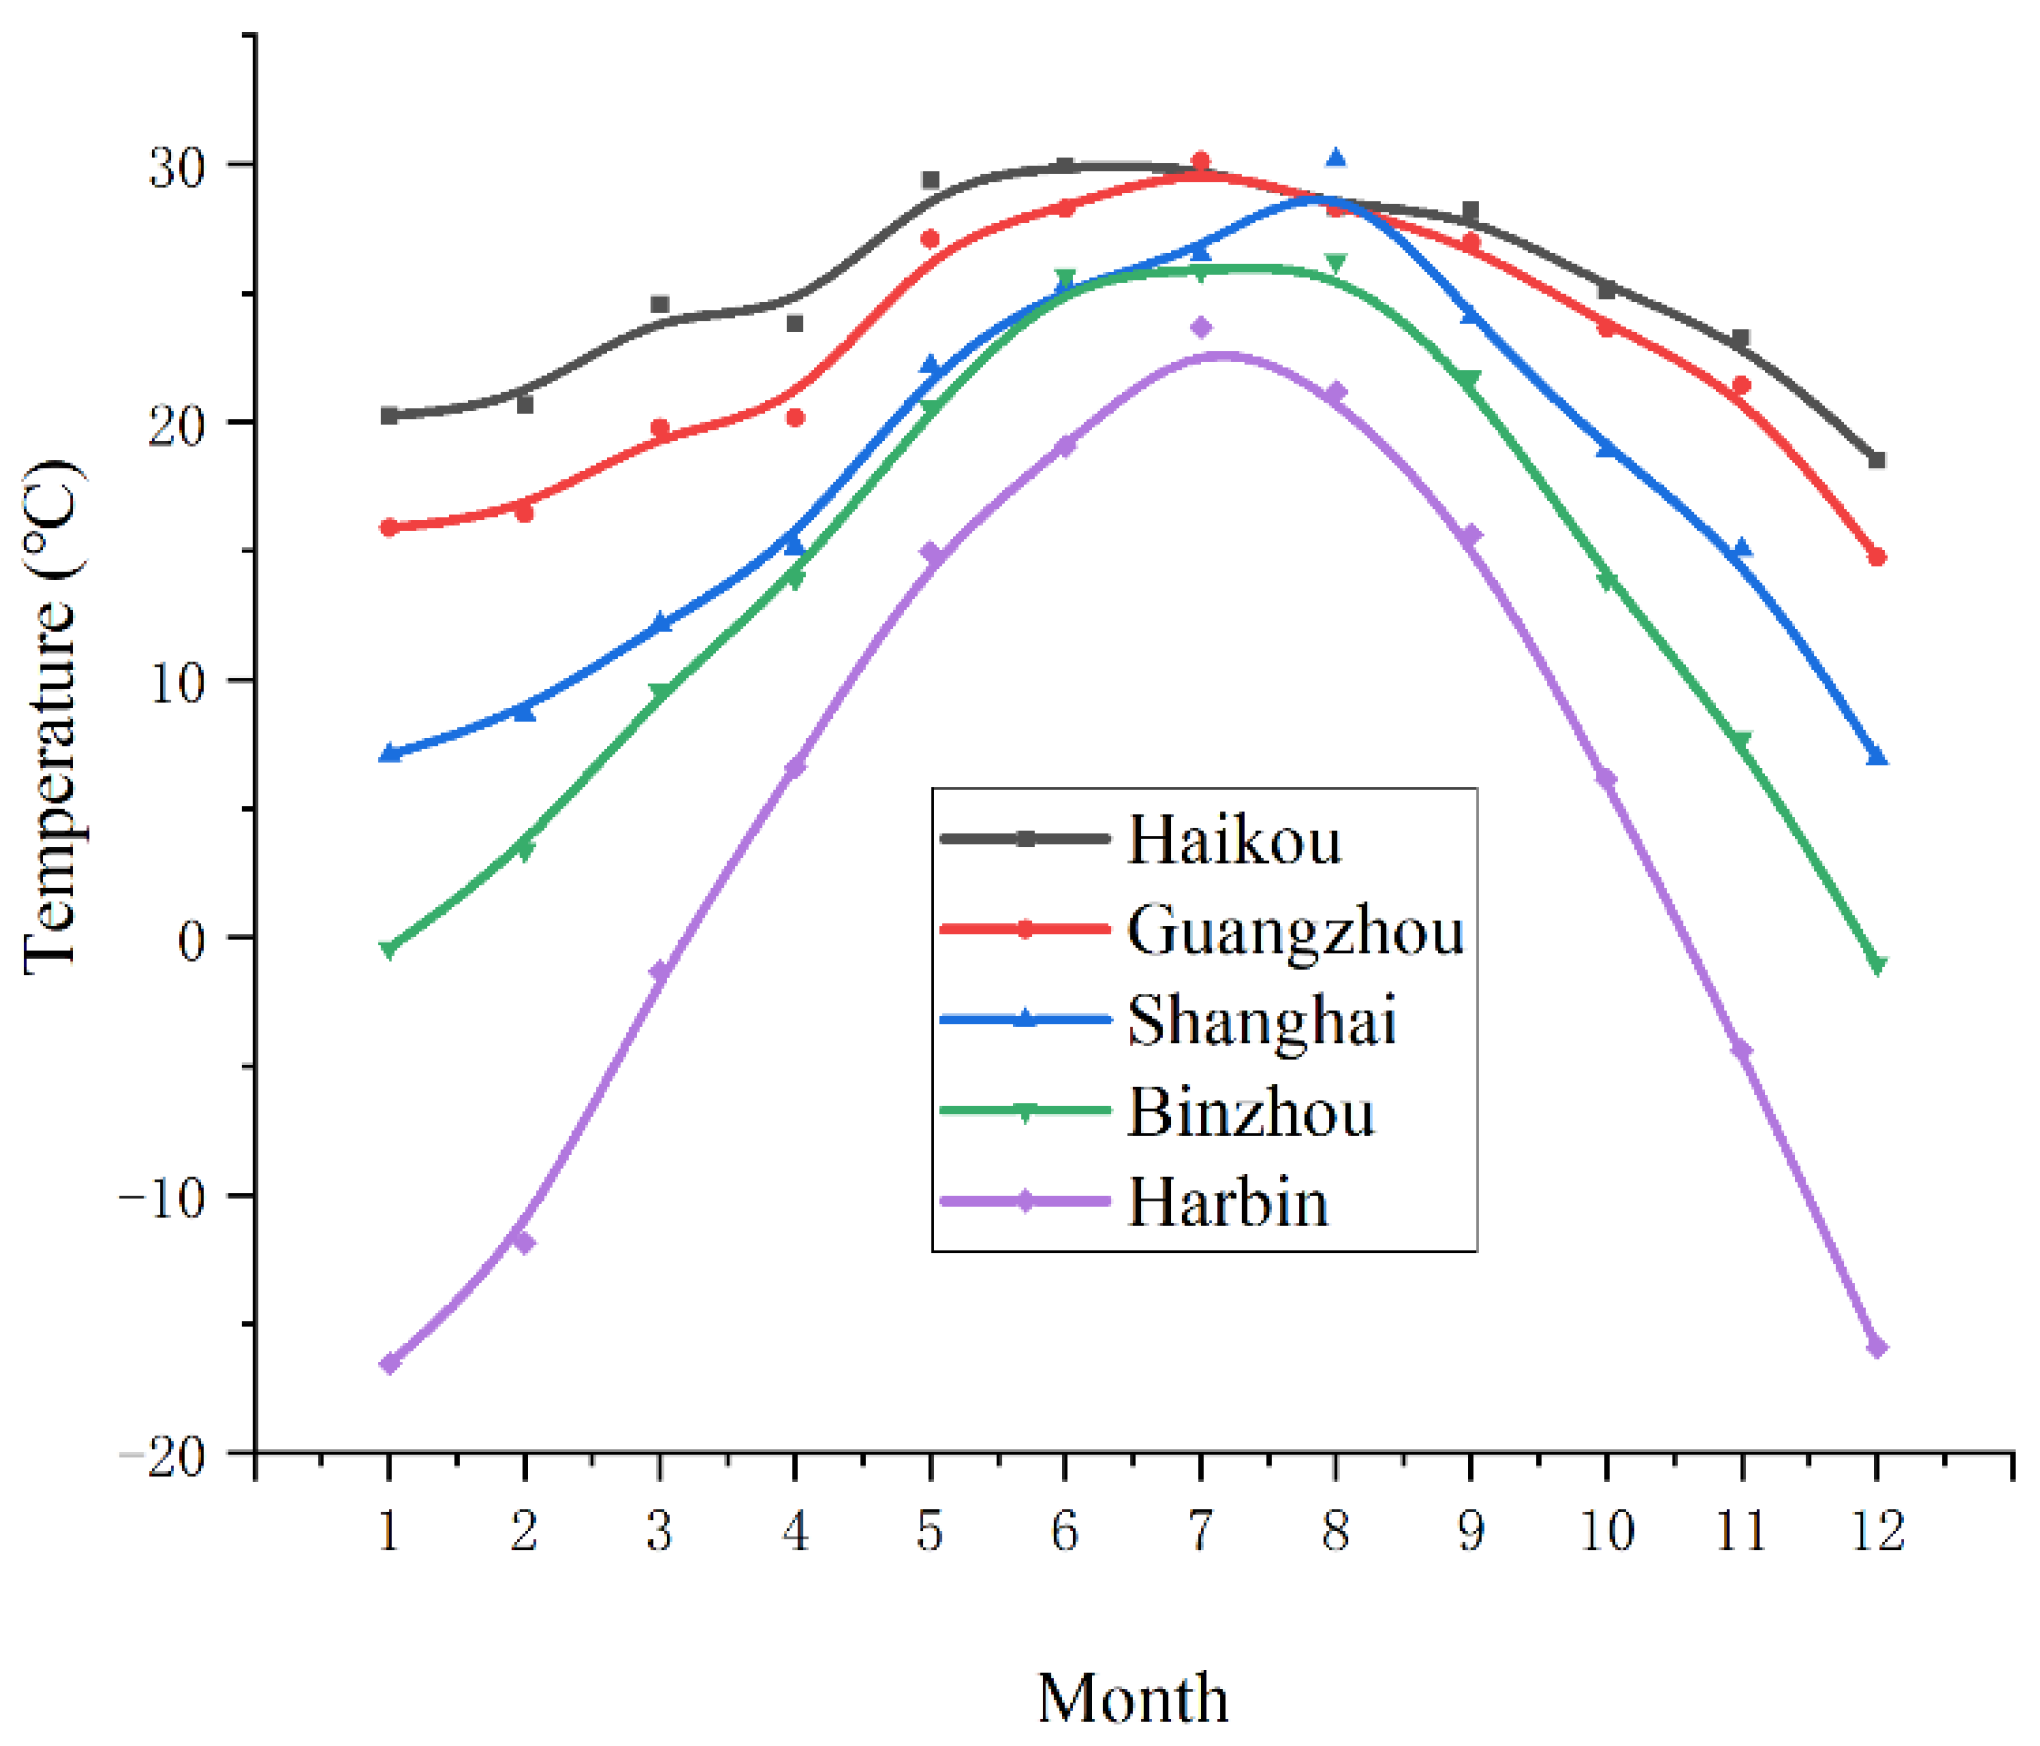
4.1. Operating Condition Difference of the Air Compressor System in Different Regions
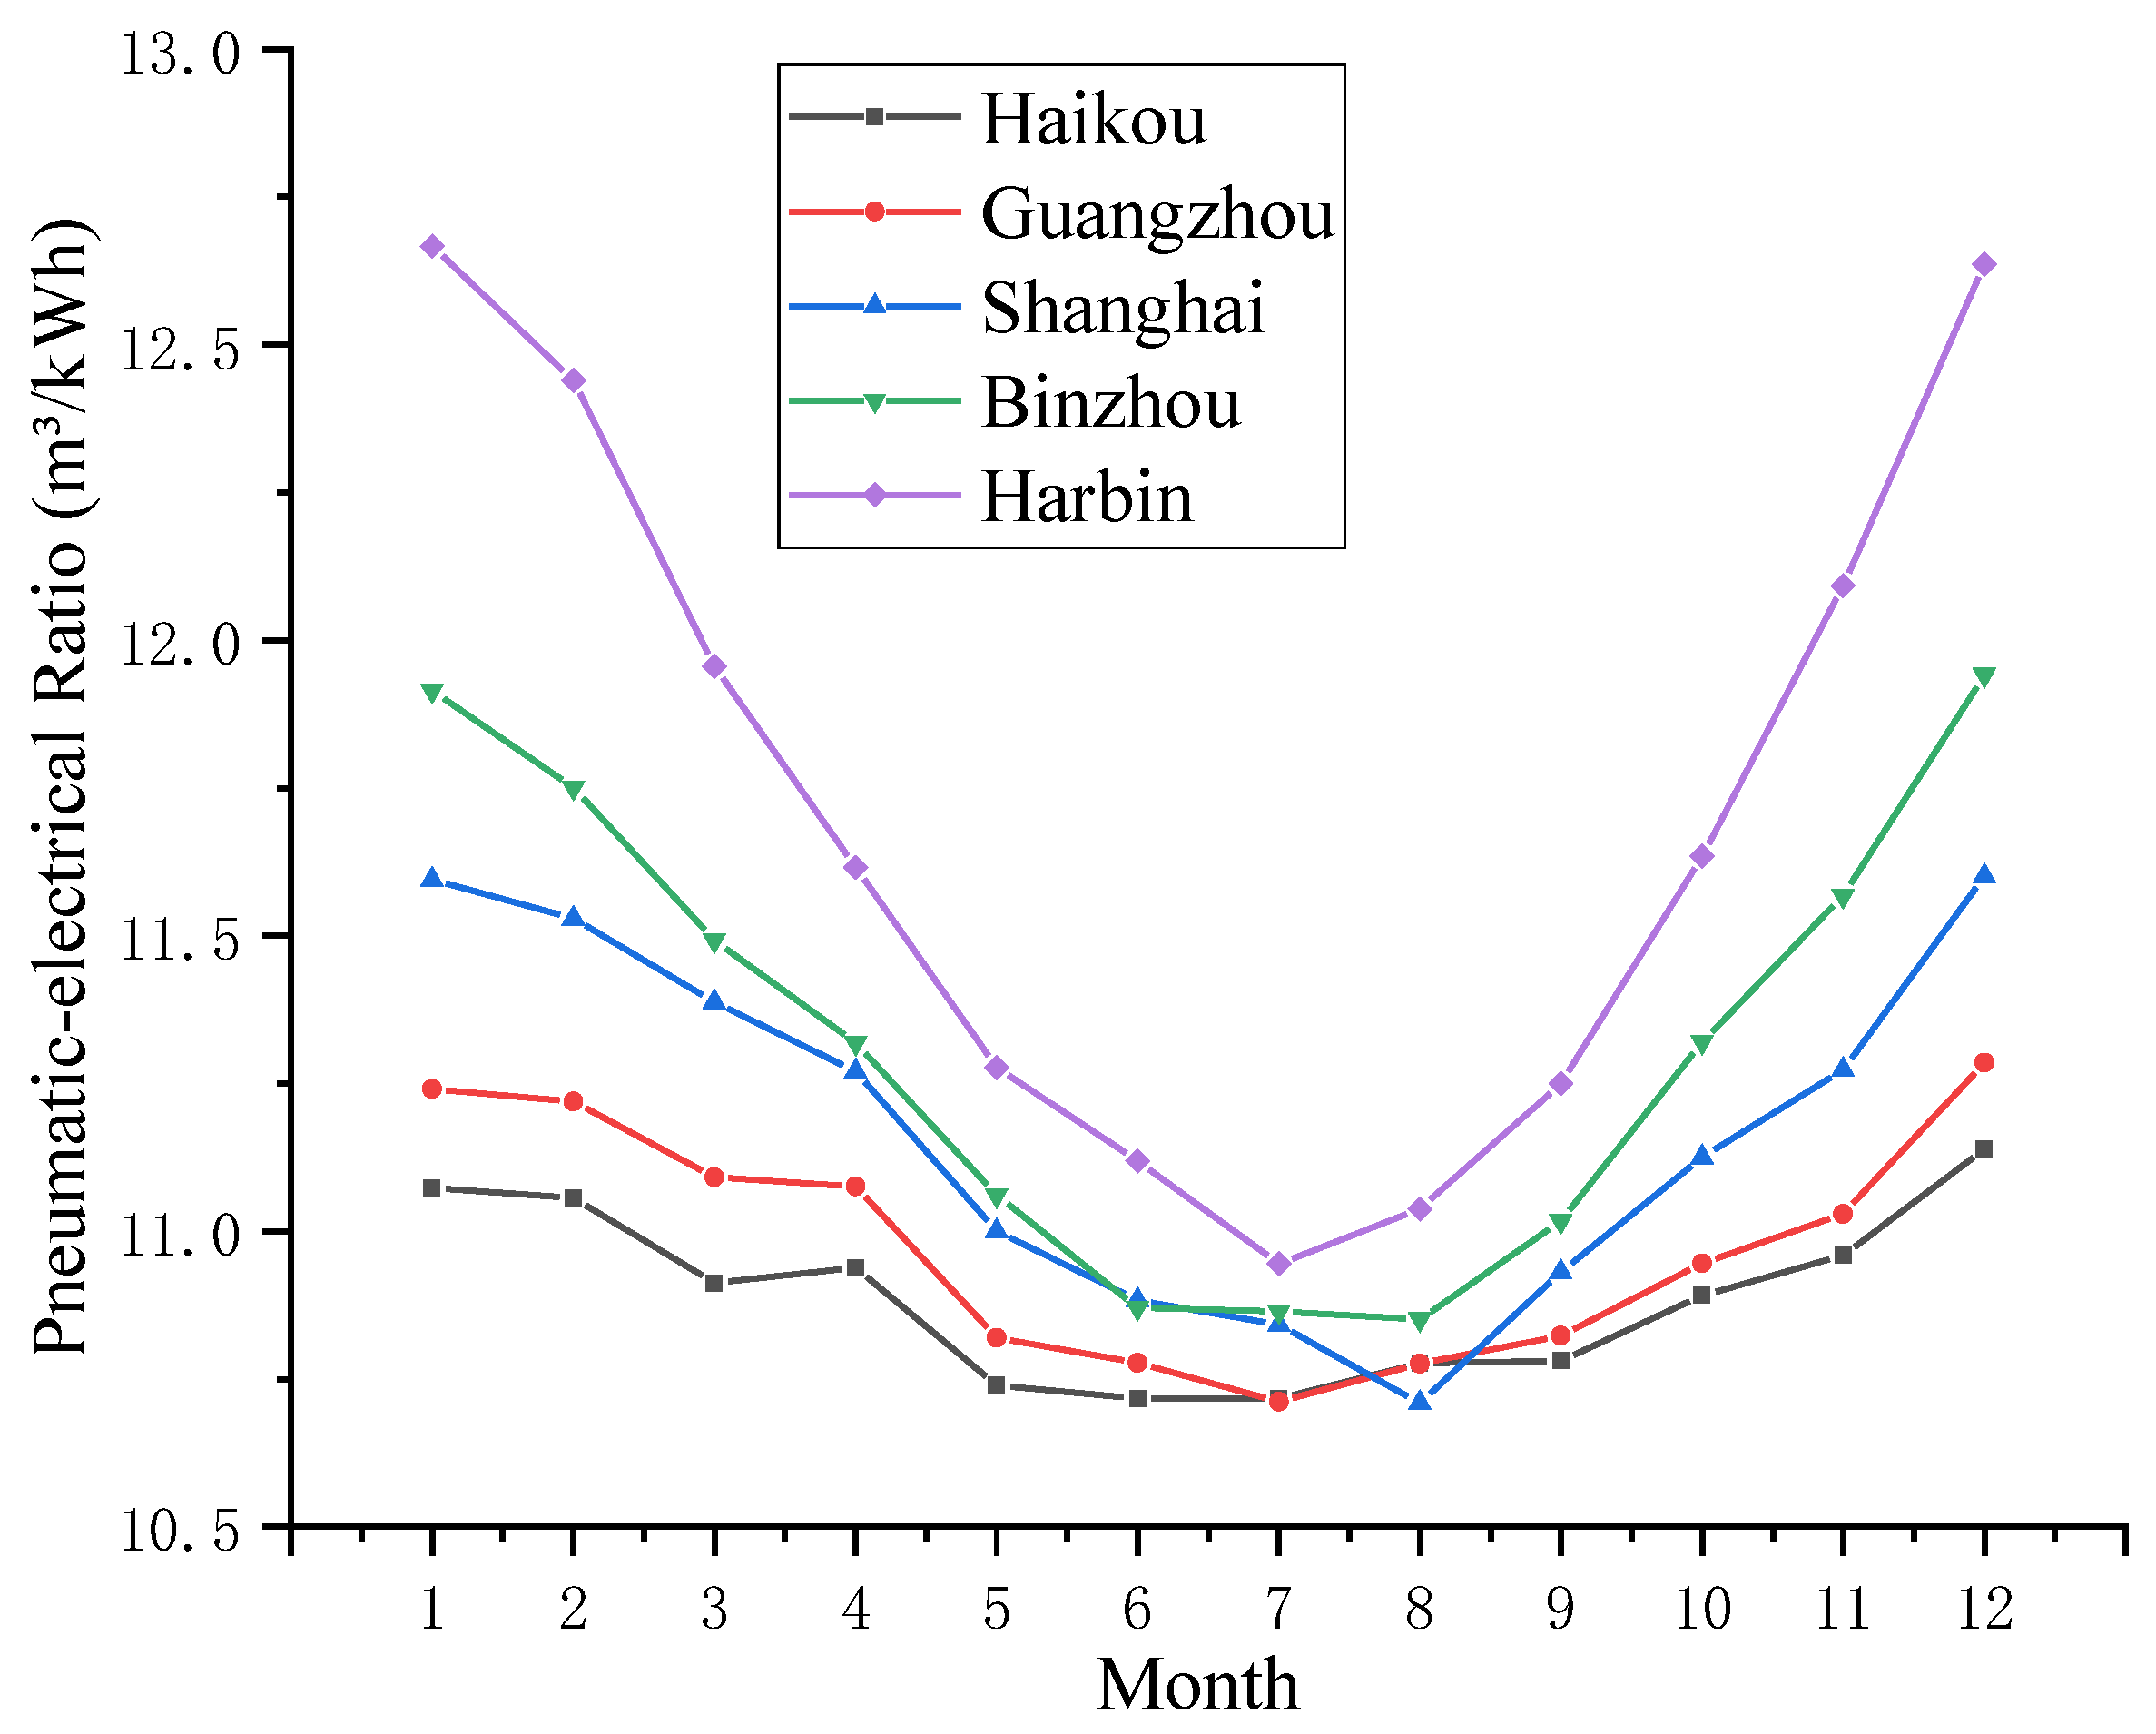
4.1.1. Traditional Air Compressor System
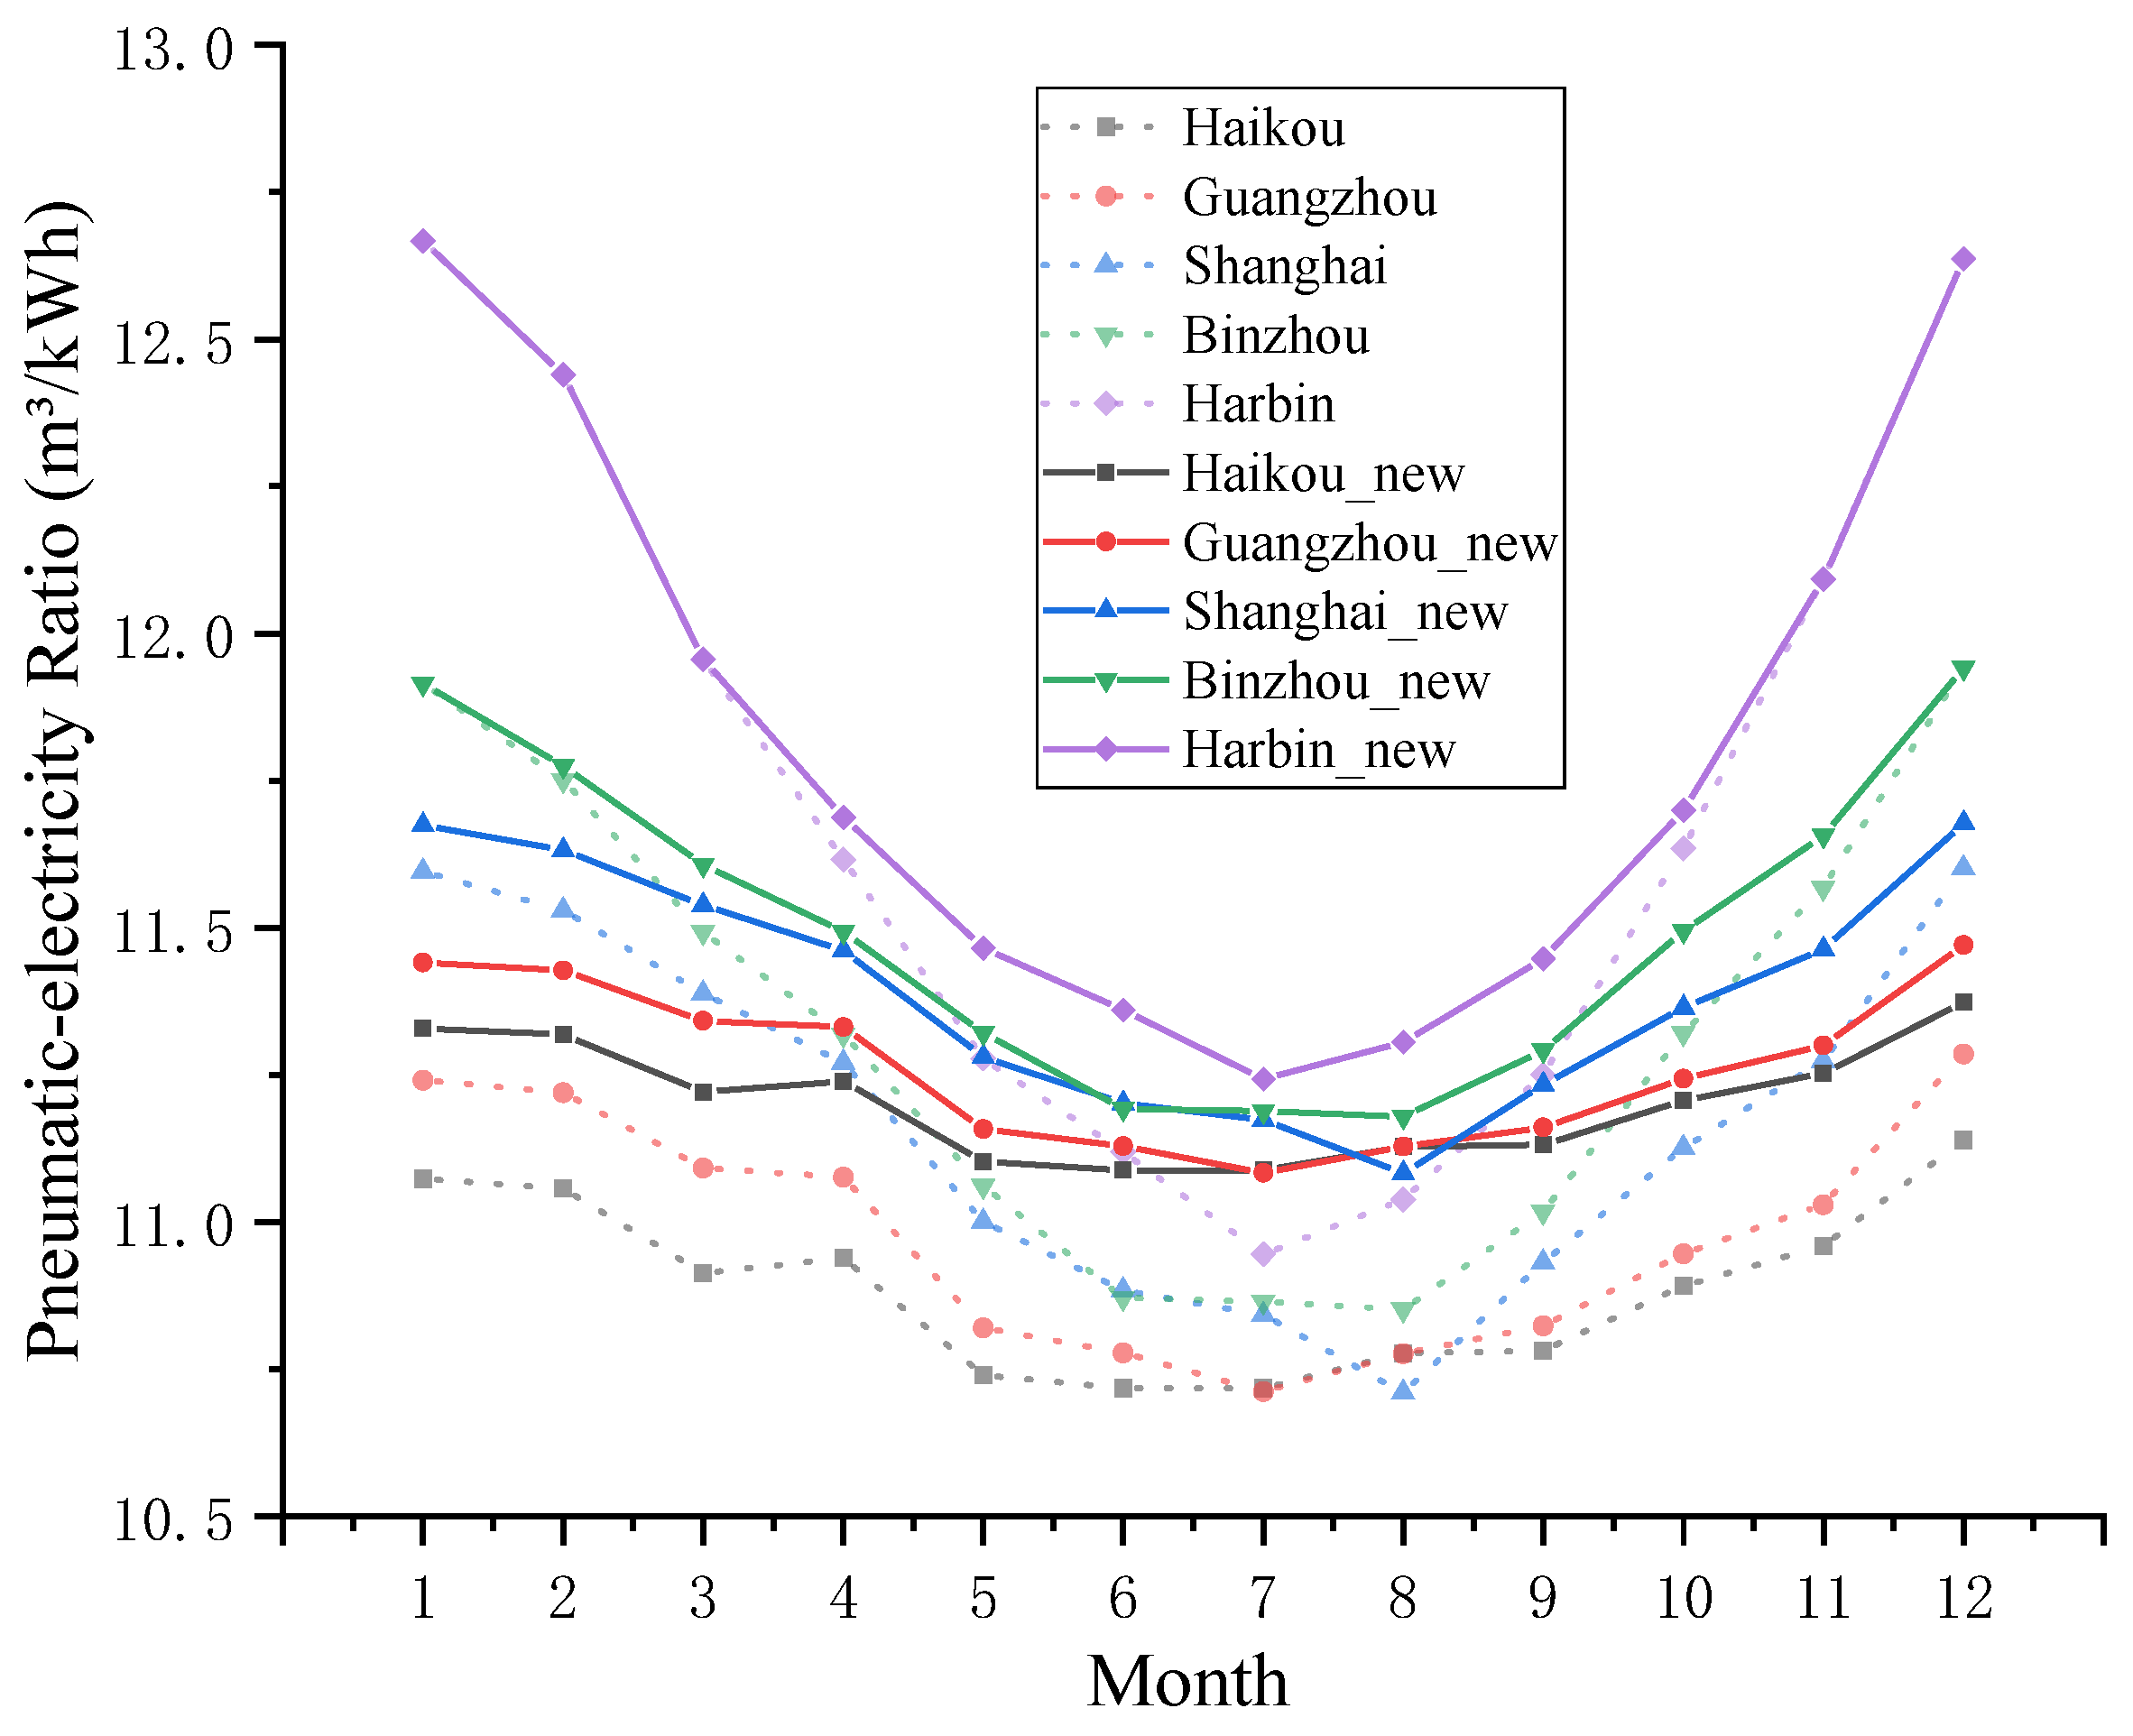
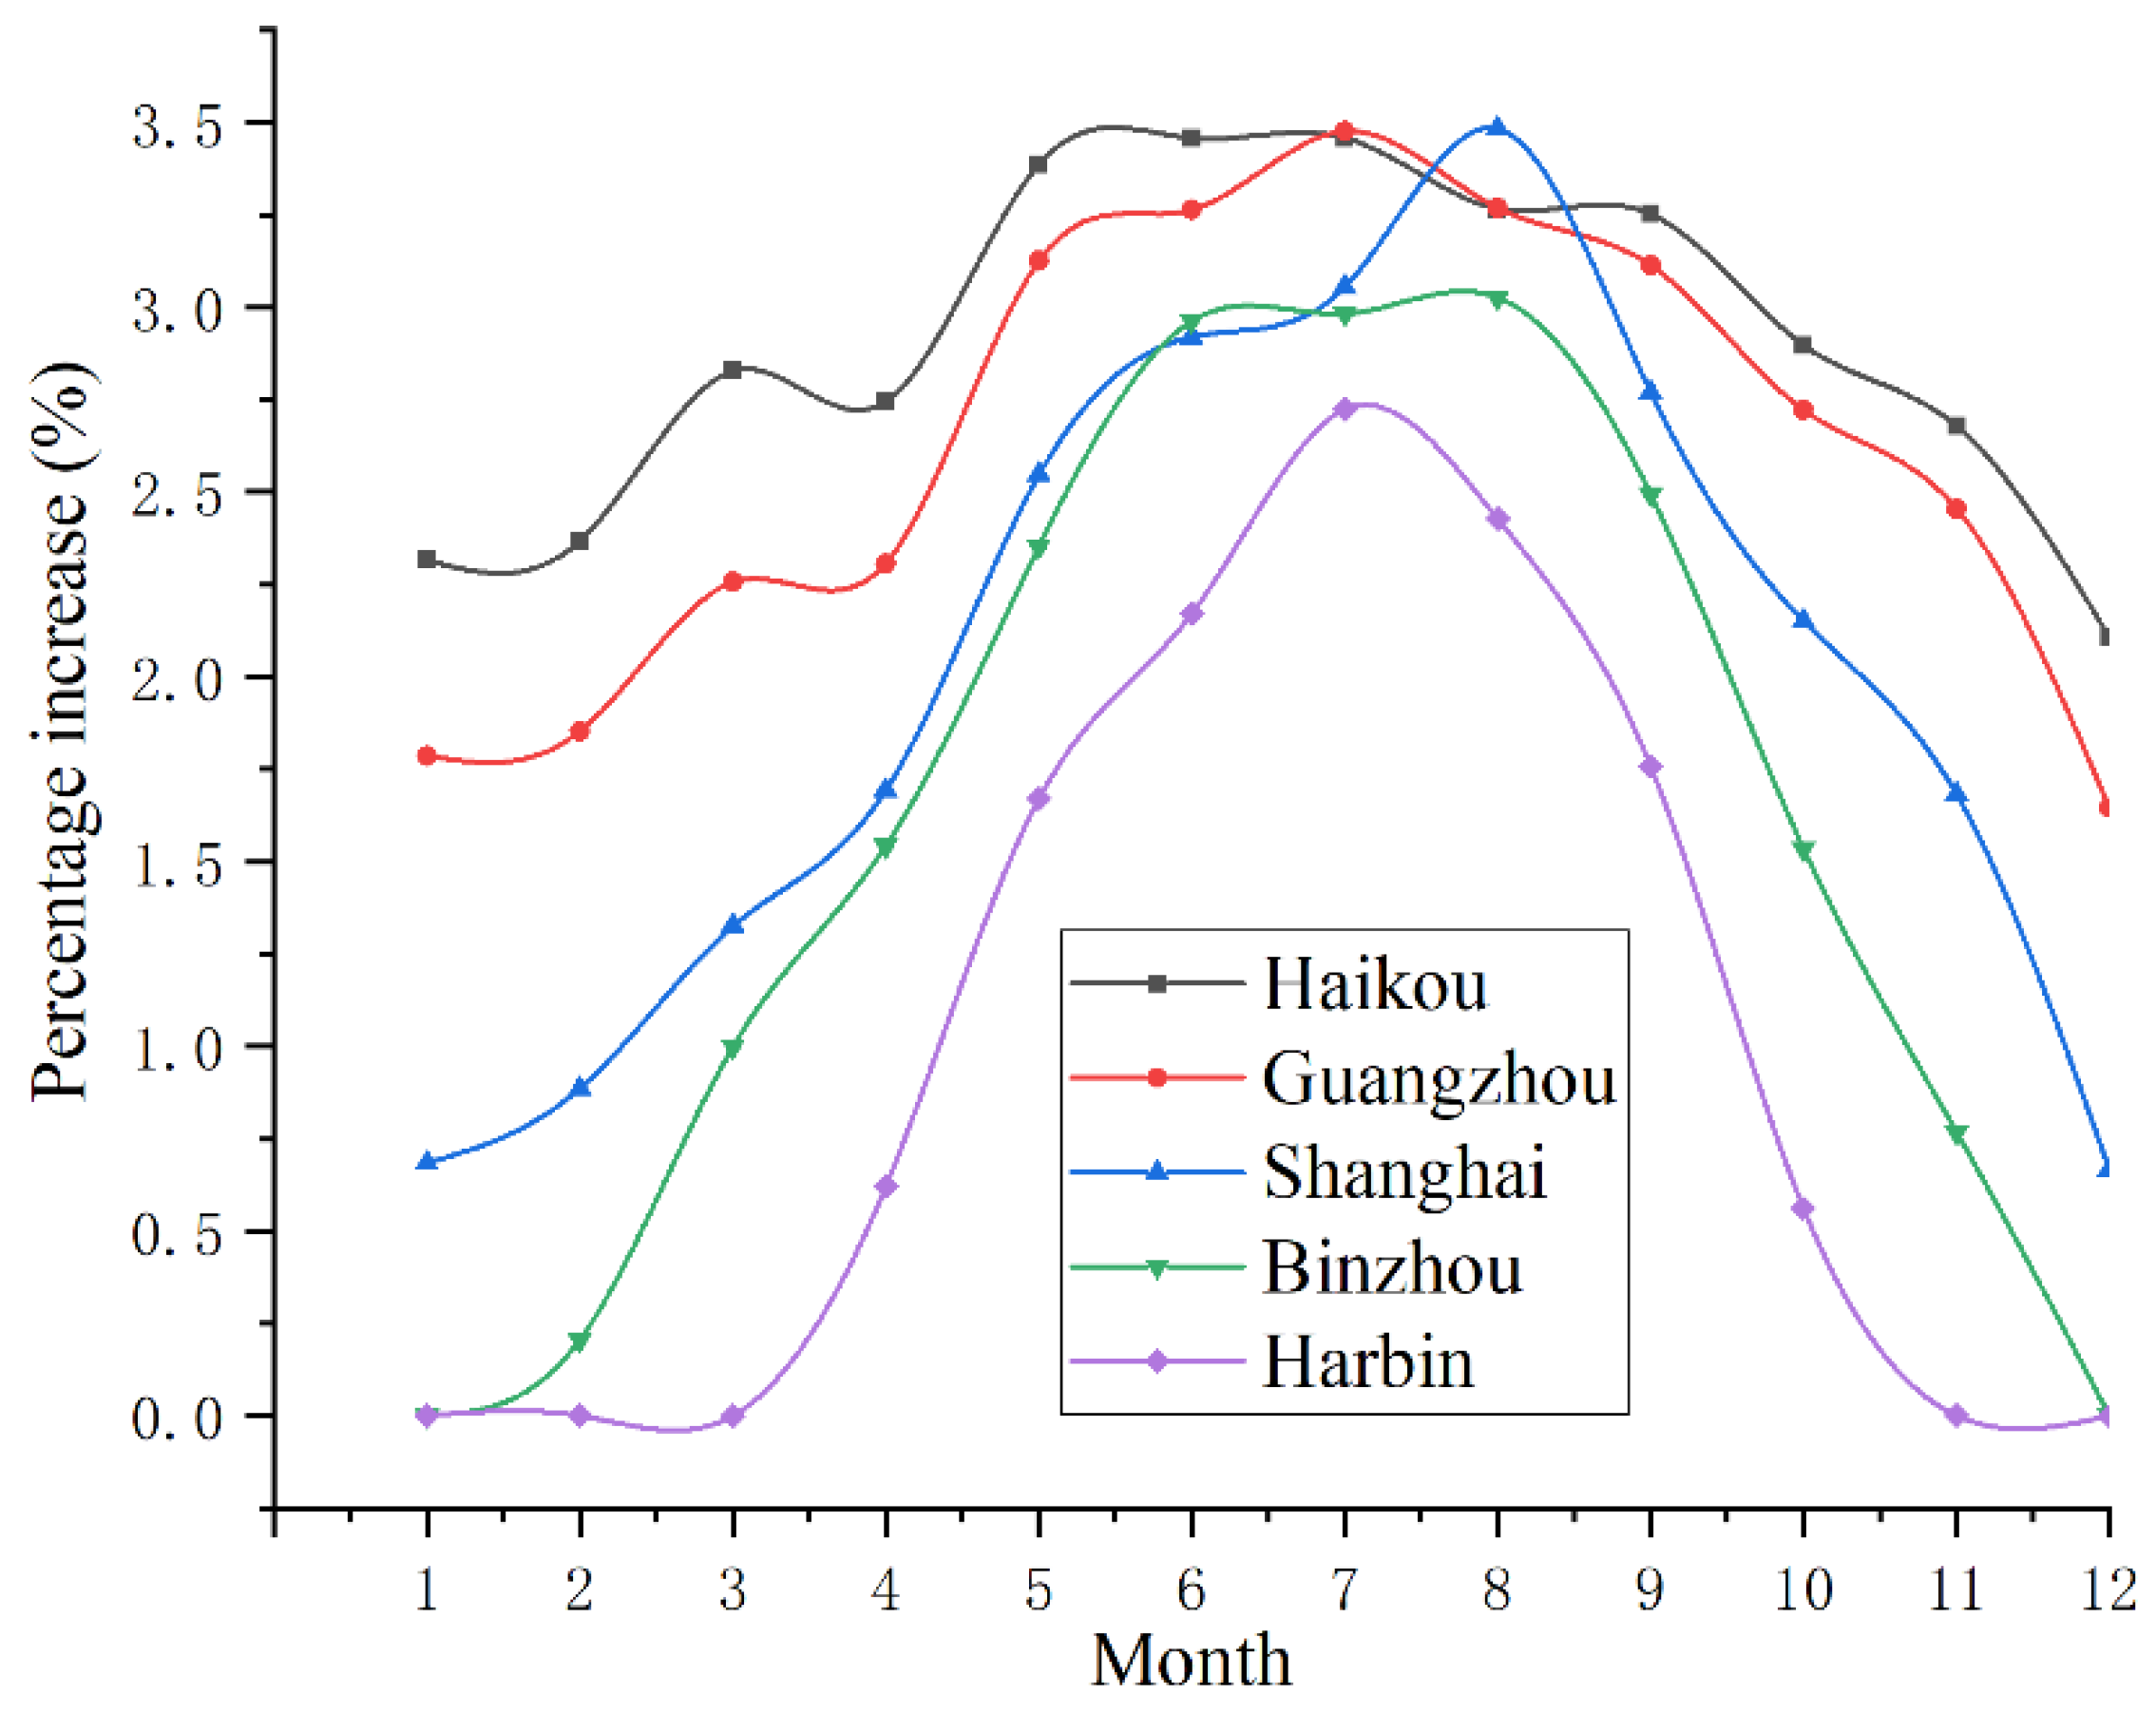
4.1.2. Precooling Air Compressor System
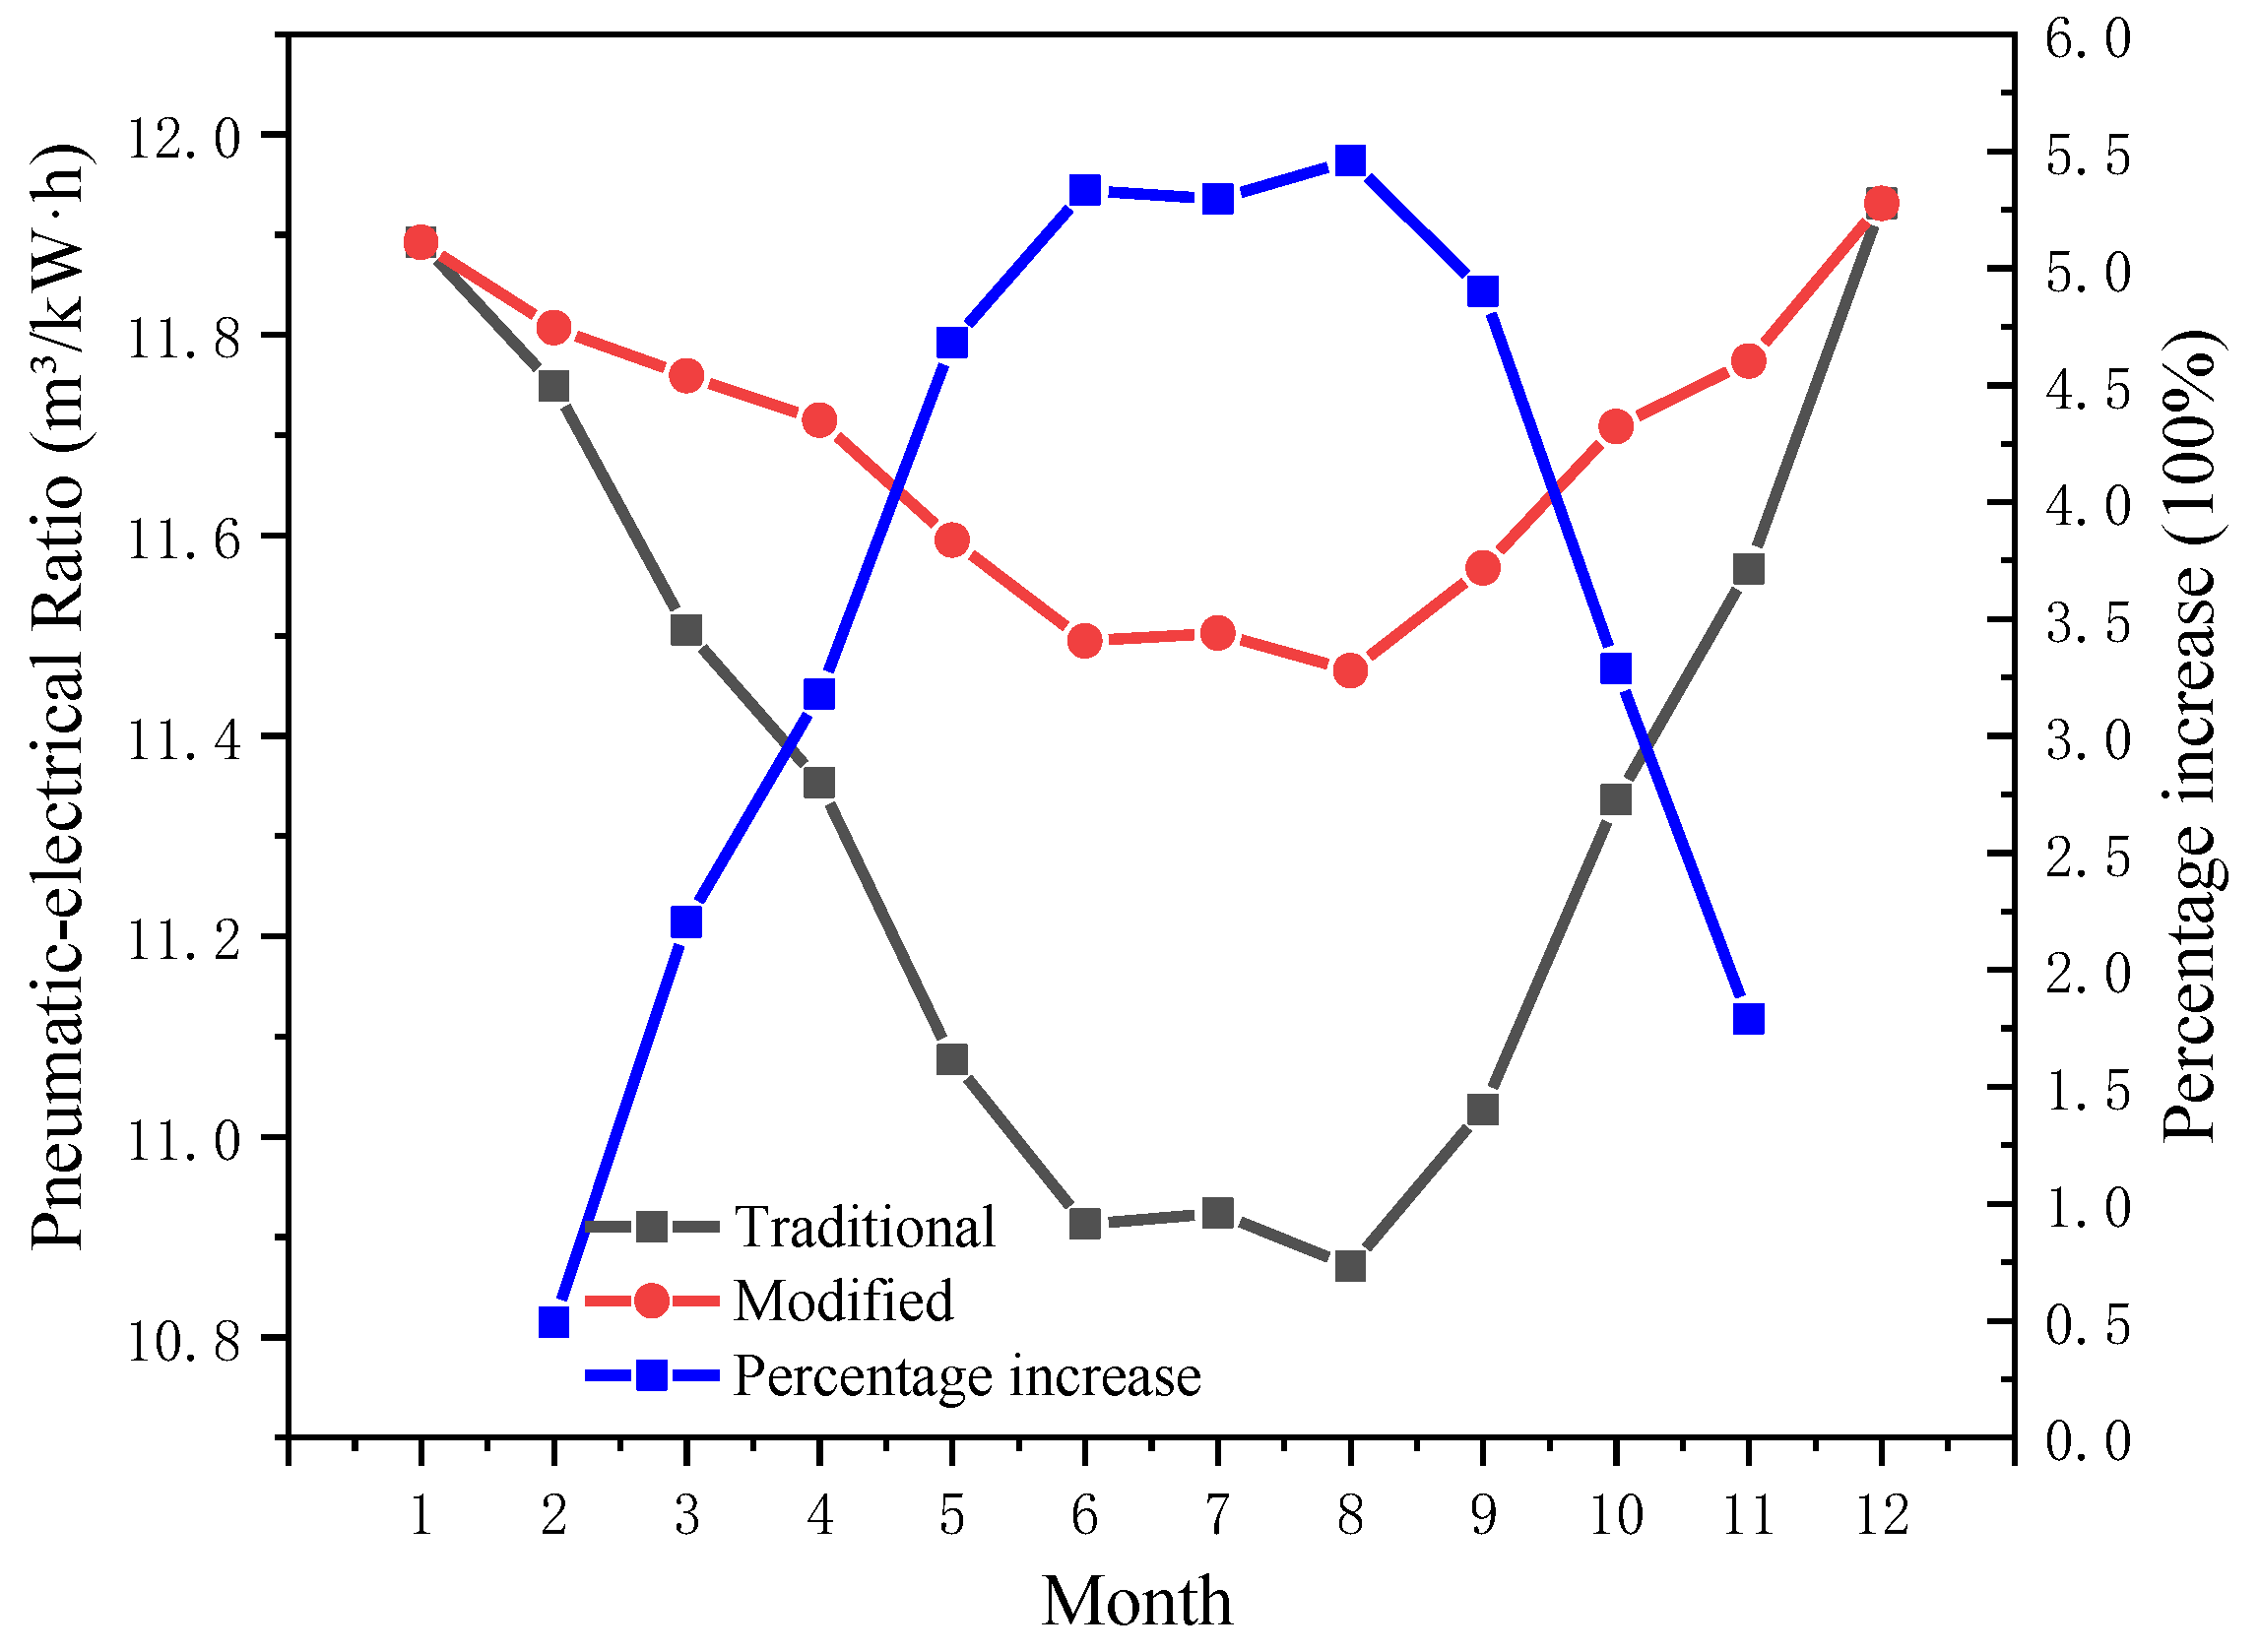
4.2. Operation of the Precooling Air Compressor System in a Region
4.2.1. Differences in the Matching of Precooling Modules in Different Seasons
4.2.2. Selection of the Precooling Module in Practical Applications
5. Conclusions
Author Contributions
Funding
Institutional Review Board Statement
Informed Consent Statement
Conflicts of Interest
Nomenclature
| Tin | Suction temperature (°C) | s0 | Entropy of air at 293.15 K and 101.3 kPa (kJ/(kg·K)) |
| Wcom | Energy consumption of the air compressor system (kJ) | Excom_loss | Exergy loss of traditional air compressor (kJ) |
| pin | Suction pressure (kPa) | Wcold | Energy consumption of the precooling module (kJ) |
| Vin | Initial volume of air (m3) | Extr_loss | Exergy loss of air treatment (kJ) |
| r | Compressor pressure ratio | Excold_loss | Exergy loss of precooling module (kJ) |
| k | Adiabatic index (1.4) | δ | Pneumatic-electrical ratio of the traditional air compressor system (m3/kW·h) |
| ηcom | Isentropic efficiency of traditional air compressor (%) | V0 | Volume of high pressure air under standard condition (m3) |
| wcold_unit | Energy consumption for compressing unit mass of refrigerant (kJ/kg) | δ′ | Pneumatic-electrical ratio of the precooling air compressor system (m3/kW·h) |
| ηcold_com | Efficiency of refrigeration compressor (%) | mref | Refrigerant mass (kg) |
| h4 | Inlet specific enthalpy of expansion valve (kJ/kg) | Ten | Ambient temperature (°C) |
| h5 | outlet specific enthalpy of expansion valve (kJ/kg) | Tcold | Refrigeration temperature (°C) |
| h6 | outlet specific enthalpy of evaporator (kJ/kg) | Tc | Condensation temperature (°C) |
| qcold | refrigerating capacity per unit mass of refrigerant (kJ/kg) | Te | Evaporation temperature (°C) |
| COP | Coefficient of performance | Top | Operating temperature of the precooling air compressor system (°C) |
| Ex | Exergy at the state point (kJ) | h0 | Enthalpy of air at 293.15 K and 101.3 kPa (kJ/kg) |
Appendix A
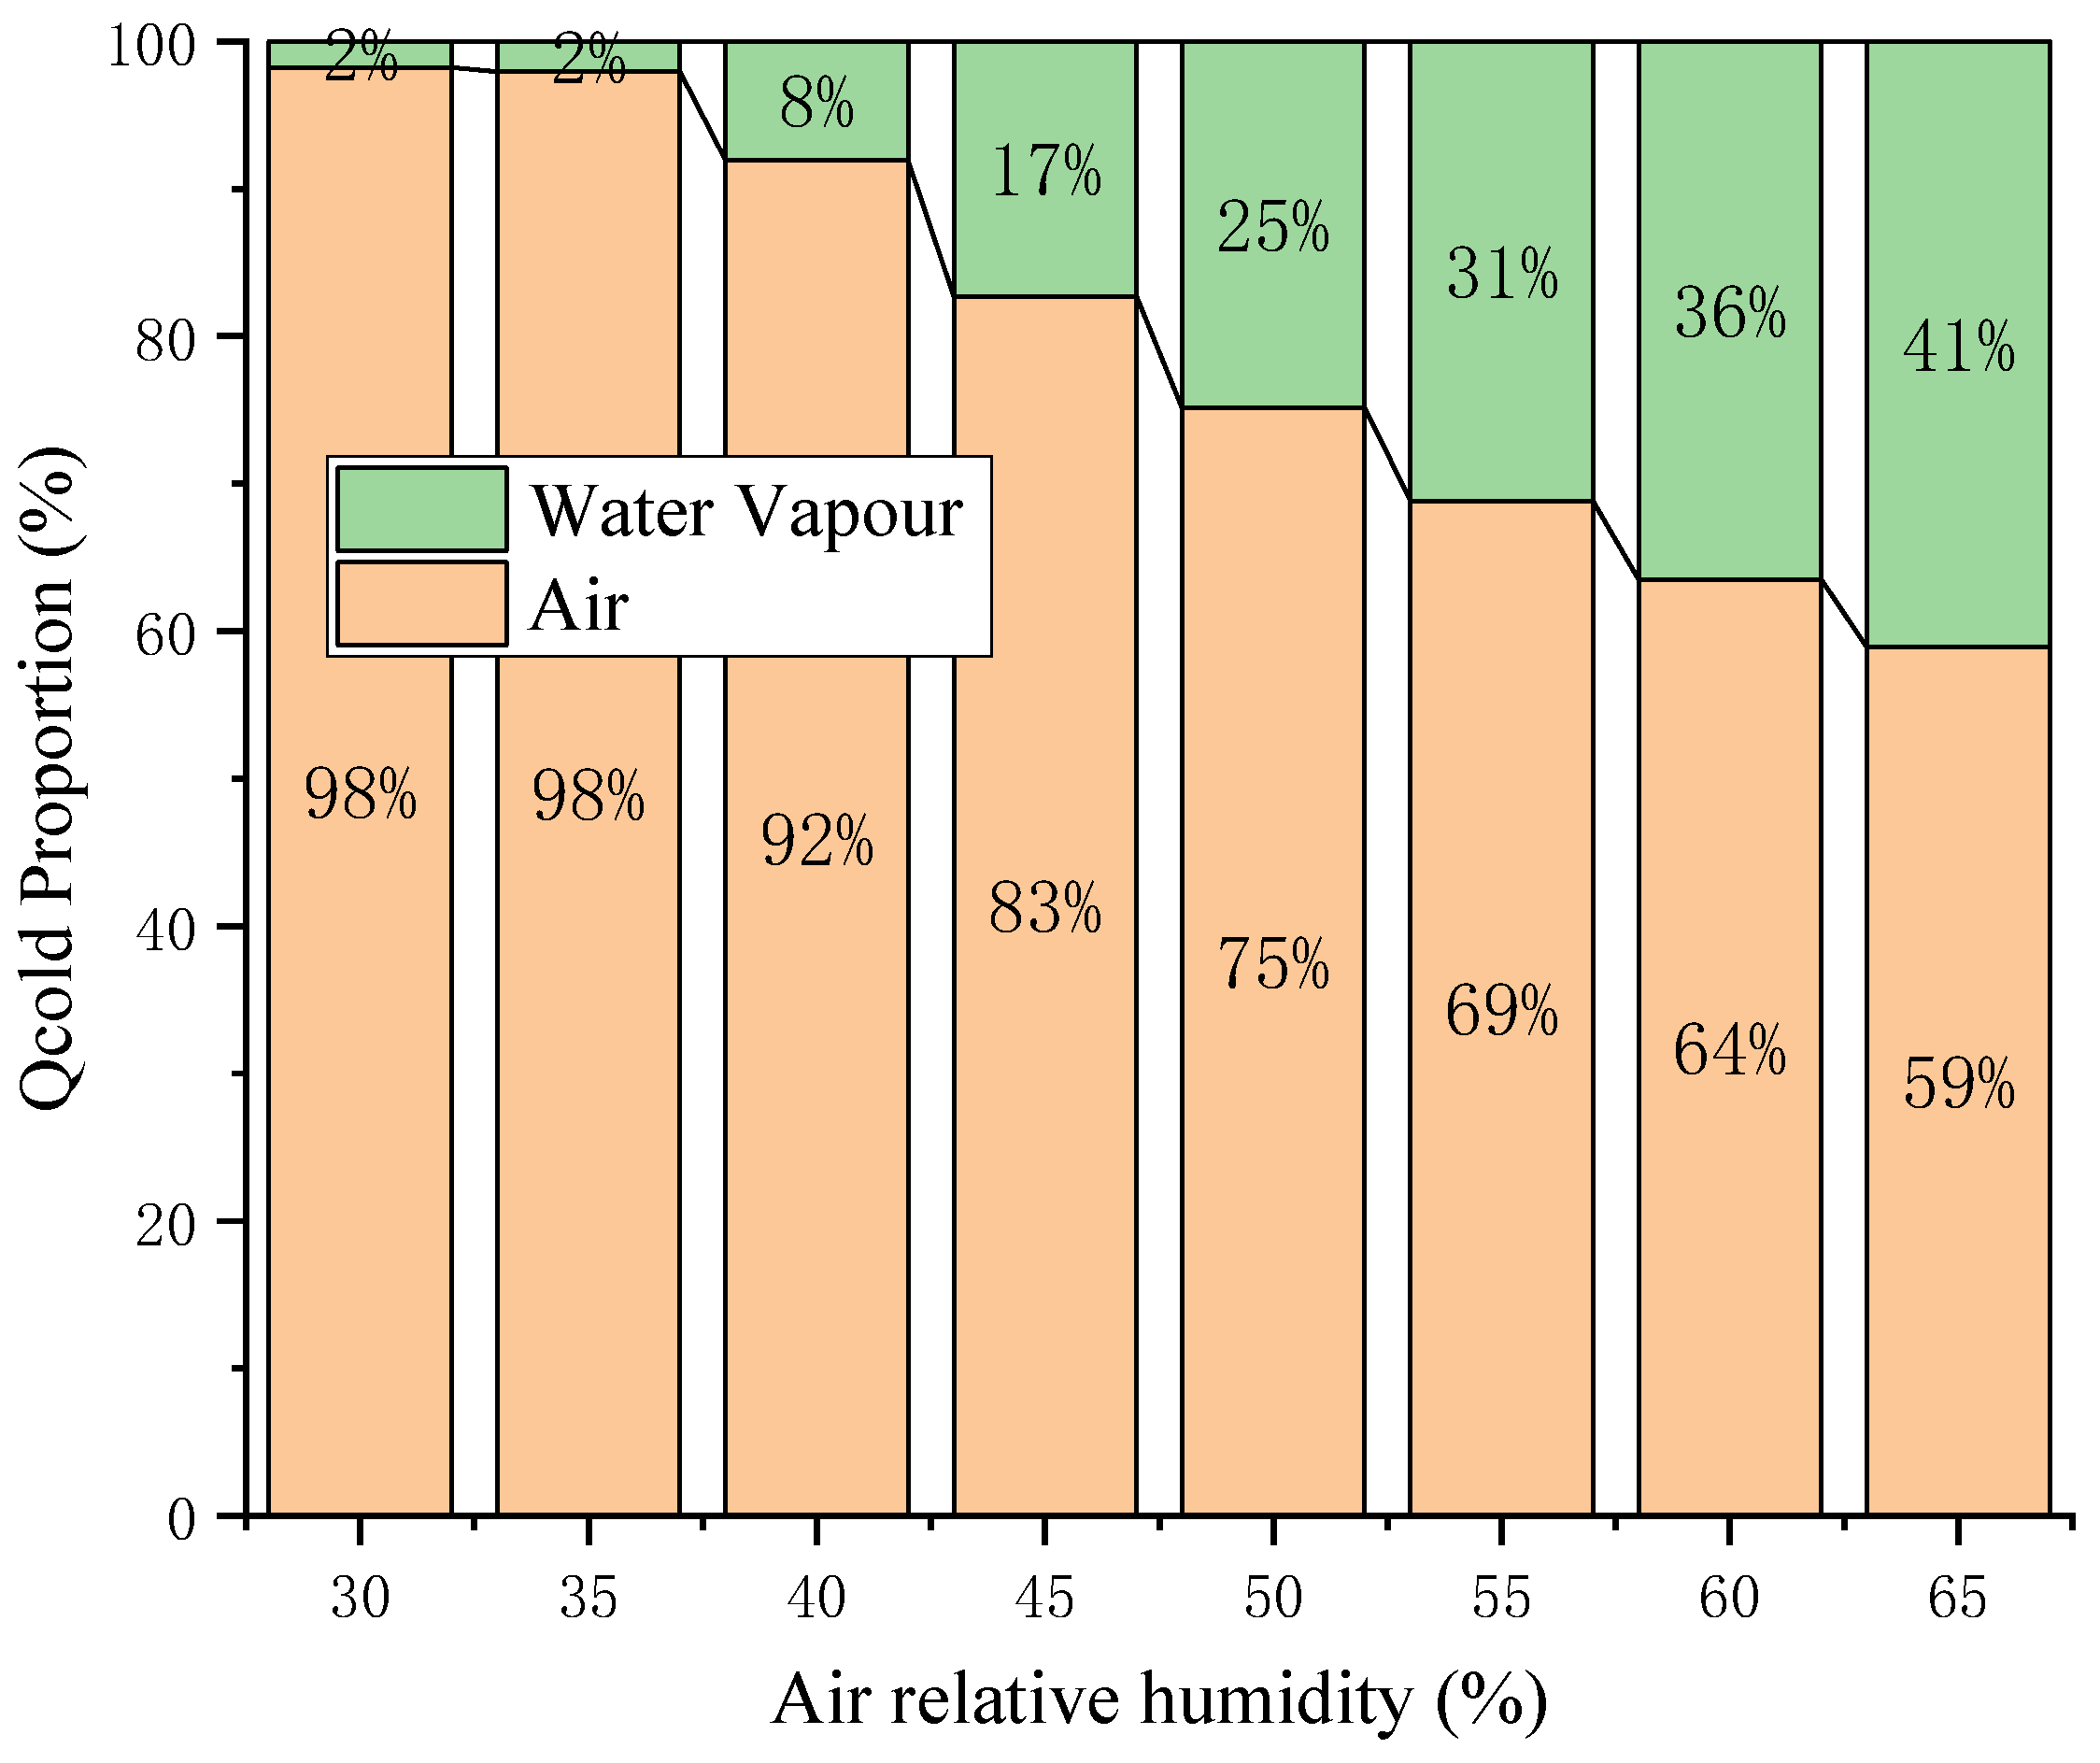
Appendix A.1. Influences of Humidity on Cooling Energy

Appendix A.2. A Pilot Project for Economics Analysis

| Relevant Parameter | Traditional | Precooling |
|---|---|---|
| Initial outlay CInv (million yuan) | 1.265 | 1.265 + 0.4536 |
| Operating cost CO (million yuan) | 43.745856 | 46.7769 |
| Maintenance cost CM (million yuan) | 0.4635 | 0.5325 |
| Labor cost CLabor (million yuan) | 1.8 | 1.8 |
| LCC (million yuan) | 47.274356 | 50.8280 |
| Total gas production during life cycle VLCC (m3) | 792,025,752.8 | 881,320,668.9 |
| Unit cubic cost Cunit (yuan /m³) | 0.059687903 | 0.057672584 |
| Percentage decrease in unit cubic cost | (0.059687903 − 0.057672584)/0.059687903% ≈ 3.38% | |
- (1)
- Initial outlay CInv
- (2)
- Operating cost CO
- (3)
- Maintenance cost CM
- (4)
- Labor cost CLabor
- (5)
- LCC of the system
- (6)
- Total gas production during life cycle VLCC
- (7)
- Unit cubic cost Cunit
Appendix A.3. Uncertainty Analysis of the Deviation from Adiabatic Condition
| Parameter | Adiabatic Index k = 1.4 | Polytropic Index n = 1.3 | |
|---|---|---|---|
| Traditional air compressor | Tin (K) | 293.15 | 293.15 |
| Vin (m3) | 1 | 1 | |
| V0 (m3) | 1 | 1 | |
| Wcom (kJ) | 324.66 | 305.72 | |
| δ (m3/kW·h) | 11.0884 | 11.7756 | |
| Precooling air compressor | Tin (K) | 259.75 | 259.75 |
| Vin (m3) | 1 | 1 | |
| V0 (m3) | 1.129 | 1.129 | |
| Wcom (kJ) | 324.66 | 305.72 | |
| Wcold (kJ) | 20.23 | 20.23 | |
| δ′ (m3/kW·h) | 11.7850 | 12.4701 | |
| Percentage increase in pneumatic-electrical ratio (%) | 6.282 | 5.893 | |
| Percentage difference of change rate of pneumatic-electrical ratio | (6.282 − 5.893)/6.282 ≈ 6.192% | ||
Appendix A.4. Absorption Refrigeration for Waste Heat Recovery and Precooling
References
- Vittorini, D.; Bianchi, G.; Cipollone, R. Energy saving potential in existing volumetric rotary compressors. Energy Procedia 2015, 81, 1121–1130. [Google Scholar] [CrossRef] [Green Version]
- Schmidt, G.A.; Shindell, D.T.; Tsigaridis, K. Reconciling warming trends. Nat. Geosci. 2014, 7, 158–160. [Google Scholar] [CrossRef]
- Victor, D.G.; Zhou, D.; Ahmed, E.H.M.; Dadhich, P.; Yamaguchi, M. Climate Change 2014: Mitigation of Climate Change; Cambridge University Press: Cambridge, UK, 2014. [Google Scholar]
- Taheri, K.; Gadow, R. Industrial compressed air system analysis: Exergy and thermoeconomic analysis. CIRP J. Manuf. Sci. Technol. 2017, 18, 10–17. [Google Scholar] [CrossRef]
- Sun, H.; Luo, X.; Wang, J. Feasibility study of a hybrid wind turbine system—Integration with compressed air energy storage. Appl. Energy 2015, 137, 617–628. [Google Scholar] [CrossRef] [Green Version]
- De Keulenaer, H. Energy Efficient Motor Driven Systems. Energy Environ. 2004, 15, 873–905. [Google Scholar] [CrossRef]
- Ignjatović, I.; Šešlija, D.; Dudić, S. Increasing energy efficiency of compressed air usage for sustainable production of food and beverage. Acta Tech. Corviniensis-Bull. Eng. 2011, 4, 61–65. [Google Scholar]
- McKane, A.; Li, L.; Li, Y.; Taranto, T. Energy efficiency improvements in Chinese compressed air systems. In Proceedings of the 5th Global Energy Efficiency in Motor Driven Systems, Rome, Italy, 10–13 June 2007; pp. 35–43. [Google Scholar]
- Najjar, Y.S.H.; Zaamout, M.S. Performance analysis of compressed air energy storage (CAES) plant for dry regions. Energy Convers. Manag. 1998, 39, 1503–1511. [Google Scholar] [CrossRef]
- Sohani, A.; Farasati, Y.; Sayyaadi, H. A systematic approach to find the best road map for enhancement of a power plant with dew point inlet air pre-cooling of the air compressor. Energy Convers. Manag. 2017, 150, 463–484. [Google Scholar] [CrossRef]
- Radgen, P. Compressed air systems in the European Union. Adv. Chronic Kidney Dis. 2001, 12, 22–31. [Google Scholar]
- Radgen, P. Efficiency through compressed air energy audits. In Proceedings of the Energy Audit Conference, Lahti, Finland, 15–17 December 2006. [Google Scholar]
- Smit, B. Carbon Capture and Storage: Introductory lecture. Faraday Discuss. 2016, 192, 9–25. [Google Scholar] [CrossRef] [Green Version]
- Ren, T.; Xu, W.; Jia, G.W.; Cai, M. A novel isothermal compression method for energy conservation in fluid power systems. Entropy 2020, 22, 1015. [Google Scholar] [CrossRef] [PubMed]
- Wieberdink, J.H. Increasing Efficiency and Power Density of a Liquid Piston Air Compressor/Expander with Porous Media Heat Transfer Elements; University of Minnesota: Minneapolis, MN, USA, 2014. [Google Scholar]
- Wieberdink, J.; Li, P.Y.; Simon, T.W.; Van de Ven, J.D. Effects of porous media insert on the efficiency and power density of a high pressure (210 bar) liquid piston air compressor/expander—An experimental study. Appl. Energy 2018, 212, 1025–1037. [Google Scholar] [CrossRef]
- Yan, B.; Wieberdink, J.; Shirazi, F.; Li, P.Y.; Simon, T.W.; Van de Ven, J.D. Experimental study of heat transfer enhancement in a liquid piston compressor/expander using porous media inserts. Appl. Energy 2015, 154, 40–50. [Google Scholar] [CrossRef]
- Van De Ven, J.D.; Li, P.Y. Liquid piston gas compression. Appl. Energy 2009, 86, 2183–2191. [Google Scholar] [CrossRef]
- Coney, M.W.; Stephenson, P.; Malmgren, A.; Linnemann, C.; Morgan, R.E. Development of a Reciprocating Compressor Using Water Injection to Achieve Quasi-Isothermal Compression. In Proceedings of the International Compressor Engineering Conference, West Lafayette, IN, USA, 16–19 July 2002; p. 10. [Google Scholar]
- Saadat, M.; Li, P.Y. Combined optimal design and control of a near isothermal liquid piston air compressor/expander for a compressed air energy storage (CAES) system for wind turbines. In Proceedings of the ASME 2015 Dynamic Systems and Control Conference, Columbus, OH, USA, 28–30 October 2015; Volume 2, pp. 1–9. [Google Scholar]
- Guo, D.; Ma, Z.; Zhang, J.; Liu, M. Energy Impact of Air Pre-cooling on Screw Air Compressor. Procedia Eng. 2017, 205, 937–944. [Google Scholar] [CrossRef]
- Zhu, R.; Xu, Y.; Li, B.; Chen, H.; Guo, H.; Li, Y. Analysis on the characteristics of solar regenerative compressed air energy storage system. Acta Energ. Sol. Sin. 2019, 40, 1536–1544. [Google Scholar]
- Elakdhar, M.; Nehdi, E.; Kairouani, L. Analysis of a Compression/Ejection Cycle for Domestic Refrigeration. Ind. Eng. Chem. Res. 2007, 46, 4639–4644. [Google Scholar] [CrossRef]
- Bilir, N.; Ersoy, H.K. Performance improvement of the vapour compression refrigeration cycle by a two-phase constant area ejector. Int. J. Energy Res. 2009, 33, 469–480. [Google Scholar] [CrossRef]
- Dai, B.; Qi, H.; Liu, S.; Zhong, Z.; Li, H.; Song, M.; Ma, M.; Sun, Z. Environmental and economical analyses of transcritical CO2 heat pump combined with direct dedicated mechanical subcooling (DMS) for space heating in China. Energy Convers. Manag. 2019, 198, 111317. [Google Scholar] [CrossRef]


| System | ① | ② | ③ | ④ | ⑤ | ⑥ | ⑦ | ⑧ | |
|---|---|---|---|---|---|---|---|---|---|
| Traditional | T/K | 293.15 | - | - | 521.32 | 521.32 | 293.15 | 293.15 | |
| P/kPa | 101.3 | - | - | 759.75 | 759.75 | 759.75 | 759.75 | ||
| Ex(W)/kJ | 0.00 | - | - | 47.37 | 277.30 | 73.34 | 203.96 | ||
| Precooling | T/K | 293.15 | 275.15 | 275.15 | 275.15 | 489.31 | 489.31 | 293.15 | 293.15 |
| P/kPa | 101.3 | 101.3 | 101.3 | 101.3 | 759.75 | 759.75 | 759.75 | 759.75 | |
| Ex(W)/kJ | 0.00 | 4.94 | 0.70 | 0.70 | 44.80 | 260.57 | 56.61 | 203.96 | |
| Top (℃) | −20 | …… | −13.4 | …… | 10 | 20 | |
|---|---|---|---|---|---|---|---|
| Parameter | |||||||
| Tin (K) | 273.15 | …… | 279.75 | …… | 303.15 | 313.15 | |
| Pin (101.3 kPa) | 101.3 | …… | 101.3 | …… | 101.3 | 101.3 | |
| Vin (m3) | 1 | …… | 1 | …… | 1 | 1 | |
| Wcom (kJ) | 275.96438 | …… | 275.96438 | …… | 275.96438 | 275.96438 | |
| Ten (K) | 293.15 | …… | 293.15 | …… | 293.15 | 293.15 | |
| Tcold (K) | 273.15 | …… | 279.75 | …… | 303.15 | 313.15 | |
| Wcold (kJ) | 30.58789 | …… | 20.23258 | …… | 2.32267 | 0 | |
| V0 (m3) | 1.07933 | …… | 1.05179 | …… | 0.96457 | 1 | |
| Percentage increase in gas production (%) | 7.933 | …… | 5.179 | …… | −3.543 | - | |
Publisher’s Note: MDPI stays neutral with regard to jurisdictional claims in published maps and institutional affiliations. |
© 2022 by the authors. Licensee MDPI, Basel, Switzerland. This article is an open access article distributed under the terms and conditions of the Creative Commons Attribution (CC BY) license (https://creativecommons.org/licenses/by/4.0/).
Share and Cite
Hu, Y.; Xu, W.; Jia, G.; Li, G.; Cai, M. Energy Analysis of Precooling Air Compressor System. Entropy 2022, 24, 1035. https://doi.org/10.3390/e24081035
Hu Y, Xu W, Jia G, Li G, Cai M. Energy Analysis of Precooling Air Compressor System. Entropy. 2022; 24(8):1035. https://doi.org/10.3390/e24081035
Chicago/Turabian StyleHu, Yu, Weiqing Xu, Guanwei Jia, Guangyao Li, and Maolin Cai. 2022. "Energy Analysis of Precooling Air Compressor System" Entropy 24, no. 8: 1035. https://doi.org/10.3390/e24081035
APA StyleHu, Y., Xu, W., Jia, G., Li, G., & Cai, M. (2022). Energy Analysis of Precooling Air Compressor System. Entropy, 24(8), 1035. https://doi.org/10.3390/e24081035