Article

An Integrated Fuzzy Analytic Hierarchy Process (AHP) Model for Studying Significant Factors Associated with Frequent Lane Changing

1
Department of Transport Technology and Economics, Faculty of Transportation Engineering and Vehicle Engineering, Budapest University of Technology and Economics, Műegyetem rkp. 3, 1111 Budapest, Hungary
2
Department of Civil Engineering, Comsats University Islamabad, Wah Campus, Islamabad 45550, Pakistan
3
Interdisciplinary Research Center of Smart Mobility and Logistics (IRC-SML), King Fahd University of Petroleum & Minerals, KFUPM, Dhahran 31261, Saudi Arabia
4
Center of Excellence in Trauma and Accidents, King Abdulaziz University, Jeddah 21589, Saudi Arabia
5
Department of Surgery, Faculty of Medicine, King Abdulaziz University, Jeddah 21589, Saudi Arabia
6
Department of Civil Engineering, College of Engineering, Qassim University, Buraydah 51452, Saudi Arabia
7
Development Services, Lee County Government, Fort Myers, FL 33902, USA
*
Authors to whom correspondence should be addressed.
Entropy 2022, 24(3), 367; https://doi.org/10.3390/e24030367
Submission received: 7 December 2021 / Revised: 31 December 2021 / Accepted: 27 January 2022 / Published: 4 March 2022
(This article belongs to the Special Issue Mathematical Analysis of Urban Spatial Networks)

Abstract

:
Frequent lane changes cause serious traffic safety concerns, which involve fatalities and serious injuries. This phenomenon is affected by several significant factors related to road safety. The detection and classification of significant factors affecting lane changing could help reduce frequent lane changing risk. The principal objective of this research is to estimate and prioritize the nominated crucial criteria and sub-criteria based on participants’ answers on a designated questionnaire survey. In doing so, this paper constructs a hierarchical lane-change model based on the concept of the analytic hierarchy process (AHP) with two levels of the most concerning attributes. Accordingly, the fuzzy analytic hierarchy process (FAHP) procedure was applied utilizing fuzzy scale to evaluate precisely the most influential factors affecting lane changing, which will decrease uncertainty in the evaluation process. Based on the final measured weights for level 1, FAHP model estimation results revealed that the most influential variable affecting lane-changing is ‘traffic characteristics’. In contrast, compared to other specified factors, ‘light conditions’ was found to be the least critical factor related to driver lane-change maneuvers. For level 2, the FAHP model results showed ‘traffic volume’ as the most critical factor influencing the lane changes operations, followed by ‘speed’. The objectivity of the model was supported by sensitivity analyses that examined a range for weights’ values and those corresponding to alternative values. Based on the evaluated results, stakeholders can determine strategic policy by considering and placing more emphasis on the highlighted risk factors associated with lane changing to improve road safety. In conclusion, the finding provides the usefulness of the fuzzy analytic hierarchy process to review lane-changing risks for road safety.

1. Introduction

Each year, over 1.35 million people die, and as many as 50 million become injured in traffic accidents worldwide [1]. In 2010, the European Union repeated its intention to develop road safety by placing a mark of decreasing road fatalities by 50% by 2020, followed by a prior mark agreed in 2001 to halve the number of road fatalities by 2010. A new aim was declared by the European Commission on 17 May 2018 to halve road fatalities. The earliest set target to halve the number of severe road traffic injuries is by 2030 compared to 2020 stages [2]. According to the latest available data [3], Hungary recorded an overall rise in the number of road deaths in 2018. Accordingly, 633 persons lost their lives in traffic accidents. This represents an increasing trend in road fatalities as compared to recent years’ traffic crash data. Amongst them, human-related factors are considered to be the leading source of traffic fatalities worldwide [4].
The situation investigation of the Road Safety Action Program (RSAP) has revealed that human factors contribute to a high number of road crashes; therefore, solving them aids the most desired objective of highway safety programs [5]. The frequent lane-changing act is one of the human-related issues that pose a negative impact on the traffic system’s efficiency under enhanced traffic demand [6]. An investigative study [7] reported that lane changing action is one of the severe common causes of collisions in the United States. Moreover, official data records showed that at least one-third of all traffic collisions ensue as vehicles perform lane change operations or during exiting the road. In addition, recent crash data (2010 to 2017) in Middle East countries indicate that abrupt lane changes are one of the primary sources (17%) of severe traffic crashes followed by speeding (12.8%) [8].
In current years, most researchers analyzed lane-changing occurrences by applying different dynamic and statistical systems, while few studies considered game theory to observe lane-changing actions [9,10,11,12]. Moreover, the latest advancements in Artificial Intelligence (AI) have also led to promising opportunities for examining drivers’ behavior during frequent lane-change maneuvers, thereby providing key indicators for safety. Accordingly, the neural network model can evaluate lane-changing behavior in a more defined manner as compared to the multinomial logit model [13]. Li et al. (2016) [14] utilized probabilistic methods to investigate lane-changing behavior. The authors developed an exponential probability model to investigate the association among relative velocity and lane-changing likelihood relative vehicle gaps. In addition, the latest research employed a simulation-based model to estimate the effect of important elements on lane-changing [15]. Farooq et al. [16], using the designed calibrated standards for driving logic ‘conscious’ in VISSIM, examined the influence of critical traffic parameters on traffic safety during frequent lane changes. While in another recent research study [17], the authors introduced a novel procedure for validating lane-changing in the context of urban driving conditions. The human inducements from different perspectives as route change incentive, speed incentive, courtesy incentive, comfort incentive, etc., were described comprehensively using a decision-theoretical framework known as Multi-Criteria Decision Making (MCDM). The approach of grouping was considered explicitly according to the type of driving style, which can vary across different individual and driving conditions. Consequently, a decision selection procedure for lane-change operations was proposed. The proposed model yielded a more complex and frequent lane-changing behavior with various inclinations of incentives [17].
In recent years, fuzzy sets have been gaining widespread recognition in the application of multicriteria systems [18]. Presently, various studies merged AHP methodologies with the system of fuzzy logic that provides risk prioritization according to their threat level and produces a reliable model assessment of risk. The application of such risk assessment models can be found in various fields, such as the risk assessment of floor water incursion in coal mines [19], driver behavior criteria [20], and information technology projects [21]. Moreover, the state of urban transport supply value in Mersin was estimated by employing fuzzy-AHP methodology to create a more practical assessment method [22]. Some previous studies applied the FAHP method in road transport projects, as described in Table 1.
In current crash data, it was mainly observed that frequent lane changing is caused due to the involvement of at-fault drivers (at the crash-prone spots/locations) without highlighting the reasons following such actions [8,17,30]. Previous study findings mainly focussed on critical driver behavior factors that could influence traffic safety by utilizing statistical methods [31,32] and MCDM procedures [20,25,33], but these studies lack research specifically about the decision on highly significant main factors and subfactors designed in the AHP hierarchical model that can be involved in frequent lane changes based on experts responses using a robust FAHP model. The applied model is more efficient than pure AHP, because fuzzy sets mitigate the uncertainty of nonexpert evaluations. To analyze the important road safety issue (frequent lane changing) comprehensively, the present study has considered the well-acknowledged lane change model designed on the AHP framework [34]. In this study, the adopted model aims to inspect and prioritize the most crucial factors and subfactors affecting frequent lane change based on evaluators’ answers in order to mitigate uncertainty in nonexpert evaluations. By applying the integrated FAHP approach, the experts in the field intended to handle the vagueness of human behavior by using linguistic terms for the assessment of efficient transport systems. Currently, several studies combine AHP approaches with the system of fuzzy logic that offers risk prioritization according to their risk level and produces a consistent model for risk assessment. The use of such risk assessment models was utilized in several areas such as the risk assessment of floor water incursion in coal mines [19], information technology developments [21], and assessment of means in hazardous substance transportation [26].
This study work is designed as follows. The questionnaire survey design based on the fuzzy-AHP approach is described in Section 1. Subsequently, the case study considering a real-life subject with the arrangement of the proposed model is presented. Furthermore, it also includes the significance of main factors and subfactors affecting frequent lane changes associated with highway safety. Then, in the next section, the methodological procedures and features of the fuzzy-AHP method are presented. Afterward, the results section highlighted the most significant lane-change factors based on measured weights. After that, sensitivity analysis was employed to verify the robustness of the study results. Finally, conclusions are drawn along with some future suggestions to the experts of the specified field with statements for advanced studies.

2. Methodology

2.1. Questionnaire Survey

This study is designed to highlight the critical factor affecting frequent lane changes using the fuzzy-AHP technique. To assess road safety conditions, important data sources include roadside surveys, questionnaire surveys, and accident statistics. The questionnaire survey, in particular, if they are directed online, is a comparatively inexpensive approach to obtain indicators on road users’ behaviour and safety culture, but they rely on self-declared information. A key benefit of questionnaire surveys is that they can deliver understanding into the socio-cognitive factors of behavior, such as perceived social norm, attitudes, existing habits, or risk perception [35]. To evaluate human actions involved in road safety issues and to propose safety measures, there has been substantial research performed based on questionnaire-related studies [5,20,31,32]. DBQ was originally introduced to identify the deviant driving behavior in related earlier studies in the 1990s [36,37]. In this regard, the Driver Behavior Questionnaire (DBQ) extends out due to its dominance and longevity use among the numerous implementations [37]. The present research work is aimed at performing a questionnaire-based survey using a fuzzy scale to assess the influence of major factors on lane changing. The city of Budapest (Hungary) was considered as a case study. Accordingly, the questionnaire survey was circulated among hundred evaluators (drivers having a valid driving license) from the Department of Transport Technology and Economics at ‘Budapest University of Technology and Economics’. The response rate was 70%. Solomon (2006) [38] emphasized in his phenomenon ‘Wisdom of crowds’ that 20 participants can contribute an extreme judgment. The online survey was supported with the application of an online google form. The acquired response data of seventy participants based on the FAHP framework simulated their knowledge related to driving behavior in an efficient manner. Furthermore, the questionnaire was divided into two portions to collect relevant information. The first portion consists of essential data related to evaluators such as gender, age, education, and duration of driving license, as presented in Table 2, while the second part intended to estimate the effect of critical factors on lane-changing designed on a fuzzy scale, as reflected in the results section. As an example, Table 3 presents the questionnaire survey designed on a fuzzy scale for level 1, while the detailed questionnaire forms used for the study are provided in Appendix A.

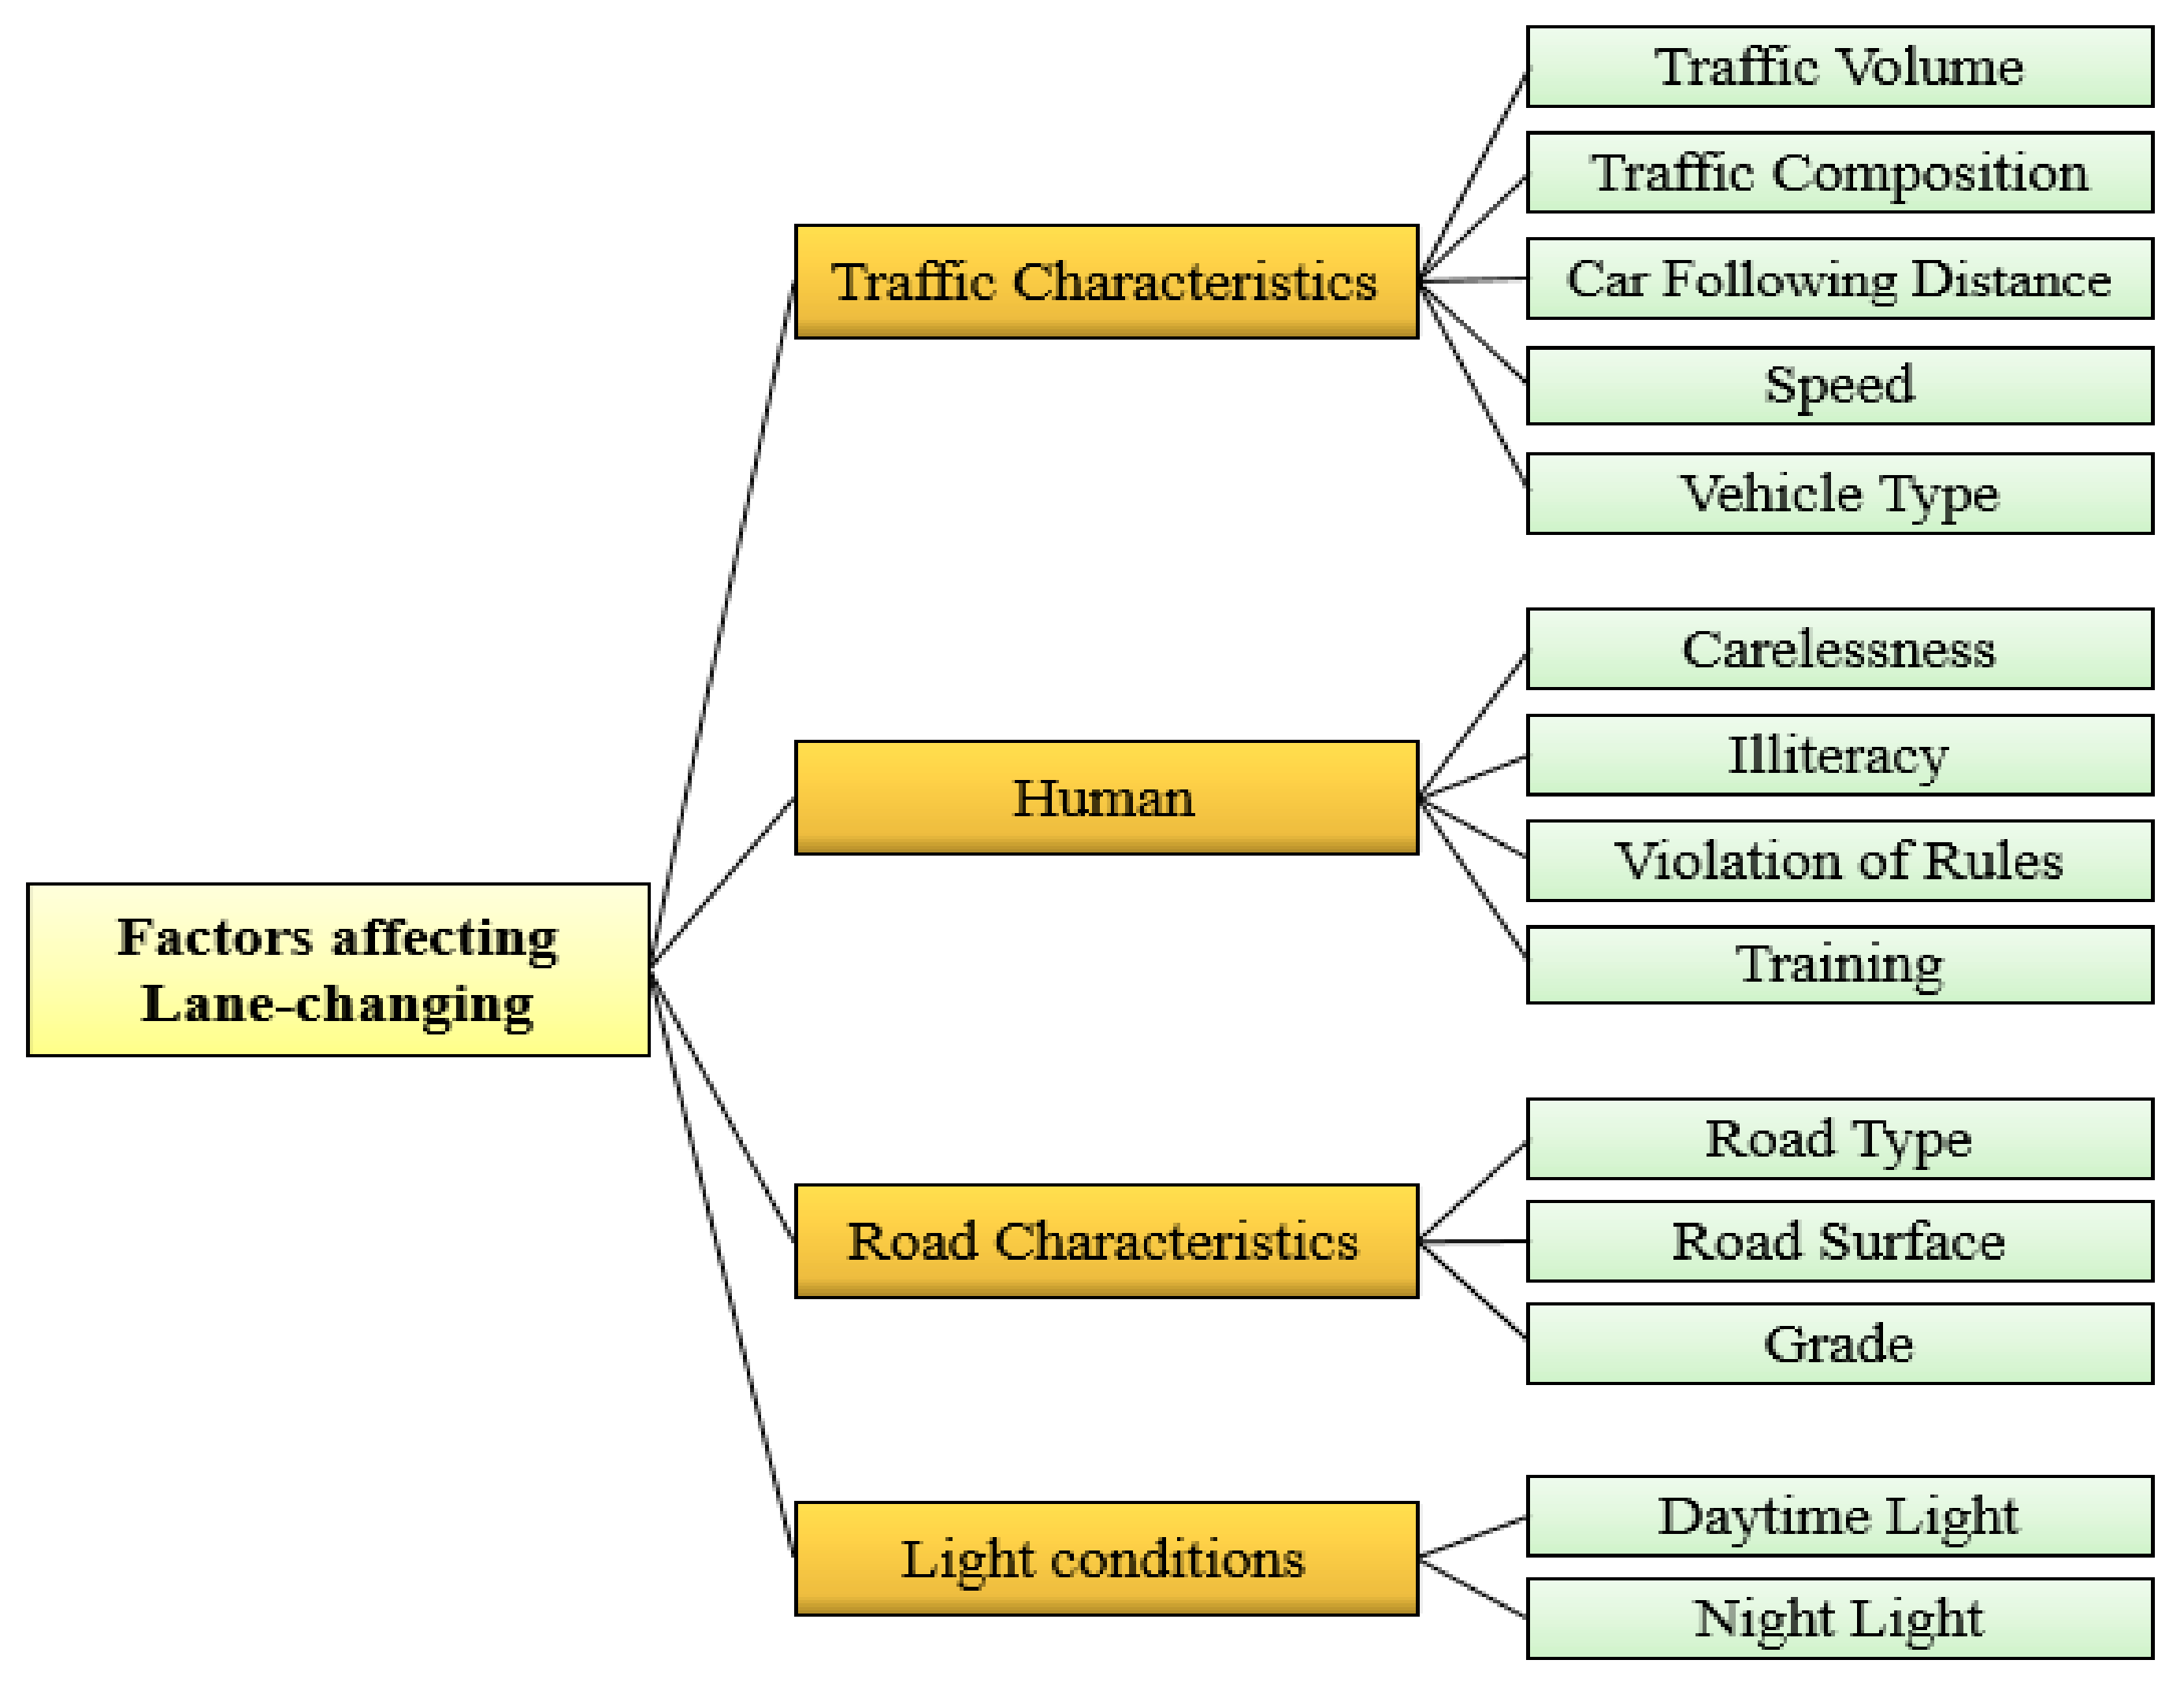
2.2. Factors Affecting Lane Changing

The trend of lane-changing was stated as ‘a driving practice in which along the same direction of travel the vehicle’s movement are changed between the adjacent lanes’ [39]. This work considered the crucial factors and their surrogate factors influencing lane changing and is designed on a two-level hierarchical arrangement for evaluation purposes. The first level contains four basic elements affecting traffic safety such as as ‘human attributes’, ‘traffic characteristics’, ‘road features’, and ‘lighting conditions’. For level 2, these basic elements were subsequently distributed into surrogate elements, as presented in Figure 1. A summary showing the significance of specified factors affecting lane changing is depicted in Table 4, with abbreviations and associated references.

2.3. Analytic Hierarchy Process (AHP)

One of the highly generally utilized techniques of MCDM analysis is the application of an Analytic Hierarchy Process (AHP), which was first introduced by Karayalcin in 1982 [56]. AHP presents an idyllic stage for complex decision-making issues. The AHP method utilizes specific mathematical procedures for handling subjective choices of an individual or a group of individuals on the sets of related criteria, evaluating and analyzing results. In many situations, the individuals are specialists in a specific area of work [57]. AHP is one of the best extensively used MCDM techniques in business, management science, and engineering. AHP aids the decision-maker in assessing complex problems with multiple conflicting and subjective measures [58,59]. In the analysis of risk, the AHP method is updated, and it can be sequenced into three major stages: (1) the formation of a hierarchical model of risk components; (2) measurement of the relative weights of risk components; and, finally, (3) the quantifiable evaluation of the risk intensity [60]. The AHP method involves the following steps:
  • Step#01: Designing the hierarchical model of assessment elements;
  • Step#02: Create the survey using a fuzzy scale (1–9) for pairwise comparisons in the hierarchical structure;
  • Step#03: Analyzing the consistency of pairwise comparisons;
  • Step#04: Estimating the aggregated weight scores;
  • Step#05: Developing the weight vectors and measuring the final weight scores by observing branch networks.
  • Step#06: Conducting Sensitivity investigation
In AHP consideration, several mutual systems were observed [58]. Sometimes, the experts in the survey do not provide a numerical decision. Alternatively, a relative verbal conception, which is highly distinctive in our daily lives, is adequate under such circumstances [61]. Nevertheless, the qualitative 1 to 9 central scale introduced by Saaty, T.L. (1980) [56] is normally utilized to estimate the elements by performing pairwise comparisons. Directed comparisons are documented by a positive reciprocal matrix, as presented in Equation (1):
X = x i j x 12 x 1 n x 21 1 1 x n 1 1
where x i j denotes the factorial comparison between i and j, and n indicates the measurement of the pairwise comparison matrix. It also shows the number of weighed elements in the matrix and the total comparisons ( n n 1 / 2 ) .
If the matrix is completely consistent, then x i j = x i n . x n j . For checking matrix consistency, Saaty et al. [56] determined the Consistency Index (CI), and it is relevant to the maximum eigen value λ m a x .
C I = λ m a x n n 1
The consistency ratio (CR) is subsequently determined by the following relation:
C R = C I / R I
where RI represents the average random index based on matrix size and can be determined using the information presented in Table 5.
The matrix consistency is perfectly reliable and suitable when CR is less than 10%; if not, the assessor has to re-estimate the pairwise comparison matrix.

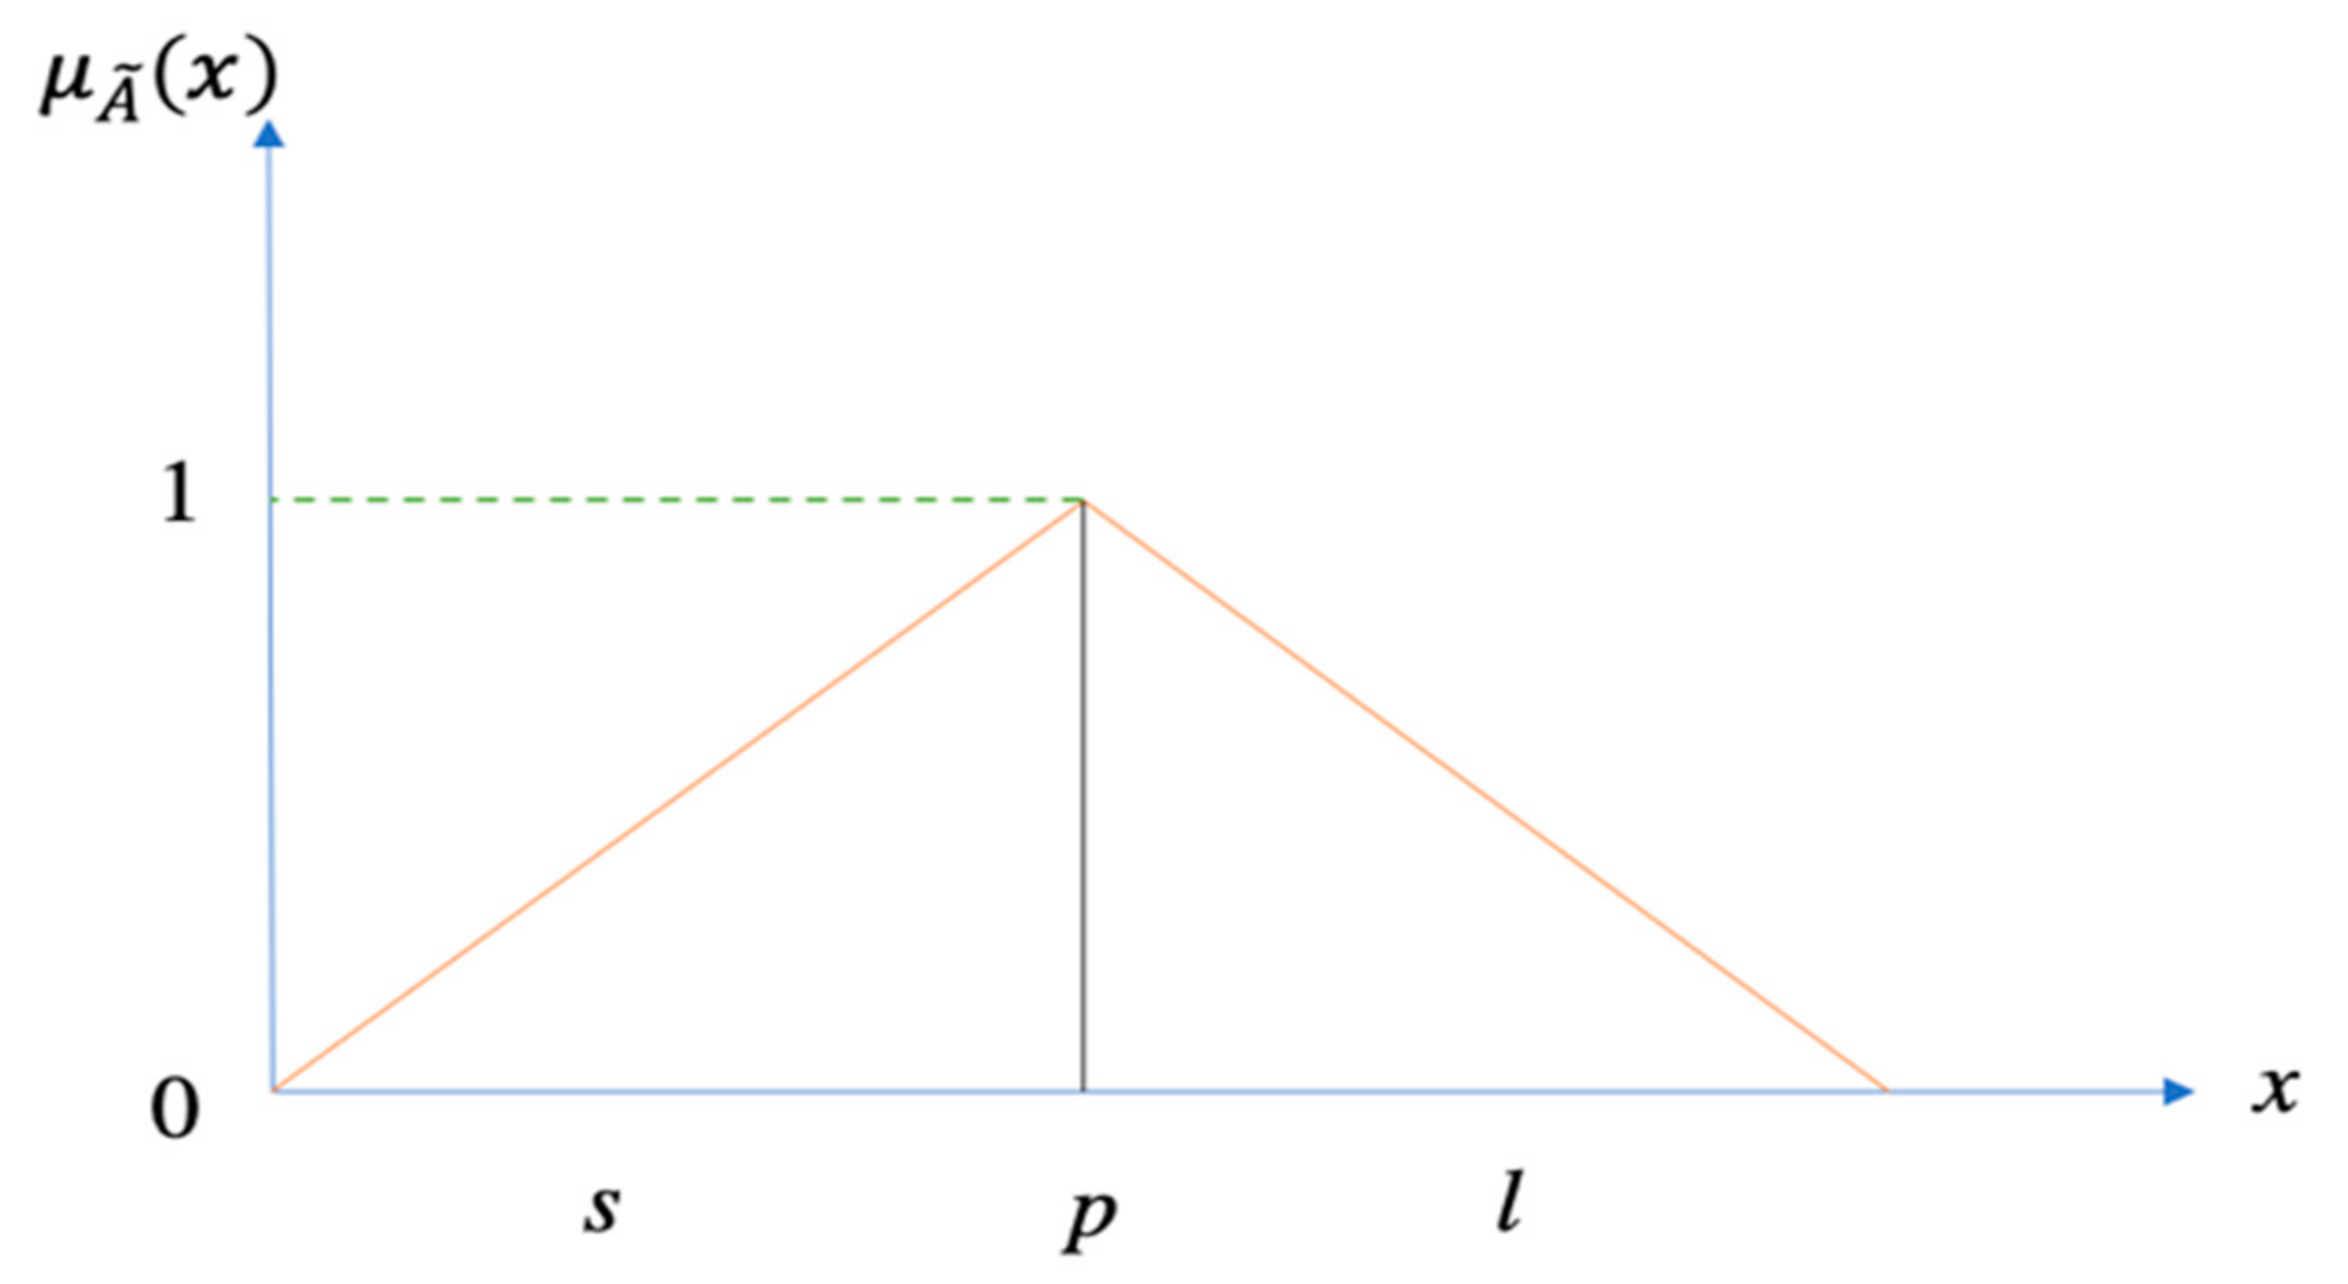
2.4. Triangular Fuzzy Sets

As an extension to the standard AHP technique, Fuzzy AHP was utilized to assess the weight of decision elements due to the increasing significance of the fuzzy set principle in the scope of multicriteria approaches. The key intent of this act was to perform a comparative study of two arrangements of weights and also to define the effect of the fuzzy scale on component weights and, consequently, on decision levels [61]. In complex situations, drivers generally fail to define their priorities because of the vague characteristics of complex problems [17]. To mitigate the ambiguity of individual thinking and handle uncertainty problems, [62] first created the fuzzy set theory, which focused on the rationality of ambiguity. As the human point of view was utilized in weighting the most important factors influencing the studied complex problem,
A ˜ = s ,   p ,   l , where the parameters s, p, and l signify the smallest viable value, the most likely value, and the leading potential value, respectively, which explain a fuzzy case [63] is presented in Equation (4). A triangular membership function of A ˜ is presented in Figure 2.
μ A ˜ x = x s p s , s x p l x l p , p x l 0 , o t h e r w i s e
The main operation steps that can be conducted on triangular fuzzy numbers [62] are the following.
Addition:
s 1 + s 2 , p 1 + p 2 ,   l 1 + l 2
Multiplication:
s 1 × s 2 ,   p 1 × p ,   l 1 × l 2
Subtraction:
s 1 l ,   p 1 p 2 ,   l 1 s 2 )
Division:
s 1 l 2 , p 1 , p 2 , l 1 s 2
Reciprocal:
A ˜ 1 = 1 s 1 , 1 p 1 , 1 l 1
In this study, the calculation approach is based on fuzzy numbers for which their values are presented in Table 6.

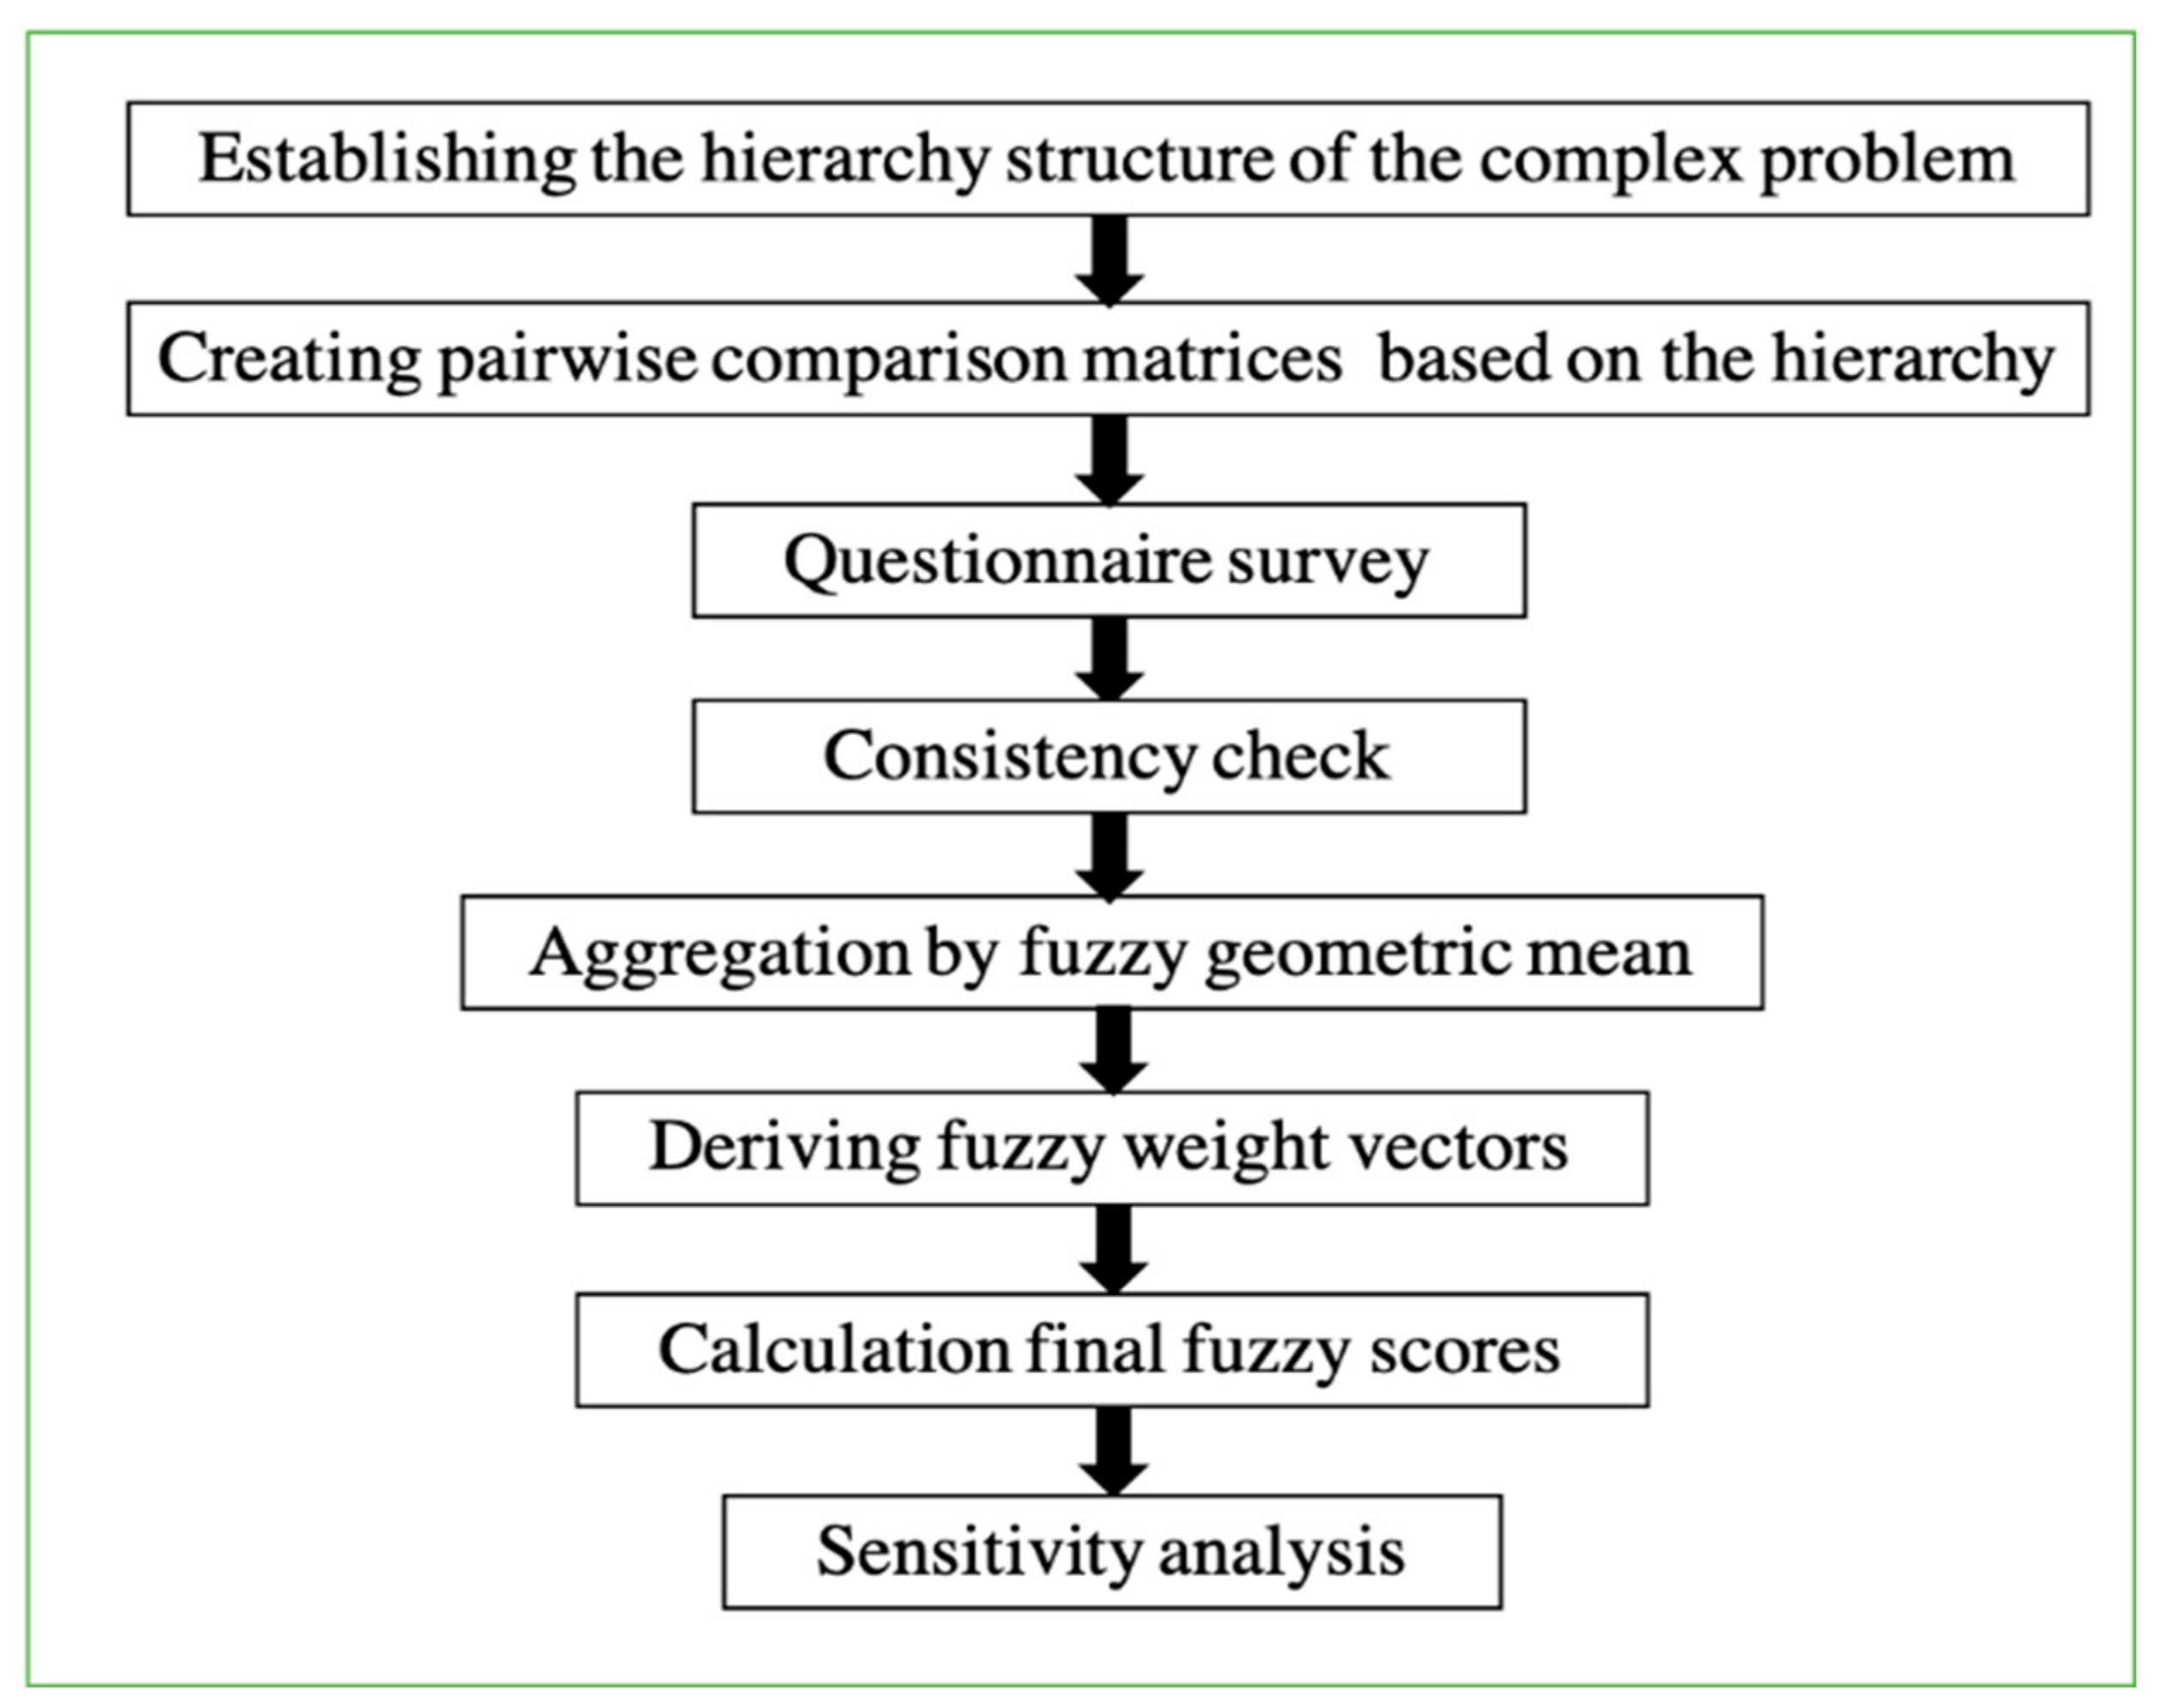
2.5. The Proposed Fuzzy AHP

Zadeh et al. [62] presented a model of linguistic variables to convey individual discernment in terms of fuzzy arrangements as a substitute of crisp values. Van et al. [66] utilized the first fuzzy extension of the AHP technique to develop Saaty’s AHP procedure with triangular fuzzy numbers. Chang et al. [67] used triangular fuzzy numbers to assess the weight vectors under the individual measure based on pairwise comparisons. This study utilized an integrated fuzzy AHP model to measure the effect of critical factors on lane changing in a two-level hierarchical lane change structure. Figure 3 represents the flowchart for the main steps of the conducted model. Furthermore, after the defuzzification step, measuring the consistency of all pairwise comparison matrices is an important step, and it is adopted by computing the values of the consistency index (CI) and consistency ratio (CR) by applying Equations (2) and (3), respectively.
The fuzzy AHP method is observed as an appropriate approach for this research study, and the following steps were conducted:
  • Step#01: Establishing the hierarchy structure of the complex problem;
  • Step#02: Designing the pairwise comparison matrices by considering all factors in a hierarchy structure;
  • Step#03: Evaluating pairwise comparison matrices by utilizing the fuzzy number scale (Table 6);
  • Step#04: Aggregating the preferences of all evaluators by using geometric mean;
  • Step#05: Calculate the final overall weights for all factors (Table 7);
  • Step#06: Weights’ defuzzification;
  • Step#07: Calculating th absolute weight scores by considering branch relations in the case of multilevel;
  • Step#08: Checking consistency;
  • Step#09: Sensitivity analysis.
The fuzzified weights in proposed model are conducted by using the following:
g ˜ i = a ˜ i 1 a ˜ i 2 a ˜ i 3 a ˜ i 4 a ˜ i 5 1 / n
w ˜ i = g ˜ i   g ˜ 1 g ˜ 2 g ˜ 3 g ˜ 4 g ˜ 5 1
where a ˜ i j is fuzzy preference value of dimension i to factor j; thus, g ˜ i is the geometric mean of fuzzy preference value of factor i to each factor, and w ˜ i includes the fuzzy weights of the i-th factors and can be adopted by a triangle fuzzy number, defined by w ˜ i = s w i ,   p w i ,   l w i   s w i ,   p w i ,   a n d   l w i , considered for the upper, middle, and lower numbers of the fuzzy weight of the i-th dimension.
As the last action, sensitivity analysis is employed. In our case, we increased the weight of individual criteria, and the changes within the priorities were stable. This enables an understanding of the effects of changes in the ranking of main criteria and sub-criteria and helps the decision-maker to check for robustness throughout the process. In general, sensitivity analysis can be adopted by increasing or decreasing the weight of individual criteria, resulting in changes within the priorities; thus, the ranking of the alternatives is often observed. Sensitivity analysis, therefore, provides information on the stableness of the ranking. If ranking is extremely sensitive to small changes within the standard weights, a careful review of the weights is usually recommended. In addition, decision criteria should be included as a sensitive ranking point to a weak discrimination potential for this set of criteria.

3. Results

The final measured weights based on the FAHP model are very reliable as it provides more consistent outcomes compared to the standard AHP method. A previous study noticed that the AHP method generates and deals with a highly unbalanced scale of judgment, and it does not study the uncertainty connected with the mapping of human judgment to a number by natural linguistics [68]. The final overall weights for all factors were measured based on a fuzzy AHP model, as shown in Table 7. For level 1, the weight score was observed to be high for the factor ‘Traffic characteristics’ (0.5404) followed by ‘Human’ (0.2232). While the weight score was estimated to be the lowest for factor ‘Light conditions’ (0.0882) as compared to other specified factors. For level 2, the weight score was observed to be high for factor ‘Daytime light’ (0.8193) followed by ‘Road type’ (0.6215), while the weight score was estimated to be the lowest for the factor ‘Illiteracy’ (0.1084).
While the ranks for the main factors in the first level of the lane change model were estimated based on FAHP measured weights, as presented in Table 8, the results revealed ‘Traffic Characteristics’ as the highest rank factor because it has the biggest weight score (0.5404) followed by ‘Human’ factor where its weight score is (0.2232). From the findings of the previous study, the effect of specified traffic characteristics on lane changing was observed highly significant [69]. Furthermore, FAHP results estimated ‘Light Conditions’ as the least rank factor with a weight score (0.0882) followed by ‘Road Characteristics’ with a weight score of (0.1847). The lowest environmental effect was observed in connection with enhanced traffic safety and high traffic competence [70].
For level 2, the FAHP model results showed ‘Traffic Volume’ as the most significant factor with a weight score (0.22) followed by ‘Speed’ factor with weight score (0.1734) as compared to other observed factors. It was observed that traffic volume has a major influence on the overtaking frequency and following gap, which are naturally related to lane changing [71,72], while a recent study estimated that different types of speed significantly influence lane changing, such as speed distribution, average speed variation [14], and speed above speed limit [16]. Furthermore, based on final weights, the model outcomes assessed ‘Night Light’ as the least critical factor with weight scorer (0.0159) followed by the ‘Illiteracy’ factor with a weight score of (0.0242), while the ranks of other factors based on weight scores are depicted in Table 9.

3.1. Sensitivity Analysis

In model development utilizing AHP, sensitivity analysis is a significant procedure in deciding if the outcome is robust and implementable. It is an important process for better forecasting; accordingly, future planning will have more accuracy [33]. The sensitivity analysis process is one of the AHP steps in order to apply and execute the AHP approach. In this study, sensitivity analysis has been conducted as follows: In the first level, the ‘traffic characteristics’ factor weight was amended from 0.5404 to 0.5500. The slight change in the factor weight from 0.5404 to 0.55 is for detecting the stability of the other factor’s weight, which is the aim of conducting sensitivity analysis. The weight scores of the other factors in this level were modified in order to maintain a score of one for the total calculation of weight scores.
Correspondingly, the score of lower-level factors was altered (as Equation (7) specifies). In sensitivity assessment, the first ranking level was held, and the variation in ranking was analyzed based on previous and current traffic safety assignments in a city. This proposition might reason an adjustment in the significance of evaluators. As shown in Table 10, the applied modification has not changed the factor rank or order.
Changes have been slightly detected in the second level. As shown in Table 11, the sensitivity of the sample test is small; for example, the ‘traffic composition’ factor has been changed slightly from the eight position to the seventh position, while the factor ‘following distance’ is now in the fourth position instead of the fifth position. The other three factors have not changed.

3.2. Discussion

The use of fuzzy AHP is considered indispensable when inaccuracy in decision-making must be removed. To determine the applicability of the designed model, a real-life traffic safety problem (frequent lane changing) is designated, ranking the highly critical factors influencing lane changing based on the responses of drivers. Based on subjective decisions, uncertainty in the evaluation procedure is incorporated by using FAHP. Applying AHP in fuzzy light conditions has been proven to be successful based on the results since some drivers are not fully attentive of the significant parts in pairwise comparisons, thus allowing more flexible numbers aided in the acquisition of a highly reliable ranking. The objectivity of the model was supported by sensitivity analyses that examine a range for the weights’ values and corresponding to alternative scenarios. The fuzzy method can be proposed for all decision support fields in which layman evaluators assess the elements of the decision system, mainly in techniques in which pairwise comparisons are applied. In addition, the proposed model enables experts to be familiarized with the complete assessment process. This significance has been verified by our survey data. The projected integrated method could aid decision-makers in concentrating on high-ranked critical factors influencing frequent lane changes to increase the safety of roads. A study utilized the AHP model [73] for apps mapping and expert opinions to control risky driving behavior, which may contribute to road safety. Previous study findings provided safety direction for the safe lane changing of vehicles in the system of the Internet of Vehicles, which decreases the incidence of road traffic collisions and safeguards sustainability and traffic operation safety in an effective manner [74]. A recent study proposed a model that can explore significant developments in safe lane-changing with respect to connected and autonomous vehicles (CAVs) in heterogeneous traffic flow for both connected and autonomous and human-driven vehicles (HVs) in the future [75]. In addition, traffic safety campaigns and drivers training based mainly on the driver’s compliance with speed limits, lane-changing rules, and use of intelligent traffic systems should be held in educational institutes to address considerations, which may result in improved perceived risk and lower engagement in risky driving behaviors [76,77,78,79].

4. Conclusions

In this work, the effect of critical factors and subfactors on lane-changing was analyzed for traffic safety systematically in the fuzzy system. The framework of our study has been adopted after numerous iterations aimed to outline relevant key factors. The evaluation results of this study highlighted the most critical factors that could influence frequent lane change behavior and further cause negative effects on road safety. For level 1, the ‘traffic characteristics’ factor was detected as the most critical factor, while the second most critical factor was ‘human’, as followed by ‘road characteristics’. For level 2, the FAHP model results assessed ‘traffic volume’ as the most significant factor, followed by the ‘speed’ factor. The evaluation of significant traffic parameters instigating frequent lane changes could increase our consideration of lane changing risk and would encourage the improvement of a more sustainable transport network. Some significantly estimated factors related to ‘Traffic characteristics’ (speed) and ‘Road characteristics’ (road type) should be considered for the development of improved road design for sustainable road safety. These essential evaluations could be valuable for drivers with respect to being aware of their individual traffic risks for a specified region. Linkage of the assessed data with traffic authorities may help to implement effective local road safety strategies. Traffic safety campaigns based primarily on the driver’s compliance with lane-changing rules should be held in public and private sector institutes to address the attention, which may result in improved perceived risk when possible issues arise in performing a decision concerning the risk mechanisms related to frequent lane changing by utilizing a single form of fuzzy linguistic expressions. Consequently, the individual can use the performance of numerous forms of fuzzy sets theory for determining other related problems of road safety and for advanced vehicle automation subjects. Moreover, more test data from different concerned regions should be used to check the validity of the algorithm that has been considered in this research in follow-up research. Comparing different data sets will enable us to develop this work in improving proactive behavioral systems.

Author Contributions

Conceptualization, S.M. and D.F.; methodology, S.M.; software, D.F. and S.M.; validation, S.M., A.J. and R.F.T.; formal analysis, S.M.; investigation, D.F. and M.A.; resources, Y.A. and M.A.; data curation, D.F. and R.F.T.; writing—original draft preparation, S.M., A.J., Y.A. and M.A.; writing—review and editing, D.F. and A.J.; visualization, R.F.T. and F.M.B.; supervision, Y.A. and M.A.; project administration, Y.A.; funding acquisition, S.M., F.M.B. and A.J. All authors have read and agreed to the published version of the manuscript.

Funding

This project was funded by the Deanship of Scientific Research (DSR) at King Abdulaziz University, Jeddah (Grant No. RG-20-140-42). The authors gratefully acknowledge the DSR for technical and financial support. The DSR had no role in the design of the study, data collection, data analysis, interpretation of data, or writing of the article. Availability of data and materialsThe data sets used and/or analyzed during the current study are available from the corresponding author upon request.

Institutional Review Board Statement

This survey from the Department of Transport Technology and Economics at Budapest University of Technology and Economics is for a study on ‘An Integrated Fuzzy Analytic Hierarchy Process (AHP) model for studying the significant factors associated with frequent lane changing’. The principal intention of this work is to identify and rank the nominated significant factors and subfactors influencing lane changing based on participants answers on a specified questionnaire survey. This survey is for academic research only; it does not participate in any business activities and will not reveal any personal information. The questionnaire survey data were collected from professionals of the above-specified department on an online Google form. The motives/aims of the study were told to respondents with respect to the survey. They were also assured about of their anonymity and confidentiality in their responses. Their participation was absolutely voluntary, and they are not compensated.

Informed Consent Statement

Informed consent was obtained from all subjects involved in the study.

Data Availability Statement

All accompanying data are provided in the manuscript.

Acknowledgments

The authors acknowledge and appreciate the support of King Abdulaziz University (KAU) for supporting this study.

Conflicts of Interest

The authors declare no conflict of interest.

Appendix A. Sample Questionnaire Adopted for the Study

Entropy 24 00367 i001
Entropy 24 00367 i002

References

  1. Declaration, S. Third Global Ministerial Conference on Road Safety: Achieving Global Goals 2030. 2020. Available online: https://www.itf-oecd.org/3rd-global-ministerial-conference-road-safety-achieving-global-goals-2030 (accessed on 11 October 2021).
  2. Carson, J.; Adminaite-Fodor, D.; Jost, G. Ranking EU Progress on Road Safety: 14th Road Safety Performance Index Report. 2020. Available online: https://etsc.eu/wp-content/uploads/14-PIN-annual-report-FINAL.pdf (accessed on 10 December 2021).
  3. Janstrup, K.H. Road Safety Annual Report 2017. 2017. Available online: https://read.oecd-ilibrary.org/transport/road-safety-annual-report-2017_irtad-2017-en (accessed on 13 November 2021).
  4. Jamal, A.; Zahid, M.; Rahman, M.T.; Al-Ahmadi, H.M.; Almoshaogeh, M.; Farooq, D.; Ahmad, M. Injury Severity Prediction of Traffic Crashes with Ensemble Machine Learning Techniques: A Comparative Study. Int. J. Inj. Control Saf. Promot. 2021, 28, 408–427. [Google Scholar] [CrossRef]
  5. OECD/ITF. Road Safety Annual Report. 2016. Available online: https://www.itf-oecd.org/road-safety-annual-report-2016 (accessed on 5 January 2022).
  6. Wang, J.; Ding, J.-X.; Shi, Q.; Kühne, R.D. Lane-Changing Behavior and Its Effect on Energy Dissipation Using Full Velocity Difference Model. Int. J. Mod. Phys. C 2016, 27, 1650013. [Google Scholar] [CrossRef] [Green Version]
  7. Bernard, K. Group Accidents Nationwide Associated with Lane-Changing. 2017. Available online: https://www.4injured.com/blog/accidents-lane-changing-risks/ (accessed on 14 January 2022).
  8. Bernard, K. Accidents Nationwide Associated With Lane-Changing: Unsafe Car Lane Changing Accident Statistics. 2019. Available online: https://www.4injured.com/blog/accidents-lane-changing-risks/ (accessed on 18 January 2022).
  9. Shawky, M. Factors Affecting Lane Change Crashes. IATSS Res. 2020, 44, 155–161. [Google Scholar] [CrossRef]
  10. Kesting, A.; Treiber, M.; Helbing, D. General Lane-Changing Model MOBIL for Car-Following Models. Transp. Res. Rec. 2007, 1999, 86–94. [Google Scholar] [CrossRef] [Green Version]
  11. Wang, M.; Hoogendoorn, S.P.; Daamen, W.; van Arem, B.; Happee, R. Game Theoretic Approach for Predictive Lane-Changing and Car-Following Control. Transp. Res. Part C Emerg. Technol. 2015, 58, 73–92. [Google Scholar] [CrossRef]
  12. Wang, X.; Zhang, J.; Liu, Y.; Yunyun, W.; Wang, F.; Wang, J. The Drivers’ Lane Selection Model Based on Mixed Fuzzy Many-Person Multi-Objective Non-Cooperative Game. J. Intell. Fuzzy Syst. 2017, 32, 4235–4246. [Google Scholar] [CrossRef]
  13. Yu, H.; Tseng, H.E.; Langari, R. A Human-like Game Theory-Based Controller for Automatic Lane Changing. Transp. Res. Part C Emerg. Technol. 2018, 88, 140–158. [Google Scholar] [CrossRef]
  14. Li, K.; Wang, X.; Xu, Y.; Wang, J. Lane Changing Intention Recognition Based on Speech Recognition Models. Transp. Res. Part C Emerg. Technol. 2016, 69, 497–514. [Google Scholar] [CrossRef]
  15. Farooq, D.; Juhasz, J. Simulation-Based Analysis of the Effect of Significant Traffic Parameters on Lane Changing for Driving Logic “Cautious” on a Freeway. Sustainability 2019, 11, 5976. [Google Scholar] [CrossRef] [Green Version]
  16. Danish, F.; Juhasz, J. An Investigation of Speed Variance Effect on Lane-Changing for Driving Logic “Cautious” on Highways. Adv. Transp. Stud. Int. J. 2020, 51, 109–120. [Google Scholar]
  17. Li, A.; Sun, L.; Zhan, W.; Tomizuka, M. Multiple Criteria Decision-Making for Lane-Change Model. arXiv 2019, arXiv:1910.10142. [Google Scholar]
  18. Kahraman, C.; Kaya, İ.; Cebi, S. A Comparative Analysis for Multiattribute Selection among Renewable Energy Alternatives Using Fuzzy Axiomatic Design and Fuzzy Analytic Hierarchy Process. Energy 2009, 34, 1603–1616. [Google Scholar] [CrossRef]
  19. Wang, Y.; Yang, W.; Li, M.; Liu, X. Risk Assessment of Floor Water Inrush in Coal Mines Based on Secondary Fuzzy Comprehensive Evaluation. Int. J. Rock Mech. Min. Sci. 2012, 52, 50–55. [Google Scholar] [CrossRef]
  20. Farooq, D.; Moslem, S.; Duleba, S. Evaluation of Driver Behavior Criteria for Evolution of Sustainable Traffic Safety. Sustainability 2019, 11, 3142. [Google Scholar] [CrossRef] [Green Version]
  21. Tüysüz, F.; Kahraman, C. Project Risk Evaluation Using a Fuzzy Analytic Hierarchy Process: An Application to Information Technology Projects. Int. J. Intell. Syst. 2006, 21, 559–584. [Google Scholar] [CrossRef]
  22. Moslem, S.; Duleba, S. Sustainable Urban Transport Development by Applying a Fuzzy-AHP Model: A Case Study from Mersin, Turkey. Urban Sci. 2019, 3, 55. [Google Scholar] [CrossRef] [Green Version]
  23. Srisawat, P.; Kronprasert, N.; Arunotayanun, K. Development of Decision Support System for Evaluating Spatial Efficiency of Regional Transport Logistics. Transp. Res. Procedia 2017, 25, 4832–4851. [Google Scholar] [CrossRef]
  24. Nanda, S.; Singh, S. Evaluation of Factors Responsible for Road Accidents in India by Fuzzy AHP. In Networking Communication and Data Knowledge Engineering; Springer: Berlin/Heidelberg, Germany, 2018; pp. 179–188. [Google Scholar]
  25. Farooq, D.; Moslem, S. A Fuzzy Dynamical Approach for Examining Driver Behavior Criteria Related to Road Safety. In Proceedings of the 2019 Smart City Symposium Prague (SCSP), Prague, Czech Republic, 23–24 May 2019; pp. 1–7. [Google Scholar]
  26. Gul, M.; Guneri, A.F.; Nasirli, S.M. A Fuzzy-Based Model for Risk Assessment of Routes in Oil Transportation. Int. J. Environ. Sci. Technol. 2019, 16, 4671–4686. [Google Scholar] [CrossRef]
  27. Kanuganti, S.; Agarwala, R.; Dutta, B.; Bhanegaonkar, P.N.; Singh, A.P.; Sarkar, A.K. Road Safety Analysis Using Multi Criteria Approach: A Case Study in India. Transp. Res. Proc. 2017, 25, 4649–4661. [Google Scholar] [CrossRef]
  28. Pandian, P.; Sundaram, V.D.; Sivaprakasam, R. Development of Fuzzy Based Intelligent Decision Model to Optimize the Blind Spots in Heavy Transport Vehicles. Promet-Traffic Transp. 2016, 28, 1–10. [Google Scholar] [CrossRef] [Green Version]
  29. He, Y.; Du, S. Classification of Urban Emergency Based on Fuzzy Analytic Hierarchy Process. Procedia Eng. 2016, 137, 630–638. [Google Scholar] [CrossRef] [Green Version]
  30. Jamal, A.; Umer, W. Exploring the Injury Severity Risk Factors in Fatal Crashes with Neural Network. Int. J. Environ. Res. Public Health 2020, 17, 7466. [Google Scholar] [CrossRef] [PubMed]
  31. De Oña, J.; de Oña, R.; Eboli, L.; Forciniti, C.; Mazzulla, G. How to Identify the Key Factors That Affect Driver Perception of Accident Risk. A Comparison between Italian and Spanish Driver Behavior. Accid. Anal. Prev. 2014, 73, 225–235. [Google Scholar] [CrossRef]
  32. Bener, A.; Al Maadid, M.G.; Özkan, T.; Al-Bast, D.A.; Diyab, K.N.; Lajunen, T. The Impact of Four-Wheel Drive on Risky Driver Behaviours and Road Traffic Accidents. Transp. Res. Part F Traffic Psychol. Behav. 2008, 11, 324–333. [Google Scholar] [CrossRef]
  33. Moslem, S.; Farooq, D.; Karasan, A. Evaluating Driver Behavior Criteria Connected to Road Safety by Considering 2-Dimensional Uncertain Linguistic Data. In Proceedings of the International Conference on Intelligent and Fuzzy Systems, Istanbul, Turkey, 24–26 August 2021; Springer: Gewerbestrasse, Switzerland, 2021; pp. 388–399. [Google Scholar]
  34. Farooq, D.; Moslem, S.; Jamal, A.; Butt, F.M.; Almarhabi, Y.; Tufail, R.F.; Almoshaogeh, M. Assessment of Significant Factors Affecting Frequent Lane-Changing Related to Road Safety: An Integrated Approach of the AHP–BWM Model. Int. J. Environ. Res. Public Health 2021, 18, 10628. [Google Scholar] [CrossRef]
  35. Meesmann, U.; Torfs, K.; Nguyen, H.; Van den Berghe, W. Do We Care about Road Safety? Key Findings from the ESRA1 Project in 38 Countries. ESRA Project (European Survey of Road Users’ Safety Attitudes); Research Report Number 2018-R-02-EN; Vias Institute: Brussels, Belgium, 2018. [Google Scholar]
  36. Reason, J.T.; Manstead, A.S.R.; Stradling, S.; Baxter, J.; Campbell, K. Errors and violations on the roads. Ergonomics 1990, 33, 1315–1332. [Google Scholar] [CrossRef] [PubMed]
  37. Parker, D.; Reason, J.T.; Manstead, A.S.; Stradling, S.G. Driving Errors, Driving Violations and Accident Involvement. Ergonomics 1995, 38, 1036–1048. [Google Scholar] [CrossRef] [PubMed]
  38. Solomon, M. Groupthink versus The Wisdom of Crowds: The Social Epistemology of Deliberation and Dissent. South. J. Philos. 2006, 44, 28–42. [Google Scholar] [CrossRef]
  39. Lee, S.E.; Olsen, E.C.; Wierwille, W.W. A Comprehensive Examination of Naturalistic Lane-Changes; National Highway Traffic Safety Administration: Washington, DC, USA, 2004. [Google Scholar]
  40. Al-Ahmadi, H.M.; Jamal, A.; Reza, I.; Assi, K.J.; Ahmed, S.A. Using Microscopic Simulation-Based Analysis to Model Driving Behavior: A Case Study of Khobar-Dammam in Saudi Arabia. Sustainability 2019, 11, 3018. [Google Scholar] [CrossRef] [Green Version]
  41. Zeng, Q.; Sun, J.; Wen, H. Bayesian Hierarchical Modeling Monthly Crash Counts on Freeway Segments with Temporal Correlation. J. Adv. Transp. 2017, 2017, 5391054. [Google Scholar] [CrossRef] [Green Version]
  42. Wang, H.; Xu, S.; Deng, L. Automatic Lane-Changing Decision Based on Single-Step Dynamic Game with Incomplete Information and Collision-Free Path Planning. Actuators 2021, 10, 173. [Google Scholar] [CrossRef]
  43. Xu, C.; Wang, X.; Yang, H.; Xie, K.; Chen, X. Exploring the Impacts of Speed Variances on Safety Performance of Urban Elevated Expressways Using GPS Data. Accid. Anal. Prev. 2019, 123, 29–38. [Google Scholar] [CrossRef] [PubMed]
  44. Choudhary, P.; Imprialou, M.; Velaga, N.R.; Choudhary, A. Impacts of Speed Variations on Freeway Crashes by Severity and Vehicle Type. Accid. Anal. Prev. 2018, 121, 213–222. [Google Scholar] [CrossRef] [PubMed] [Green Version]
  45. Lemp, J.D.; Kockelman, K.M.; Unnikrishnan, A. Analysis of Large Truck Crash Severity Using Heteroskedastic Ordered Probit Models. Accid. Anal. Prev. 2011, 43, 370–380. [Google Scholar] [CrossRef] [Green Version]
  46. Bener, A.; Yildirim, E.; Özkan, T.; Lajunen, T. Driver Sleepiness, Fatigue, Careless Behavior and Risk of Motor Vehicle Crash and Injury: Population Based Case and Control Study. J. Traffic Transp. Eng. Engl. Ed. 2017, 4, 496–502. [Google Scholar] [CrossRef]
  47. Rahman, M.T.; Jamal, A.; Al-Ahmadi, H.M. Examining Hotspots of Traffic Collisions and Their Spatial Relationships with Land Use: A GIS-Based GeographicallyWeighted Regression Approach for Dammam, Saudi Arabia. ISPRS Int. J. Geo-Inf. 2020, 9, 540. [Google Scholar] [CrossRef]
  48. Sami, A.; Najafi, A.; Yamini, N.; Moafian, G.; Aghabeigi, M.R.; Lankarani, K.B.; Heydari, S.T. Educational Level and Age as Contributing Factors to Road Traffic Accidents. Chin. J. Traumatol. 2013, 16, 281–285. [Google Scholar]
  49. Zhang, G.; Yau, K.K.; Chen, G. Risk Factors Associated with Traffic Violations and Accident Severity in China. Accid. Anal. Prev. 2013, 59, 18–25. [Google Scholar] [CrossRef]
  50. Knoop, V.L.; Keyvan-Ekbatani, M.; de Baat, M.; Taale, H.; Hoogendoorn, S.P. Lane Change Behavior on Freeways: An Online Survey Using Video Clips. J. Adv. Transp. 2018, 2018, 9236028. [Google Scholar] [CrossRef] [Green Version]
  51. Casado-Sanz, N.; Guirao, B.; Attard, M. Analysis of the Risk Factors Affecting the Severity of Traffic Accidents on Spanish Crosstown Roads: The Driver’s Perspective. Sustainability 2020, 12, 2237. [Google Scholar] [CrossRef] [Green Version]
  52. Aydın, M.M.; Topal, A. Effects of Pavement Surface Deformations on Lane-Changing Behaviours. In Proceedings of the Institution of Civil Engineers–Transport; Thomas Telford Ltd.: London, UK, 2018; Volume 171, pp. 136–145. [Google Scholar]
  53. Tay, R.; Choi, J.; Kattan, L.; Khan, A. A Multinomial Logit Model of Pedestrian–Vehicle Crash Severity. Int. J. Sustain. Transp. 2011, 5, 233–249. [Google Scholar] [CrossRef]
  54. Mohamed, M.G.; Saunier, N.; Miranda-Moreno, L.F.; Ukkusuri, S.V. A Clustering Regression Approach: A Comprehensive Injury Severity Analysis of Pedestrian–Vehicle Crashes in New York, US and Montreal, Canada. Saf. Sci. 2013, 54, 27–37. [Google Scholar] [CrossRef] [Green Version]
  55. Wang, Y.Y.; Haque, M.D.; Chin, H.C.; Yun, J.G.J. Injury Severity of Pedestrian Crashes in Singapore. In Proceedings of the Australasian Transport Research Forum 2013; Australasian Transport Research Forum (ATRF): Brisbane, Australia, 2013; pp. 1–15. [Google Scholar]
  56. Karayalcin, I.I. The Analytic Hierarchy Process: Planning, Priority Setting, Resource Allocation; Thomas, L., Ed.; SAATY McGraw-Hill: New York, NY, USA, 1980. [Google Scholar]
  57. Rodriguez, R. Models, Methods, Concepts and Applications of the Analytic Hierarchy Process. Interfaces 2002, 32, 93. [Google Scholar]
  58. Subramanian, N.; Ramanathan, R. A Review of Applications of Analytic Hierarchy Process in Operations Management. Int. J. Prod. Econ. 2012, 138, 215–241. [Google Scholar] [CrossRef]
  59. Sahin, B.; Yip, T.L. Shipping Technology Selection for Dynamic Capability Based on Improved Gaussian Fuzzy AHP Model. Ocean Eng. 2017, 136, 233–242. [Google Scholar] [CrossRef]
  60. Radionovs, A.; Užga-Rebrovs, O. Fuzzy Analytical Hierarchy Process for Ecological Risk Assessment. Inf. Technol. Manag. Sci. 2016, 19, 16–22. [Google Scholar] [CrossRef] [Green Version]
  61. Broniewicz, E.; Ogrodnik, K. Multi-Criteria Analysis of Transport Infrastructure Projects. Transp. Res. Part D Transp. Environ. 2020, 83, 102351. [Google Scholar] [CrossRef]
  62. Zadeh, L.A. Fuzzy Sets. In Fuzzy Sets, Fuzzy Logic, and Fuzzy Systems: Selected Papers by Lotfi A Zadeh; World Scientific: Singapore, 1996; pp. 394–432. [Google Scholar]
  63. Seker, S.; Aydin, N. Sustainable Public Transportation System Evaluation: A Novel Two-Stage Hybrid Method Based on IVIF-AHP and CODAS. Int. J. Fuzzy Syst. 2020, 22, 257–272. [Google Scholar] [CrossRef]
  64. Sun, C.-C. A Performance Evaluation Model by Integrating Fuzzy AHP and Fuzzy TOPSIS Methods. Expert Syst. Appl. 2010, 37, 7745–7754. [Google Scholar] [CrossRef]
  65. Gumus, A.T. Evaluation of Hazardous Waste Transportation Firms by Using a Two Step Fuzzy-AHP and TOPSIS Methodology. Expert Syst. Appl. 2009, 36, 4067–4074. [Google Scholar] [CrossRef]
  66. Laarhoven, V.; Pedrycz, W. A Fuzzy Extention of Saaty′ s Priority Theory. Fuzzy Sets and Systems. Fuzzy Sets Syst. 1983, 11, 229–241. [Google Scholar] [CrossRef]
  67. Chang, D.-Y. Applications of the Extent Analysis Method on Fuzzy AHP. Eur. J. Oper. Res. 1996, 95, 649–655. [Google Scholar] [CrossRef]
  68. Toth, W.; Vacik, H. A comprehensive uncertainty analysis of the analytic hierarchy process methodology applied in the context of environmental decision making. J. Multi Criteria Decis. Anal. 2018, 25, 142–161. [Google Scholar] [CrossRef]
  69. Moridpour, S.; Rose, G.; Sarvi, M. Effect of Surrounding Traffic Characteristics on Lane Changing Behavior. J. Transp. Eng. 2010, 136, 973–985. [Google Scholar] [CrossRef]
  70. Bella, F. How Traffic Conditions Affect Driver Behavior in Passing Maneuver. Adv. Transp. Stud. 2011. Available online: http://www.atsinternationaljournal.com/index.php/2011-issues/special-issue-2011/701-how-traffic-conditions-affect-driver-behavior-in-passing-maneuver (accessed on 20 December 2021).
  71. Li, X.; Sun, J.-Q. Studies of Vehicle Lane-Changing Dynamics and Its Effect on Traffic Efficiency, Safety and Environmental Impact. Phys. A Stat. Mech. Its Appl. 2017, 467, 41–58. [Google Scholar] [CrossRef]
  72. Mizanur, R.M.; Nakamura, F. A study on passing-overtaking characteristics and level of service of heterogeneous traffic flow. J. East. Asia Soc. Transp. Stud. 2005, 6, 1471–1483. [Google Scholar]
  73. Albert, G.; Musicant, O.; Oppenheim, I.; Lotan, T. Which Smartphone’s Apps May Contribute to Road Safety? An AHP Model to Evaluate Experts’ Opinions. Transp. Policy 2016, 50, 54–62. [Google Scholar] [CrossRef]
  74. Luo, Q.; Zang, X.; Cai, X.; Gong, H.; Yuan, J.; Yang, J. Vehicle Lane-Changing Safety Pre-Warning Model under the Environment of the Vehicle Networking. Sustainability 2021, 13, 5146. [Google Scholar] [CrossRef]
  75. Hao, W.; Zhang, Z.; Gao, Z.; Yi, K.; Liu, L.; Wang, J. Research on Mandatory Lane-Changing Behavior in Highway Weaving Sections. J. Adv. Transp. 2020, 2020, 3754062. [Google Scholar] [CrossRef]
  76. Farooq, D.; Juhasz. J. Statistical Evaluation of Risky Driver Behavior Factors that Influence Road Safety based on Drivers Age and Driving Experience in Budapest and Islamabad. Eur. Transp. Trasp. Eur. 2020, 2, 1–8. [Google Scholar] [CrossRef]
  77. Jamal, A.; Rahman, M.T.; Al-Ahmadi, H.M.; Mansoor, U. The Dilemma of Road Safety in the Eastern Province of Saudi Arabia: Consequences and Prevention Strategies. Int. J. Environ. Res. Public Health 2020, 17, 157. [Google Scholar] [CrossRef] [PubMed] [Green Version]
  78. Ijaz, M.; Lan, L.; Usman, S.M.; Zahid, M.; Jamal, A. Investigation of factors influencing motorcyclist injury severity using random parameters logit model with heterogeneity in means and variances. Int. J. Crashworth. 2021, 11, 1–11. [Google Scholar] [CrossRef]
  79. Almoshaogeh, M.; Abdulrehman, R.; Haider, H.; Alharbi, F.; Jamal, A.; Alarifi, S.; Shafiquzzaman, M. Traffic Accident Risk Assessment Framework for Qassim, Saudi Arabia: Evaluating the Impact of Speed Cameras. Appl. Sci. 2021, 11, 6682. [Google Scholar] [CrossRef]
Figure 1. Lane change factorial model [34].
Entropy 24 00367 g001
Figure 2. The membership functions of triangular fuzzy numbers. Reprinted with permission from Ref. [64]. Copyright (2021), Elsevier Ltd.
Entropy 24 00367 g002
Figure 3. The main step of conducting AHP in Fuzzy light conditions.
Entropy 24 00367 g003
Table 1. Summary of Fuzzy AHP applications in road transport-related studies.
Authors (Year of Publication)Applications
Srisawat et al., 2017 [23] Estimate the quality of transport logistics on a regional scale
Nanda and Singh, 2018 [24]Evaluate the factors of road incidents
Danish Farooq and Sarbast Moslem, 2019 [25]Estimated the significant driver behavior factors affecting the highway safety in the context of the city of Budapest, Hungary
M. Gul et al., 2018 [26]The authors presented a risk assessment model based on FAHP for means in hazardous substance transportation
Shalini Kanuganti et al., 2016 [27]Investigate the ranking of safety essentials of a particular group of rural roads
Pandian et al., 2016 [28]Presented a model to optimize/minimize blind areas/spots for heavy transport vehicles
Yaqin He and Shengpin Du, 2016 [29]A quantitative model of emergency categorization offered by focusing traffic guarantee power during the collision
Table 2. Descriptive statistics of study participants.
Variable DescriptionFrequencyPercentage (%)
Number (N)70100
Age (years)
18–301420
31–503448.5
51 above2231.5
Gender
male6390
female0710
Duration of driving license (years)
1–51115.71
6–153752.85
16–252231.42
Education
Bachelor’s degree3347.14
MSC/PhD3752.86
Table 3. An Example of Questionnaire survey for level 1.
Comparing the Selected Factors Importance in Response to Rrequent Lane-Changing
Traffic CharacteristicsHuman AttributesRoad CharacteristicsLight Conditions
Traffic characteristics(1, 1, 1)(2, 3, 4)(4, 5, 6)(6, 7, 8)
Human (1/2, 1/3, 1/4)(1, 1, 1)(6, 7, 8)(4, 5, 6)
Road characteristics(1/4, 1/5, 1/6)(1/6, 1/7, 1/8)(1, 1, 1)(6, 7, 8)
Light conditions(1/6, 1/7, 1/8)(1/4, 1/5, 1/6)(1/6, 1/7, 1/8)(1, 1, 1)
Table 4. Importance of specified factors in related traffic safety studies.
Main FactorSub-FactorExplanation and Related Reference
Traffic Characteristics
(F1)
Traffic Volume (F1.1)Traffic volumes were identified as the highly significant factors for modeling the driving behavior [40]
Traffic Composition (F1.2)Traffic composition has statistically
major impacts on collision occurrence [41]
Following Distance (F1.3)To ensure the safety distance for lane changing, a safe car-following
distance should be reserved [42].
Speed (F1.4)High-speeds variations within the same lane
characterize situations with decline levels of service (LOS) and consequently unstable flow. These situations can cause greater accident risk [43]
Vehicle Type (F1.5)Vehicle type has been utilized in numerous traffic crash studies [44,45]
Human
(F2)
Carelessness (F2.1)Previous studies confirmed that drivers with careless driver behavior might considerably raise the risk of traffic collisions [46,47]
Illiteracy (F2.2)The study results revealed that most casualties in traffic collisions were illiterates for different age groups [48]
Violation of Traffic Rules (F2.3)Traffic violations were noted to be the leading risks threatening road safety [49]
Training (F2.4)Driving behavior is affected by training, experience, and personal characteristics [50]
Road Characteristics
(F3)
Road Type (F3.1)A previous study analyzed the relationship between type of road infrastructure and crash involvement [51]
Road Surface (F3.2)Previous study analysis indicated that deformations on pavement surface have a positive impact on lane-changing [52]
Grade (F3.3)Road safety problems may appear due to upgrade or downgrade sections [51]
Light conditions
(F4)
Daytime light (F4.1)Dark lighting conditions are more likely to lead to fatal or severe injury crashes compared with daylight [53,54,55]
Table 5. Random Index values based on matrix size.
nRI
10
20
30.58
40.9
51.12
61.24
71.32
81.41
Table 6. Membership function of linguistic scale [65].
Linguistic Scale of Fuzzy Number
Extremely important(8, 9, 10)
Very strong important(6, 7, 8)
Important(4, 5, 6)
Moderately important(2, 3, 4)
Equally important(1, 1, 1)
Intermediate values(7, 8, 9), (5, 6, 7), (3, 4, 5), (1, 2, 3)
Table 7. Factor weight scores affecting frequent lane changing based on expert drivers’ responses based on the Fuzzy AHP model.
Level 1Level 2
Main FactorWeightSub-FactorWeight
Traffic Characteristics0.5404Traffic Volume0.4071
Traffic Composition0.1285
Following Distance0.1565
Speed0.3209
Vehicle Type0.1150
Human0.2232Carelessness0.2585
Illiteracy0.1084
Violation of Rules0.3989
Training0.2748
Road Characteristics0.1847Road Type0.6215
Road Surface0.2280
Grade0.1904
Light conditions0.0882Daytime light0.8193
Night Light0.1807
Table 8. The final weight scores for the main factors in the first level.
FactorWeightRank
Traffic Characteristics0.54041
Human0.22322
Road Characteristics0.18473
Light conditions0.08824
Table 9. The final weight scores for subfactors in the second level.
FactorLocal WeightFinal WeightRank
Traffic Volume0.40710.22001
Traffic Composition0.12850.06948
Following Distance0.15650.08465
Speed0.32090.17342
Vehicle Type0.14080.07616
Carelessness0.25850.057710
Illiteracy0.10840.024213
Violation of Rules0.39890.08904
Training0.27480.06149
Road Type0.62150.11483
Road Surface0.22800.042111
Grade0.19040.035212
Daytime light0.81930.07237
Night Light0.18070.015914
Table 10. The final weight scores for main factors in the first level after sensitivity analysis.
FactorWeightWeight after the Sensitivity Analysis Rank
Traffic Characteristics0.54040.55001
Human0.22320.21002
Road Characteristics0.18470.17003
Light conditions0.08820.07004
Table 11. The final weight scores for main factors in the second level after sensitivity analysis.
FactorLocal WeightFinal WeightNew Rank
Traffic Volume0.40710.2239051
Traffic Composition0.12850.0706757
Following Distance0.15650.0860754
Speed0.32090.1764952
Vehicle Type0.14080.077446
Carelessness0.25850.05428510
Illiteracy0.10840.02276413
Violation of Rules0.39890.0837695
Training0.27480.0577088
Road Type0.62150.1056553
Road Surface0.22800.0387611
Grade0.19040.03236812
Daytime light0.81930.0573519
Night Light0.18070.01264914
Publisher’s Note: MDPI stays neutral with regard to jurisdictional claims in published maps and institutional affiliations.

