Article

A Bayesian Approach to Predict Football Matches with Changed Home Advantage in Spectator-Free Matches after the COVID-19 Break

Department of Industrial Engineering, Sungkyunkwan University, Suwon 16419, Korea
*
Author to whom correspondence should be addressed.
These authors contributed equally to this work.
Entropy 2022, 24(3), 366; https://doi.org/10.3390/e24030366
Submission received: 9 January 2022 / Revised: 21 February 2022 / Accepted: 2 March 2022 / Published: 4 March 2022
(This article belongs to the Special Issue Data Analytics in Sports Sciences: Changing the Game)

Abstract

:
Since the coronavirus disease 2019 (COVID-19) pandemic, most professional sports events have been held without spectators. It is generally believed that home teams deprived of enthusiastic support from their home fans experience reduced benefits of playing on their home fields, thus becoming less likely to win. This study attempts to confirm if this belief is true in four major European football leagues through statistical analysis. This study proposes a Bayesian hierarchical Poisson model to estimate parameters reflecting the home advantage and the change in such advantage. These parameters are used to improve the performance of machine-learning-based prediction models for football matches played after the COVID-19 break. The study describes the statistical analysis on the impact of the COVID-19 pandemic on football match results in terms of the expected score and goal difference. It also shows that estimated parameters from the proposed model reflect the changed home advantage. Finally, the study verifies that these parameters, when included as additional features, enhance the performance of various football match prediction models. The home advantage in European football matches has changed because of the behind-closed-doors policy implemented due to the COVID-19 pandemic. Using parameters reflecting the pandemic’s impact, it is possible to predict more precise results of spectator-free matches after the COVID-19 break.

1. Introduction

The coronavirus disease 2019 (COVID-19) pandemic began spreading globally by the end of 2019. Sports were no exception. Four major European football leagues (Premier League, LaLiga, Serie A, and Bundesliga) went on a few months’ break after the pandemic’s outbreak, later resuming with matches played behind closed doors [1]. In the home-and-away system of professional football matches, the home team is usually believed to have a “home advantage” when playing on their ground—thanks to the enthusiastic support of a large number of home spectators—such that the home team wins relatively more at home on average. However, the home team no longer receives such enthusiastic support from home supporters because of the COVID-19 pandemic, which could reduce the benefits of existing home teams. For example, a team manager in the English Premier League once said that the opponent’s stadium is intimidating only if it is full of a crowd [2]. Experts and media frequently propose the hypothesis that the absence of spectators since the COVID-19 pandemic could affect the teams’ home advantage.
Sports match prediction is a huge business market in the modern society. Football, one of the most popular sports in the world, boasts its success because of large capital investment; the estimated market size of European football reached EUR 28.9 billion in 2019 [3]. This leads to the subsequent bloom of the neighboring industry of match prediction and gambling. The size of the global online gambling market reached USD 53.7 billion in 2019 [4]. As the market becomes more capital-intensive, sports consumers start asking for a systematic and rational decision-making process to support their investment of a large sum of money. Ever since the COVID-19 pandemic, there has been a growing need for robust match prediction models that reflect systematic changes in the COVID-19 era.
In terms of related studies, several researchers focused on identifying the presence of home advantage [5,6,7,8] and its disappearance during the COVID-19 break [9,10,11,12,13,14,15,16]. However, their findings did not consider the emerging interests in the match prediction model, that is, changes caused by the COVID-19 pandemic. Many studies have also been conducted on football match prediction using stochastic models [17], machine learning techniques [18,19,20], and domain knowledge of football [21,22]. Recently, a study attempted to predict the outcomes of football matches after the COVID-19 break [23]. Although the impact of COVID-19 was considered in this study, quantitative analyses for the changed home advantage were not performed. Unlike the previous works, we propose to quantify the changed home advantage after the COVID-19 break, and take it into account to build match result prediction models. That is, we use a Bayesian hierarchical Poisson model embedded with the COVID-19 effect to sample the right parameters for the prediction model. Next, we show an improvement in the model accuracy when using parameters sampled across multiple machine learning models.
This study assumes that professional football leagues have experienced diminished home advantage due to behind-closed-doors matches since the COVID-19 pandemic. Considering four major European football leagues, the study confirms a statistical decrease in home advantage by observing changes in the expected points and number of goals scored by the home team. With the model parameters sampled via the Bayesian framework, the study justifies its match prediction model by showing an improvement in accuracy when the systematic change in home advantage is reflected. Accordingly, this study presents to the academic society a comprehensive model reflecting the systematic changes occurring during the COVID-19 break.

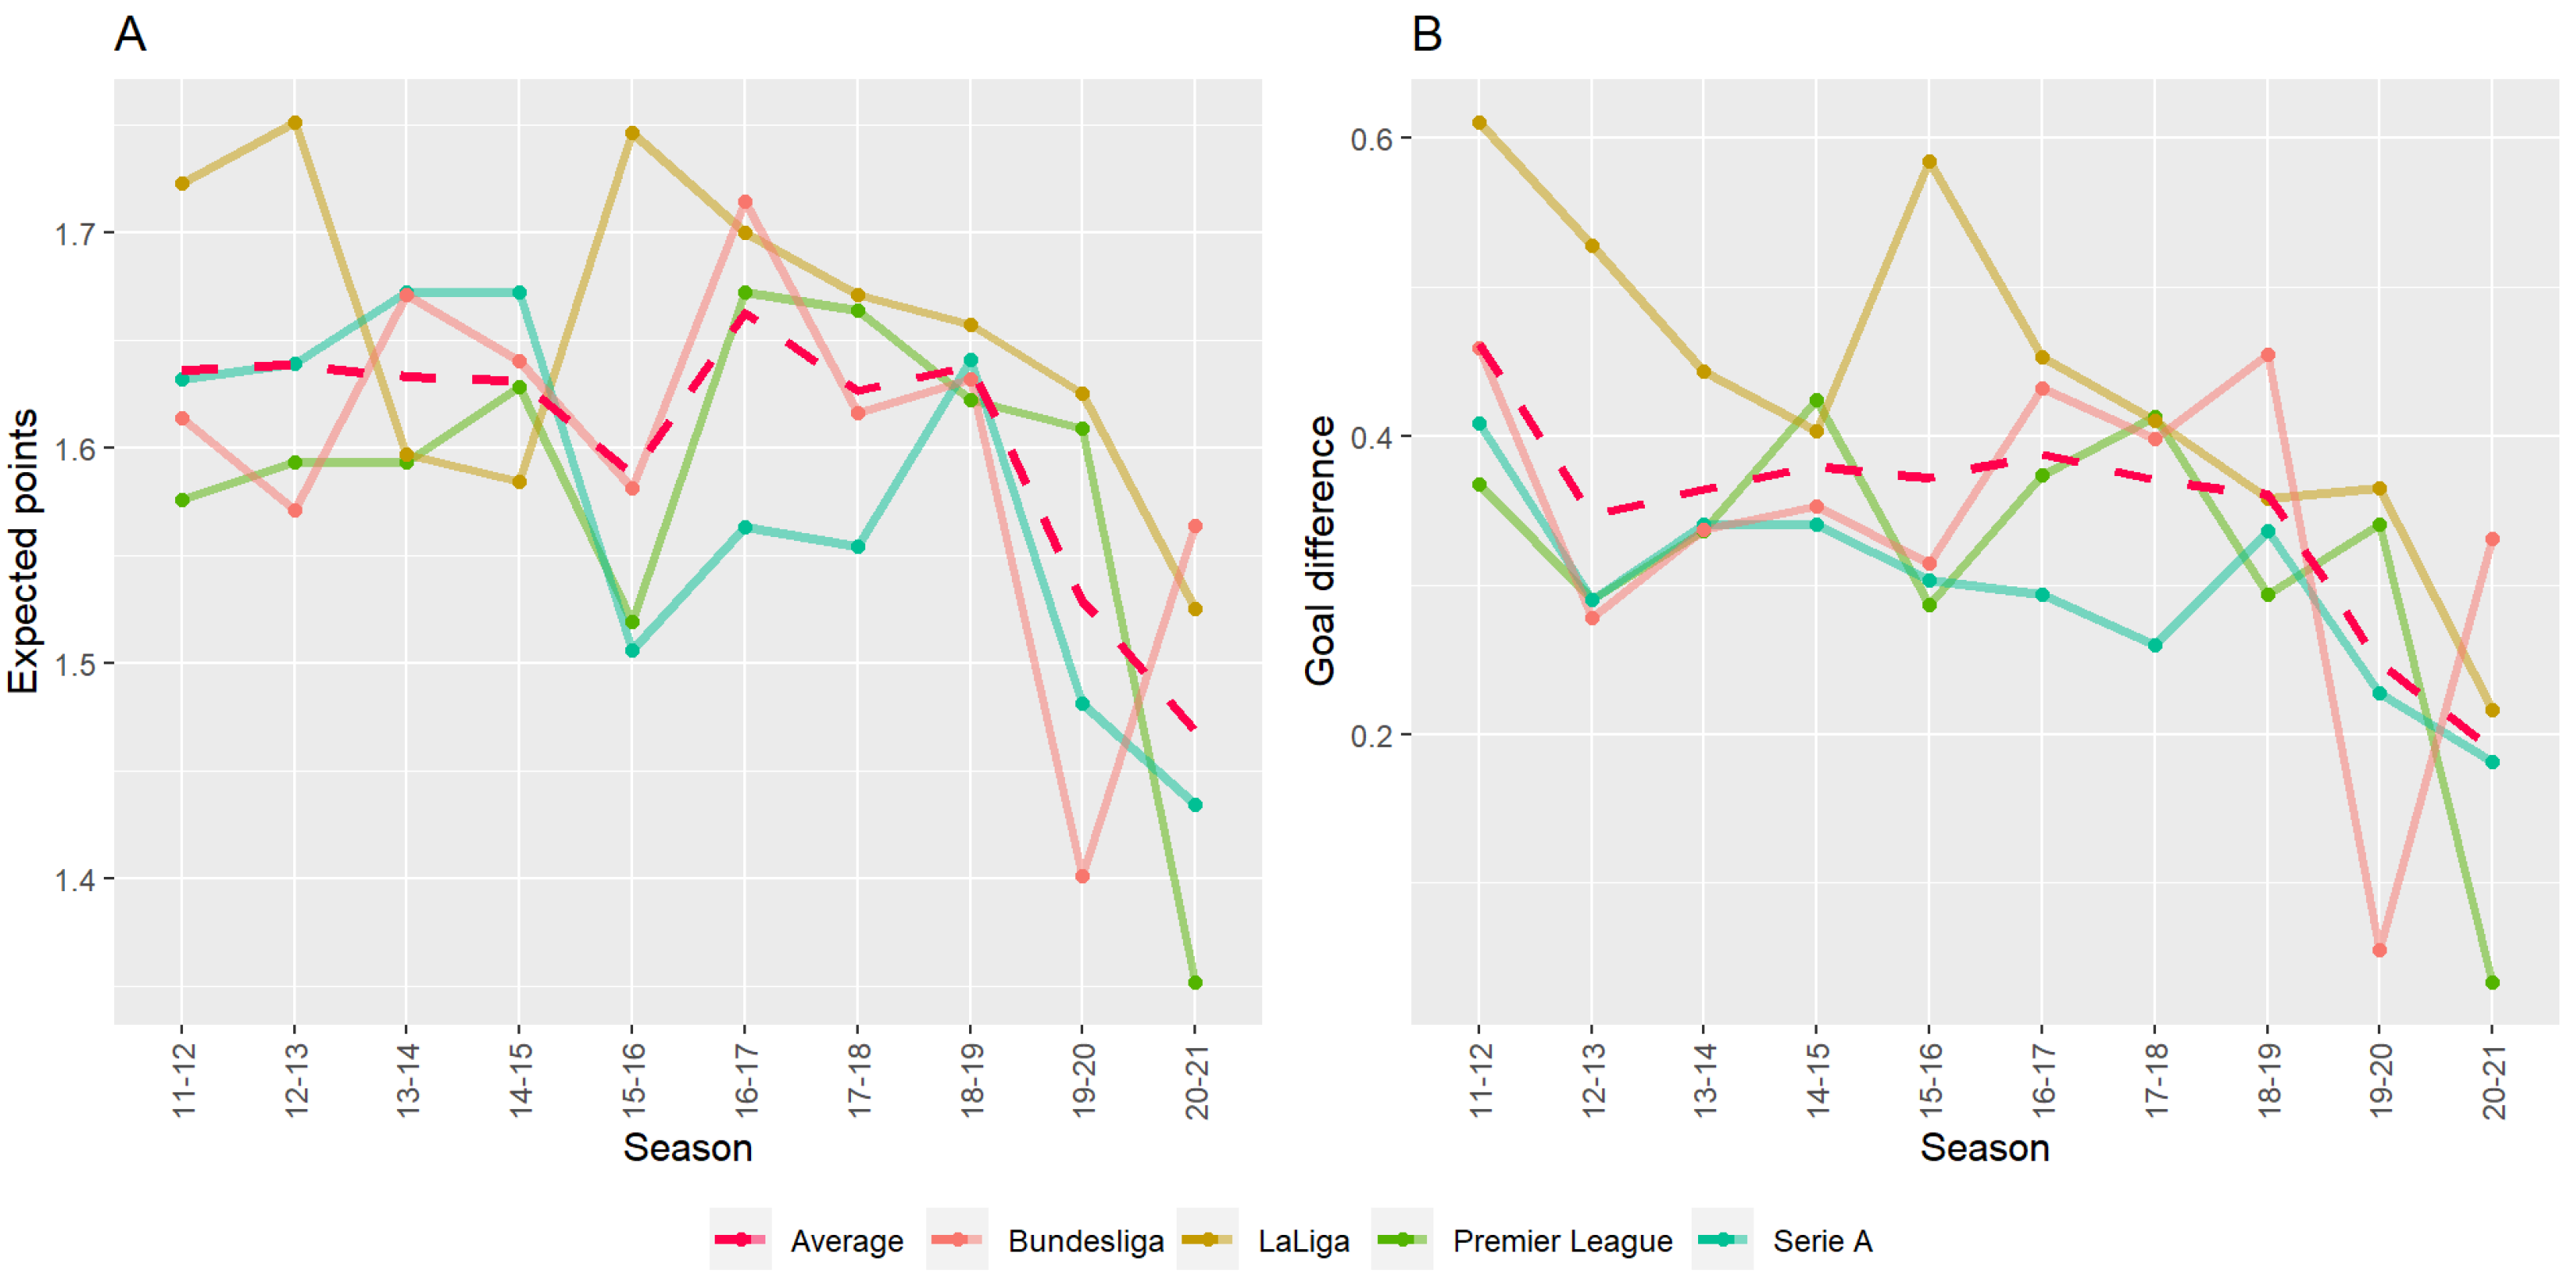
2. Statistical Analysis

After the COVID-19 outbreak, a question has been continuously raised by the media and articles: does the home advantage decrease due to the lack of cheering from home supporters? Previous studies have performed statistical analyses on the mean, variance, and normality to determine the differences in home advantage in sports because of COVID-19 [24,25]. To verify the hypothesis of a reduced home advantage since the COVID-19 pandemic, we performed the following statistical analyses. First, we performed Welch’s unequal variances t-test [26] to see whether the home team’s match results changed during the COVID-19 break. Table 1 shows the t-test results performed on the expected points (average points a team is expected to earn on their home field) and the goal difference (goals scored by the home team minus goals scored by the away team), both averaged per league and per season. The test results show that mean values of the expected points and goal difference changed over the COVID-19 break.
Next, we visualized these quantified measures (expected points and goal difference) to determine how an unattended home match affects the match result of the home team. Figure 1 shows trends of the expected points and goal difference of the home team for each season in four major European football leagues. One can see that the expected points and the goal difference of the home team have dropped noticeably since the 2019–2020 season on average, as indicated by the red dashed line. We argue that the effect of limited spectator attendance is reflected in these two quantified measures two to three months after the COVID-19 break.
The drop in expected points is detrimental to professional football teams. The expected points for the home team were approximately 1.6 points per match before the COVID-19 break, dropping to 1.5 points after the break. Considering that every team gets to play 17 or 19 home matches per season, the drop means that each team should expect to obtain approximately two points fewer every season after the break. Further, since each league competes fiercely for one or two points for the championship or relegation zone, a difference of two points in the expected points per season has a very large impact.
We then investigated the reason for the drop in the goal difference. Regardless of how a team plays in a match, the number of goals scored is ultimately the key factor for winning or losing. Table 1 and Figure 1 show that there was a drop in goal difference over the COVID-19 break, meaning that the lack of home supporters affected the goal difference negatively. Although the (borderline) significant test results have a very large effect size (Cohen’s d [27]), Welch’s unequal variances t-test does not indicate what has caused a drop in goal difference. Therefore, we considered a hierarchy of parameters to determine hyperparameters that influence the number of goals scored by both the home and away teams in each match. Such a hierarchical model will play a major role in improving the accuracy of the football match prediction model in the post-COVID-19 era. We assumed that goals in a football match follow a Poisson distribution and considered the Bayesian hierarchical Poisson model to sample and estimate parameters in the Bayesian framework. We further proposed a Bayesian hierarchical Poisson model to predict the number of goals scored in each match.

3. Proposed Method

3.1. Bayesian Hierarchical Poisson Model

The number of goals scored in a football match follows a Poisson distribution [28]. Accordingly, Poisson regression models with various Bayesian approaches have been used to analyze football matches. There are multiple studies using a Bayesian Poisson regression model to predict football match results [15,17,29]. However, the regression model has the limitation that it is not capable of explaining serial changes in input factors. To address this issue, several studies proposed to use the Bayesian hierarchical Poisson model that can incorporate time-course factors into the model [30,31,32]. Baath also used this model to utilize team skill changes over seasons by hierarchically connecting the current team skill to that of the previous season [32]. Based on the idea that a seasonal change can be incorporated into a prediction model, this research presents a Bayesian hierarchical Poisson model with consideration of the home advantage change due to the COVID-19 break. We certainly include the other factors, such as team skill, in our prediction model.

3.1.1. Model Structure

We propose a Bayesian hierarchical Poisson model to estimate the number of goals scored. The model structure is described as follows. We assume that the number of goals, GOAL home and GOAL away , follow the Poisson distributions. Let i denote the home team, j the away team, s the season, λ home , i , j , s the Poisson parameter of the home team during season s, and λ away , i , j , s the Poisson parameter of the away team during season s. Next, the number of goals scored by the home and away teams, GOAL home and GOAL away , are defined by the following Equations (1) and (2):
GOAL home Pois ( λ home , i , j , s ) ,
GOAL away Pois ( λ away , i , j , s ) .
The Poisson parameters, λ home , i , j , s and λ away , i , j , s , are defined as the product of the performance difference between the two teams and other factors.
Let SKILL i denote the home team performance, SKILL j the away team performance, OTHERS home , s the other factors of the home team, and OTHERS away , s the other factors of the away team during season s . Next, the number of goals scored by the home and away teams, λ home , i , j and λ away , i , j , are defined by the following logarithmic Poisson link function Equations (3) and (4):
log ( λ home , i , j , s ) = OTHERS home , s + SKILL i , s SKILL j , s ,
log ( λ away , i , j , s ) = OTHERS away , s SKILL i , s + SKILL j , s .
Note that parameter OTHERS is included in the Bayesian hierarchical Poisson model to capture all other external factors that influence the number of goals scored in addition to the team performance, such as the presence of supporters in the stadium. Unlike SKILL i , s , OTHERS home , s and OTHERS away , s are configured independently for each season to capture other variable factors affecting the number of goals scored.
The parameter for team performance, SKILL i , s , is defined as the realization of the normal distribution. Let SKILL i , s denote the team performance of team i during season s. Next, the team performance in each match is defined as a sample from the team performance distribution of the last season using Equation (5).
SKILL i , s N ( SKILL i , s 1 , σ seasons 2 ) .
Note that parameter SKILL i , s follows a normal distribution with its mean set as the team performance of the previous season, SKILL i , s 1 , and its standard deviation is set to σ seasons . Naturally, the team performance varies by season due to events in the team roster, such as transfers and injuries, but the change is usually not drastic. Thus, the model assumes that the team performance of a season is affected by the previous season, with equal variation throughout all seasons.

3.1.2. Model Fitting

We used an open-source Bayesian analysis framework program, JAGS [33] (version 4.3.0), to fit the prediction model above. Specifically, we used RJAGS [34] (version 4.10), which was implemented using the statistical analysis program R [35] (version 4.0.5). The program performs Gibbs sampling [36] to estimate parameters of the aforementioned Bayesian hierarchical Poisson model [32]. To prevent prior knowledge from entering the model parameter estimation, the prior distributions of the parameters are set to relatively non-informative priors (normal or uniform) according to Equations (6)–(10):
OTHERS N ( 0 , 4 2 ) ,
SKILL i , 1 st _ season N ( μ teams , σ teams 2 ) ,
μ teams N ( 0 , 4 2 ) ,
σ teams U ( 0 , 3 ) ,
σ seasons U ( 0 , 3 ) .
Given that the average number of goals per match by a team is fewer than two in European football leagues [37], we believe that this setting is non-informative enough for our study.

3.2. Home Advantage

Home advantage is the value of interest in this research, and shows how the external factors of home and away affect the match result. Accordingly, we define HA s as the home advantage of a home team against an away team during season s. We calculate HA s based on primarily sampled parameters (SKILL and OTHERS ), assuming that the home advantage is commonly shared among teams within the same league. Mathematically, home advantage can be understood as the difference in other external factors between the home and away teams. As the situation changes over time, external factors can differ by season. Thus, parameter HA s can be quantified as the home advantage in a particular season s using Equation (11).
HA s = exp ( OTHERS home , s ) exp ( OTHERS away , s )
We can notice from Equations (3) and (4) that Equation (11) holds under the assumption that home and away teams have the same ability. Therefore, HA s is determined by the difference between the Poisson parameters, as shown in Equation (12).
HA s = λ home , s λ away , s
In addition, the difference in the average number of goals scored varies depending on whether it is a home or away match. This value quantifies the home advantage that varies seasonally due to COVID-19 and other factors.

3.3. Additional Features for Prediction

We propose a football match prediction model using the parameters obtained from Bayesian hierarchical Poisson model-like features. In the existing football match prediction machine learning models, the statistics (e.g., win, draw, loss, point, goals for, goals against) are used as features. Such cumulative statistics provide only a limited amount of information about the difference between team performance and the change in match pattern since the COVID-19 pandemic. Subsequently, it is very hard to obtain a high accuracy of match prediction. Therefore, we want to improve the match prediction accuracy of machine learning models by using the home advantage and each team’s SKILL parameter as additional features obtained from the proposed model. Section 4.4 describes the advantages of this approach.

4. Experiments

In this section, we visualize the distribution of parameters (e.g., SKILL and HA ) obtained from the aforementioned Bayesian hierarchical Poisson model, and we use these parameters to show score prediction and match prediction results. We also use the parameters we obtain as additional features for machine learning models in football match prediction to see how their performance can be improved.

4.1. Dataset

We used league data of four major European football leagues (Premier League, LaLiga, Serie A, and Bundesliga) for the most recent seasons (2011–2012 to 2020–2021). Notice that we consider ‘home’ and ’away’ only for each of the features, and exclude ’neutral venue’. A neutral venue is rarely used to play a game in the European football leagues [38], which means that the amount of data for ’neutral’ was not enough to estimate the parameters. All the data are used for visualization in Section 4.2. In contrast, we divided the data into training and test sets for the post-match results prediction models in Section 4.3 and Section 4.4. The training set comprised nine seasons before the COVID-19 break, and the test set consisted of the 2020–2021 season, when most matches were played behind closed doors due to the COVID-19 pandemic. Parameters SKILL and HA after the COVID-19 break were sampled with 400 matches of the 2019–2020 season after the COVID-19 break, and so information of the test sets is not included in the post-match prediction model.

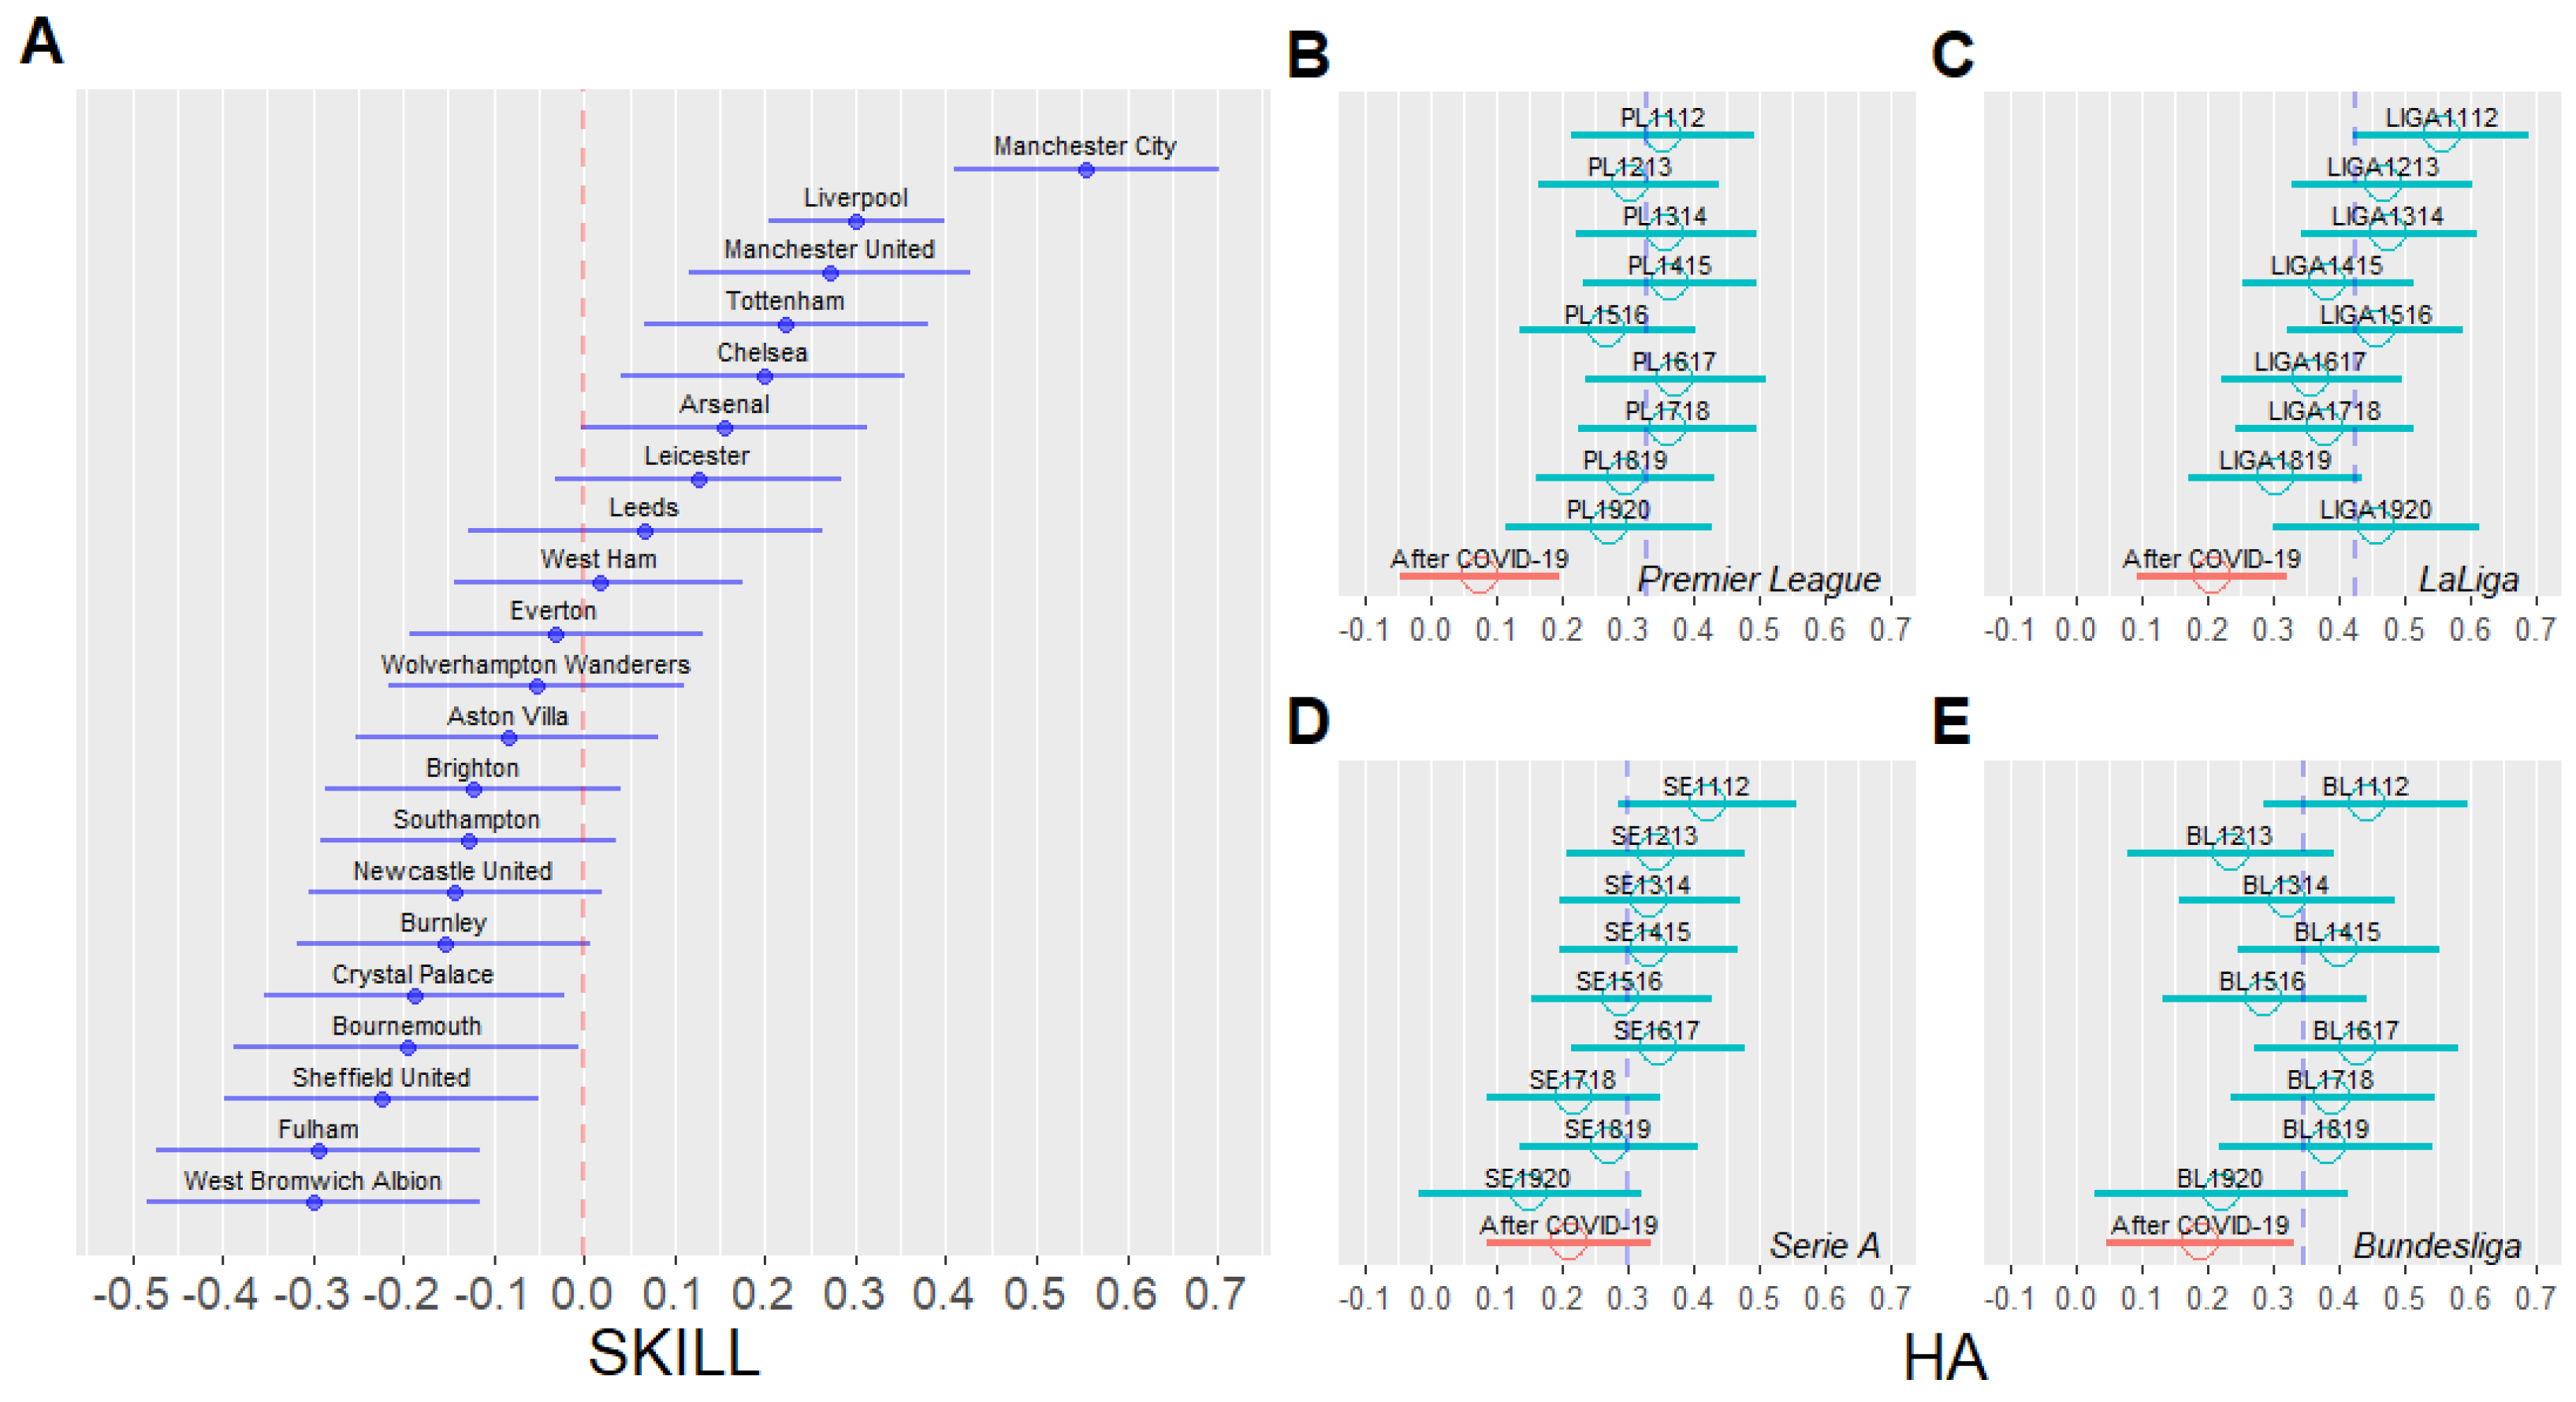
4.2. Visualization of Parameters

Using the Bayesian hierarchical Poisson model presented in Section 3, we sampled SKILL per season and team and sampled HA for seasons before and after COVID-19 breaks. A total of 100,000 samples were sampled, each using Markov chain Monte Carlo [39,40] sampling, of which, the first 10,000 samples were burned in.
Figure 2A represents the distribution of SKILL in the English Premier League after the COVID-19 break: the larger the SKILL parameter, the more to the right it appears. Parameter SKILL is an indicator of a team’s ability to control goals scored/conceded and can be understood as that team’s performance. For instance, the most powerful team in the English Premier League after the COVID-19 break is Manchester City.
Figure 2B is a visualization of the distribution of HA , as defined in Section 3. Here, “After COVID-19” represents the collection of matches after the hiatuses of four major European leagues in March 2020 due to the COVID-19 pandemic. In all four leagues, the mean values of HA in matches after the COVID-19 break were lower than those of the other nine seasons before the COVID-19 break.
The mean value of HA in all matches in four European leagues from the 2011–2012 season to the season immediately before the COVID-19 break was 0.35. The mean value of HA after the COVID-19 break was 0.17. We observed that HA after the COVID-19 break was 0.18, lower on average compared with the other seasons before the COVID-19 break. In other words, the number of goals scored by the home team decreased by an average of 0.18 goals, while considering the performance gap between the teams. This shows that COVID-19 negatively affected the home advantage for all four major European football leagues.

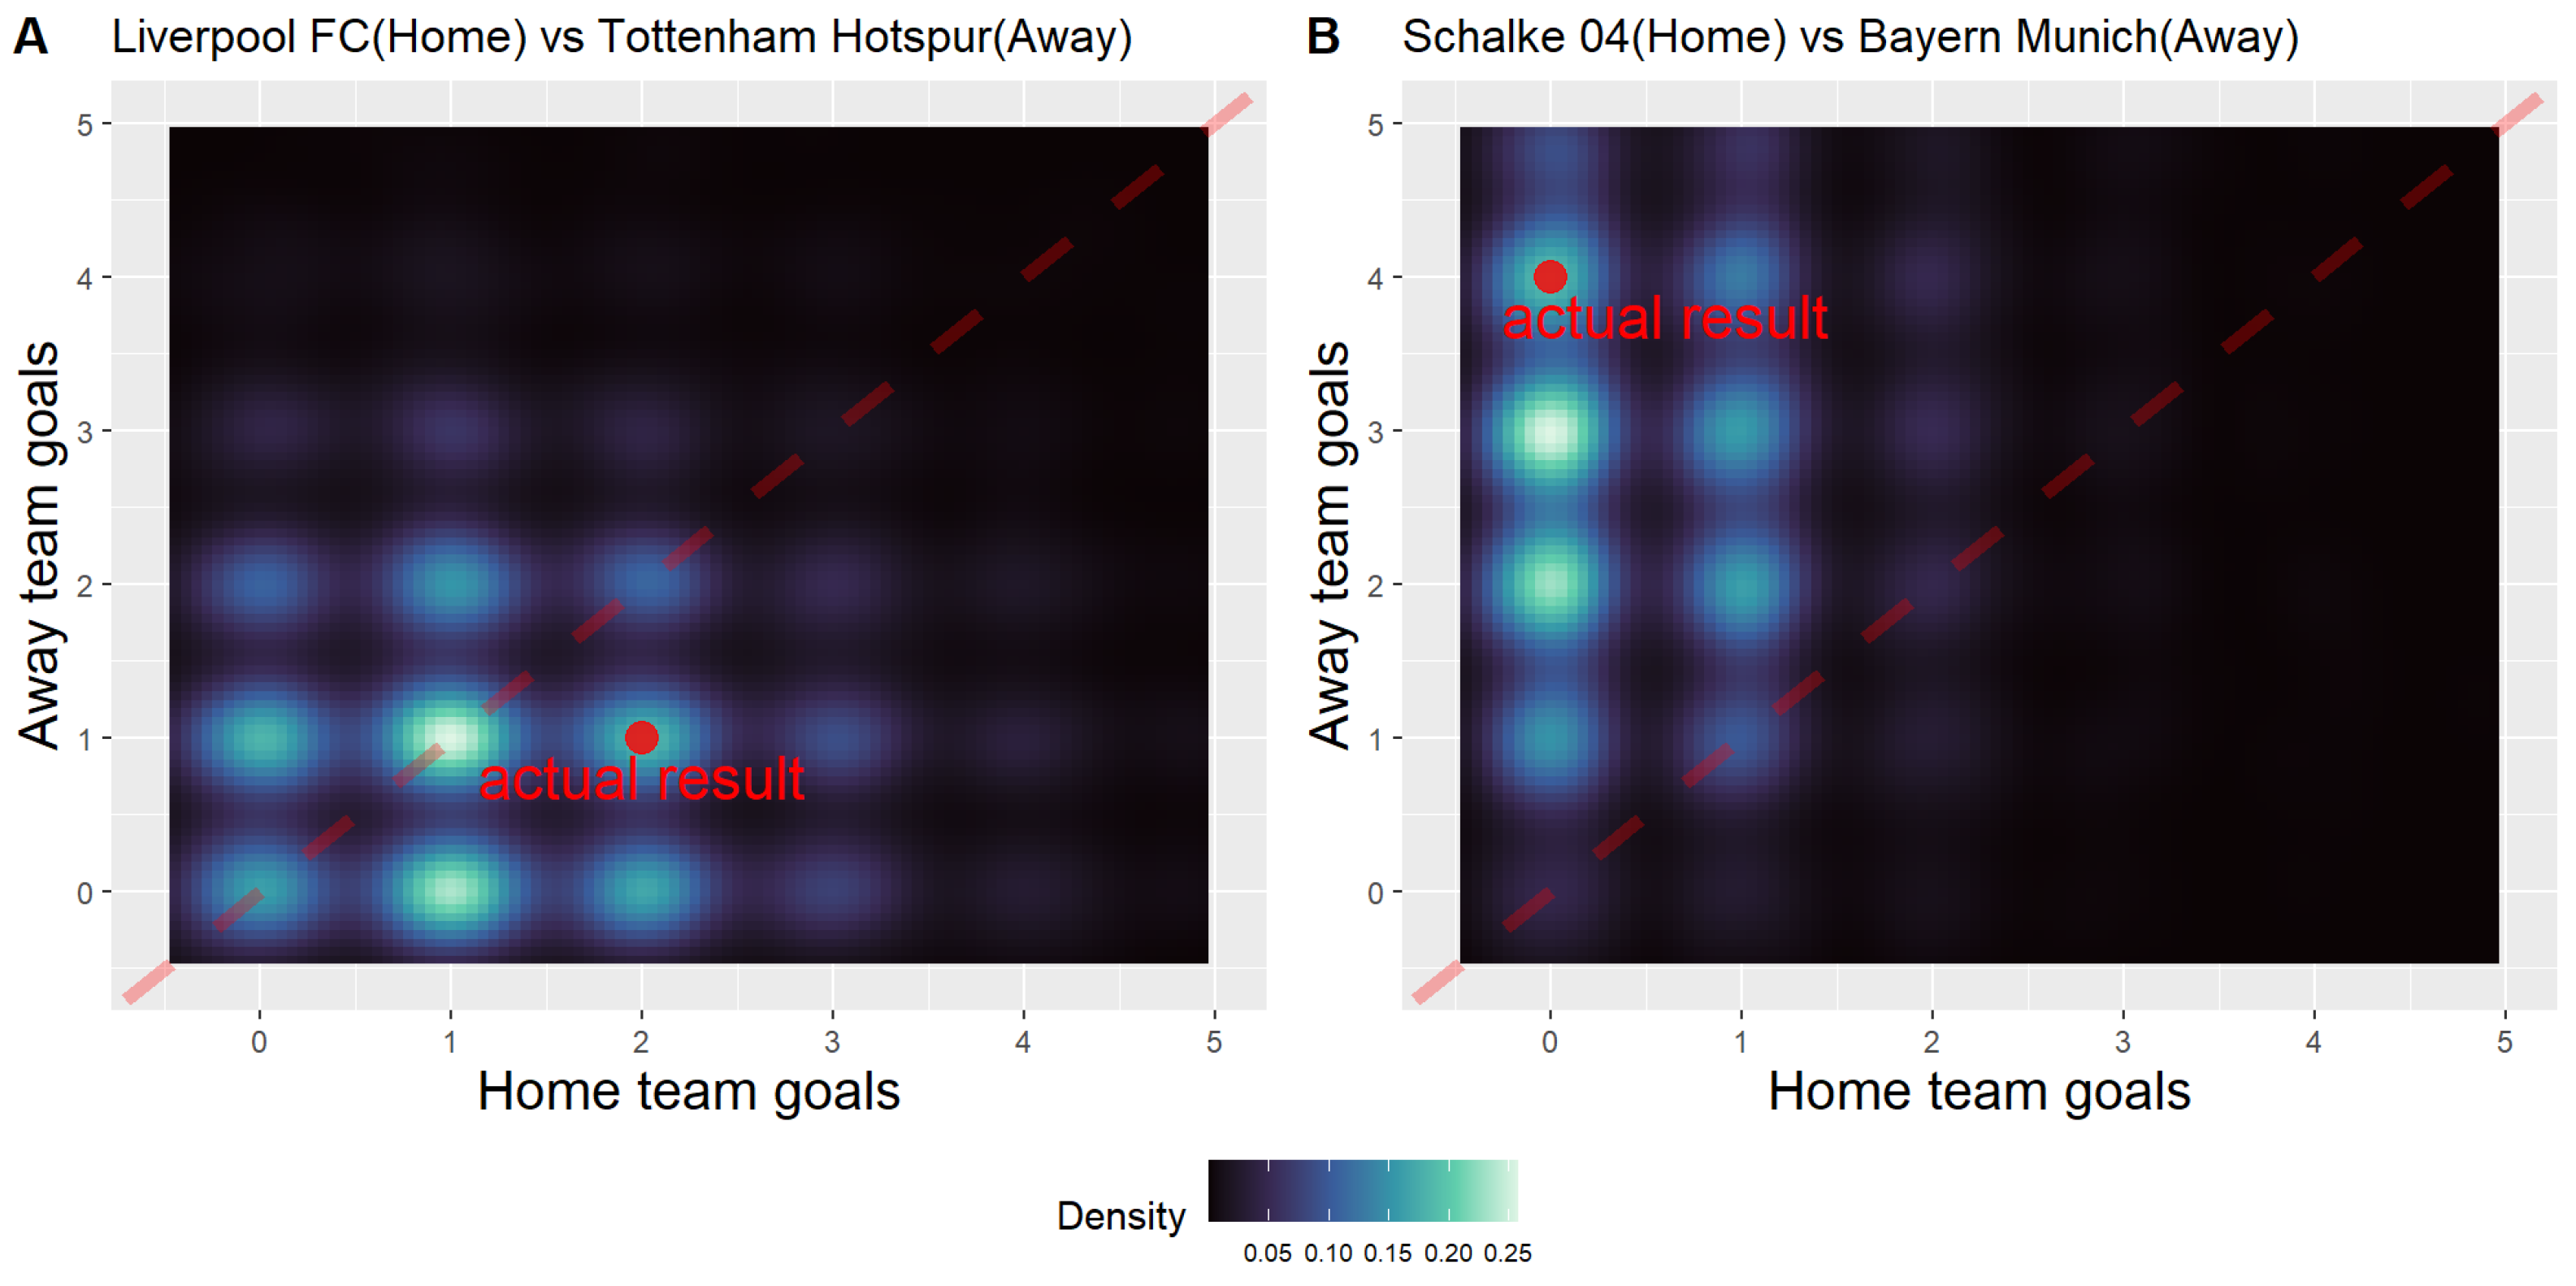
4.3. Score Prediction by Sampling

We used the parameters obtained from the model in Section 3 to simulate and predict match results. As mentioned in Section 4.1, more than 400 match results of the 2019–2020 season after the COVID-19 break were analyzed to estimate the distributions of OTHERS and SKILL after the COVID-19 break. Next, we calculated Poisson parameter λ s in Equations (3) and (4) using the estimated parameters of OTHERS and SKILL . With the calculated λ , pairwise goal distributions of the home and away teams are reconstructed for the matches after the COVID-19 break. In addition, the home goals and away goals were simulated by pairwise sampling from each goal distribution. As a result of the simulation, we obtained the simulated distribution of the predicted scores of a football match.
The following shows two exemplary match result predictions during the 2020–2021 season since COVID-19: (1) Liverpool FC vs. Tottenham Hotspur in the English Premier League and (2) Schalke 04 vs. Bayern Munich in the German Bundesliga. We estimated SKILL parameters for Liverpool FC, Tottenham Hotspur, Schalke 04, and Bayern Munich, along with the OTHERS parameters in the Premier League and Bundesliga from the period after the COVID-19 break. Using these two parameters, we calculated λ home and λ away for each match. Parameter values for the two exemplary matches are listed in Table 2. It is possible to simulate the match result based on sampling from a Poisson distribution with λ home and λ away . Figure 3 shows the distribution of scores for two exemplary matches, simulated 10,000 times. If the score distribution of a team is greater than that of the other team, the distribution becomes skewed to one side. If two teams are more likely to draw, the scores are distributed diagonally between them. In addition, the most frequently generated score was identified through pairwise score sampling. Furthermore, it is possible to calculate the probability of winning or losing using several simulation results and predict the match results. Table 2 compares the actual match result of the 2020–2021 season with our simulated results of the most frequent score, win rate, draw rate, and loss rate.

4.4. Match Prediction Model with Additional Features

In the previous subsections, we used the Bayesian hierarchical Poisson model to estimate the change in the HA and SKILL parameters in the matches after the COVID-19 break. As mentioned in Section 3.3, we then attempted to improve the prediction performances of machine learning models using the estimated parameters as additional input features. Three sets of input features were prepared to validate the effect of the additional features. The first set, as a baseline, does not include the O T H E R S , H A , and S K I L L parameters but contains the match outcomes, such as the number of goals. In addition to the features in the first set, the second set includes the O T H E R S , H A , and S K I L L parameters. However, the parameters do not consider the effect of the COVID-19 break. The third set not only includes the parameters but also considers their changes due to the COVID-19 break. The feature sets are described below in more detail.
Feature set 1: The set contains only cumulative match outcomes from previous seasons as input features. Its composition is as follows:
  • Win: Number of matches won in the last season;
  • Draw: Number of matches drawn in the last season;
  • Loss: Number of matches lost in the last season;
  • Goals_scored: Number of goals scored in the last season;
  • Goals_conceded: Number of goals conceded in the last season;
  • Points: Final points in the last season;
  • Promoted: Recently promoted to the league in the last season.
Feature set 2: The set contains the seven features in feature set 1 and the O T H E R S , H A , and S K I L L parameters estimated from the Bayesian hierarchical Poisson model. However, OTHERS home and OTHERS away were fixed at a single seasonal value such that HA would not change after the COVID-19 break. Therefore, they have limited information on the changed home advantage due to the COVID-19 break. The additional features are as follows:
  • OTHERS(fixed): Mean of sampled OTHERS parameters from the uniform HA model;
  • SKILL(fixed): Mean of sampled SKILL parameters from the uniform HA model;
  • HA(fixed): HA value from the uniform HA model.
Feature set 3: The set contains the seven features in feature set 1 and the O T H E R S , H A , and S K I L L parameters estimated from the Bayesian hierarchical Poisson model. The additional features are not fixed but variable at each season so that their changes due to the COVID-19 break can be utilized in the prediction models. We believe that, among the three sets, this set is the most suitable for match result prediction because it contains the information about the changed home advantage, if it exists. The additional features are as follows:
  • OTHERS: Mean of sampled OTHERS parameters from the changed HA model;
  • SKILL: Mean of sampled SKILL parameters from the changed HA model;
  • HA: HA value from the changed HA model.
The objective of the classification models in the experiment was to predict the result of the next season’s showdown with pairwise features of the two opposing teams’ previous seasons. Evaluation metrics for matching the prediction results of four major European football leagues in the 2020–2021 season are the prediction accuracy of match results (win, draw, or loss) and ranked probability score (RPS) [41]. RPS is a measure of how well probability distributions are predicted when matching the actual outcomes. Therefore, several studies employed this measure to evaluate football match outcomes [42,43]. The RPS metric is defined by
RPS = 1 r 1 i = 1 r j = 1 i ( p j e j ) 2 ,
where r is the number of outcomes (in this case, r = 3 : win, draw, or loss), p j is the predicted probability of outcome j , and e j is the actual probability of outcome j . Due to the fact that a smaller value implies how close the distribution is to the observed value, it indicates a better outcome. The actual probabilities of a real match are expressed as 0 and 1. If an actual match result is a win for the home team, the actual probability e is (1, 0, 0). We used the RPS averaged for all predicted matches, RPS avg , computed as follows:
RPS avg = 1 n k = 1 n RPS k ,
where n is the number of predicted matches.
Using the two evaluation metrics shown above, we compared the performance of various machine learning models to confirm the performance improvement of additive features. We chose several widely used classification models in machine learning: logistic regression, multilayer perception, random forest, linear support vector machine, and naïve Bayes. In addition, we proposed a classifier, score sampling, as a method to predict match results using the most frequent score among the simulations in Section 4.3. Note that the hyperparameters of the classifiers in the experiment are set as the values displaying the highest cross-validation accuracy on average for all three feature sets. The prior of naïve Bayes is the same as the distribution of match results (win, draw, or loss) in the training set.
Table 3 shows the hyperparameters and the experiment results of classifiers. The bold-faced result indicates the best performance among the three feature sets of a classifier. When comparing feature set 1 against feature sets 2 and 3, there is a clear improvement in the prediction performance. This shows that the prediction performance depends on the key information from additional features obtained by sampling. Compared with feature set 2, the accuracy improves when using feature set 3 in five out of six classifiers. Moreover, RPS avg generally improves using feature set 3 for various models, implying that these additional features facilitate a better prediction of not only the exact match results (win, draw, or loss) but also the distribution of match results. Among the aforementioned models, the model with the best prediction accuracy for matches after the COVID-19 break is score sampling using the features with additional information retrieved from matches after the COVID-19 break. As a result, we confirmed that it is the most suitable to predict a football match after the COVID-19 break using features that reflect the changed home advantage and team performance after the COVID-19 break.

5. Conclusions

This research began as a way of answering the following question: “How did the behind-closed-doors matches due to the COVID-19 pandemic affect the home team’s chance of winning?” We identified the difference in the expected points and number of goals scored by the home team between the seasons before and after the COVID-19 break using a two-sample t-test. The test results show that the expected points and, most importantly, the goal difference decreased over the COVID-19 break. Accordingly, this study introduced a Bayesian hierarchical Poisson model to estimate the home advantage and teams’ performance hierarchically as one of the hyperparameters that influence the number of goals scored. It found that the estimated home advantage of four major European football leagues (Premier League, LaLiga, Serie A, and Bundesliga) diminished after the COVID-19 break. The research also predicted the parameter that influences the number of goals scored by both the home and away teams using the Poisson distribution of goals with estimated parameters and predicted the score of each match result through a sampling-based simulation. In addition, the research confirmed that the accuracy of the prediction model was improved when the sampled parameters, SKILL , OTHERS , and HA , were included as the additional features in various machine learning models for football match prediction. Moreover, this study empirically identified the change in home advantage because of the COVID-19 pandemic. Nonetheless, we can barely say that our methods are sufficiently accurate for football match prediction because their test accuracy values were slightly greater than 0.5, as they were in other studies. Considering that a football game is subject to high uncertainty, it is an intrinsic limitation of football match prediction. To overcome the limitation, our future research direction is to further refine the parameters of the Bayesian hierarchical Poisson model by considering more features and utilizing diverse domain knowledge from football games. We believe that, in this way of making unmeasurable information tangible, we can design a more accurate match prediction model.

Author Contributions

Conceptualization, J.L., J.K. and H.K.; methodology, J.L. and J.K.; software, J.L., J.K. and H.K.; validation, J.L., J.K. and H.K.; formal analysis, J.L., J.K. and H.K.; investigation, J.L., J.K., H.K. and J.-S.L.; data curation, J.L., J.K. and H.K.; writing—original draft preparation, J.L. and J.K.; writing—review and editing, J.L., J.K. and J.-S.L.; visualization, J.L., J.K. and H.K.; supervision, J.-S.L.; project administration, J.-S.L.; funding acquisition, J.-S.L. All authors have read and agreed to the published version of the manuscript.

Funding

This work was partly supported by the National Research Foundation of Korea grants funded by the Korean government’s Ministry of Science and ICT (MSIT; grant numbers 2019R1A4A1024732 and 2020R1A5A1019649) and partly by the Institute for Information and Communications Technology Planning & Evaluation grant funded by the MSIT (grant number 20210002920012002).

Institutional Review Board Statement

Not applicable.

Informed Consent Statement

Not applicable.

Data Availability Statement

The data underlying the results presented in the study are available from https://www.whoscored.com (accessed on 2 March 2022). The authors had no special access privileges to the data.

Conflicts of Interest

The authors declare no conflict of interest. The funders had no role in the design of the study; in the collection, analyses, or interpretation of data; in the writing of the manuscript, or in the decision to publish the results.

Abbreviations

The following abbreviations are used in this manuscript:
COVID-19coronavirus disease 2019
HAhome advantage
MLPmultilayer perception
SVMsupport vector machine

References

  1. Drewes, M.; Daumann, F.; Follert, F. Exploring the sports economic impact of COVID-19 on professional soccer. Soccer Soc. 2021, 22, 125–137. [Google Scholar] [CrossRef]
  2. McGrath, M. ‘Anfield Is Only Anfield When It Is Full,’ Marcelo Bielsa Says ahead of Liverpool vs. Leeds Game. 2020. Available online: https://www.telegraph.co.uk/football/2020/09/11/anfield-anfield-full-marcelo-bielsa-says-ahead-liverpool-vs/ (accessed on 2 March 2022).
  3. Deloitte Touche Tohmatsu Limited. Annual Review of Football Finance 2020. Available online: https://www2.deloitte.com/uk/en/pages/sports-business-group/articles/annual-review-of-football-finance.html (accessed on 2 March 2022).
  4. Grand View Research. Online Gambling Market Size, Share & Trends Analysis Report by Type (Sports Betting, Casinos, Poker, Bingo), by Device (Desktop, Mobile), by Region (North America, Europe, APAC, Latin America, MEA), and Segment Forecasts, 2020–2027. Available online: https://www.grandviewresearch.com/industry-analysis/online-gambling-market (accessed on 2 March 2022).
  5. Nevill, A.M.; Balmer, N.J.; Williams, A.M. The influence of crowd noise and experience upon refereeing decisions in football. Psychol. Sport Exerc. 2002, 3, 261–272. [Google Scholar] [CrossRef] [Green Version]
  6. Boyko, R.H.; Boyko, A.R.; Boyko, M.G. Referee bias contributes to home advantage in English Premiership football. J. Sport. Sci. 2007, 25, 1185–1194. [Google Scholar] [CrossRef] [PubMed]
  7. Buraimo, B.; Forrest, D.; Simmons, R. The 12th man?: Refereeing bias in English and German soccer. J. R. Stat. Soc. Ser. (Stat. Soc.) 2010, 173, 431–449. [Google Scholar] [CrossRef] [Green Version]
  8. Dohmen, T.; Sauermann, J. Referee Bias. J. Econ. Surv. 2015, 30, 679–695. [Google Scholar] [CrossRef]
  9. Fischer, K.; Haucap, J. Does Crowd Support Drive the Home Advantage in Professional Football? Evidence from German Ghost Games during the COVID-19 Pandemic. J. Sport. Econ. 2021, 22, 982–1008. [Google Scholar] [CrossRef]
  10. Tilp, M.; Thaller, S. Covid-19 Has Turned Home Advantage Into Home Disadvantage in the German Soccer Bundesliga. Front. Sport. Act. Living 2020, 2, 165. [Google Scholar] [CrossRef]
  11. Reade, J.; Schreyer, D.; Singleton, C. Eliminating Supportive Crowds Reduces Referee Bias. Econ. Inq. 2021. [Google Scholar] [CrossRef]
  12. Bryson, A.; Dolton, P.; Reade, J.J.; Schreyer, D.; Singleton, C. Causal effects of an absent crowd on performances and refereeing decisions during Covid-19. Econ. Lett. 2021, 198, 109664. [Google Scholar] [CrossRef]
  13. Hill, Y.; Van Yperen, N.W. Losing the Home Field Advantage When Playing Behind Closed Doors During COVID-19: Change or Chance? Front. Psychol. 2021, 12, 1321. [Google Scholar] [CrossRef]
  14. Benz, L.S.; Lopez, M.J. Estimating the change in soccer’s home advantage during the Covid-19 pandemic using bivariate Poisson regression. Asta Adv. Stat. Anal. 2021, 2021, 1–18. [Google Scholar] [CrossRef] [PubMed]
  15. Higgs, N.; Stavness, I. Bayesian analysis of home advantage in North American professional sports before and during COVID-19. Sci. Rep. 2021, 11, 14521. [Google Scholar] [CrossRef] [PubMed]
  16. McCarrick, D.; Bilalic, M.; Neave, N.; Wolfson, S. Home advantage during the COVID-19 pandemic: Analyses of European football leagues. Psychol. Sport Exerc. 2021, 56, 102013. [Google Scholar] [CrossRef] [PubMed]
  17. Azhari, H.R.; Widyaningsih, Y.; Lestari, D. Predicting Final Result of Football Match Using Poisson Regression Model. J. Phys. Conf. Ser. 2018, 1108, 012066. [Google Scholar] [CrossRef]
  18. Aslan, B.G.; Inceoglu, M.M. A Comparative Study on Neural Network based Soccer Result Prediction. In Proceedings of the Seventh International Conference on Intelligent Systems Design and Applications, Rio de Janeiro, Brazil, 20–24 October 2007; pp. 545–550. [Google Scholar] [CrossRef] [Green Version]
  19. Cho, Y.; Yoon, J.; Lee, S. Using social network analysis and gradient boosting to develop a soccer win–lose prediction model. Eng. Appl. Artif. Intell. 2018, 72, 228–240. [Google Scholar] [CrossRef]
  20. Saricaoğlu, A.E.; Aksoy, A.; Kaya, T. Prediction of Turkish Super League Match Results Using Supervised Machine Learning Techniques. In Intelligent and Fuzzy Techniques in Big Data Analytics and Decision Making; Springer: Cham, Switzerland, 2019; Volume 1029, pp. 273–280. [Google Scholar] [CrossRef]
  21. Brooks, J.; Kerr, M.; Guttag, J. Using machine learning to draw inferences from pass location data in soccer. Stat. Anal. Data Mining Asa Data Sci. J. 2016, 9, 338–349. [Google Scholar] [CrossRef]
  22. Berrar, D.; Lopes, P.; Dubitzky, W. Incorporating domain knowledge in machine learning for soccer outcome prediction. Mach. Learn. 2018, 108, 97–126. [Google Scholar] [CrossRef] [Green Version]
  23. Gorgi, P.; Koopman, S.J.; Lit, R. Estimation of final standings in football competitions with a premature ending: The case of COVID-19. Asta Adv. Stat. Anal. 2021, 1–18. [Google Scholar] [CrossRef]
  24. Price, M.; Yan, J. The Effects of the NBA COVID Bubble on the NBA Playoffs: A Case Study for Home-Court Advantage. arXiv 2021, arXiv:2103.02832. [Google Scholar]
  25. Szabó, D.V.; Pérez, D.A. Does home advantage without crowd exist in American football? arXiv 2021, arXiv:2104.11595. [Google Scholar]
  26. Welch, B.L. The Generalization of ‘Student’s’ Problem when Several Different Population Variances Are Involved. Biometrika 1947, 34, 28–35. [Google Scholar] [CrossRef] [PubMed]
  27. Cohen, J. Statistical Power Analysis for the Behavioral Sciences, 2nd ed.; Routledge: London, UK, 1988. [Google Scholar]
  28. Lee, A.J. Modeling Scores in the Premier League: Is Manchester United Really the Best? CHANCE 1997, 10, 15–19. [Google Scholar] [CrossRef]
  29. Albert, J.H. Bayesian selection of log-linear models. Can. J. Stat. 1996, 24, 327–347. [Google Scholar] [CrossRef]
  30. Baio, G.; Blangiardo, M. Bayesian hierarchical model for the prediction of football results. J. Appl. Stat. 2010, 37, 253–264. [Google Scholar] [CrossRef] [Green Version]
  31. Karlis, D.; Ntzoufras, I. Bayesian modelling of football outcomes: Using the Skellam’s distribution for the goal difference. Ima J. Manag. Math. 2009, 20, 133–145. [Google Scholar] [CrossRef] [Green Version]
  32. Baath, R. Modeling Match Results in Soccer Using a Hierarchical Bayesian Poisson Model. 2015. Available online: http://sumsar.net/papers/baath_2015_modeling_match_resluts_in_soccer.pdf (accessed on 2 March 2022).
  33. Plummer, M. JAGS: A Program for Analysis of Bayesian Graphical Models Using Gibbs Sampling. 2003. Available online: https://www.r-project.org/conferences/DSC-2003/Proceedings/Plummer.pdf (accessed on 2 March 2022).
  34. Plummer, M. Rjags: Bayesian Graphical Models Using MCMC; R Package Version 4-10; R Foundation for Statistical Computing: Vienna, Austria, 2019. [Google Scholar]
  35. R Core Team. R: A Language and Environment for Statistical Computing; R Foundation for Statistical Computing: Vienna, Austria, 2020. [Google Scholar]
  36. Geman, S.; Geman, D. Stochastic Relaxation, Gibbs Distributions, and the Bayesian Restoration of Images. IEEE Trans. Pattern Anal. Mach. Intell. 1984, PAMI-6, 721–741. [Google Scholar] [CrossRef]
  37. Groot, L. Economics, Uncertainty and European Football: Trends in Competitive Balance; Edward Elgar: Cheltenham, UK, 2008. [Google Scholar]
  38. Swanson, B. Premier League Restart Depends on 8–10 Neutral Venues; Clubs Still Committed to Finishing Season. 2020. Available online: https://www.skysports.com/football/news/11095/11981803/premier-league-restart-depends-on-neutral-venues-clubs-still-committed-to-finishing-season (accessed on 20 February 2022).
  39. Andrieu, C.; De Freitas, N.; Doucet, A.; Jordan, M.I. An introduction to MCMC for machine learning. Mach. Learn. 2003, 50, 5–43. [Google Scholar] [CrossRef] [Green Version]
  40. Plummer, M.; Best, N.; Cowles, K.; Vines, K. CODA: Convergence Diagnosis and Output Analysis for MCMC. 2006. Available online: https://cran.r-project.org/doc/Rnews/Rnews_2006-1.pdf#page=7 (accessed on 2 March 2022).
  41. Epstein, E.S. A scoring system for probability forecasts of ranked categories. J. Appl. Meteorol. 1969, 8, 985–987. [Google Scholar] [CrossRef] [Green Version]
  42. Constantinou, A.C.; Fenton, N.E. Solving the problem of inadequate scoring rules for assessing probabilistic football forecast models. J. Quant. Anal. Sport. 2012, 8, 1–12. [Google Scholar] [CrossRef]
  43. Tsokos, A.; Narayanan, S.; Kosmidis, I.; Baio, G.; Cucuringu, M.; Whitaker, G.; Király, F. Modeling outcomes of soccer matches. Mach. Learn. 2019, 108, 77–95. [Google Scholar] [CrossRef] [Green Version]
Figure 1. Line graphs of expected points and the goal difference for four major European football leagues. (A) Trend of the average expected points of the home team per league in the corresponding season. (B) Trend of average goal difference of the home team per league in the corresponding season. For each plot, the red dashed lines represent the average value of all four leagues per season.
Entropy 24 00366 g001
Figure 2. Parameters sampled from the proposed model in Section 3. (A) Caterpillar plot of the SKILL parameter per team in the Premier League for matches after the COVID-19 break. We adjusted the SKILL parameter such that the average is zero because SKILL is the relative parameter in the same league. The line length of the caterpillar plot represents a 95% credible interval. (BE) Caterpillar plot of the home advantage ( HA ) of four major European football leagues in the 10 most recent seasons, namely B for English Premier League, C for Spanish LaLiga, D for Italian Serie A, and E for German Bundesliga. “After COVID-19” represents the 2019–2020 and 2020–2021 season matches since the leagues were suspended because of COVID-19 in March 2020. The blue dashed line represents the average HA for the 10 most recent seasons before the COVID-19 break. The line length of the caterpillar plot represents a 95% credible interval.
Entropy 24 00366 g002
Figure 3. Distribution of simulated score. The brighter the point, the more frequent the score results are. The red dashed line represents the set of tie matches. The location of the red dot shows the actual match results between the two teams during the 2020–2021 season. (A) Liverpool FC vs. Tottenham Hotspur. (B) Schalke 04 vs. Bayern Munich.
Entropy 24 00366 g003
Table 1. Welch’s unequal variances t-test on expected points and goal difference.
Test StatisticExpected PointsGoal Difference
t2.34512.3049
df7.64547.7808
p-value0.04850.0510
95% confidence interval[0.0011, 0.2730][−0.0009, 0.3371]
mean_before_COVID-191.62140.3671
mean_after_COVID-191.48430.1990
effect size (Cohen’s d)−1.4612−1.3731
Table 2. Score prediction results of the exemplary matches.
Home/AwayTeam NameParametersSimulated ResultsMost Frequent
Score
Actual
Outcome
Mean_SKILLMean_OTHERS λ WinDrawLoss
Match1HomeLiverpool FC0.3010.2721.420.4250.2730.30212
AwayTottenham Hotspur0.2240.2121.140.3020.2730.42511
Match2HomeSchalke 04−0.3140.4320.640.0390.0910.87000
AwayBayern Munich0.5610.3003.230.8700.0910.03934
Table 3. Result of various match prediction models.
ClassifierFeature Set 1Feature Set 2Feature Set 3Hyperparameter
Test Accuracy RPS avg Test Accuracy RPS avg Test Accuracy RPS avg
Logistic regression0.50620.20110.52080.20080.52290.1999C = 10 (L2 regularization)
MLP0.50760.20030.51450.20100.51860.2009hidden layer = 2, hidden node = (3, 3)
Random forest0.46950.21230.48890.21000.50200.2073max features = 5, n tree = 100
Linear SVM0.49510.20500.51590.20230.51930.2015C = 1 (L2 regularization)
Naïve Bayes0.47920.11650.48190.11750.47780.1177prior = (0.3, 0.24, 0.46)
Score samplingN/AN/A0.52140.29970.52490.2998simulated 10,000 times
Average
(except score sampling)
0.49150.18700.50440.18630.50810.1855
Publisher’s Note: MDPI stays neutral with regard to jurisdictional claims in published maps and institutional affiliations.

