
Linear and Nonlinear Effects in Connectedness Structure: Comparison between European Stock Markets


Abstract
:1. Introduction
2. Literature Review
3. Data Characteristics
4. Methods
4.1. Cross-Market Correlations
4.2. Larntz–Perlman Procedure
4.3. Mutual Information
4.4. Transfer Entropy
4.5. Summary of Methods
5. Results
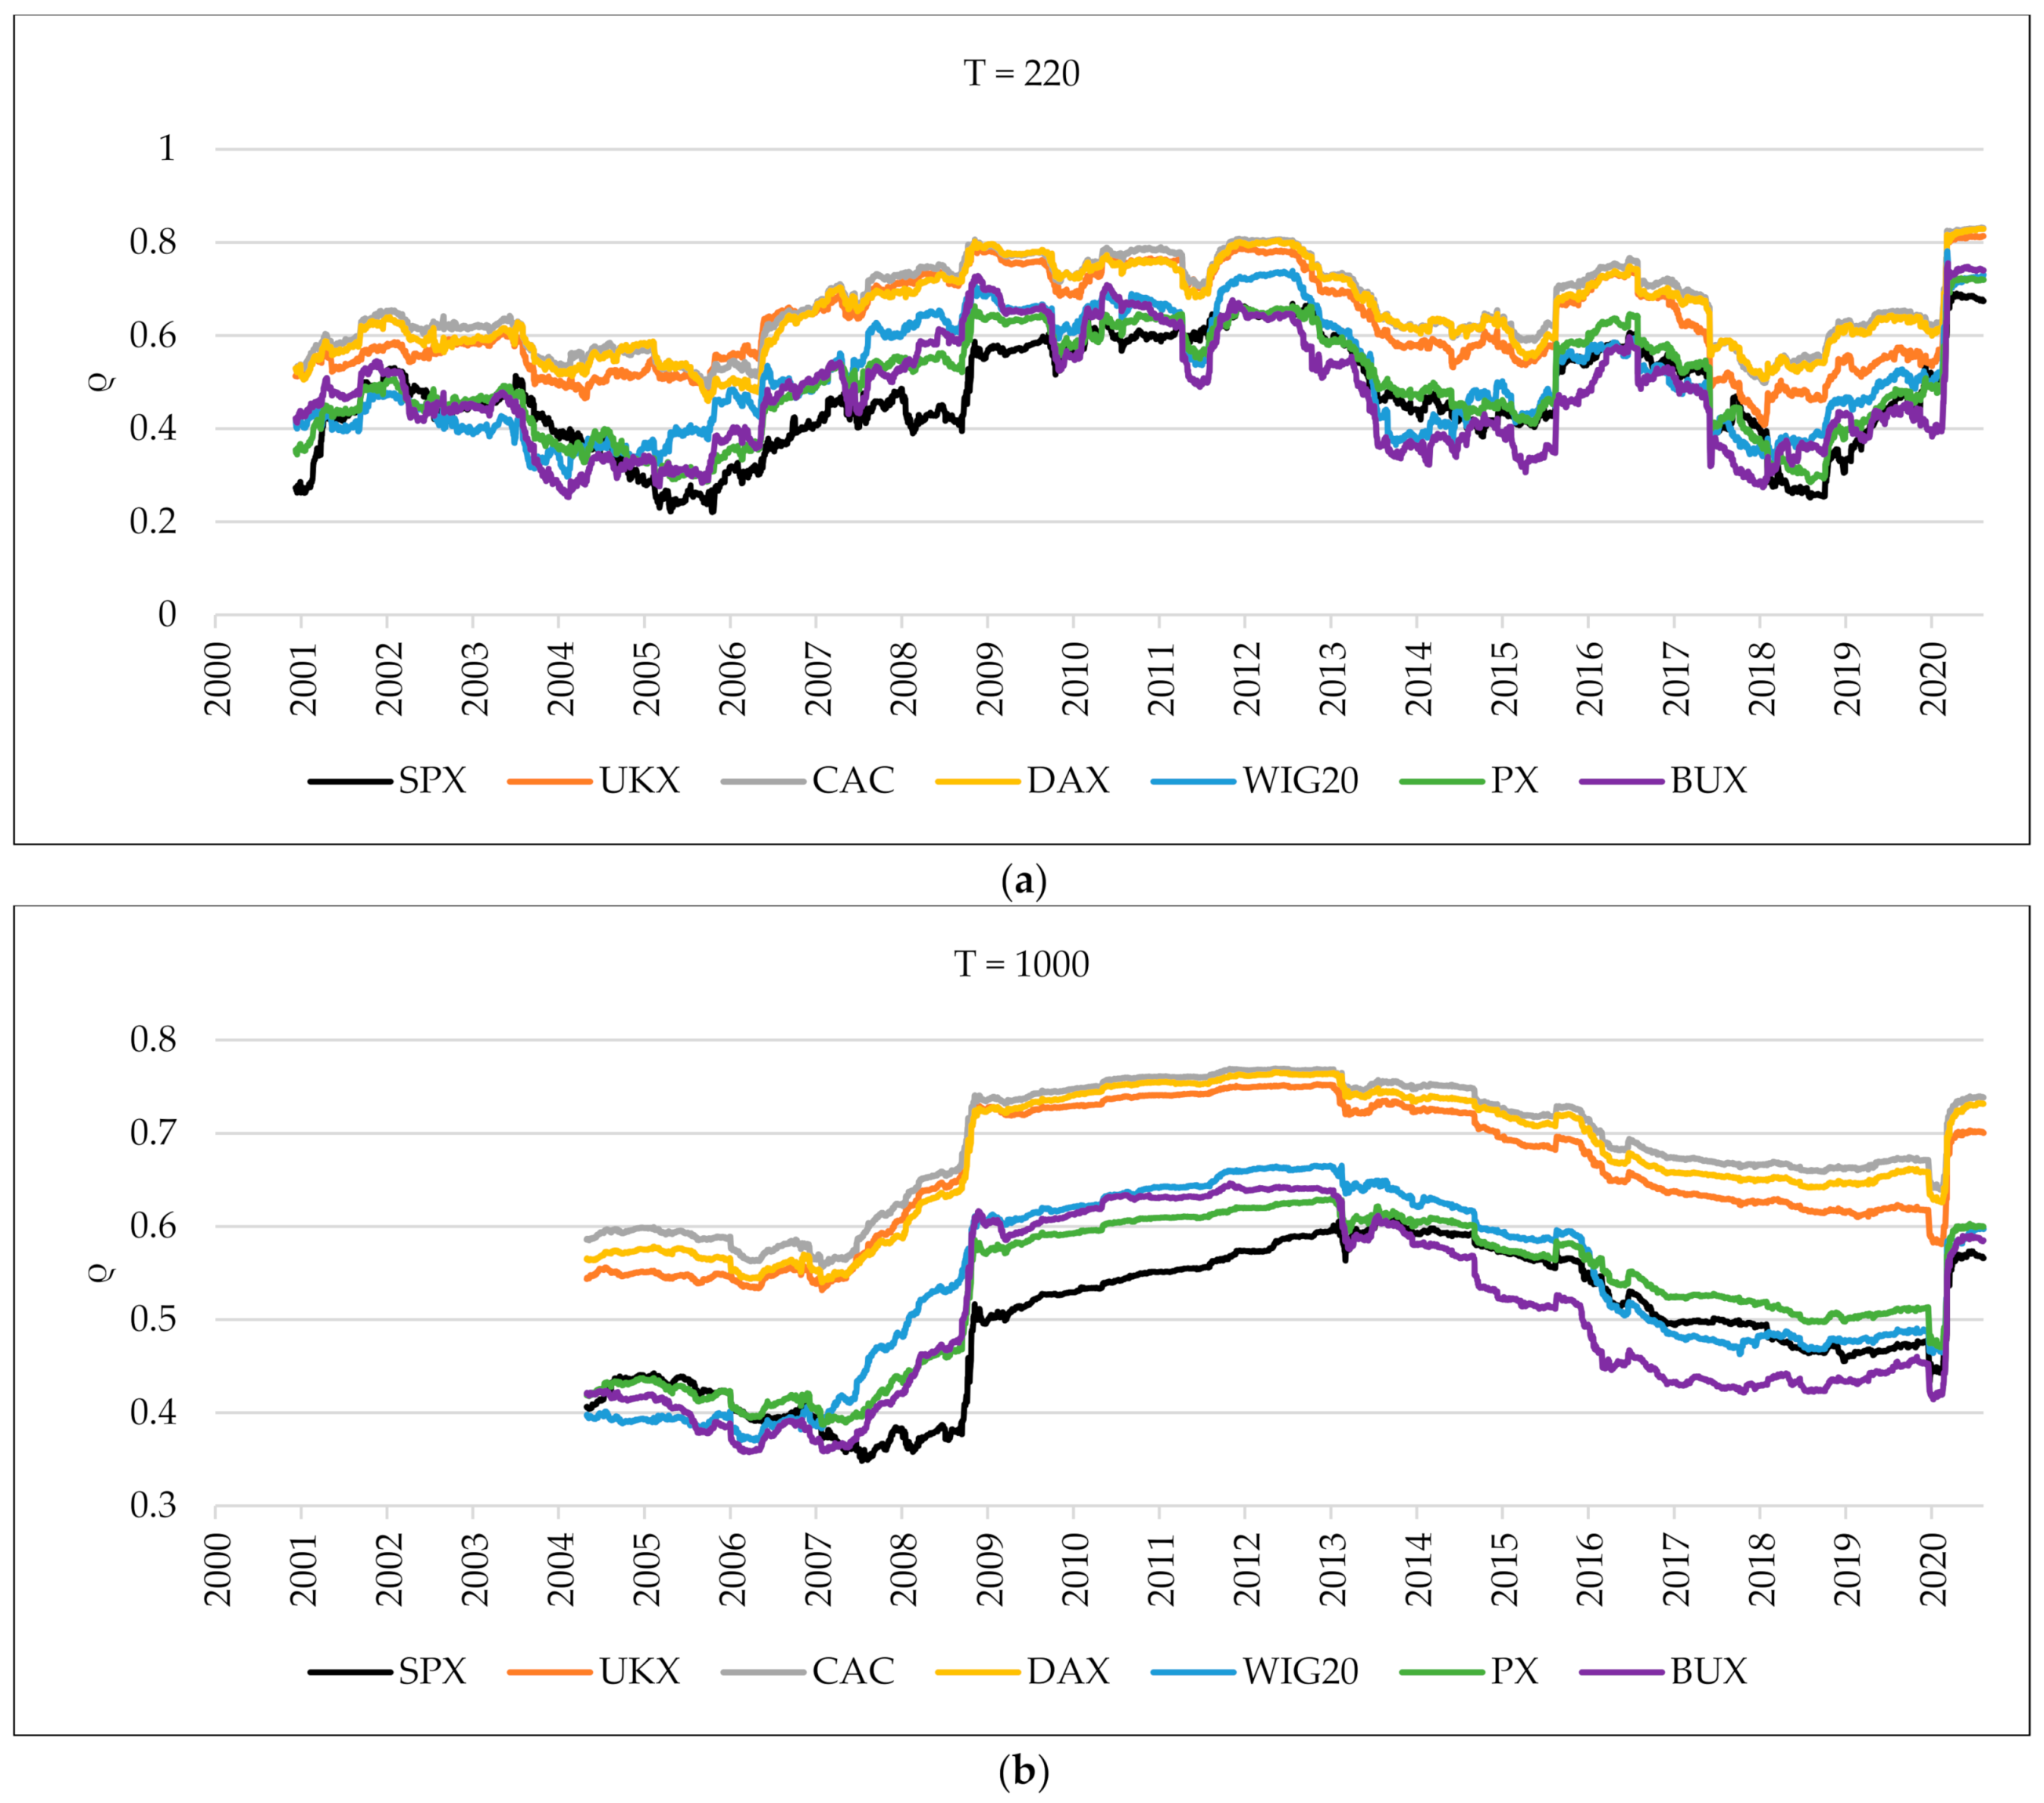
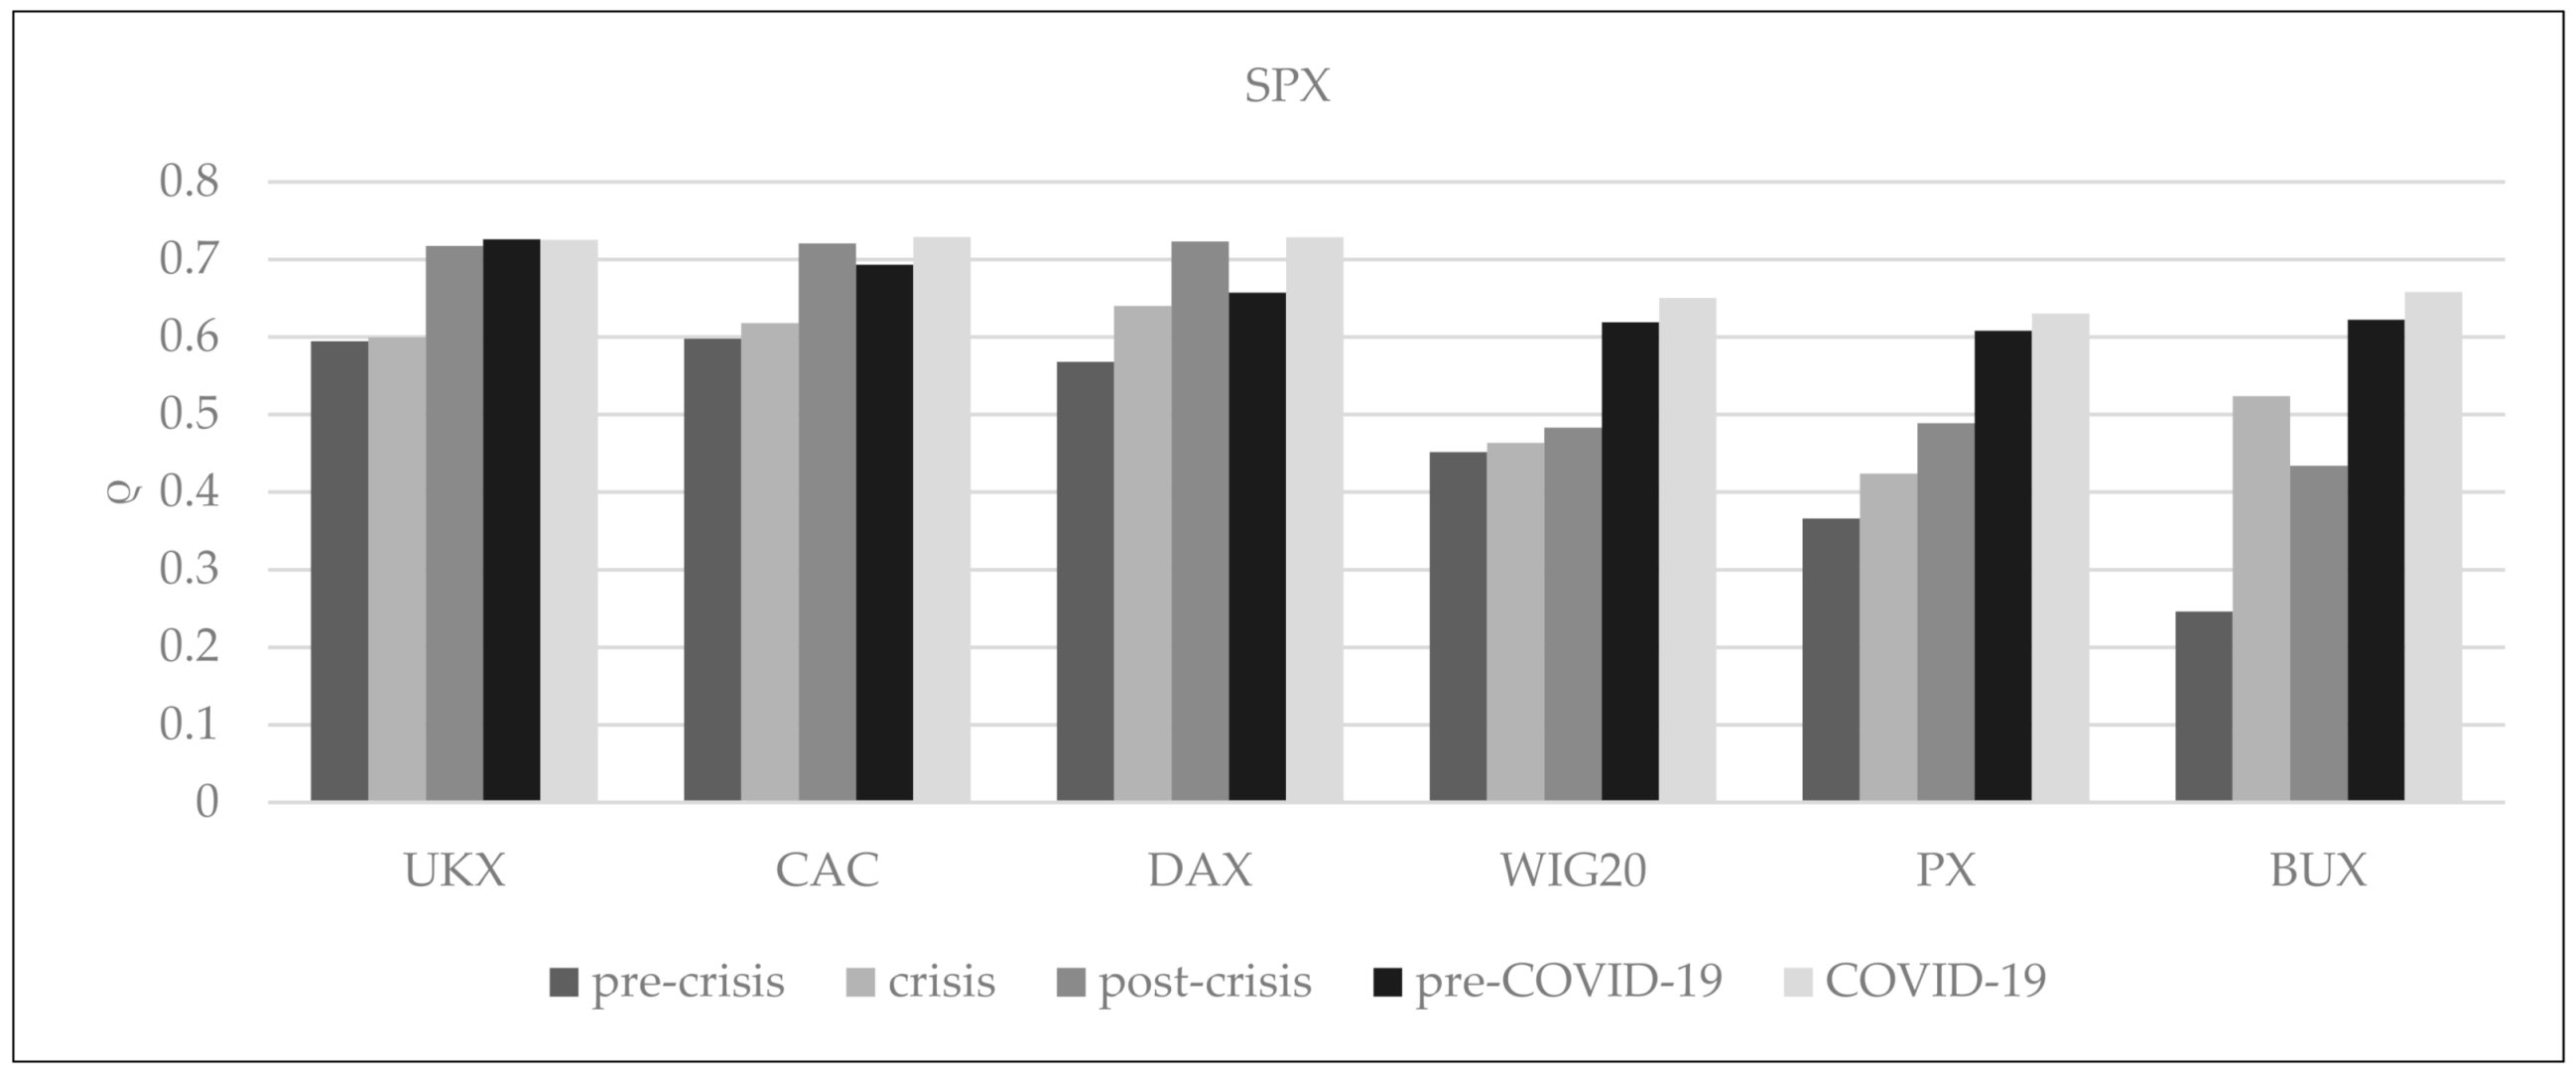
5.1. Cross-Market Correlations
5.2. Larntz–Perlman Procedure
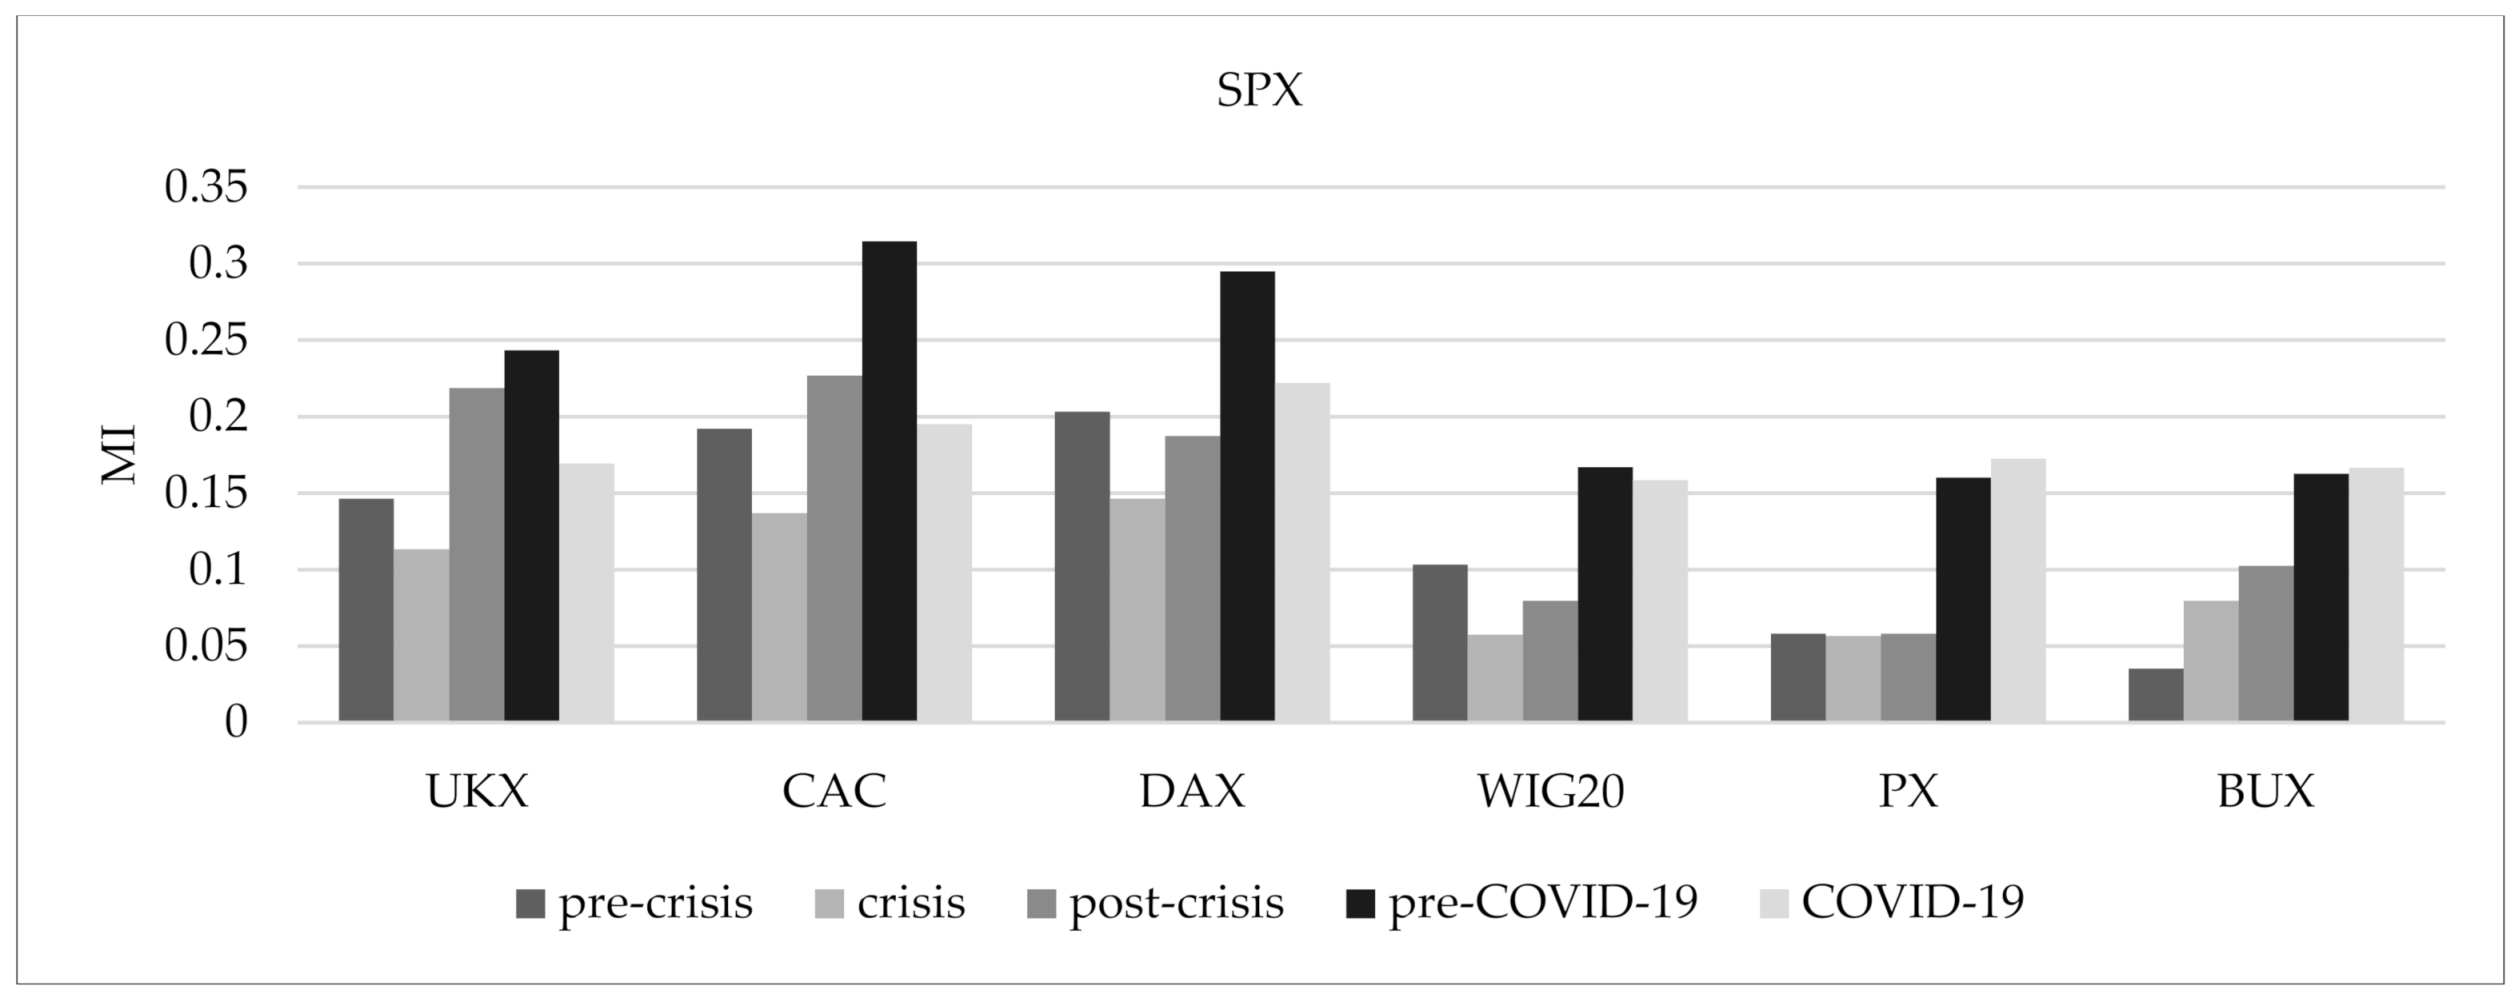
- the pre-crisis period, September 2006–November 2007 (290 days), and the crisis period, December 2007–February 2009 (290 days);
- the crisis period, December 2007–February 2009 (290 days), and the post-crisis period, March 2009–May 2010 (290 days); and
- the pre-COVID-19 period, 30 September 2019–11 March 2020 (103 days), and the COVID-19 period, 12 March 2020–14 August 2020 (103 days).
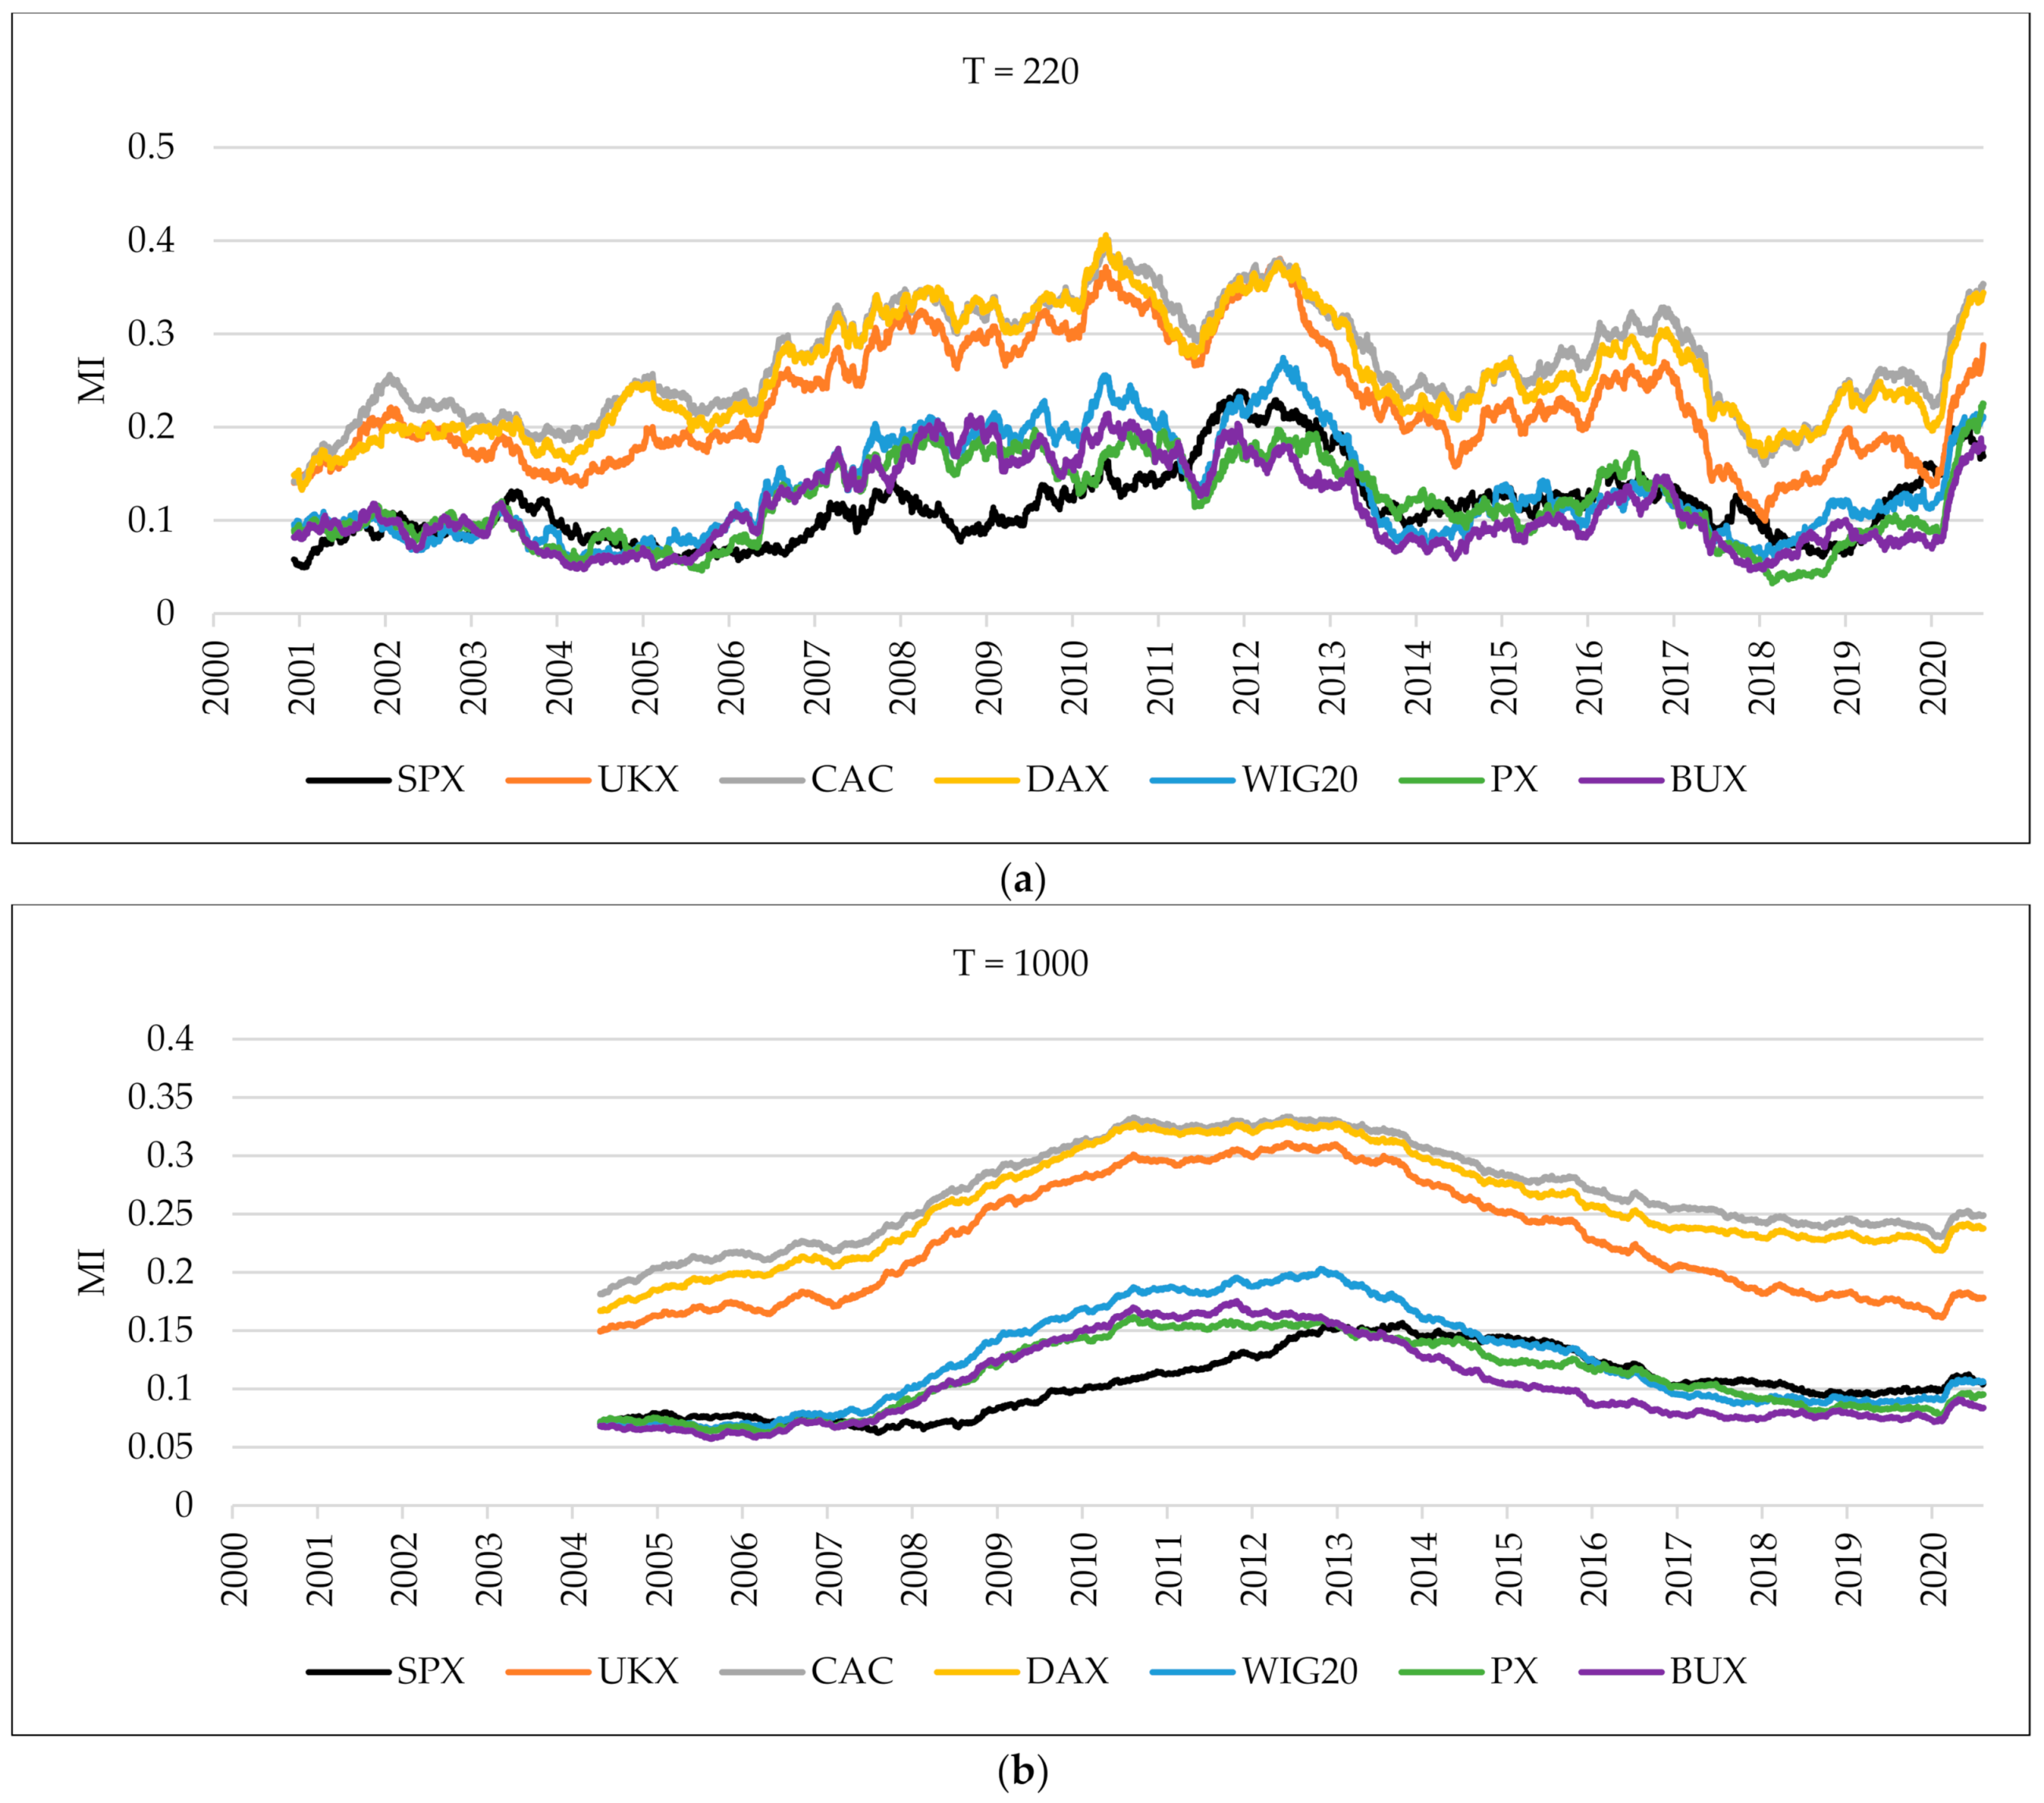
5.3. Mutual Information
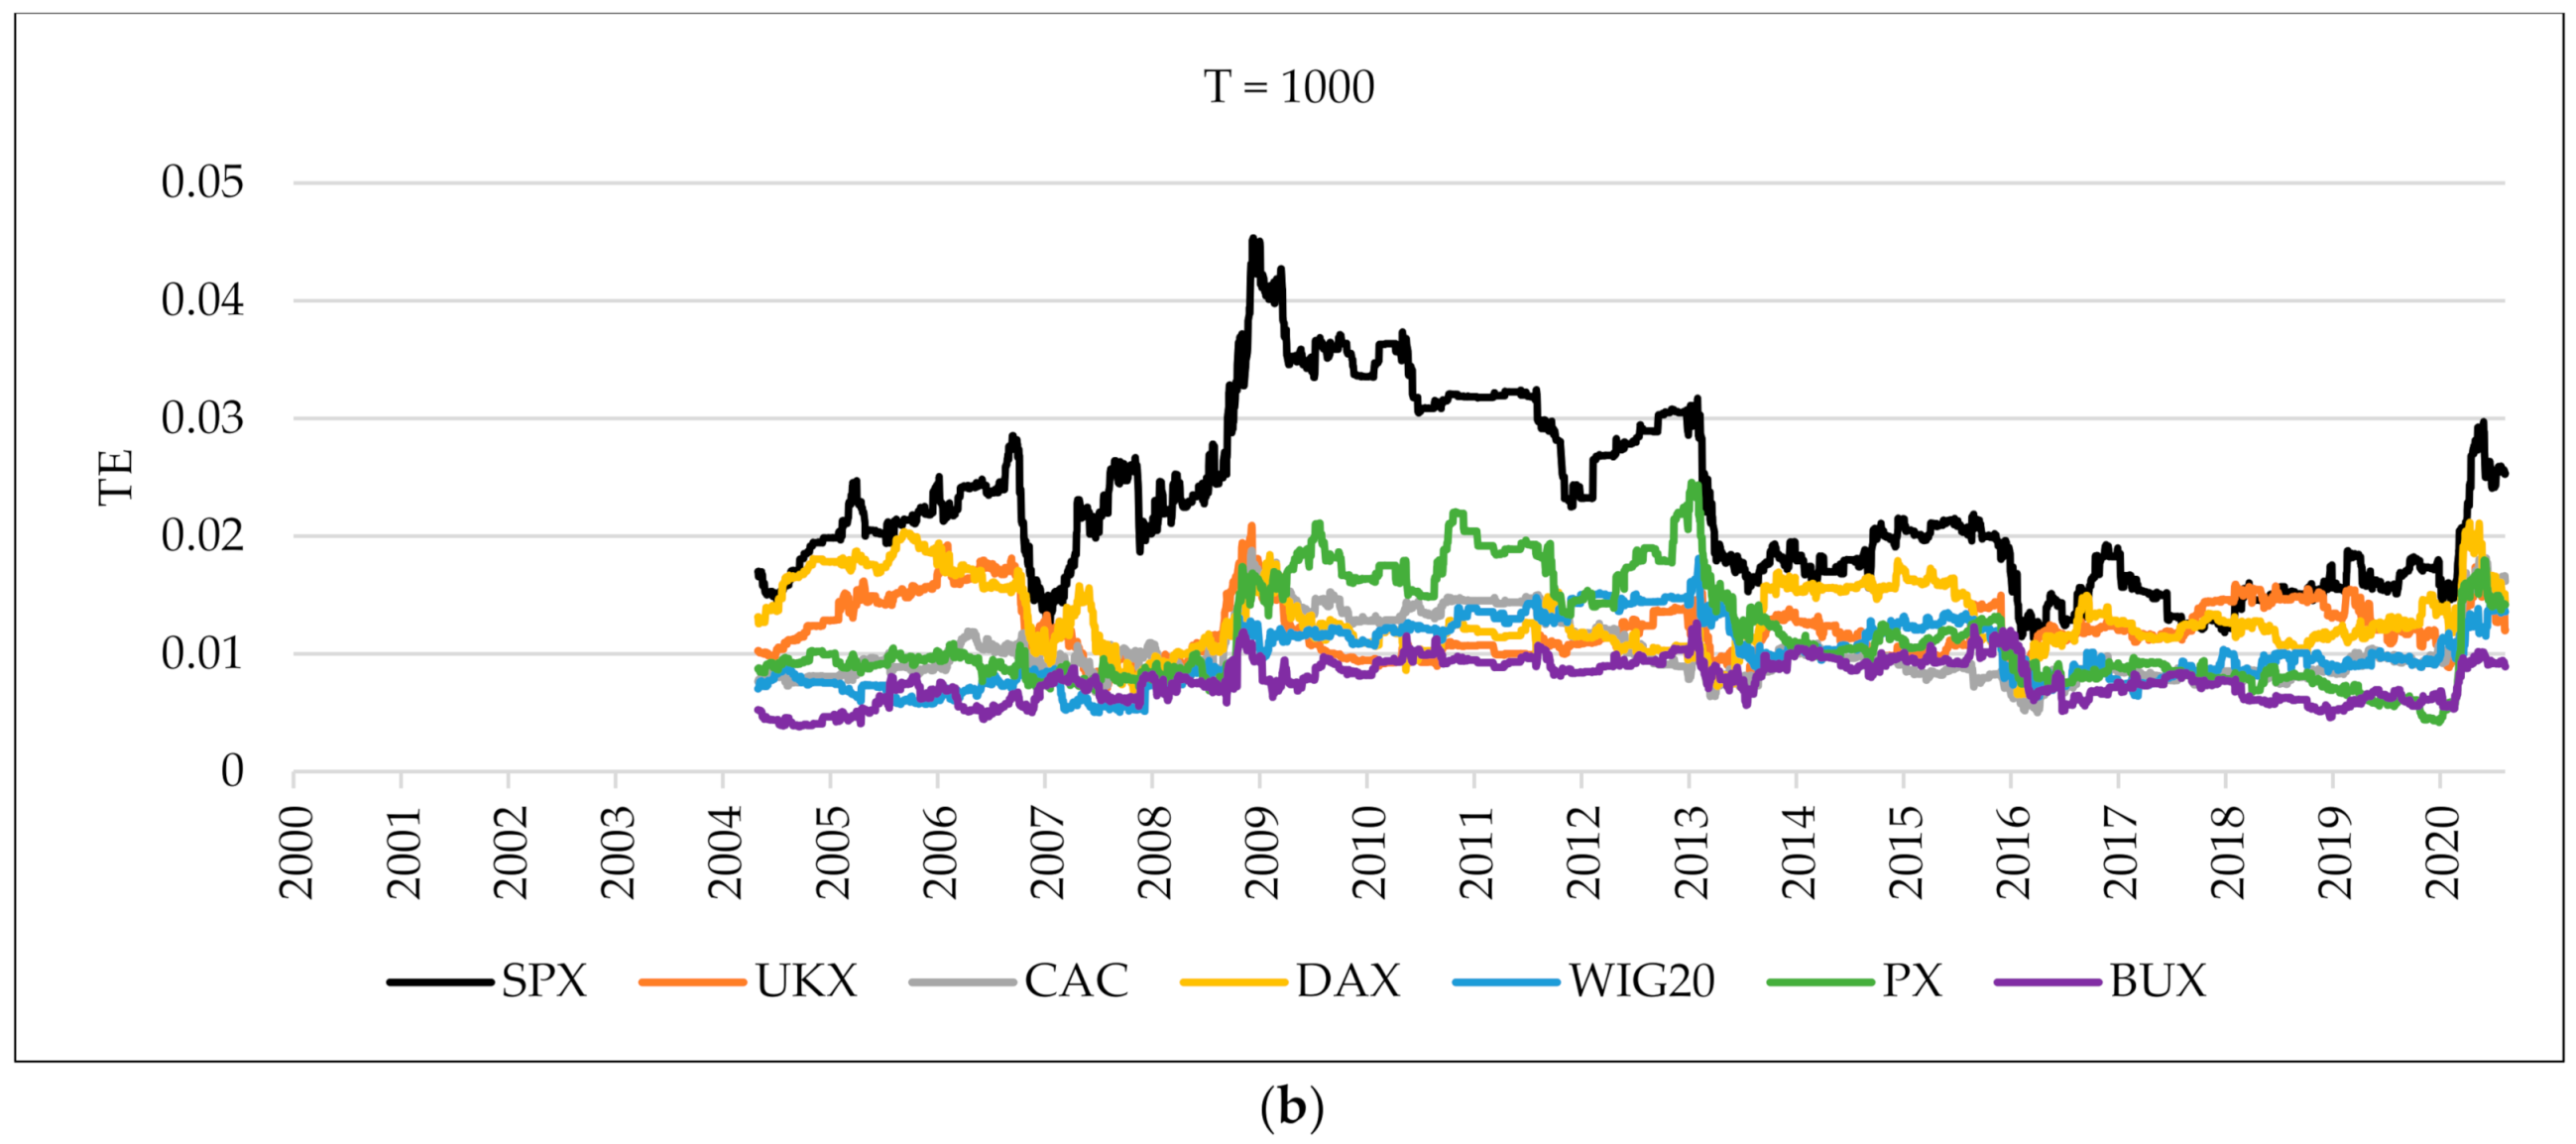
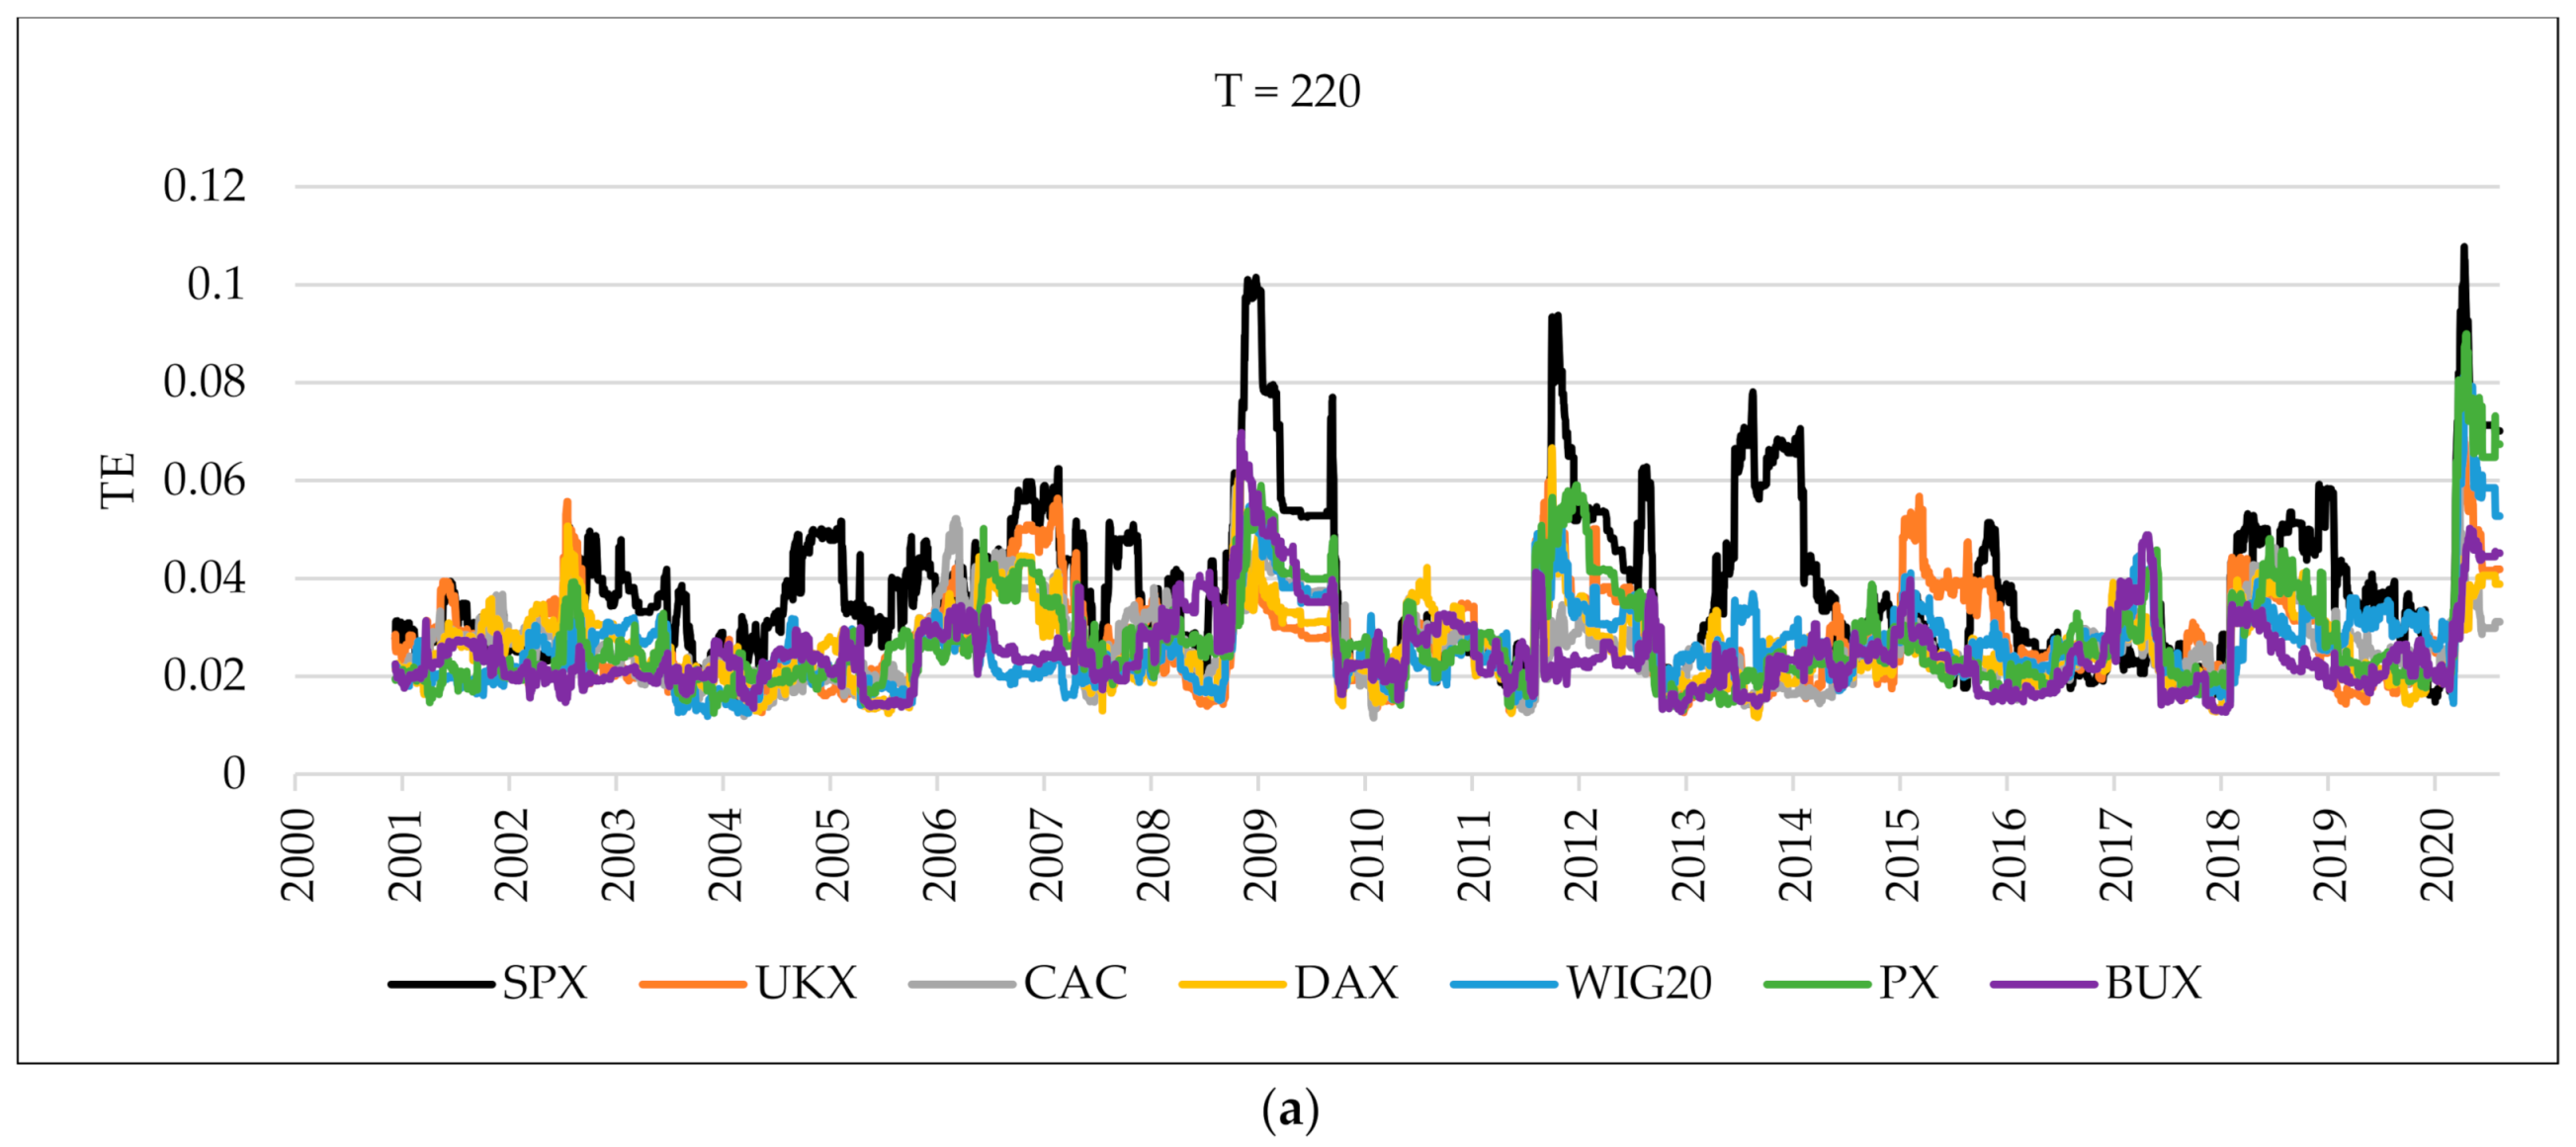
5.4. Transfer Entropy
5.5. Comparison of Results
6. Discussion and Conclusions
Author Contributions
Funding
Data Availability Statement
Conflicts of Interest
References
- WHO. Director-General’s Opening Remarks at the Media Briefing on COVID-19. 11 March 2020. Available online: https://www.who.int/dg/speeches/detail/who-director-general-s-opening-remarks-at-the-media-briefing-on-covid-19---11-march-2020 (accessed on 1 September 2020).
- Ahmar, A.S.; del Val, E.B. SutteARIMA: Short-Term Forecasting Method, a Case: Covid-19 and Stock Market in Spain. Sci. Total Environ. 2020, 729, 138883. [Google Scholar] [CrossRef] [PubMed]
- Al-Awadhi, A.M.; Alsaifi, K.; Al-Awadhi, A.; Alhammadi, S. Death and Contagious Infectious Diseases: Impact of the COVID-19 Virus on Stock Market Returns. J. Behav. Exp. Financ. 2020, 27, 100326. [Google Scholar] [CrossRef] [PubMed]
- Boubaker, H.; Raza, S.A. On the Dynamic Dependence and Asymmetric Co-Movement between the US and Central and Eastern European Transition Markets. Phys. A Stat. Mech. Its Appl. 2016, 459, 9–23. [Google Scholar] [CrossRef]
- Karkowska, R.; Urjasz, S. Connectedness Structures of Sovereign Bond Markets in Central and Eastern Europe. Int. Rev. Financ. Anal. 2021, 74, 101644. [Google Scholar] [CrossRef]
- Olbryś, J.; Majewska, E. Increasing Cross-Market Correlations during the 2007–2009 Global Financial Crisis: Contagion or Integration Effects? Argum. Oeconomica 2017, 39, 263–278. [Google Scholar] [CrossRef]
- Gao, H.L.; Mei, D.C. The Correlation Structure in the International Stock Markets during Global Financial Crisis. Phys. A Stat. Mech. Its Appl. 2019, 534, 122056. [Google Scholar] [CrossRef]
- Haluszczynski, A.; Laut, I.; Modest, H.; Räth, C. Linear and Nonlinear Market Correlations: Characterizing Financial Crises and Portfolio Optimization. Phys. Rev. E 2017, 96, 062315. [Google Scholar] [CrossRef] [Green Version]
- Onnela, J.P.; Chakraborti, A.; Kaski, K.; Kertész, J.; Kanto, A. Dynamics of Market Correlations: Taxonomy and Portfolio Analysis. Phys. Rev. E 2003, 68, 056110. [Google Scholar] [CrossRef] [Green Version]
- Serwa, D.; Bohl, M.T. Financial Contagion Vulnerability and Resistance: A Comparison of European Stock Markets. Econ. Syst. 2005, 29, 344–362. [Google Scholar] [CrossRef]
- Ashraf, B.N. Stock Markets’ Reaction to COVID-19: Cases or Fatalities? Res. Int. Bus. Financ. 2020, 54, 101249. [Google Scholar] [CrossRef]
- Zhang, D.; Hu, M.; Ji, Q. Financial Markets under the Global Pandemic of COVID-19. Financ. Res. Lett. 2020, 36, 101528. [Google Scholar] [CrossRef] [PubMed]
- Akhtaruzzaman, M.; Boubaker, S.; Sensoy, A. Financial Contagion during COVID–19 Crisis. Financ. Res. Lett. 2020, 38, 101604. [Google Scholar] [CrossRef] [PubMed]
- Zaremba, A.; Kizys, R.; Aharon, D.Y.; Demir, E. Infected Markets: Novel Coronavirus, Government Interventions, and Stock Return Volatility around the Globe. Financ. Res. Lett. 2020, 35, 101597. [Google Scholar] [CrossRef]
- Sharif, A.; Aloui, C.; Yarovaya, L. COVID-19 Pandemic, Oil Prices, Stock Market, Geopolitical Risk and Policy Uncertainty Nexus in the US Economy: Fresh Evidence from the Wavelet-Based Approach. Int. Rev. Financ. Anal. 2020, 70, 101496. [Google Scholar] [CrossRef]
- Topcu, M.; Gulal, O.S. The Impact of COVID-19 on Emerging Stock Markets. Financ. Res. Lett. 2020, 36, 101691. [Google Scholar] [CrossRef]
- Czech, K.; Wielechowski, M.; Kotyza, P.; Benešová, I.; Laputková, A. Shaking Stability: COVID-19 Impact on the Visegrad Group Countries’ Financial Markets. Sustainability 2020, 12, 6282. [Google Scholar] [CrossRef]
- Qiu, L.; Yang, H. Transfer Entropy Calculation for Short Time Sequences with Application to Stock Markets. Phys. A Stat. Mech. Its Appl. 2020, 559, 125121. [Google Scholar] [CrossRef]
- Kuang, P.C. Measuring Information Flow among International Stock Markets: An Approach of Entropy-Based Networks on Multi Time-Scales. Phys. A Stat. Mech. Its Appl. 2021, 577, 126068. [Google Scholar] [CrossRef]
- Karaca, Y.; Zhang, Y.D.; Muhammad, K. Characterizing Complexity and Self-Similarity Based on Fractal and Entropy Analyses for Stock Market Forecast Modelling. Expert Syst. Appl. 2020, 144, 113098. [Google Scholar] [CrossRef]
- Barbi, A.Q.; Prataviera, G.A. Nonlinear Dependencies on Brazilian Equity Network from Mutual Information Minimum Spanning Trees. Phys. A Stat. Mech. Its Appl. 2019, 523, 876–885. [Google Scholar] [CrossRef] [Green Version]
- Ponta, L.; Carbone, A. Information Measure for Financial Time Series: Quantifying Short-Term Market Heterogeneity. Phys. A Stat. Mech. Its Appl. 2018, 510, 132–144. [Google Scholar] [CrossRef]
- Guo, X.; Zhang, H.; Tian, T. Development of Stock Correlation Networks Using Mutual Information and Financial Big Data. PLoS ONE 2018, 13, e0195941. [Google Scholar] [CrossRef] [PubMed]
- You, T.; Fiedor, P.; Hołda, A. Network Analysis of the Shanghai Stock Exchange Based on Partial Mutual Information. J. Risk Financ. Manag. 2015, 8, 266–284. [Google Scholar] [CrossRef] [Green Version]
- Sharma, C.; Habib, A. Mutual Information Based Stock Networks and Portfolio Selection for Intraday Traders Using High Frequency Data: An Indian Market Case Study. PLoS ONE 2019, 14, e0221910. [Google Scholar] [CrossRef] [PubMed] [Green Version]
- Villaverde, A.F.; Ross, J.; Morán, F.; Banga, J.R. MIDER: Network Inference with Mutual Information Distance and Entropy Reduction. PLoS ONE 2014, 9, e96732. [Google Scholar] [CrossRef] [PubMed] [Green Version]
- Fiedor, P. Networks in Financial Markets Based on the Mutual Information Rate. Phys. Rev. E 2014, 89, 052801. [Google Scholar] [CrossRef] [Green Version]
- Dima, B.; Dima, Ş.M. Mutual Information and Persistence in the Stochastic Volatility of Market Returns: An Emergent Market Example. Int. Rev. Econ. Financ. 2017, 51, 36–59. [Google Scholar] [CrossRef]
- Caginalp, G.; Desantis, M. Nonlinearity in the Dynamics of Financial Markets. Nonlinear Anal. Real World Appl. 2011, 12, 1140–1151. [Google Scholar] [CrossRef]
- Khoojine, A.S.; Han, D. Network Analysis of the Chinese Stock Market during the Turbulence of 2015–2016 Using Log-Returns, Volumes and Mutual Information. Phys. A Stat. Mech. Its Appl. 2019, 523, 1091–1109. [Google Scholar] [CrossRef]
- Ferreira, P.; Dionísio, A.; Almeida, D.; Quintino, D.; Aslam, F. A New Vision about the Influence of Major Stock Markets in CEEC Indices: A Bidirectional Dynamic Analysis Using Transfer Entropy. Post-Communist Econ. 2021, 1–16. [Google Scholar] [CrossRef]
- MSCI Global Market Accessibility Review. 2020. Available online: https://www.msci.com/documents/1296102/1330218/MSCI_2021_Global_Market_Accessibility_Review_Report.pdf/d88d8bc0-a882-58c7-35f0-bef191e0ebe2 (accessed on 9 February 2022).
- Forbes, K.J.; Rigobon, R. No Contagion, Only Interdependence: Measuring Stock Market Comovements. J. Financ. 2002, 57, 2223–2261. [Google Scholar] [CrossRef]
- Rigobon, R. Contagion: How to Measure It? In Preventing Currency Crises in Emerging Markets; University of Chicago Press: Chicago, IL, USA, 2002; pp. 269–334. [Google Scholar]
- Hon, M.T.; Strauss, J.; Yong, S.K. Contagion in Financial Markets after September 11: Myth or Reality? J. Financ. Res. 2004, 27, 95–114. [Google Scholar] [CrossRef]
- Larntz, K.; Perlman, M.D. A Simple Test for the Equality of Correlation Matrices. 1985. Available online: https://citeseerx.ist.psu.edu/viewdoc/download?doi=10.1.1.142.7301&rep=rep1&type=pdf (accessed on 9 February 2022).
- Longin, F.; Solnik, B. Is the Correlation in International Equity Returns Constant: 1960-1990? J. Int. Money Financ. 1995, 14, 3–26. [Google Scholar] [CrossRef]
- Papana, A.; Kugiumtzis, D. Evaluation of Mutual Information Estimators on Nonlinear Dynamic Systems. arXiv 2008, arXiv:0809.2149. [Google Scholar]
- Moon, Y.-I.; Rajagopalan, B.; Lall, U. Estimation of Mutual Information Using Kernel Density Estimators. Phys. Rev. E 1995, 52, 2318. [Google Scholar] [CrossRef]
- Kraskov, A.; Stögbauer, H.; Grassberger, P. Estimating Mutual Information. Phys. Rev. E 2004, 69, 16. [Google Scholar] [CrossRef] [Green Version]
- Darbellay, G.A.; Vajda, I. Estimation of the Information by an Adaptive Partitioning of the Observation Space. IEEE Trans. Inf. Theory 1999, 45, 1315–1321. [Google Scholar] [CrossRef] [Green Version]
- Steuer, R.; Kurths, J.; Daub, C.O.; Weise, J.; Selbig, J. The Mutual Information: Detecting and Evaluating Dependencies between Variables. Bioinformatics 2002, 18, S231–S240. [Google Scholar] [CrossRef] [Green Version]
- Daub, C.O.; Steuer, R.; Selbig, J.; Kloska, S. Estimating Mutual Information Using B-Spline Functions–an Improved Similarity Measure for Analysing Gene Expression Data. BMC Bioinform. 2004, 5, 1–12. [Google Scholar] [CrossRef] [Green Version]
- Cellucci, C.J.; Albano, A.M.; Rapp, P.E. Statistical Validation of Mutual Information Calculations: Comparison of Alternative Numerical Algorithms. Phys. Rev. E 2005, 71, 066208. [Google Scholar] [CrossRef] [Green Version]
- Darbellay, G.A. An Estimator of the Mutual Information Based on a Criterion for Independence. Comput. Stat. 1999, 32, 1–17. [Google Scholar] [CrossRef]
- Dionisio, A.; Menezes, R.; Mendes, D.A. An Econophysics Approach to Analyse Uncertainty in Financial Markets: An Application to the Portuguese Stock Market. Eur. Phys. J. B 2006, 50, 161–164. [Google Scholar] [CrossRef] [Green Version]
- Schreiber, T. Measuring Information Transfer. Phys. Rev. Lett. 2000, 85, 461–464. [Google Scholar] [CrossRef] [PubMed] [Green Version]
- Kwon, O.; Yang, J.S. Information Flow between Composite Stock Index and Individual Stocks. Phys. A Stat. Mech. Its Appl. 2008, 387, 2851–2856. [Google Scholar] [CrossRef] [Green Version]
- Onnela, J.P.; Kaski, K.; Kertész, J. Clustering and Information in Correlation Based Financial Networks. Eur. Phys. J. B 2004, 38, 353–362. [Google Scholar] [CrossRef]
- Kaiser, A.; Schreiber, T. Information Transfer in Continuous Processes. Phys. D Nonlinear Phenom. 2002, 166, 43–62. [Google Scholar] [CrossRef]
- Barnett, L.; Barrett, A.B.; Seth, A.K. Granger Causality and Transfer Entropy Are Equivalent for Gaussian Variables. Phys. Rev. Lett. 2009, 103, 2–5. [Google Scholar] [CrossRef] [Green Version]
- Montalto, A.; Faes, L.; Marinazzo, D. MuTE: A MATLAB Toolbox to Compare Established and Novel Estimators of the Multivariate Transfer Entropy. PLoS ONE 2014, 9, e109462. [Google Scholar] [CrossRef] [Green Version]
- Aslam, F.; Nogueiro, F.; Brasil, M.; Ferreira, P.; Mughal, K.S.; Bashir, B.; Latif, S. The Footprints of COVID-19 on Central Eastern European Stock Markets: An Intraday Analysis. Post-Communist Econ. 2021, 33, 751–769. [Google Scholar] [CrossRef]
- Shehzad, K.; Xiaoxing, L.; Kazouz, H. COVID-19’s Disasters Are Perilous than Global Financial Crisis: A Rumor or Fact? Financ. Res. Lett. 2020, 36, 101669. [Google Scholar] [CrossRef]
- Tilfani, O.; Ferreira, P.; El Boukfaoui, M.Y. Revisiting Stock Market Integration in Central and Eastern European Stock Markets with a Dynamic Analysis. Post-Communist Econ. 2020, 32, 643–674. [Google Scholar] [CrossRef]
- Stoica, O.; Diaconașu, D.-E. Analysis of Interdependencies between Austrian and CEE Stock Markets. 2011. Available online: https://scholar.google.com/scholar?hl=en&as_sdt=0%2C5&q=56.%09Stoica%2C+O.%3B+Diacona%C8%99u%2C+D.-E.+Analysis+of+Interdependencies+between+Austrian+and+CEE+Stock+Markets.+Sch.+Bus.+Administration&btnG= (accessed on 9 February 2022).
- Gradojević, N.; Dobardžić, E. Causality between Regional Stock Markets: A Frequency Domain Approach. Panoeconomicus 2013, 60, 633–647. [Google Scholar] [CrossRef]
- Ferreira, P. What Guides Central and Eastern European Stock Markets? A View from Detrended Methodologies. Post-Communist Econ. 2018, 30, 805–819. [Google Scholar] [CrossRef]
- Grabowski, W. Givers or Recipients? Co-Movements between Stock Markets of CEE-3 and Developed Countries. Sustainability 2019, 11, 6495. [Google Scholar] [CrossRef] [Green Version]


| Index | Mean | Standard Deviation | Skewness | Excess Kurtosis | Doornik–Hansen Test |
|---|---|---|---|---|---|
| SPX | 0.0001839 | 0.0131 | −0.482 [0.000] | 10.584 [0.000] | 4805.214 [0.000] |
| UKX | −0.0000148 | 0.0124 | −0.289 [0.000] | 7.956 [0.000] | 1515.870 [0.000] |
| CAC | −0.0000208 | 0.0152 | −0.297 [0.000] | 6.630 [0.000] | 1892.501 [0.000] |
| DAX | 0.0001436 | 0.0156 | −0.251 [0.000] | 5.931 [0.000] | 2270.681 [0.000] |
| WIG20 | 0.0000092 | 0.0157 | −0.288 [0.000] | 5.111 [0.000] | 819.241 [0.000] |
| PX | 0.0001328 | 0.0143 | −1.041 [0.000] | 19.041 [0.000] | 7536.307 [0.000] |
| BUX | 0.0003067 | 0.0156 | 0.123 [0.000] | 13.298 [0.000] | 3660.866 [0.000] |
| Index | Contemporaneous Cross-Correlations | Adjusted Correlations ([33]) | ||||||||
|---|---|---|---|---|---|---|---|---|---|---|
| Complete Sample (1) | Pre-Crisis (2) | Crisis (3) | Crisis (3) | |||||||
| Change Compared to the Period (2) | Z-Statistic | Hypothesis | Change Compared to the Period (2) | Z-Statistic | Hypothesis | |||||
| UKX | 0.598 [0.000] | 0.595 [0.000] | 0.600 [0.000] | 0.008 | 0.089 | H0 | 0.261 | −0.562 | −5.011 | H0 |
| CAC | 0.615 [0.000] | 0.598 [0.000] | 0.618 [0.000] | 0.034 | 0.382 | H0 | 0.273 | −0.544 | −4.917 | H0 |
| DAX | 0.634 [0.000] | 0.568 [0.000] | 0.640 [0.000] | 0.127 | 1.366 | H0 | 0.287 | −0.494 | −4.175 | H0 |
| WIG20 | 0.407 [0.000] | 0.452 [0.000] | 0.464 [0.000] | 0.027 | 0.182 | H0 | 0.185 | −0.590 | −3.586 | H0 |
| PX | 0.382 [0.000] | 0.366 [0.000] | 0.424 [0.000] | 0.157 | 0.816 | H0 | 0.166 | −0.546 | −2.592 | H0 |
| BUX | 0.395 [0.000] | 0.246 [0.000] | 0.524 [0.000] | 1.130 | 3.960 | H1 | 0.216 | −0.121 | −0.376 | H0 |
| Index | Contemporaneous Cross-Correlations | Adjusted Correlations ([33]) | ||||||||
|---|---|---|---|---|---|---|---|---|---|---|
| Complete Sample (1) | Pre-COVID-19 (2) | COVID-19 (3) | COVID-19 (3) | |||||||
| Change Compared to the Period (2) | Z-Statistic | Hypothesis | Change Compared to the Period (2) | Z-Statistic | Hypothesis | |||||
| UKX | 0.598 [0.000] | 0.726 [0.000] | 0.725 [0.000] | −0.001 | 1.651 | H0 | 0.508 | −0.300 | −0.882 | H0 |
| CAC | 0.615 [0.000] | 0.693 [0.000] | 0.729 [0.000] | 0.051 | 1.674 | H0 | 0.512 | −0.261 | −0.878 | H0 |
| DAX | 0.634 [0.000] | 0.657 [0.000] | 0.729 [0.000] | 0.110 | 1.990 | H1 | 0.512 | −0.221 | −0.559 | H0 |
| WIG20 | 0.407 [0.000] | 0.619 [0.000] | 0.650 [0.000] | 0.050 | 2.046 | H1 | 0.432 | −0.302 | −0.169 | H0 |
| PX | 0.382 [0.000] | 0.608 [0.000] | 0.630 [0.000] | 0.036 | 2.529 | H1 | 0.414 | −0.319 | 0.397 | H0 |
| BUX | 0.395 [0.000] | 0.622 [0.000] | 0.658 [0.000] | 0.058 | 3.805 | H1 | 0.440 | −0.293 | 1.560 | H0 |
| Test Periods | Larntz–Perlman Test | ||||
|---|---|---|---|---|---|
| September 2006–November 2007 and December 2007–February 2009 | 5.257 | 2.63 | 2.38 | ||
| December 2007–February 2009 and March 2009–May 2010 | 3.076 | 2.63 | 2.38 | ||
| 30 September 2019–11 March 2020 and 12 March 2020–14 August 2020 | 3.006 | 2.63 | 2.38 | ||
| Period | Group of Countries | Index | Linear Correlations | Mutual Information | Transfer Entropy |
|---|---|---|---|---|---|
| Pre-crisis | West Europe | UKX | 0.595 | 0.146 | 0.055 |
| CAC | 0.598 | 0.192 | 0.073 | ||
| DAX | 0.568 | 0.203 | 0.051 | ||
| CEE | WIG20 | 0.452 | 0.103 | 0.021 | |
| PX | 0.366 | 0.058 | 0.041 | ||
| BUX | 0.246 | 0.035 | 0.048 | ||
| Crisis | West Europe | UKX | 0.600 | 0.113 | 0.062 |
| CAC | 0.618 | 0.137 | 0.060 | ||
| DAX | 0.64 | 0.146 | 0.060 | ||
| CEE | WIG20 | 0.464 | 0.058 | 0.059 | |
| PX | 0.424 | 0.057 | 0.074 | ||
| BUX | 0.524 | 0.080 | 0.079 | ||
| Post-crisis | West Europe | UKX | 0.717 | 0.219 | 0.015 |
| CAC | 0.721 | 0.227 | 0.025 | ||
| DAX | 0.723 | 0.187 | 0.018 | ||
| CEE | WIG20 | 0.483 | 0.080 | 0.018 | |
| PX | 0.489 | 0.058 | 0.031 | ||
| BUX | 0.434 | 0.103 | 0.024 | ||
| Pre-COVID-19 | West Europe | UKX | 0.726 | 0.243 | 0.058 |
| CAC | 0.693 | 0.315 | 0.038 | ||
| DAX | 0.657 | 0.295 | 0.038 | ||
| CEE | WIG20 | 0.619 | 0.167 | 0.062 | |
| PX | 0.608 | 0.160 | 0.068 | ||
| BUX | 0.622 | 0.163 | 0.065 | ||
| COVID-19 | West Europe | UKX | 0.725 | 0.169 | 0.015 |
| CAC | 0.729 | 0.195 | 0.022 | ||
| DAX | 0.729 | 0.222 | 0.054 | ||
| CEE | WIG20 | 0.650 | 0.159 | 0.017 | |
| PX | 0.630 | 0.173 | 0.029 | ||
| BUX | 0.658 | 0.167 | 0.034 |
Publisher’s Note: MDPI stays neutral with regard to jurisdictional claims in published maps and institutional affiliations. |
© 2022 by the authors. Licensee MDPI, Basel, Switzerland. This article is an open access article distributed under the terms and conditions of the Creative Commons Attribution (CC BY) license (https://creativecommons.org/licenses/by/4.0/).
Share and Cite
Karkowska, R.; Urjasz, S. Linear and Nonlinear Effects in Connectedness Structure: Comparison between European Stock Markets. Entropy 2022, 24, 303. https://doi.org/10.3390/e24020303
Karkowska R, Urjasz S. Linear and Nonlinear Effects in Connectedness Structure: Comparison between European Stock Markets. Entropy. 2022; 24(2):303. https://doi.org/10.3390/e24020303
Chicago/Turabian StyleKarkowska, Renata, and Szczepan Urjasz. 2022. "Linear and Nonlinear Effects in Connectedness Structure: Comparison between European Stock Markets" Entropy 24, no. 2: 303. https://doi.org/10.3390/e24020303
APA StyleKarkowska, R., & Urjasz, S. (2022). Linear and Nonlinear Effects in Connectedness Structure: Comparison between European Stock Markets. Entropy, 24(2), 303. https://doi.org/10.3390/e24020303