
Simulation of Cardiac Flow under the Septal Defect Based on Lattice Boltzmann Method

 , and
, and
Abstract
1. Introduction
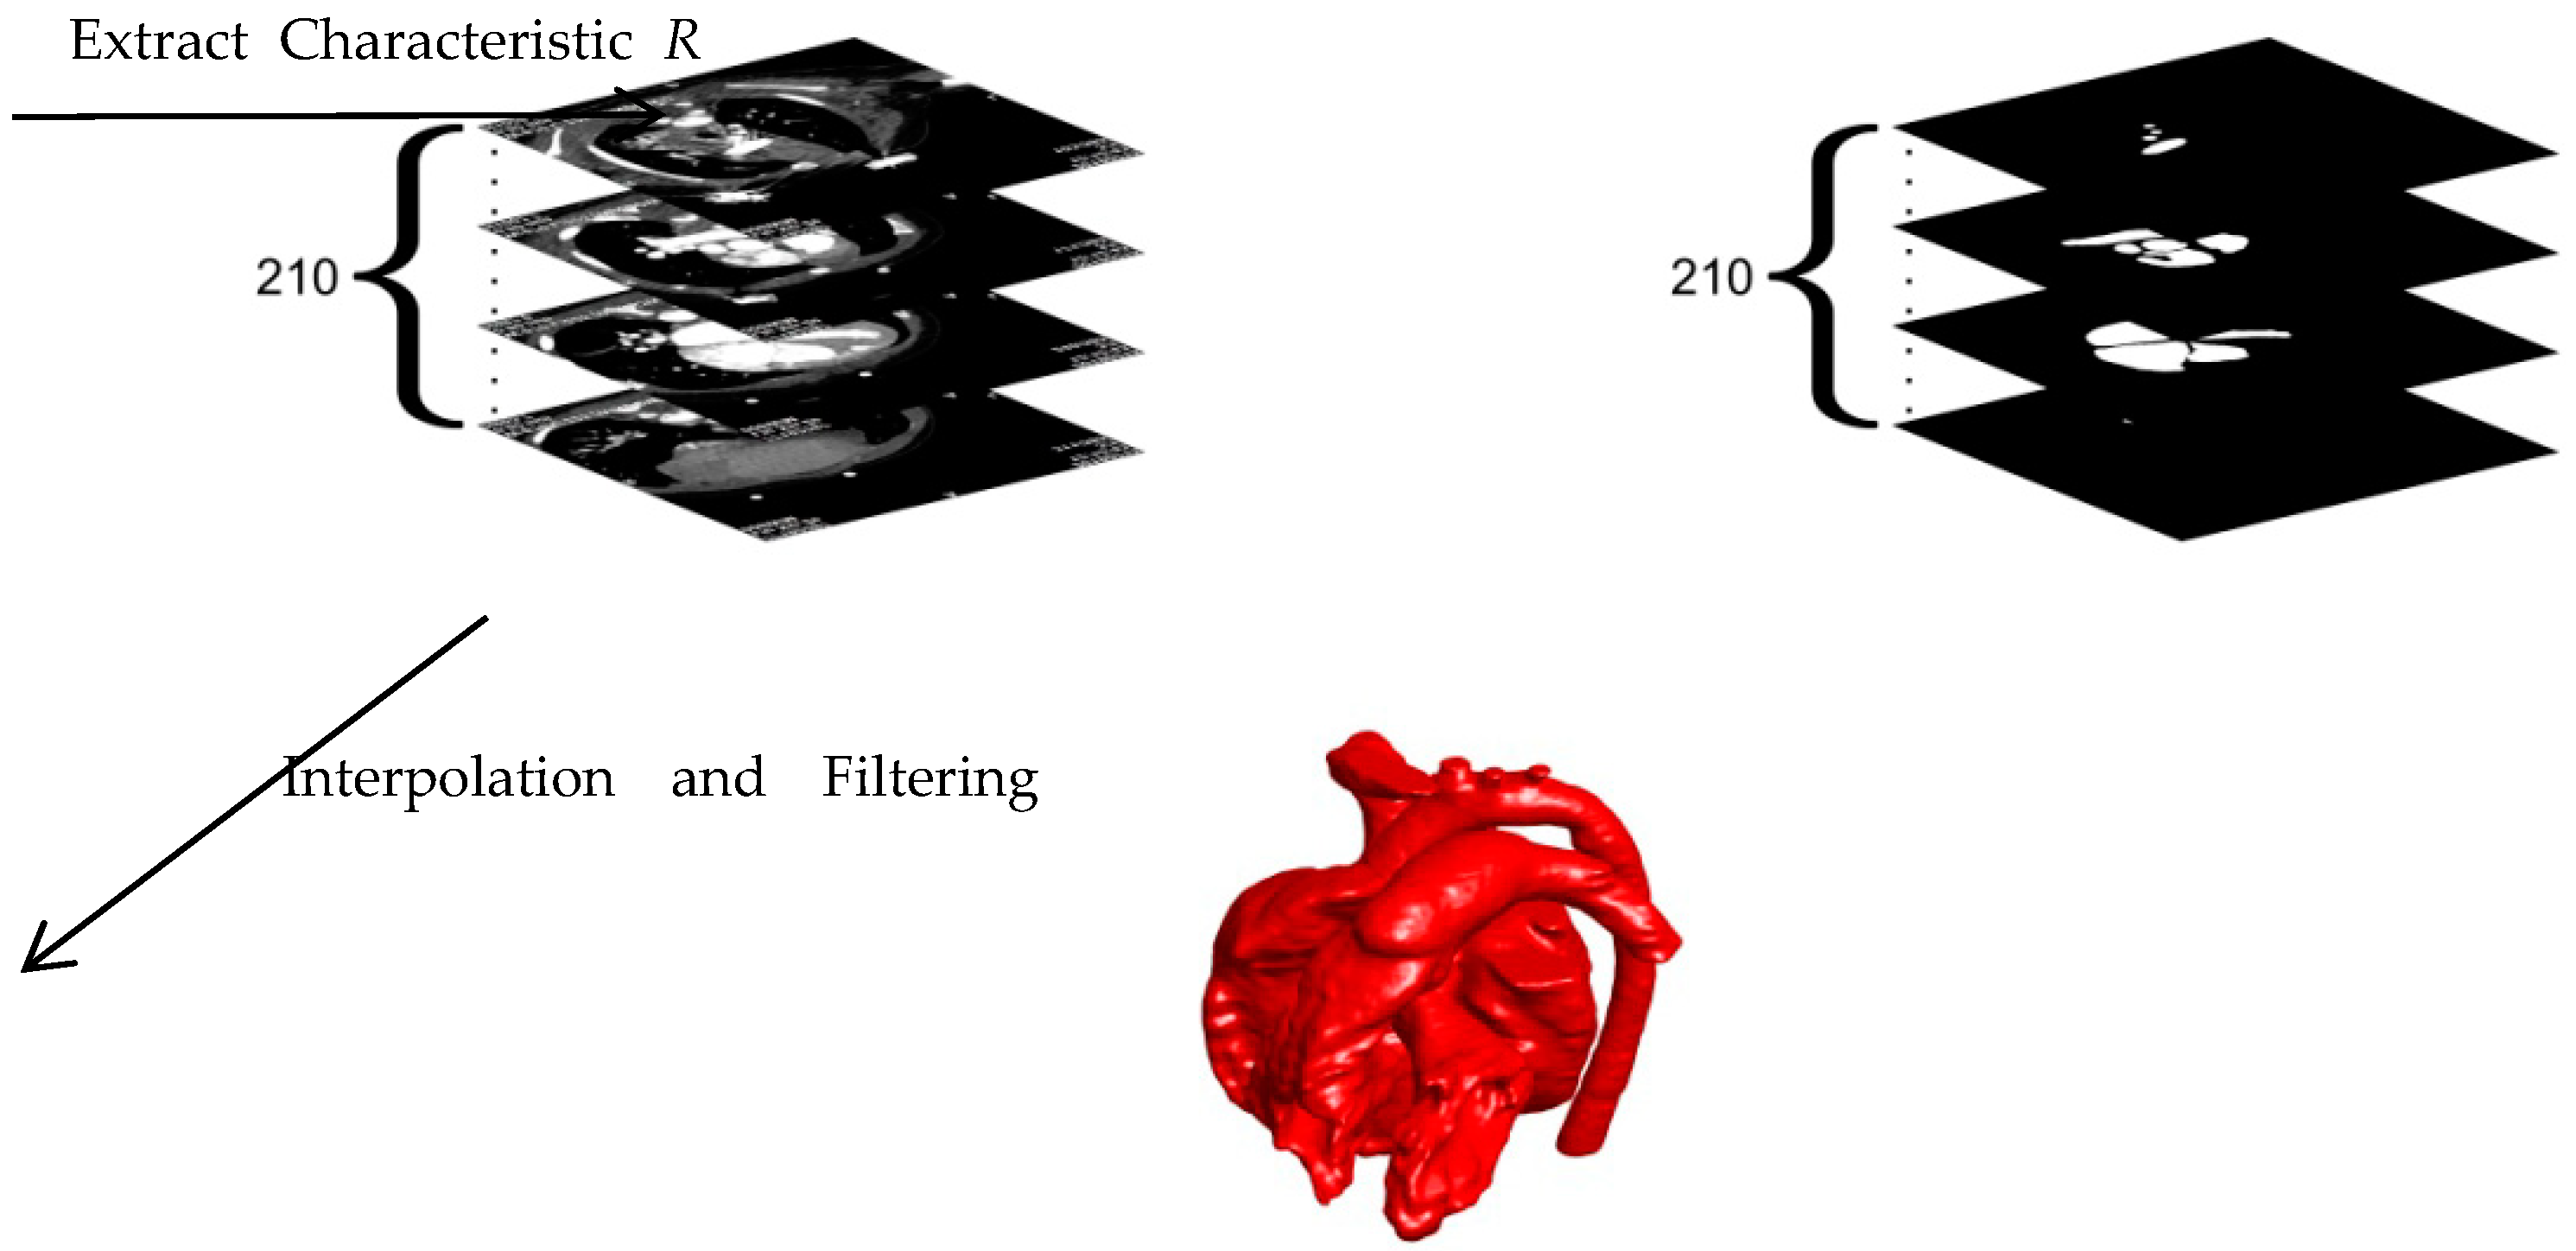
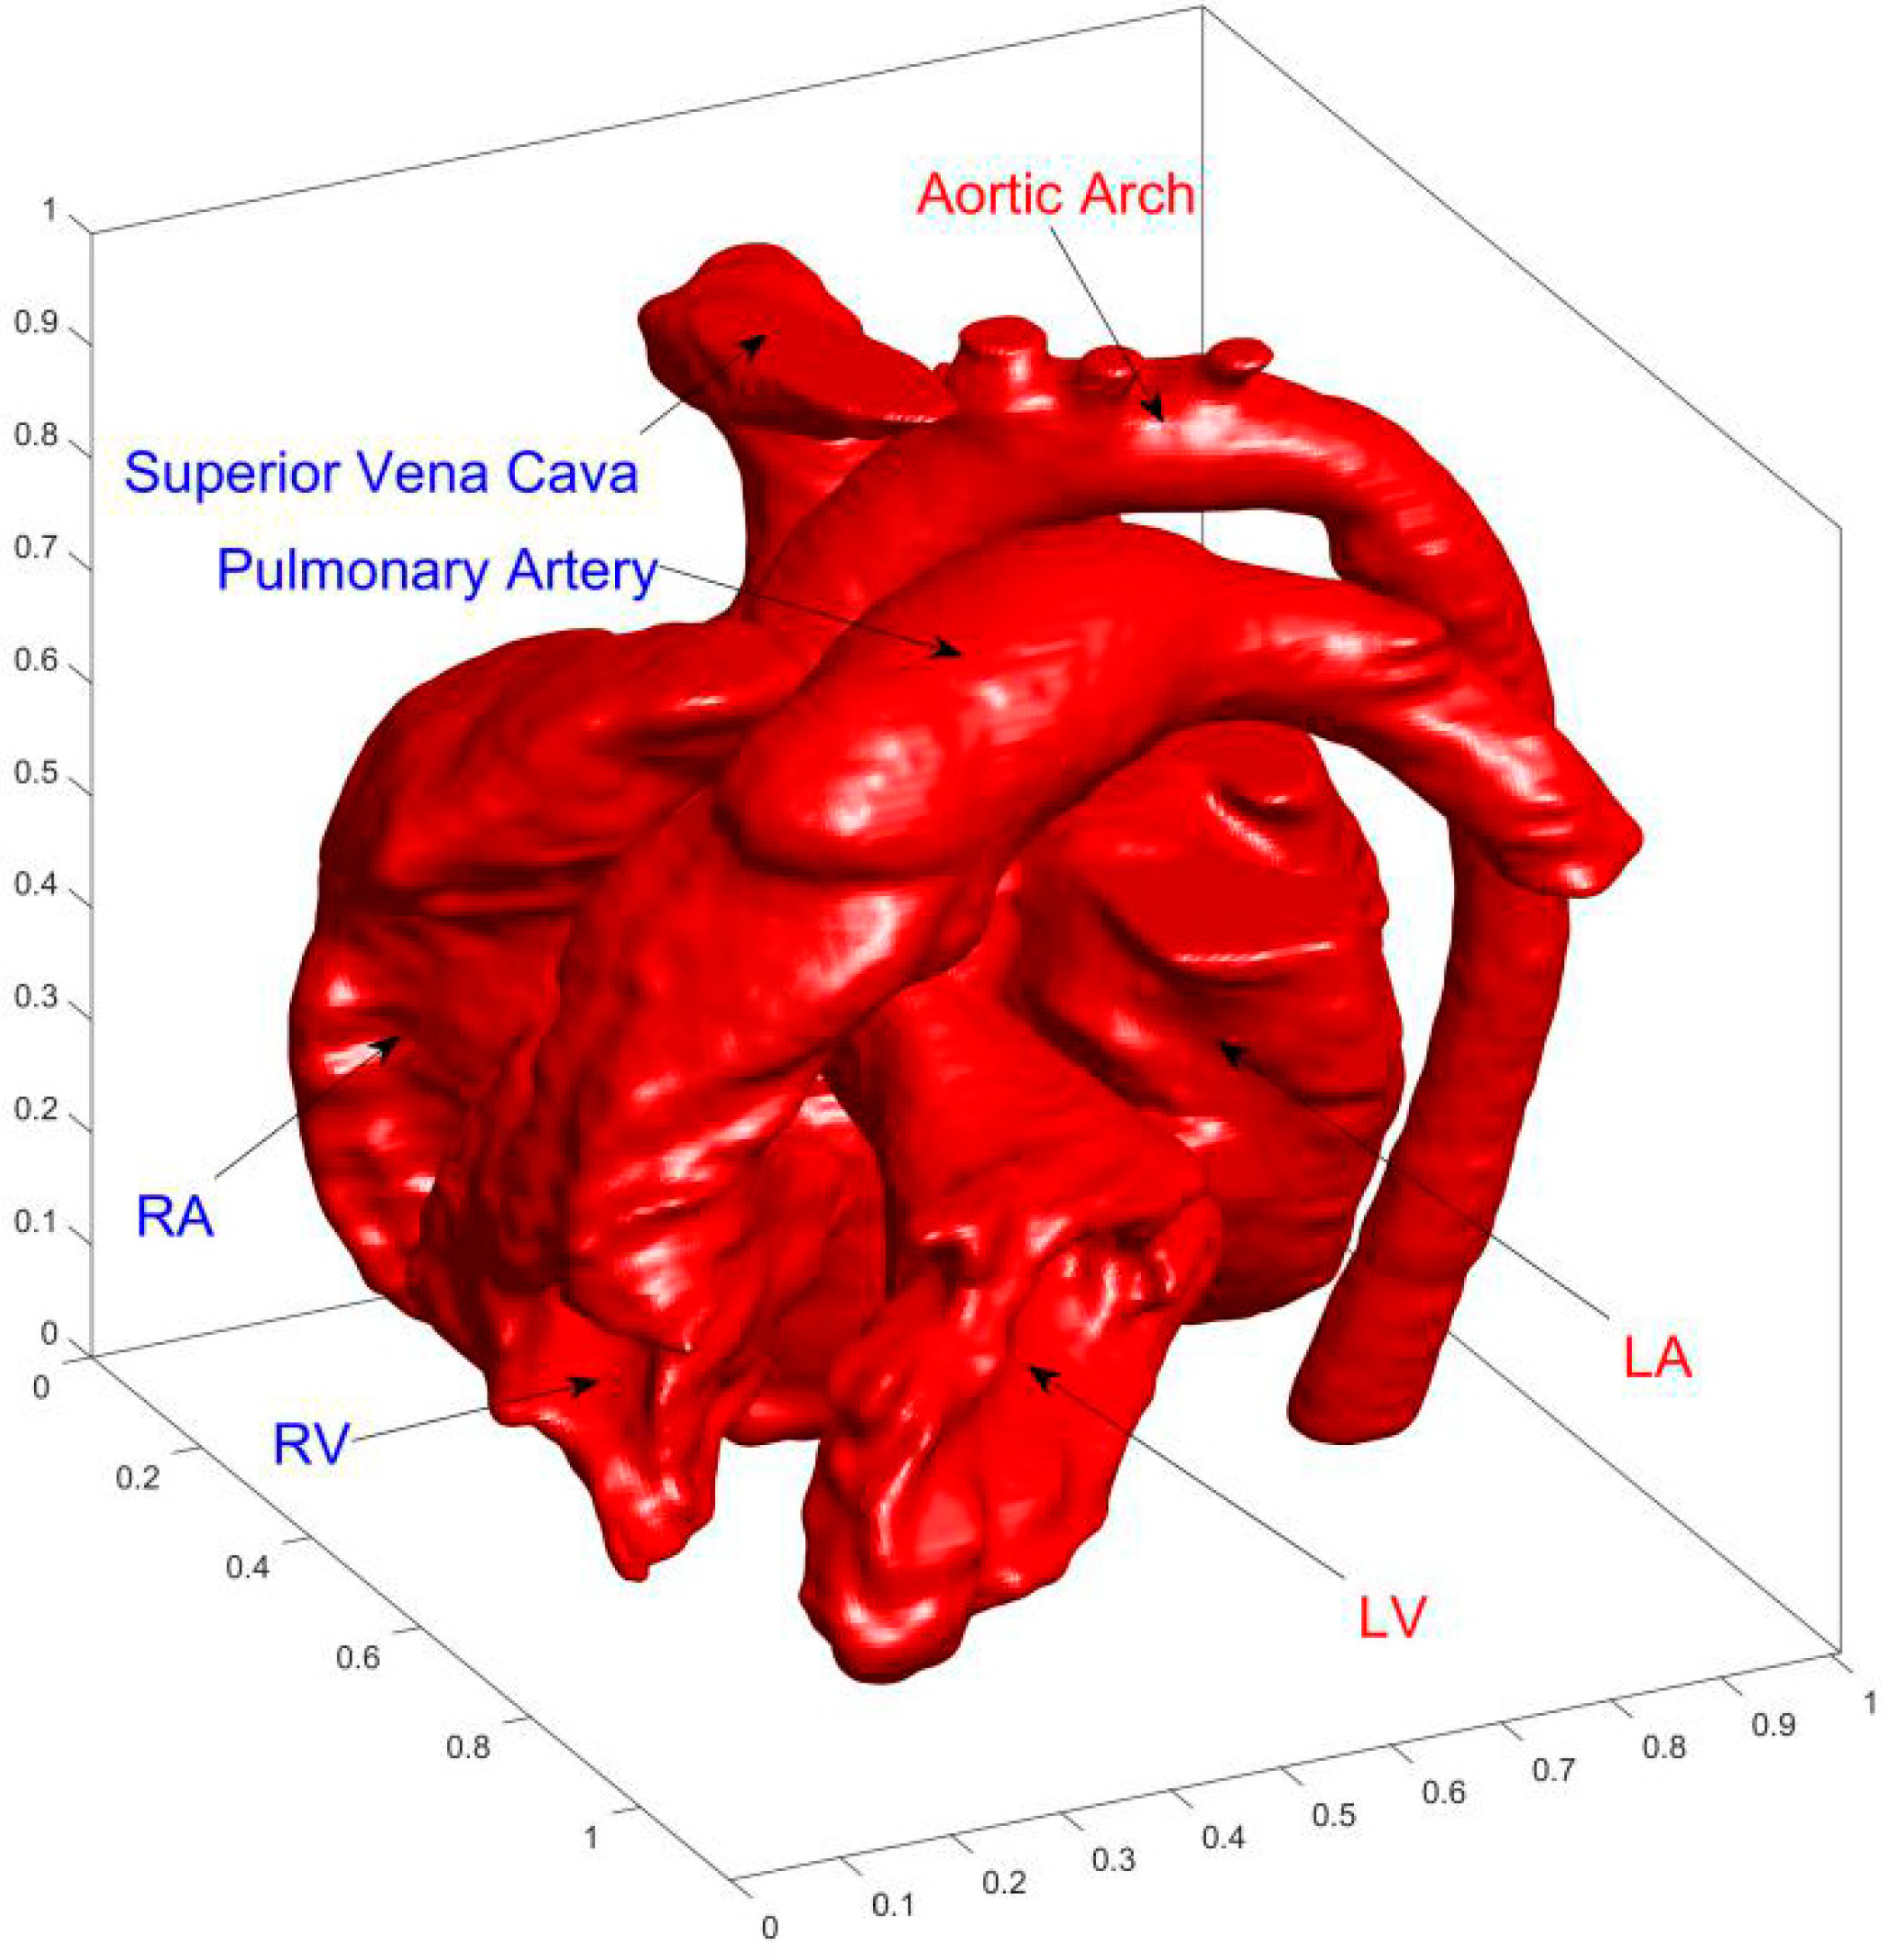
2. Modeling
3. Numerical Algorithm and Boundary Conditions
4. Results and Discussion
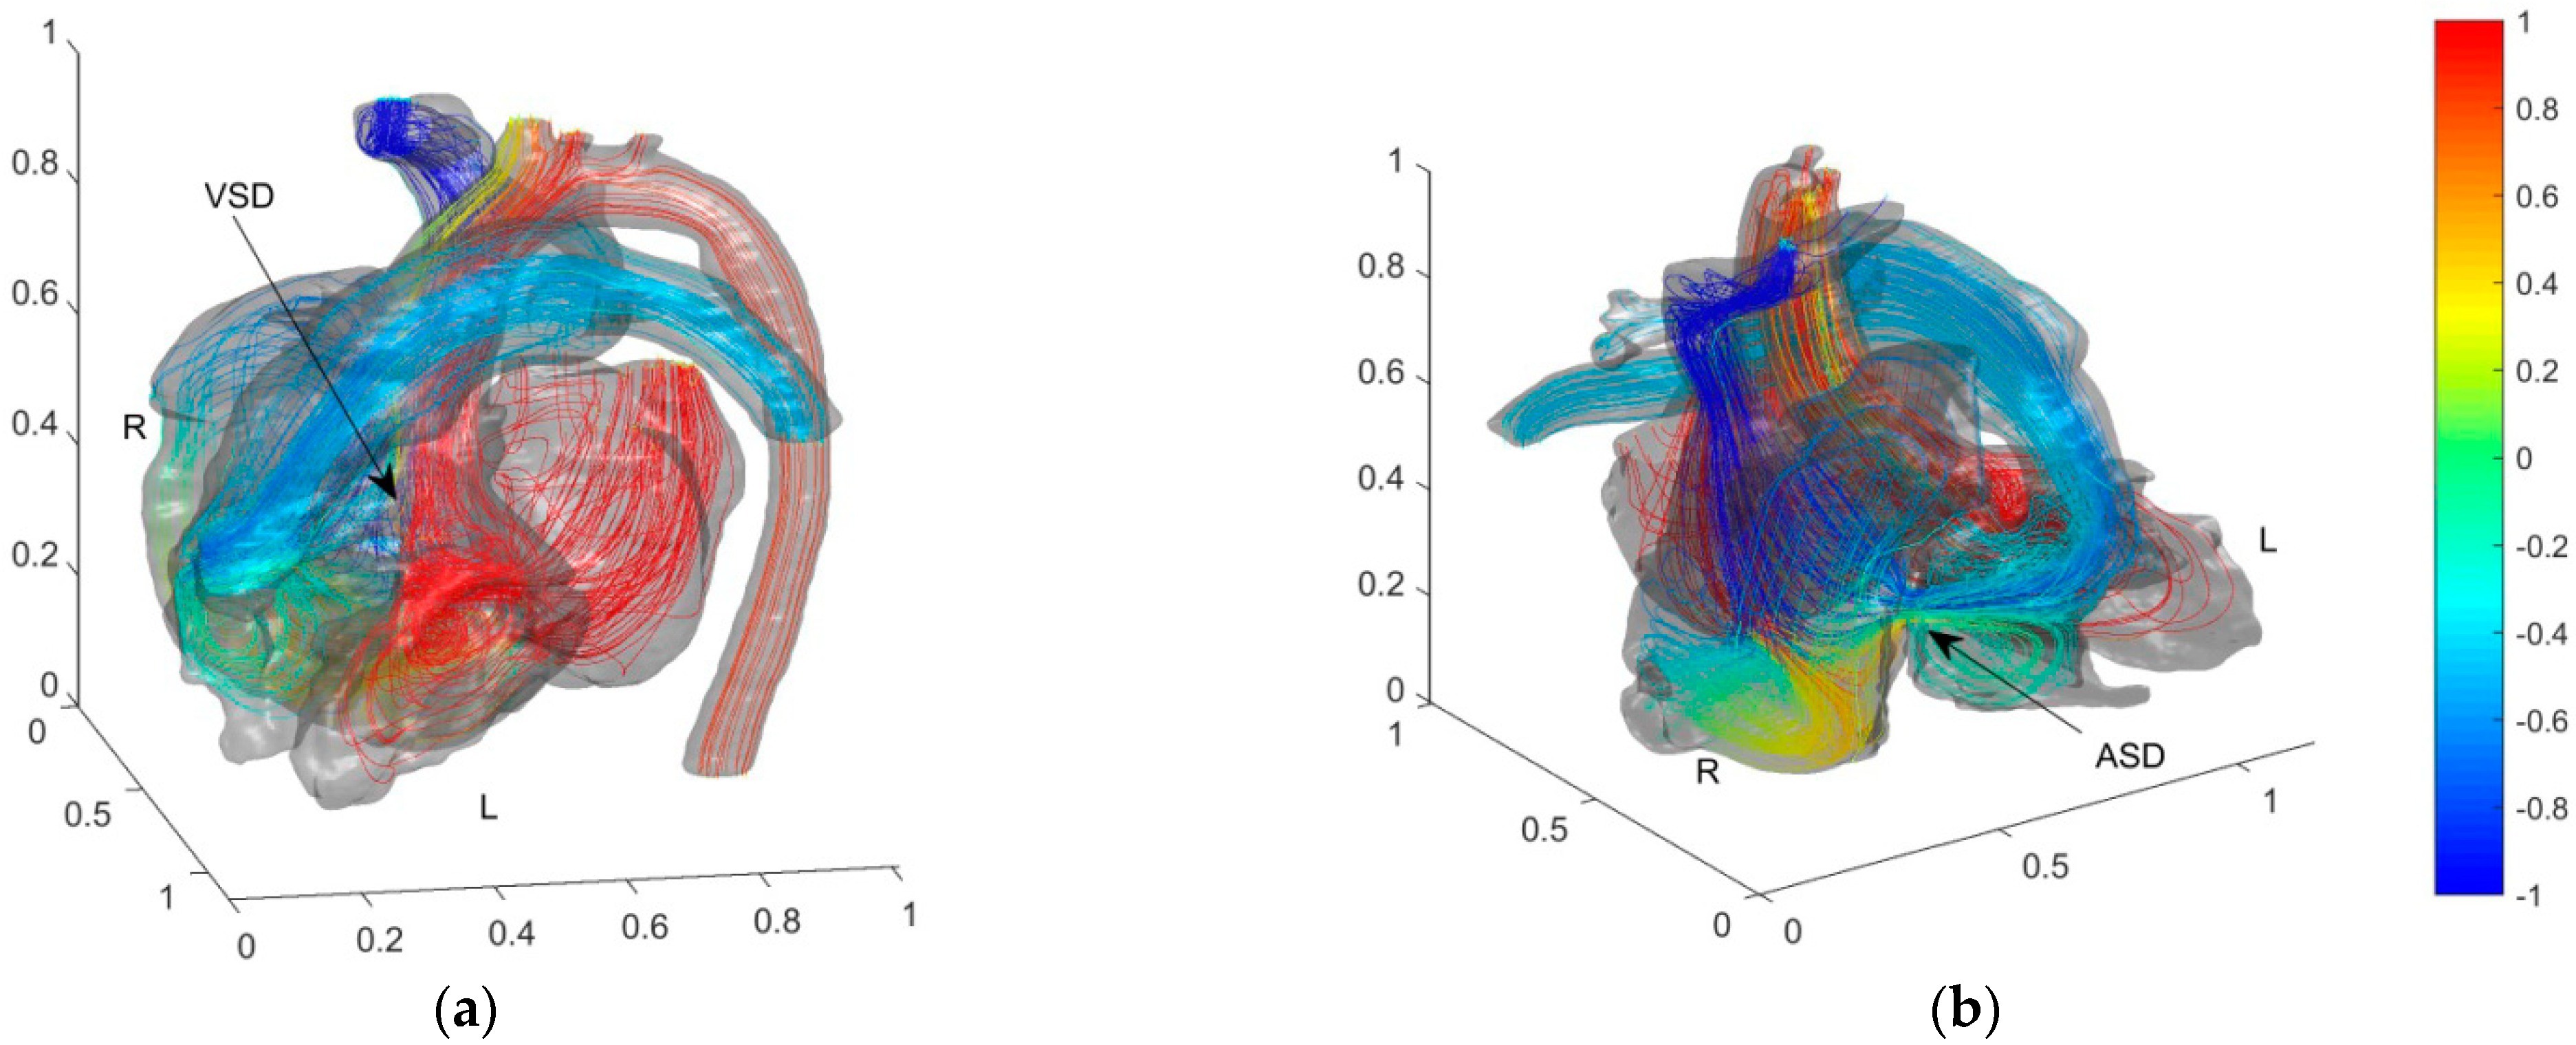
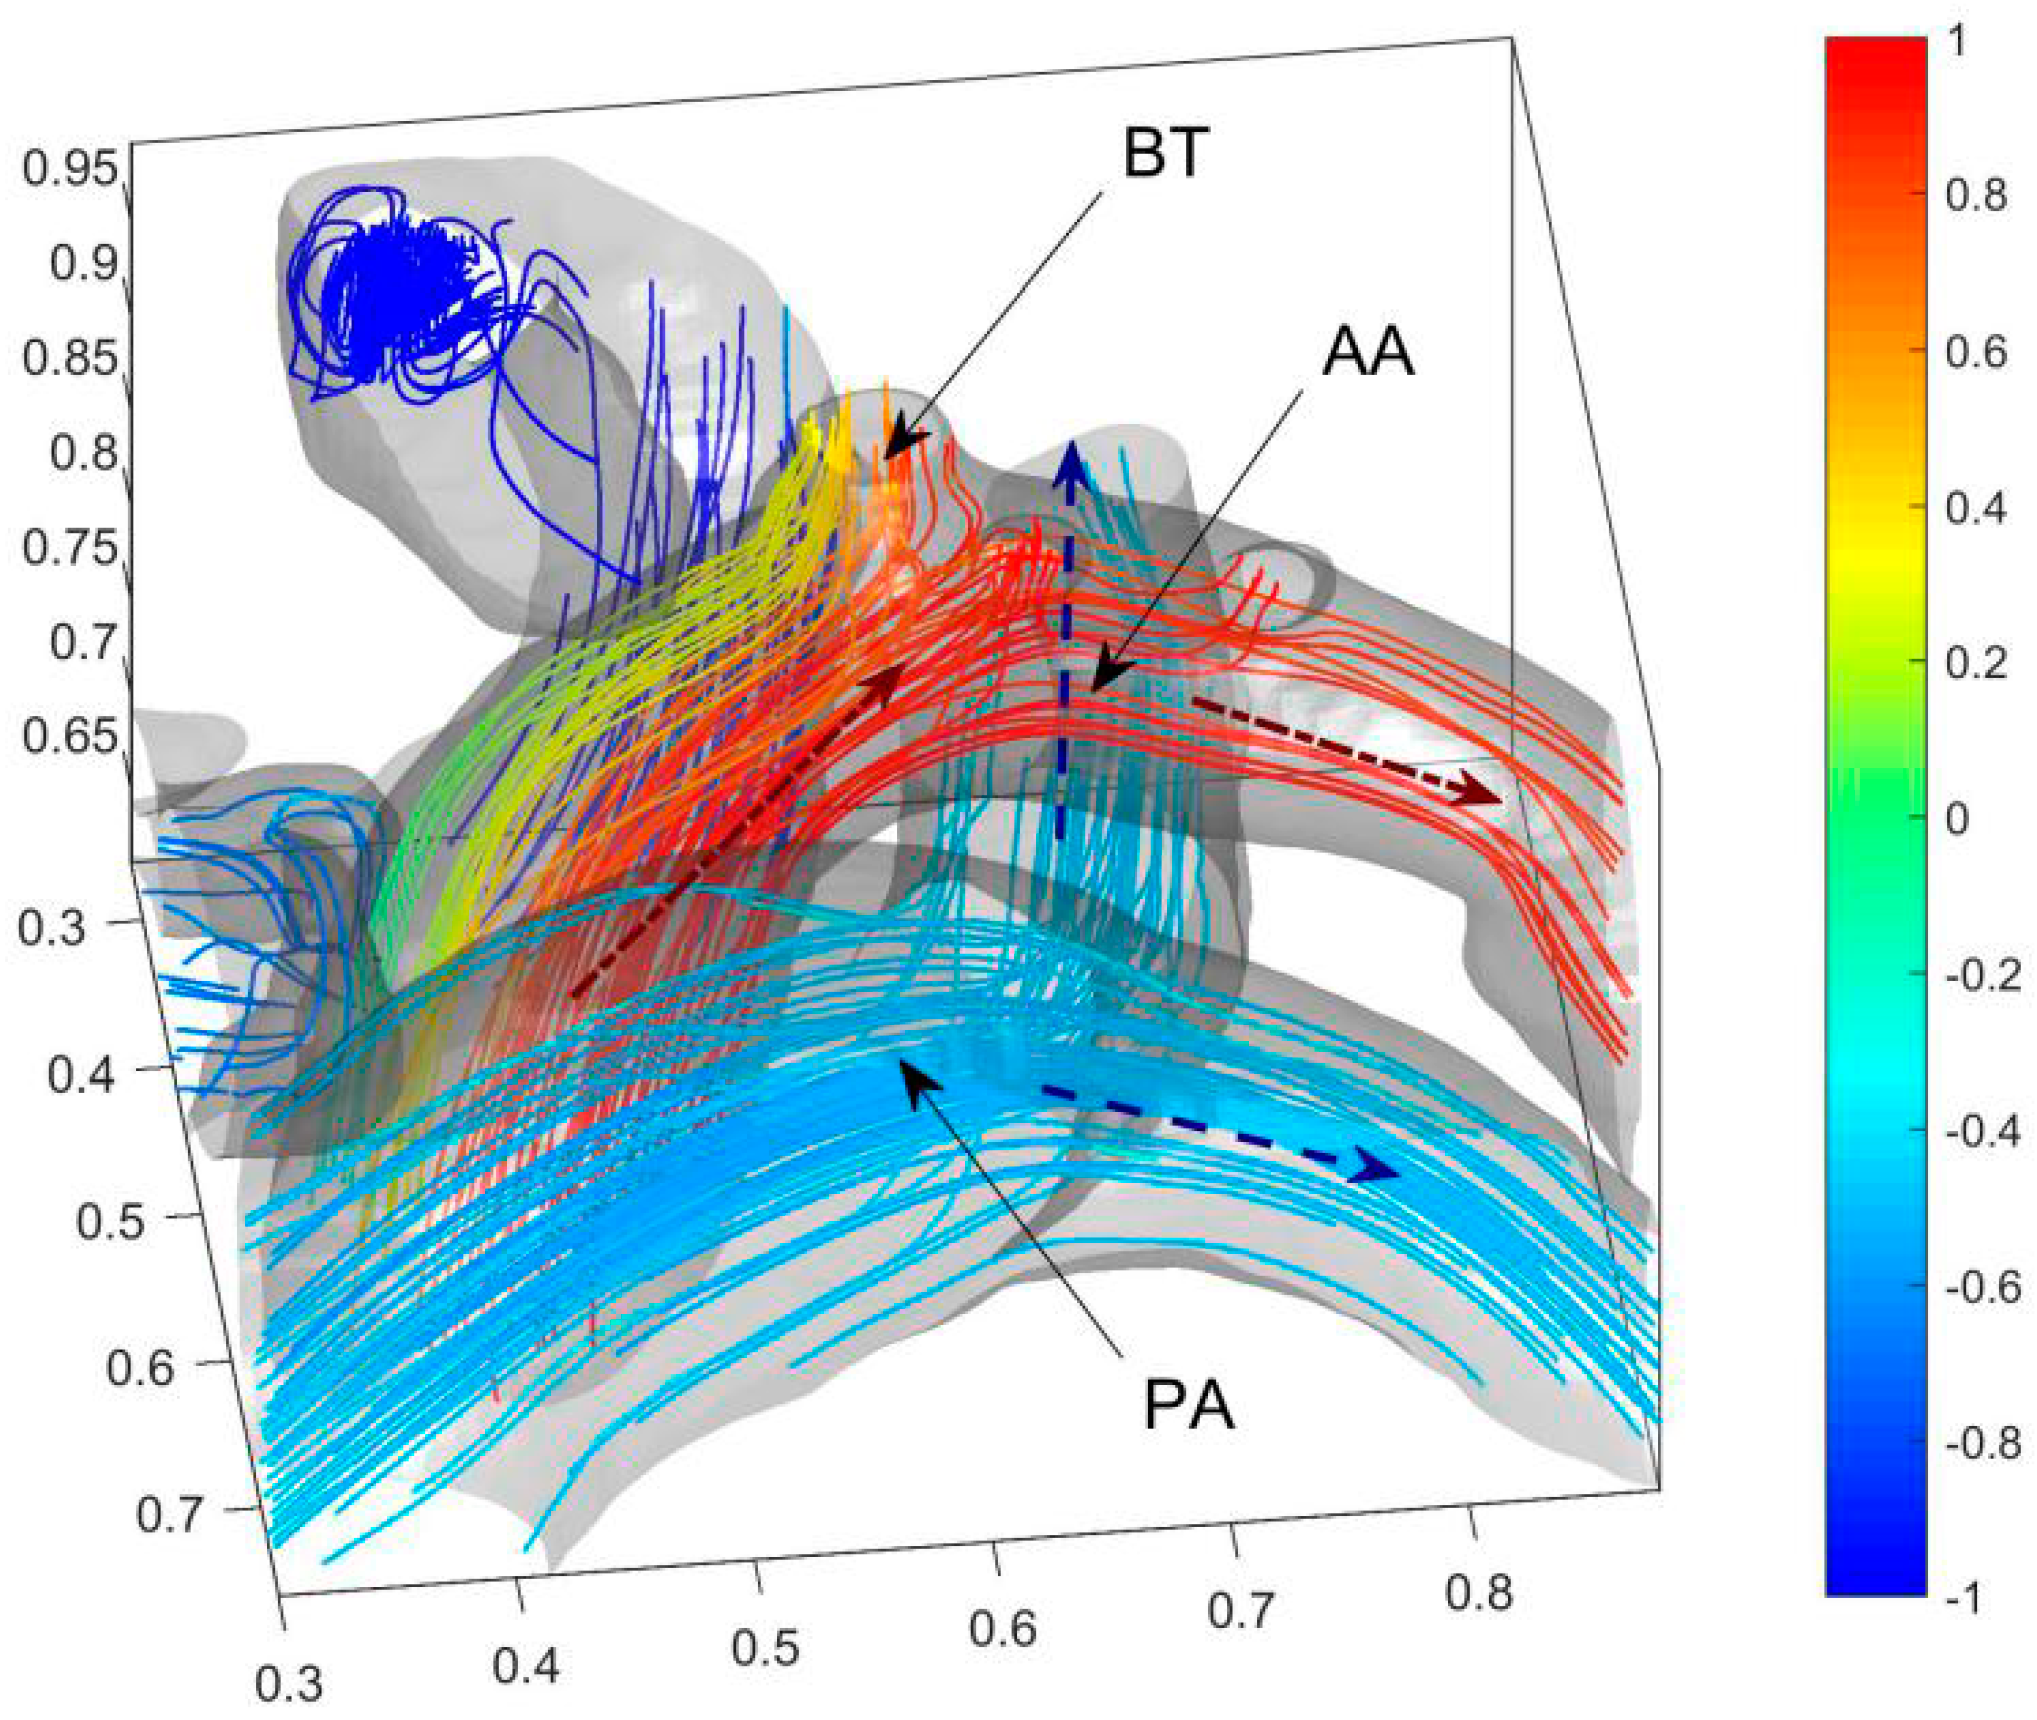
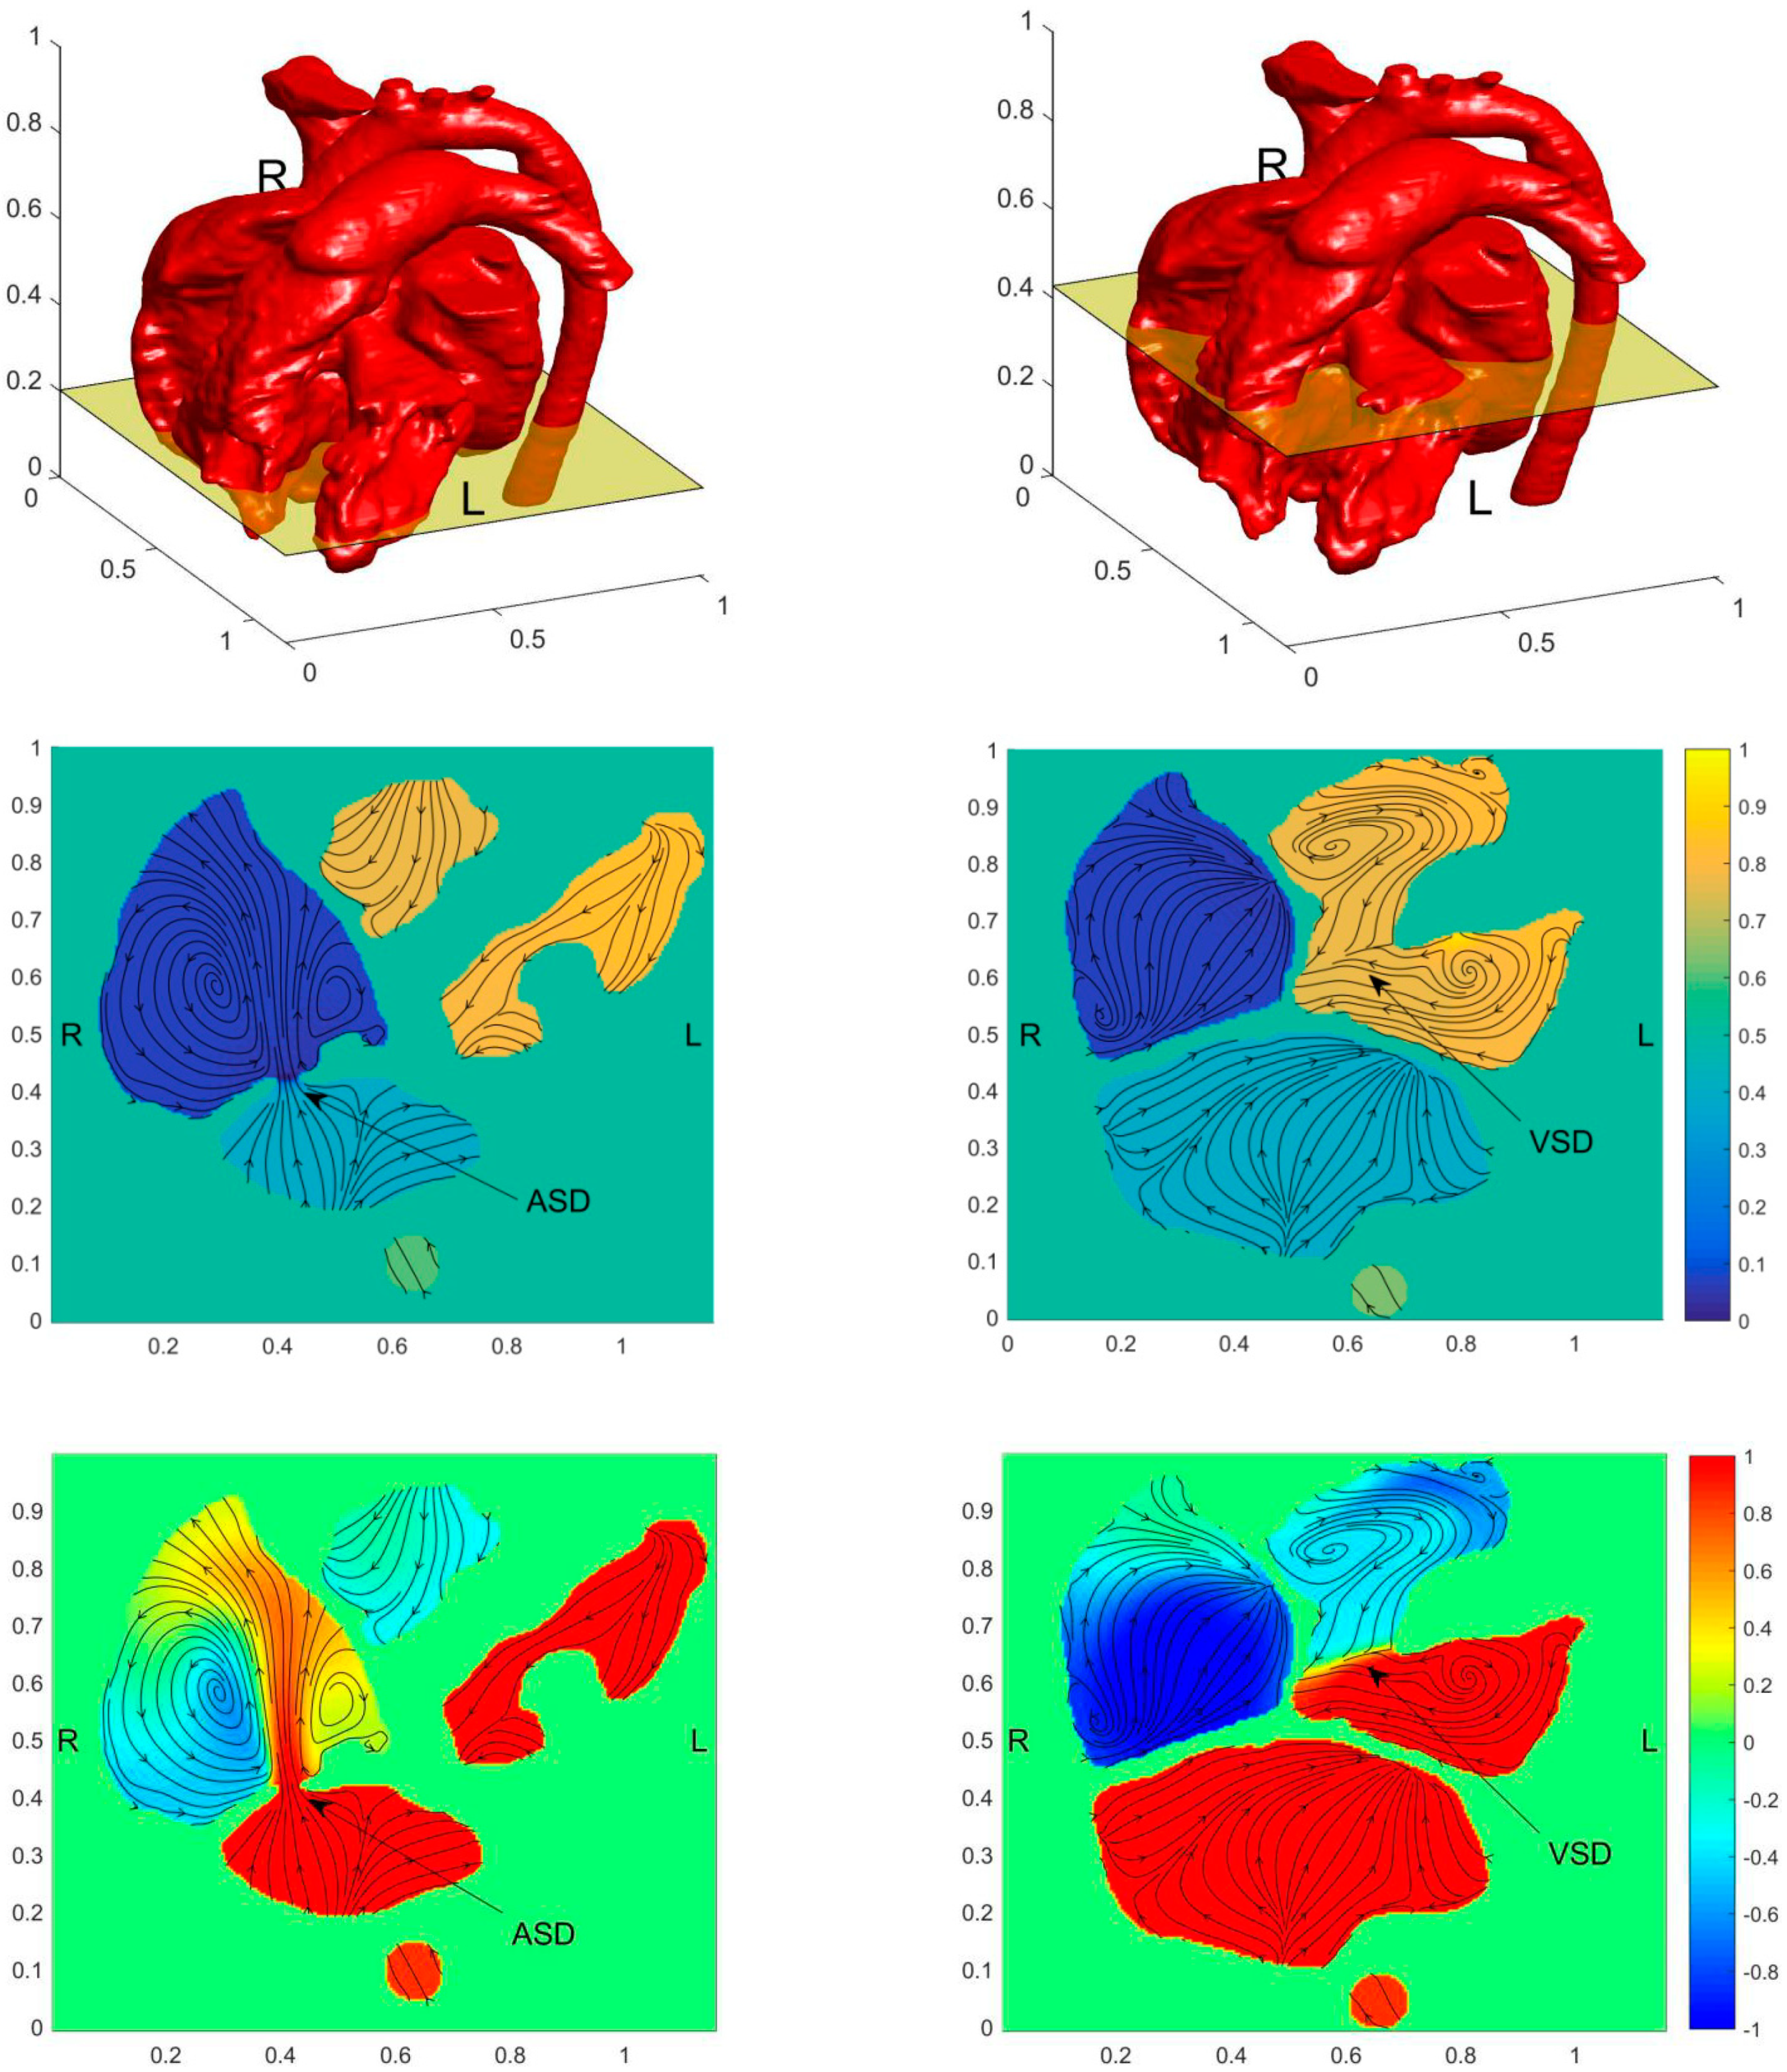
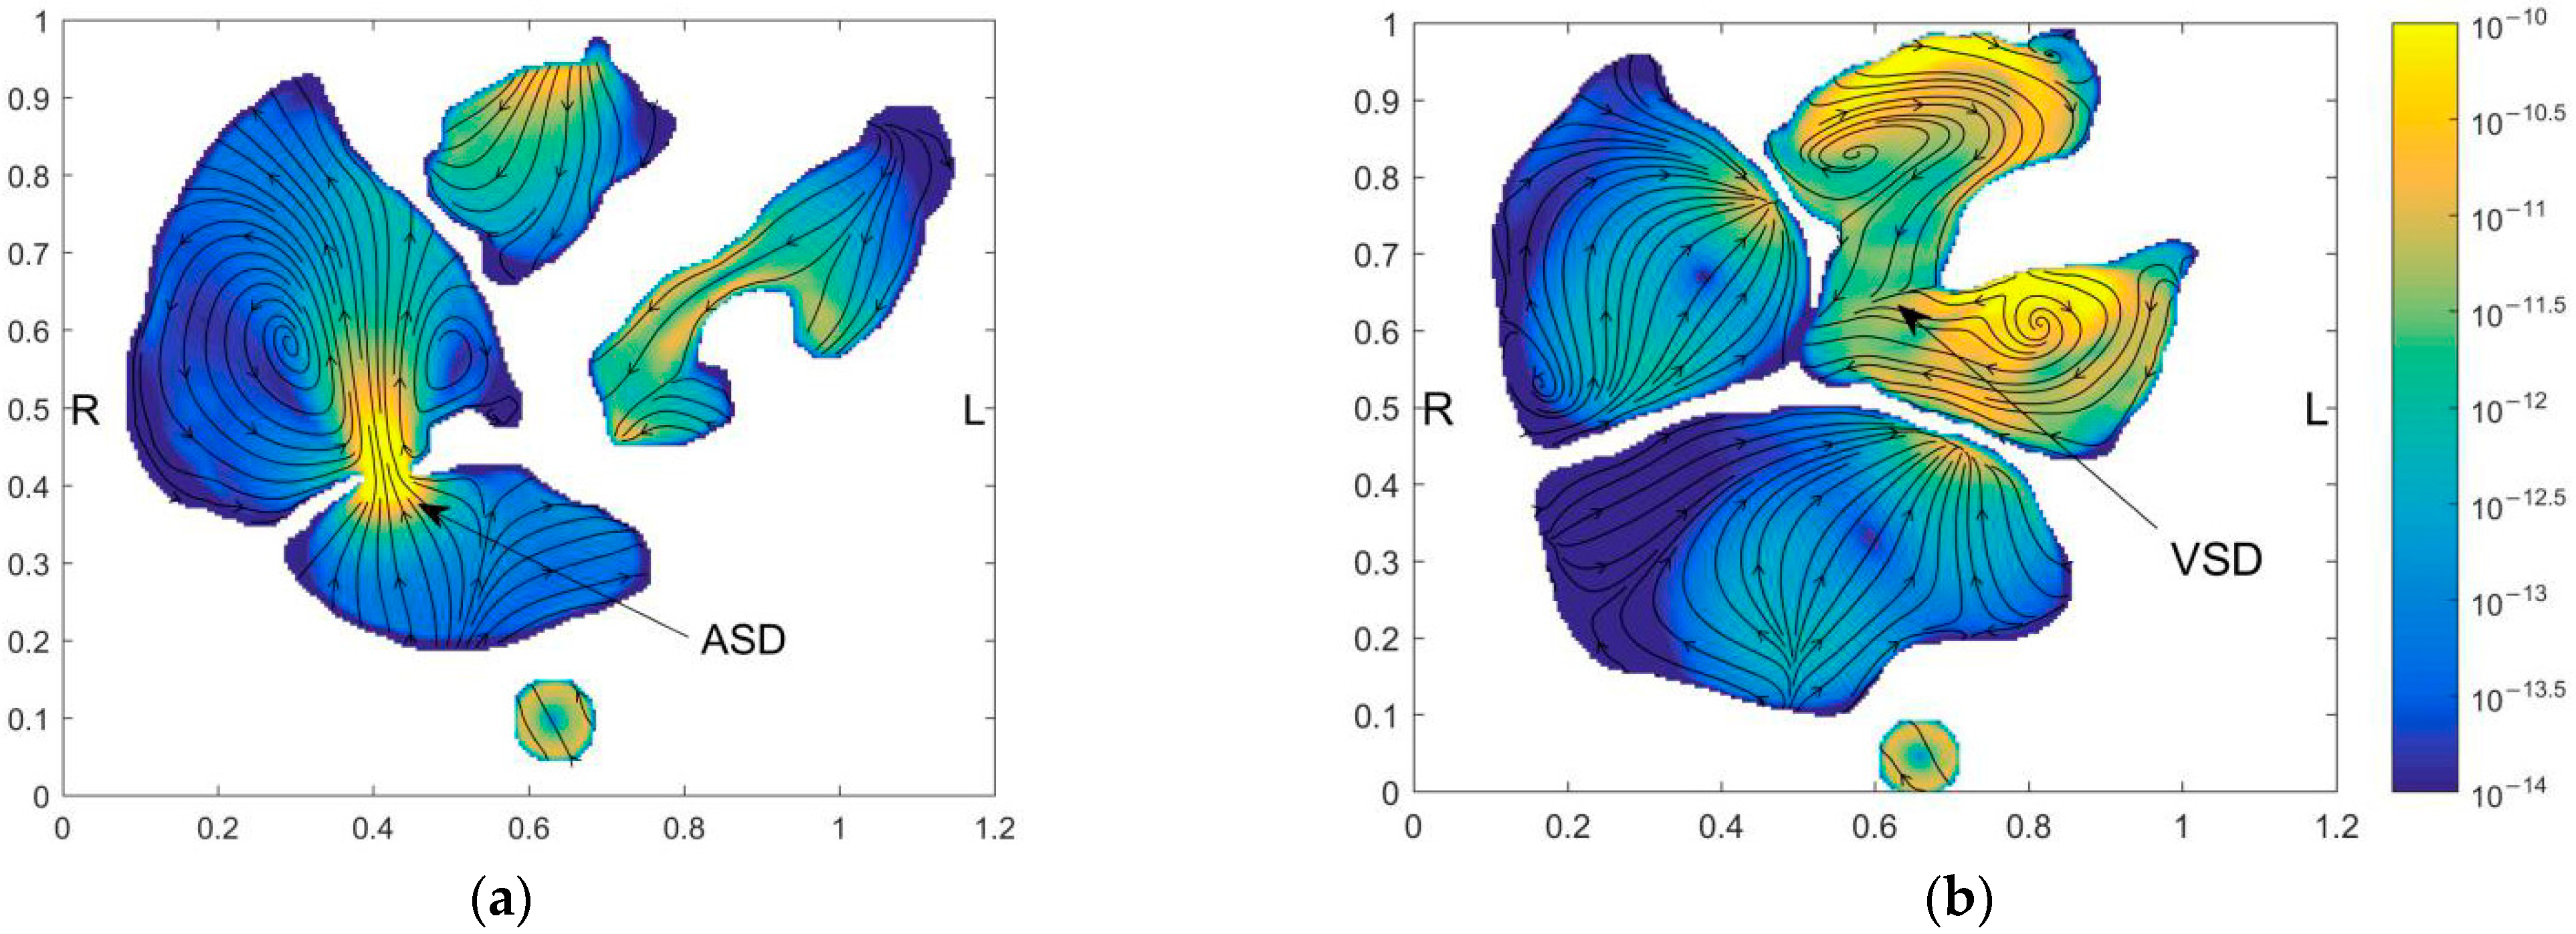
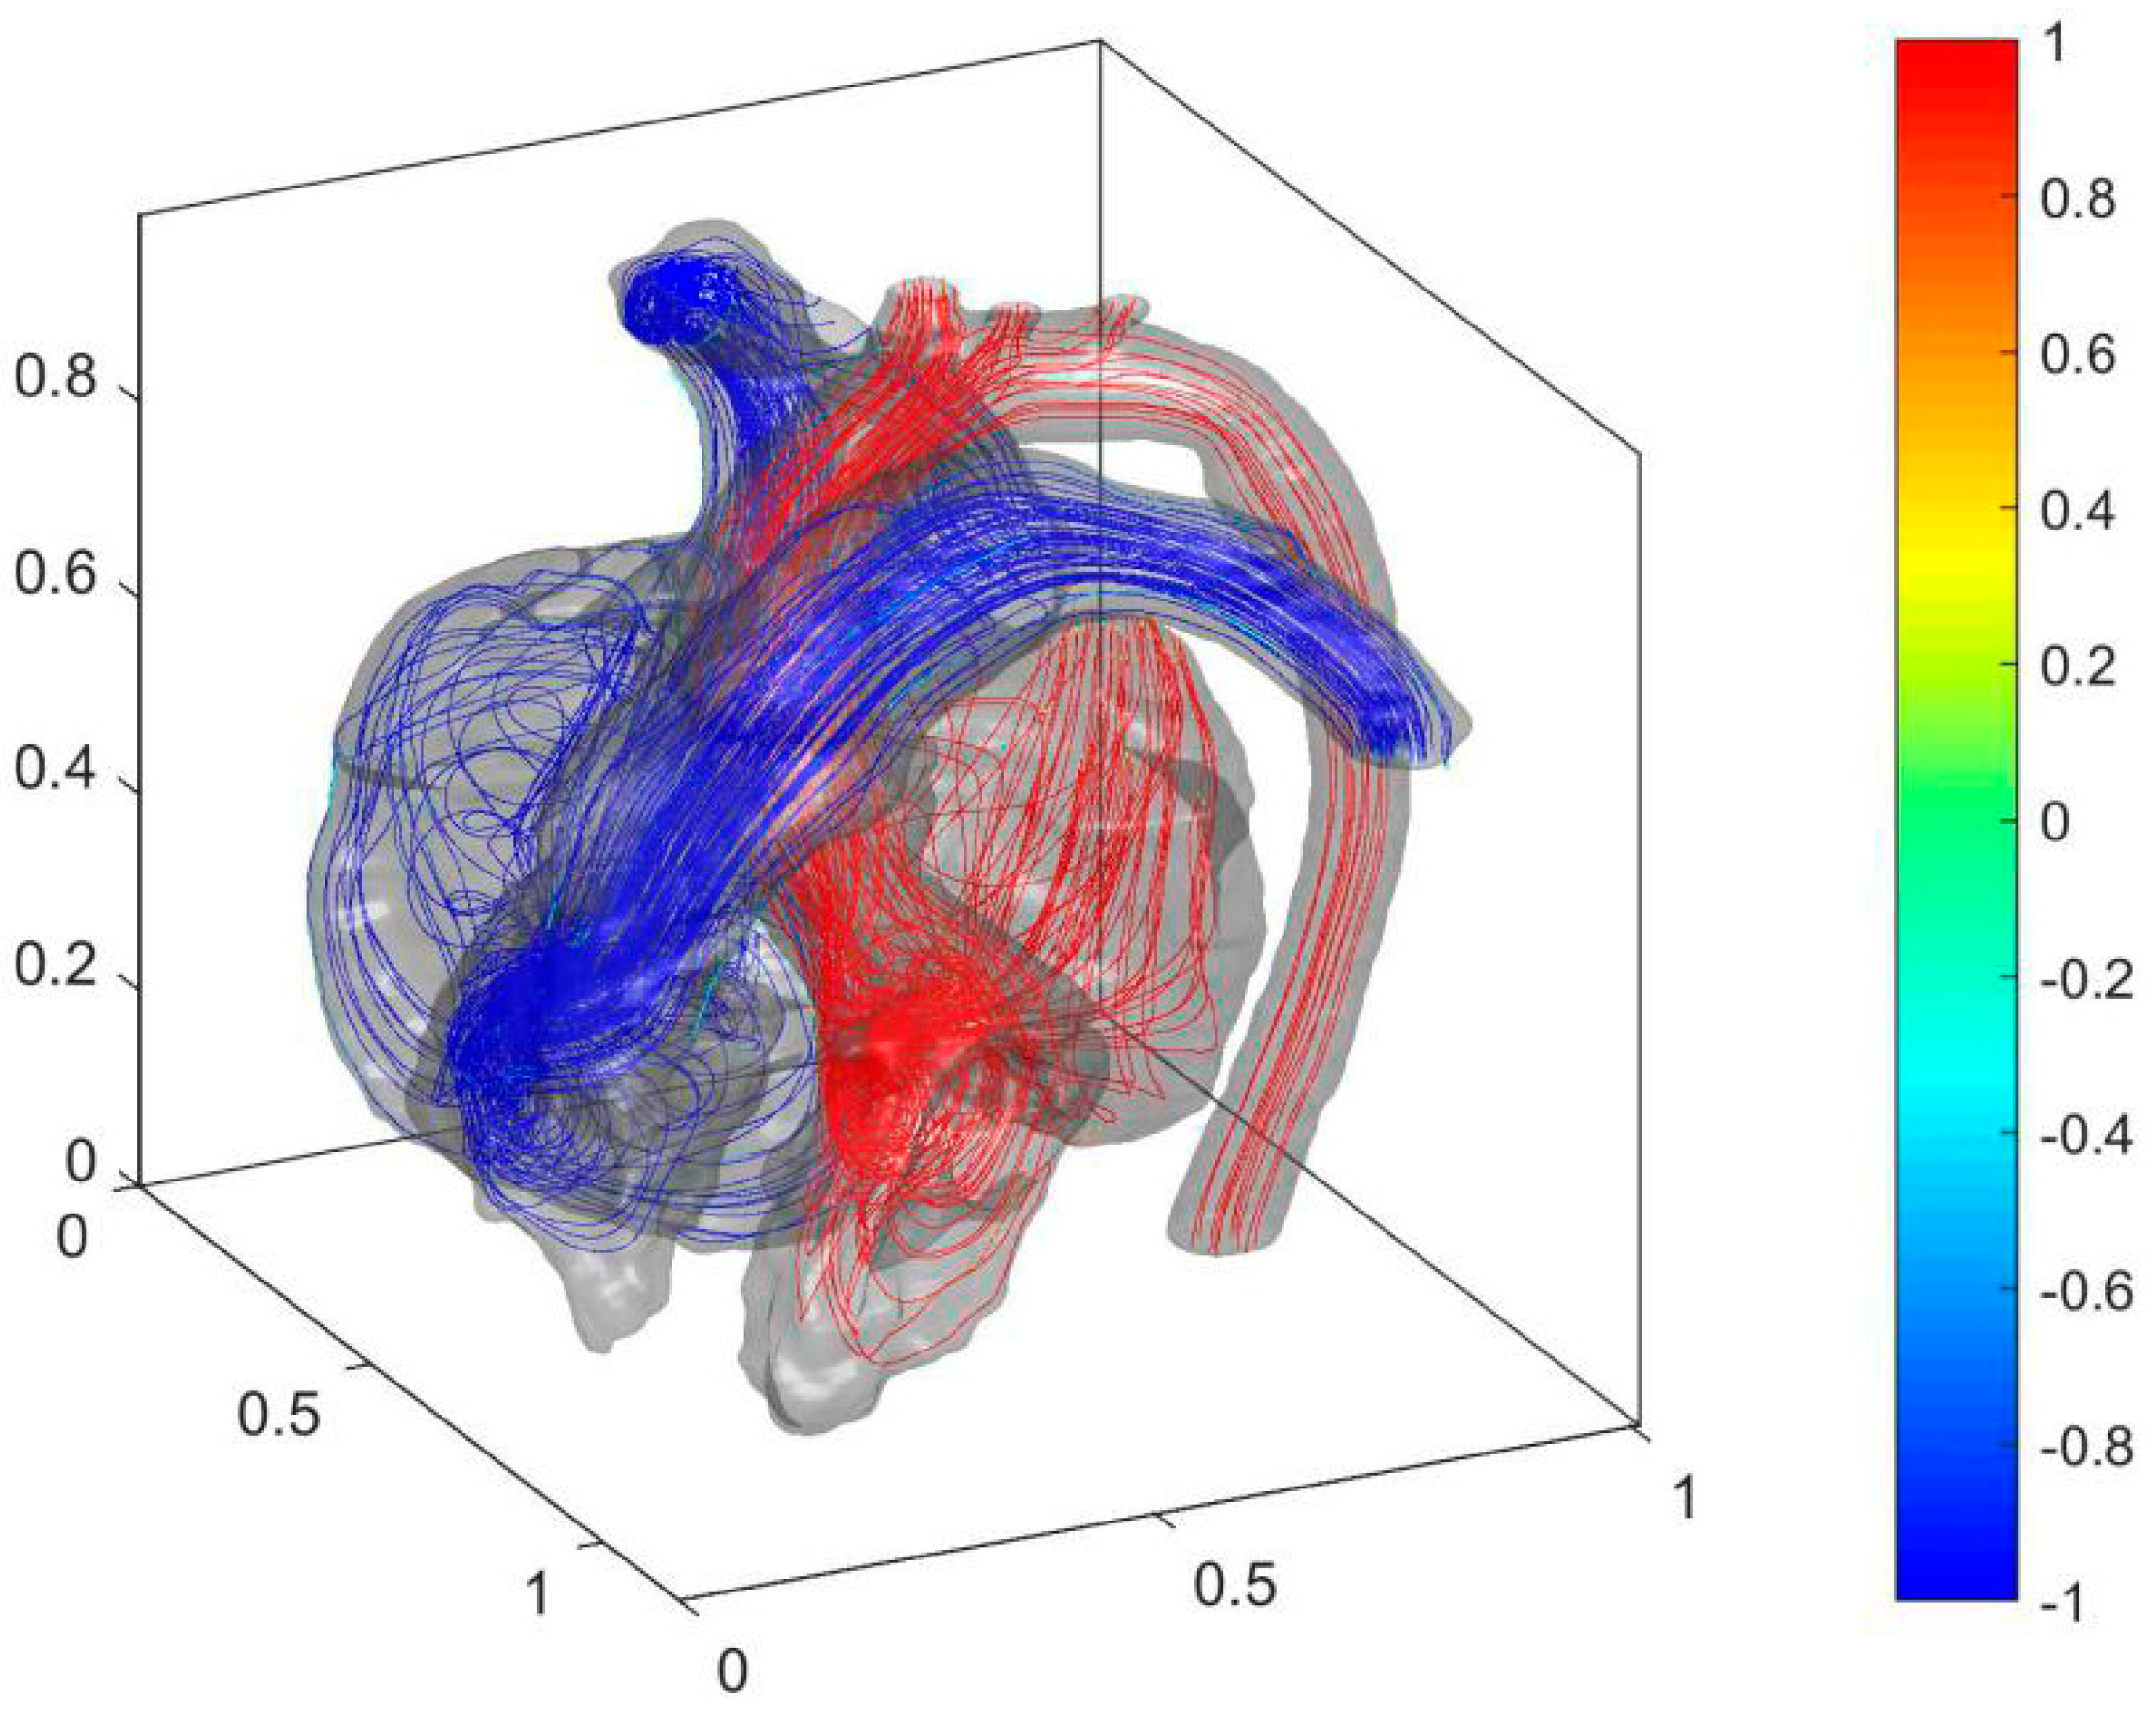
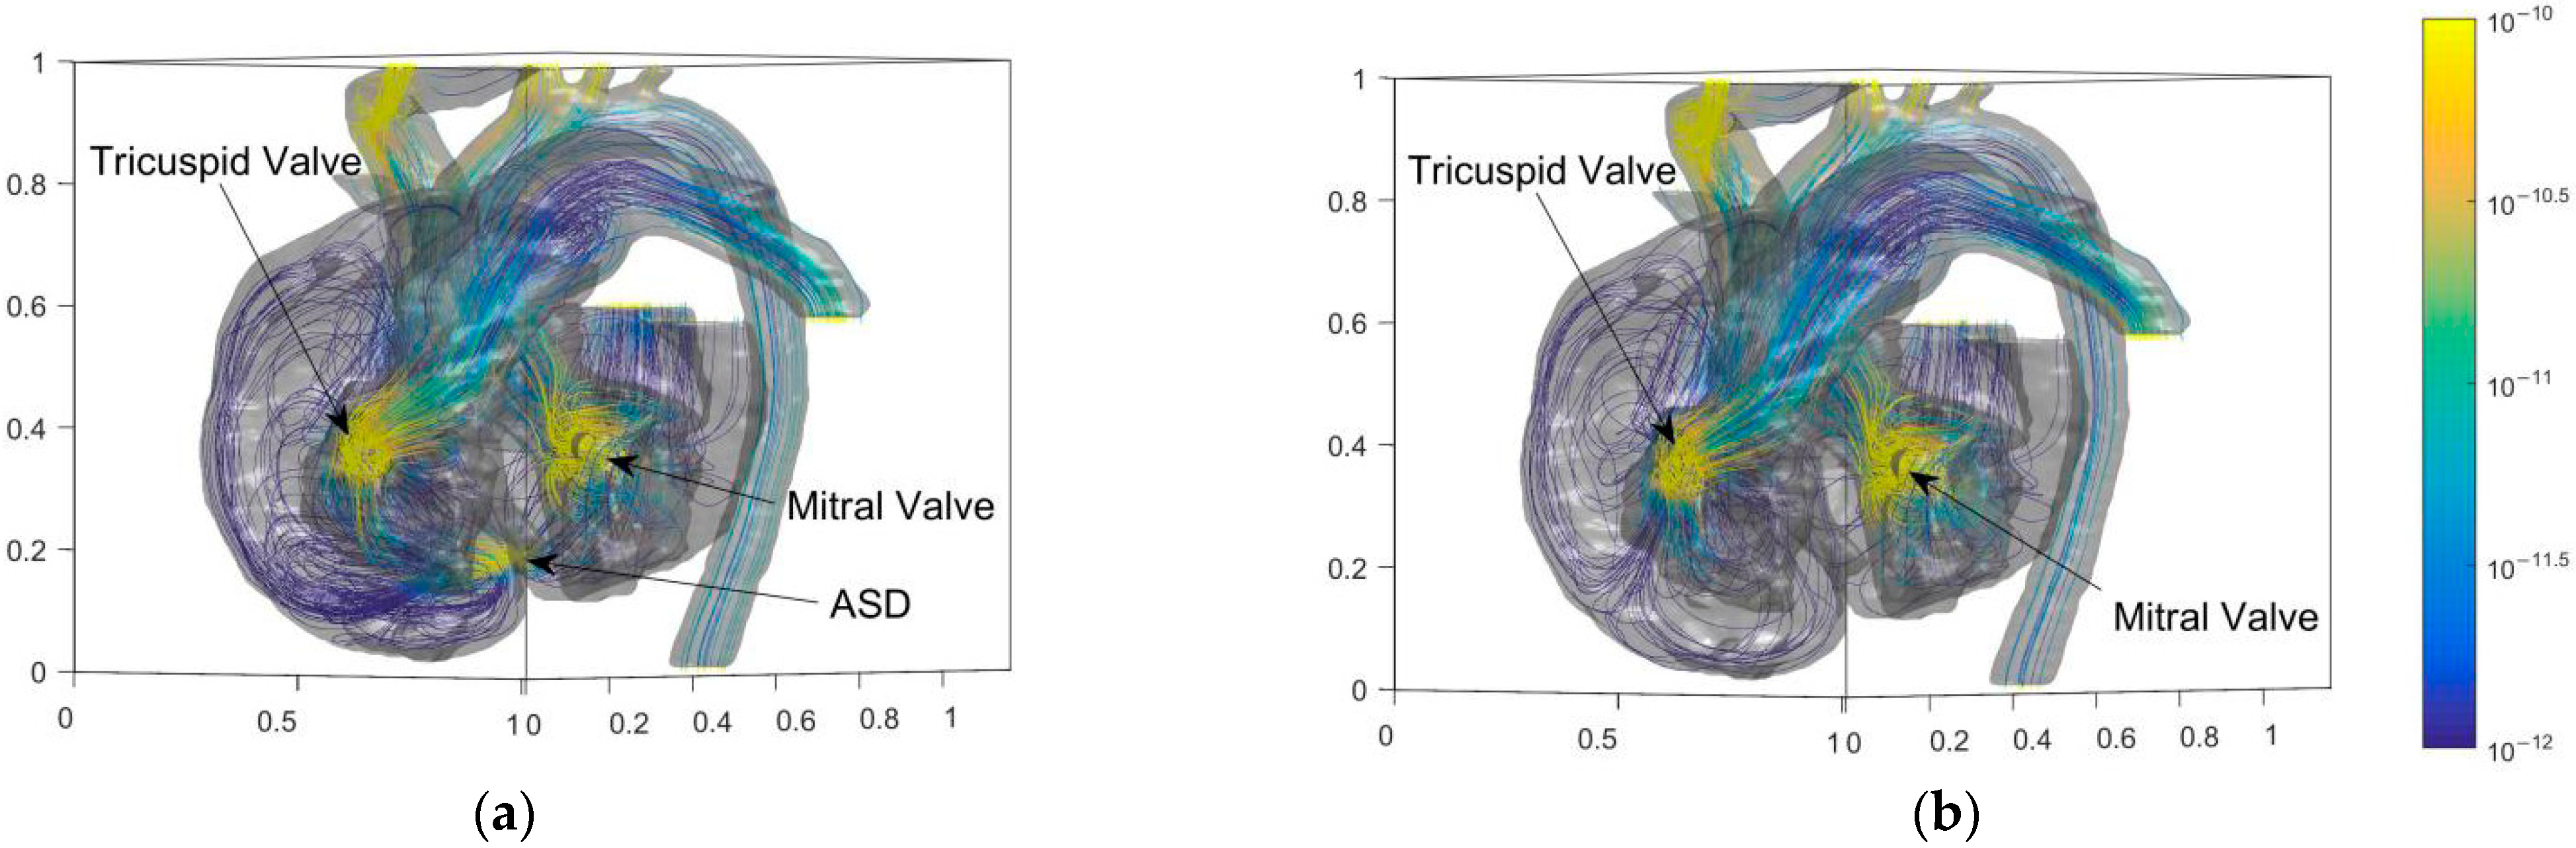
4.1. Analysis of Cardiac Flow of the Preoperative Child
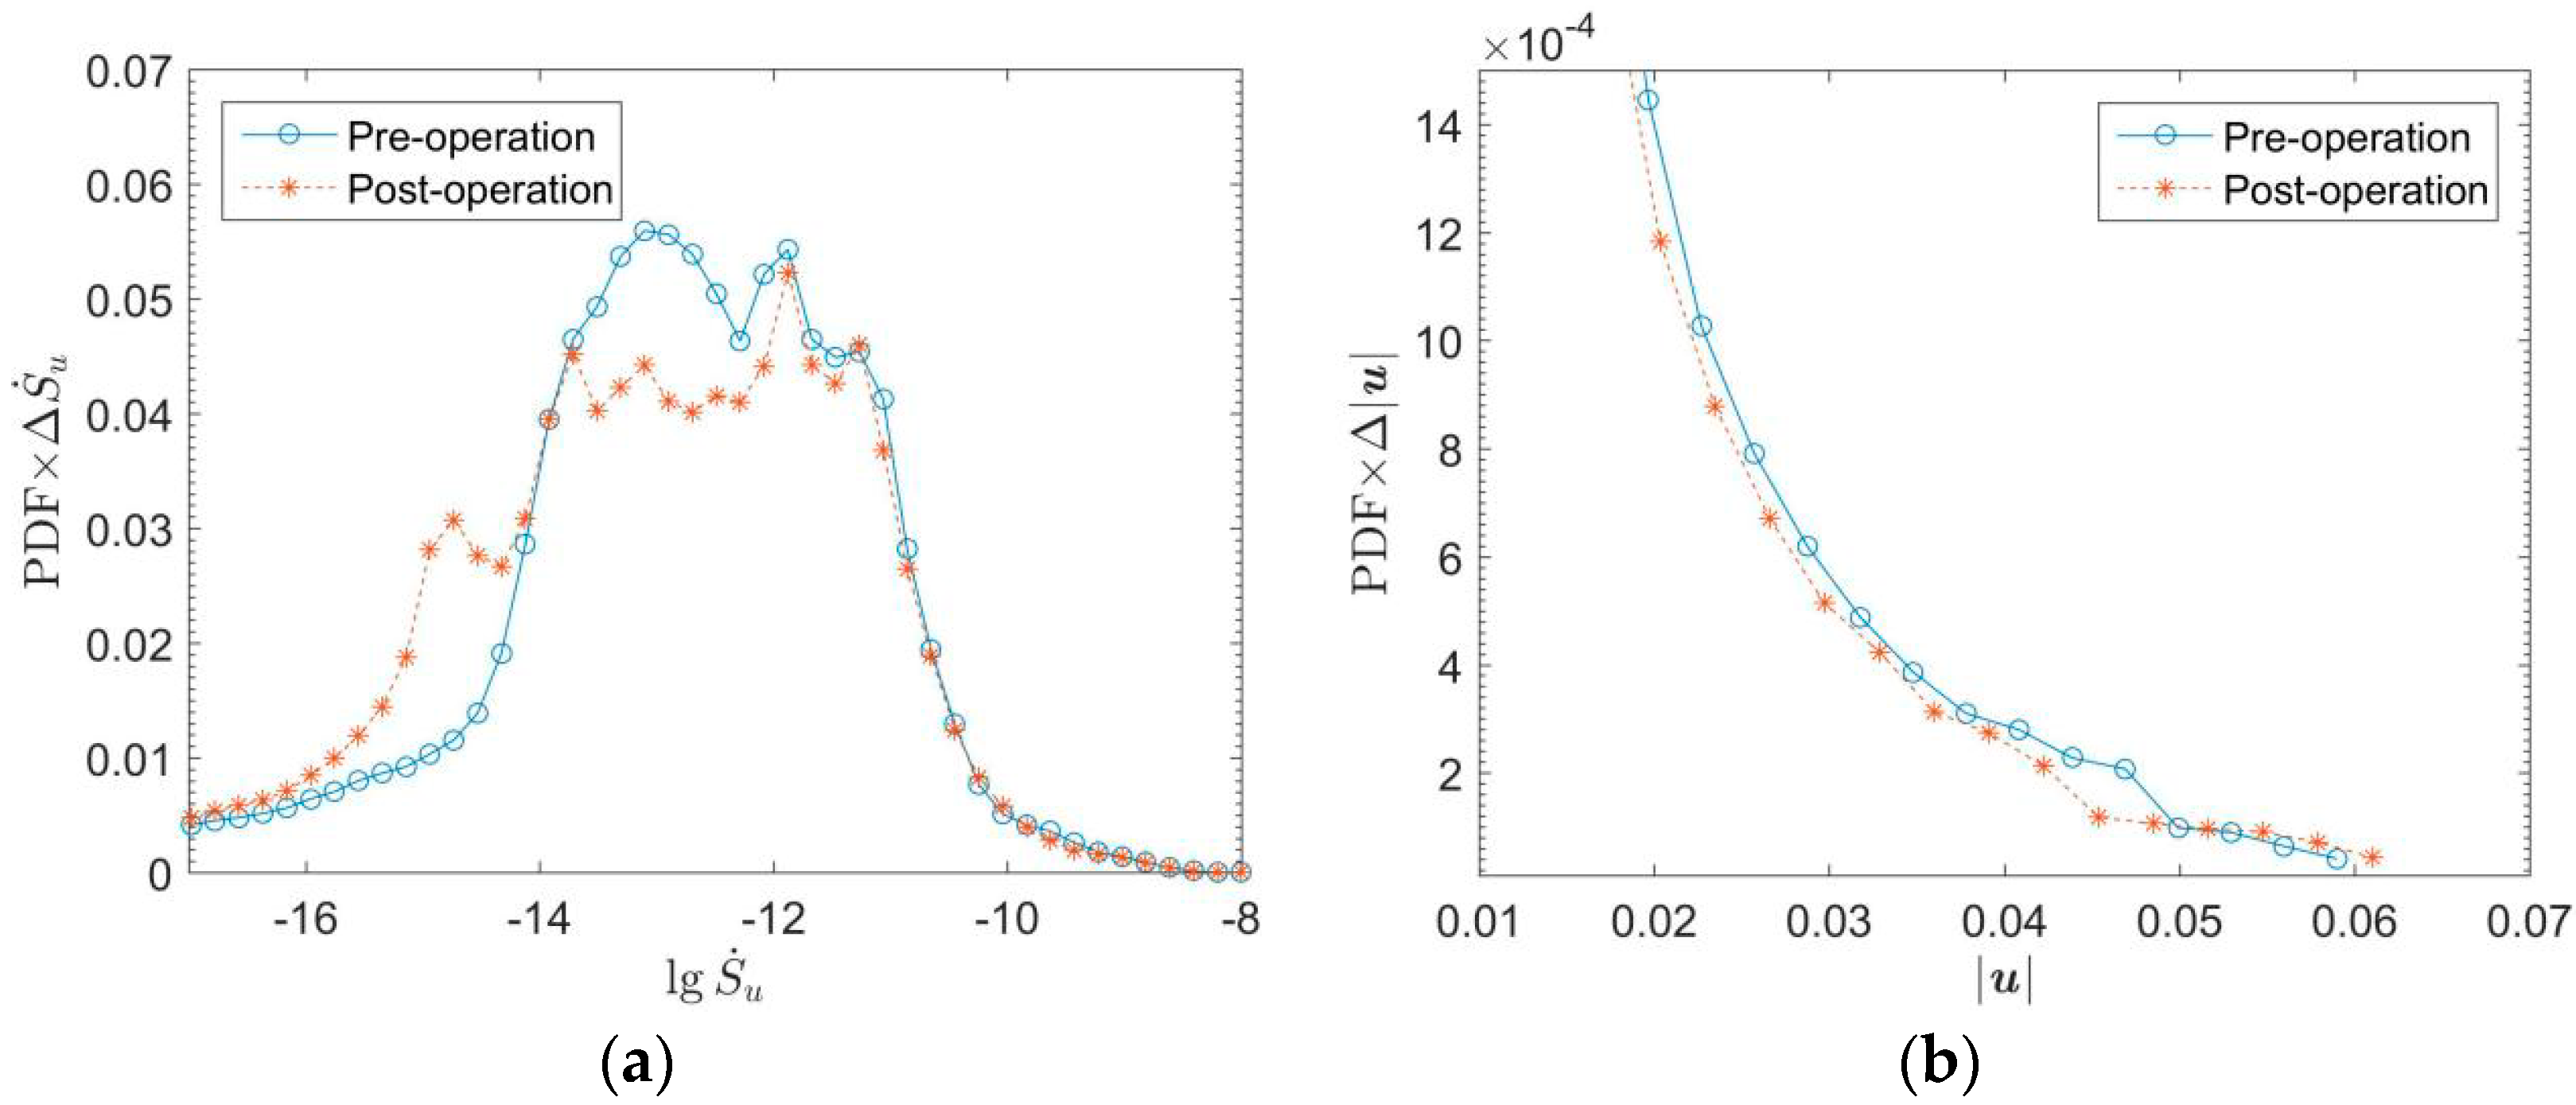
4.2. Comparison of Cardiac Flows of the Child before and after the Operation
5. Conclusions and Future Work
Author Contributions
Funding
Institutional Review Board Statement
Informed Consent Statement
Data Availability Statement
Conflicts of Interest
References
- Slesnick, T.C. Role of Computational Modeling in Planning and Executing Interventional Procedures for Congenital Heart Disease. Can. J. Cardiol. 2017, 33, 1159–1170. [Google Scholar] [CrossRef] [PubMed]
- Wang, L.; Liu, J.; Zhong, Y.; Zhang, M.; Xiong, J.; Shen, J.; Tong, Z.; Xu, Z. Medical Image-Based Hemodynamic Analyses in a Study of the Pulmonary Artery in Children With Pulmonary Hypertension Related to Congenital Heart Disease. Front. Pediatrics 2020, 8, 521936. [Google Scholar] [CrossRef] [PubMed]
- Pascall, E.; Tulloh, R.M.R. Pulmonary hypertension in congenital heart disease. Future Cardiol. 2018, 14, 343–353. [Google Scholar] [CrossRef] [PubMed]
- Alakhfash, A.; Alqwaiee, A.; Ghadeer, A.; Alhajjaj, A.; Almesned, A.A. Pulmonary hypertension associated with congenital heart disease; clinical decision scenario. Respir. Med. Case Rep. 2020, 31, 101286. [Google Scholar] [CrossRef] [PubMed]
- Simonneau, G.; Montani, D.; Celermajer, D.S.; Denton, C.P.; Gatzoulis, M.A.; Krowka, M.; Williams, P.G.; Souza, R. Haemodynamic definitions and updated clinical classification of pulmonary hypertension. Eur. Respir. J. 2018, 53, 1801913. [Google Scholar] [CrossRef] [PubMed]
- Medero, R.; García-Rodríguez, S.; Francois, C.; Roldán-Alzate, A. Patient-Specific In Vitro Models for Hemodynamic Analysis of Congenital Heart Disease—Additive Manufacturing Approach. J. Biomech. 2017, 54, 111–116. [Google Scholar] [CrossRef] [PubMed]
- Iwase, H.; Liu, H.; Fujimoto, S.; Himeno, R. Computational Modeling of Left Ventricle Dynamics and Flow Based on Ultrasonographic Data. JSME Int. J. 2004, 46, 1321–1329. [Google Scholar] [CrossRef][Green Version]
- Courchaine, K.; Rugonyi, C. Quantifying blood flow dynamics during cardiac development: Demystifying computational methods. Philos. Trans. R. Soc. B Biol. Sci. 2018, 373, 20170330. [Google Scholar] [CrossRef] [PubMed]
- Matsuura, H. Cardiac catheterization in children with pulmonary arterial hypertension. Pediatrics Int. 2017, 59, 3–9. [Google Scholar] [CrossRef]
- Kemal, H.S.; Kayıkçıoğlu, M.; Nalbantgil, S.; Can, L.H.; Moğulkoç, N.; Kültürsay, H. Assessment of right ventricular function in patients with pulmonary arterial hypertension-congenital heart disease and repaired and unrepaired defects: Correlation among speckle tracking, conventional echocardiography, and clinical parameters. Anatol. J. Cardiol. 2020, 23, 277–287. [Google Scholar]
- Schicchi, N.; Fogante, M.; Pirani, P.E.; Agliata, G.; Basile, M.C.; Oliva, M.; Agostini, A.; Giovagnoni, A. Third-generation dual-source dual-energy CT in pediatric congenital heart disease patients: State-of-the-art. La Radiol. Med. 2019, 124, 1238–1252. [Google Scholar] [CrossRef] [PubMed]
- Rizk, J. 4D flow MRI applications in congenital heart disease. Eur. Radiol. 2021, 31, 1160–1174. [Google Scholar] [CrossRef] [PubMed]
- Gerrah, R.; Haller, S.J. Computational fluid dynamics: A primer for congenital heart disease clinicians. Asian Cardiovasc. Thorac. Annals 2020, 28, 520–532. [Google Scholar] [CrossRef] [PubMed]
- Salavitabar, A.; Figueroa, C.A.; Lu, J.C.; Owens, S.T.; Axelrod, D.M.; Zampi, J.D. Emerging 3D technologies and applications within congenital heart disease: Teach, predict, plan and guide. Future Cardiol. 2020, 6, 20200004. [Google Scholar] [CrossRef] [PubMed]
- Aslan, S.; Mass, P.; Loke, Y.H.; Warburton, L.; Liu, X.; Hibino, N.; Olivieri, L.; Krieger, A. Non-invasive Prediction of Peak Systolic Pressure Drop across Coarctation of Aorta using Computational Fluid Dynamics. In Proceedings of the 2020 42nd Annual International Conference of the IEEE Engineering in Medicine and Biology Society (EMBC) in Conjunction with the 43rd Annual Conference of the Canadian Medical and Biological Engineering Society, Montréal, QC, Canada, 20–24 July 2020. [Google Scholar]
- Conijn, M.; Krings, G.J. Computational Analysis of the Pulmonary Arteries in Congenital Heart Disease: A Review of the Methods and Results. Comput. Math. Methods Med. 2021, 2021, 2618625. [Google Scholar] [CrossRef] [PubMed]
- Chi, W.O.; Wee, I.; Syn, N.; Ng, S.; Leo, H.L.; Richards, A.M.; Choong, A.M.T.L. Computational Fluid Dynamics Modelling of Hemodynamic Parameters in the Human Diseased Aorta—A Systematic Review. Ann. Vasc. Surg. 2019, 63, 336–381. [Google Scholar]
- Qian, Y.; D’Humières, D.; Lallemand, P. Lattice BGK Models for Navier-Stokes Equation. Europhys. Lett. 1992, 149, 6. [Google Scholar] [CrossRef]
- Guo, Z.; Shi, B.; Zheng, C. A coupled lattice BGK model for the Boussinesq equations. Internat. J. Numer. Methods Fluids 2002, 39, 325–342. [Google Scholar] [CrossRef]
- He, X.; Shan, X.; Doolen, G.D. Discrete Boltzmann equation model for nonideal gases. Phys. Rev. E Stat. Phys. Plasmas Fluids Relat. Interdiscip. Topics 1998, 57, R13–R16. [Google Scholar] [CrossRef]
- Wei, Y.; Shen, P.; Wang, Z.; Liang, H.; Qian, Y. Time Evolution Features of Entropy Generation Rate in Turbulent Rayleigh-Bénard Convection with Mixed Insulating and Conducting Boundary Conditions. Entropy 2020, 22, 672. [Google Scholar] [CrossRef]
- Wang, Z.; Wei, Y.; Qian, Y. A simple direct heating thermal immersed boundary-lattice Boltzmann method for its application in incompressible flow. Comput. Math. Appl. 2020, 80, 1633–1649. [Google Scholar] [CrossRef]
- Mahian, O.; Kianifar, A.; Pop, I. A review on entropy generation in nanofluid flow. Int. J. Heat Mass Transf. 2013, 65, 514–532. [Google Scholar] [CrossRef]
- Samian, R.; Saidi, M. Investigation of left heart flow using a numerical correlation to model heart wall motion. J. Biomech. 2019, 93, 77–85. [Google Scholar] [CrossRef] [PubMed]
- Wang, Z.; Wei, Y.; Qian, Y. A bounce back-immersed boundary-lattice Boltzmann model for curved boundary. Appl. Math. Model. 2020, 81, 428–440. [Google Scholar] [CrossRef]


| i | 0 | 1~6 | 7~18 |
|---|---|---|---|
| ci | (0, 0, 0) | ((1, 0, 0) | ((1, (1, 0) |
| (0, (1, 0) | ((1, 0, (1) | ||
| (0, 0, (1) | (0, (1, (1) | ||
| wi | 1/3 | 1/18 | 1/36 |
Publisher’s Note: MDPI stays neutral with regard to jurisdictional claims in published maps and institutional affiliations. |
© 2022 by the authors. Licensee MDPI, Basel, Switzerland. This article is an open access article distributed under the terms and conditions of the Creative Commons Attribution (CC BY) license (https://creativecommons.org/licenses/by/4.0/).
Share and Cite
Wang, Z.; Zhang, X.; Li, Y.; Yang, H.; Xue, H.; Wei, Y.; Qian, Y. Simulation of Cardiac Flow under the Septal Defect Based on Lattice Boltzmann Method. Entropy 2022, 24, 187. https://doi.org/10.3390/e24020187
Wang Z, Zhang X, Li Y, Yang H, Xue H, Wei Y, Qian Y. Simulation of Cardiac Flow under the Septal Defect Based on Lattice Boltzmann Method. Entropy. 2022; 24(2):187. https://doi.org/10.3390/e24020187
Chicago/Turabian StyleWang, Zhengdao, Xiandong Zhang, Yumeng Li, Hui Yang, Haihong Xue, Yikun Wei, and Yuehong Qian. 2022. "Simulation of Cardiac Flow under the Septal Defect Based on Lattice Boltzmann Method" Entropy 24, no. 2: 187. https://doi.org/10.3390/e24020187
APA StyleWang, Z., Zhang, X., Li, Y., Yang, H., Xue, H., Wei, Y., & Qian, Y. (2022). Simulation of Cardiac Flow under the Septal Defect Based on Lattice Boltzmann Method. Entropy, 24(2), 187. https://doi.org/10.3390/e24020187