
Magnetic Phase Diagram of the MnxFe2−xP1−ySiy System


Abstract
:1. Introduction
2. Materials and Methods
3. Results
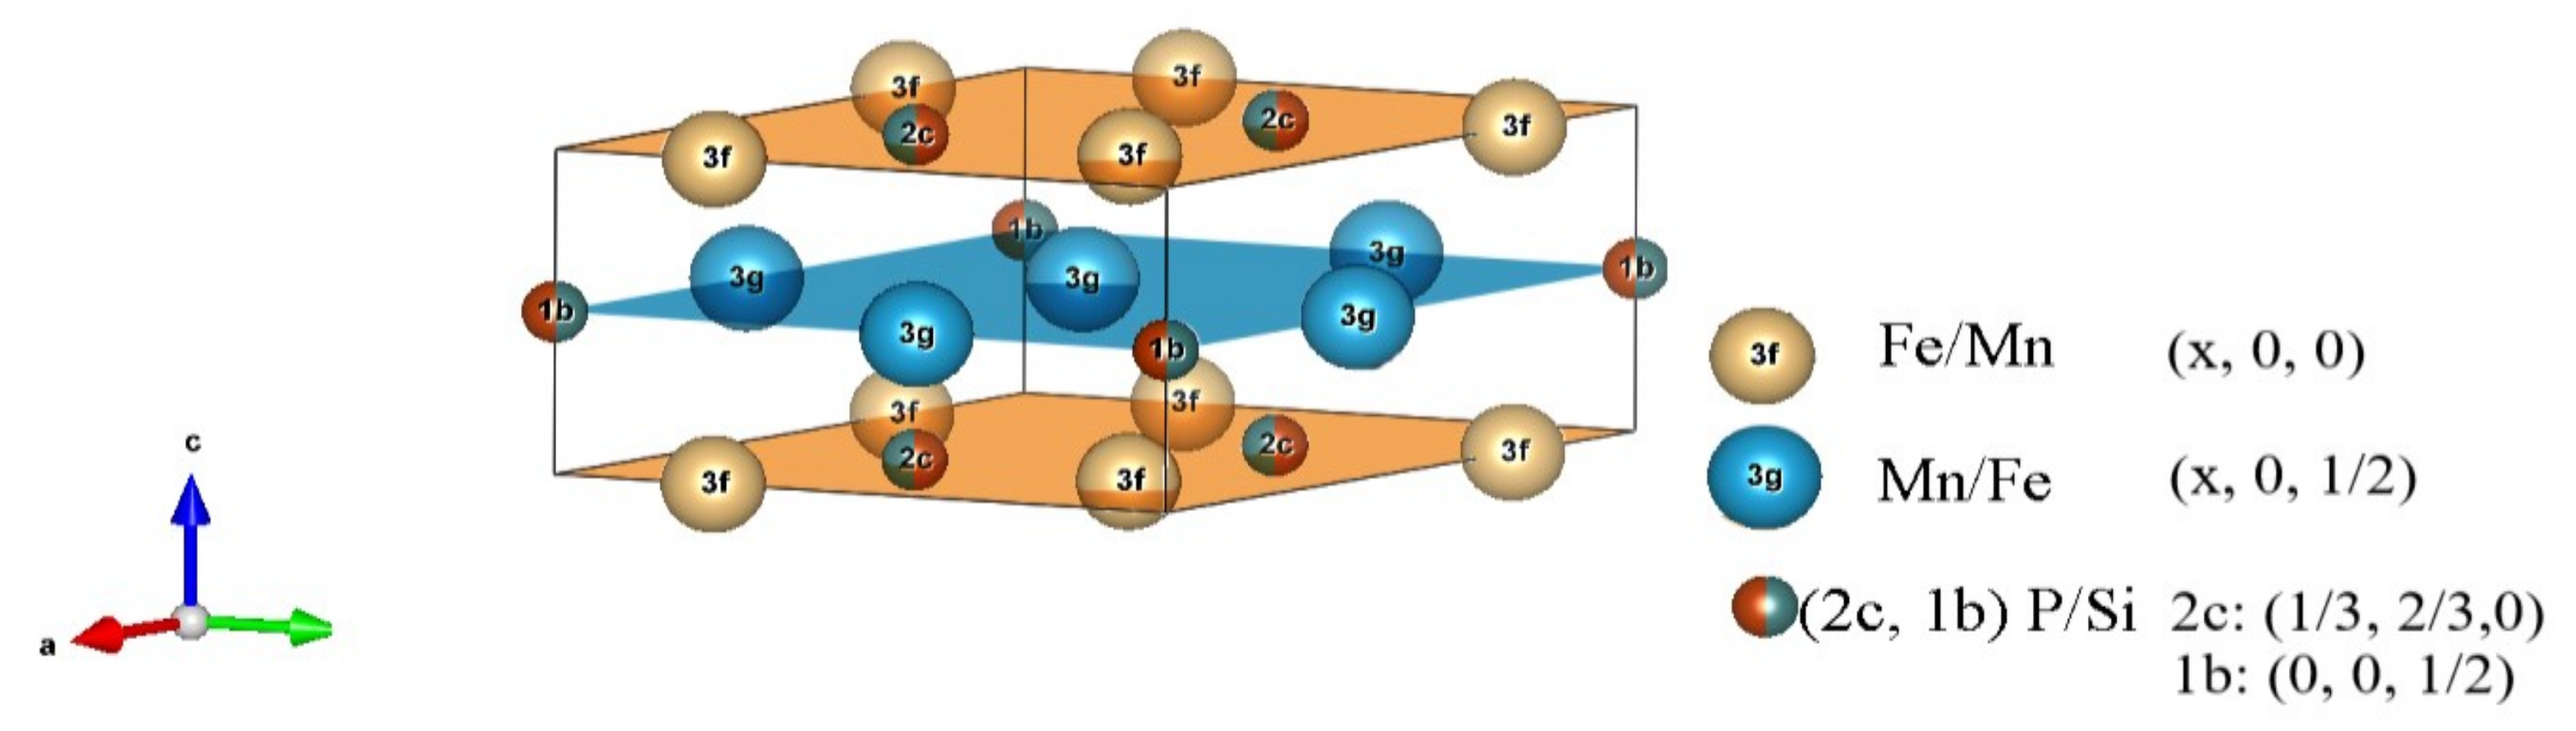
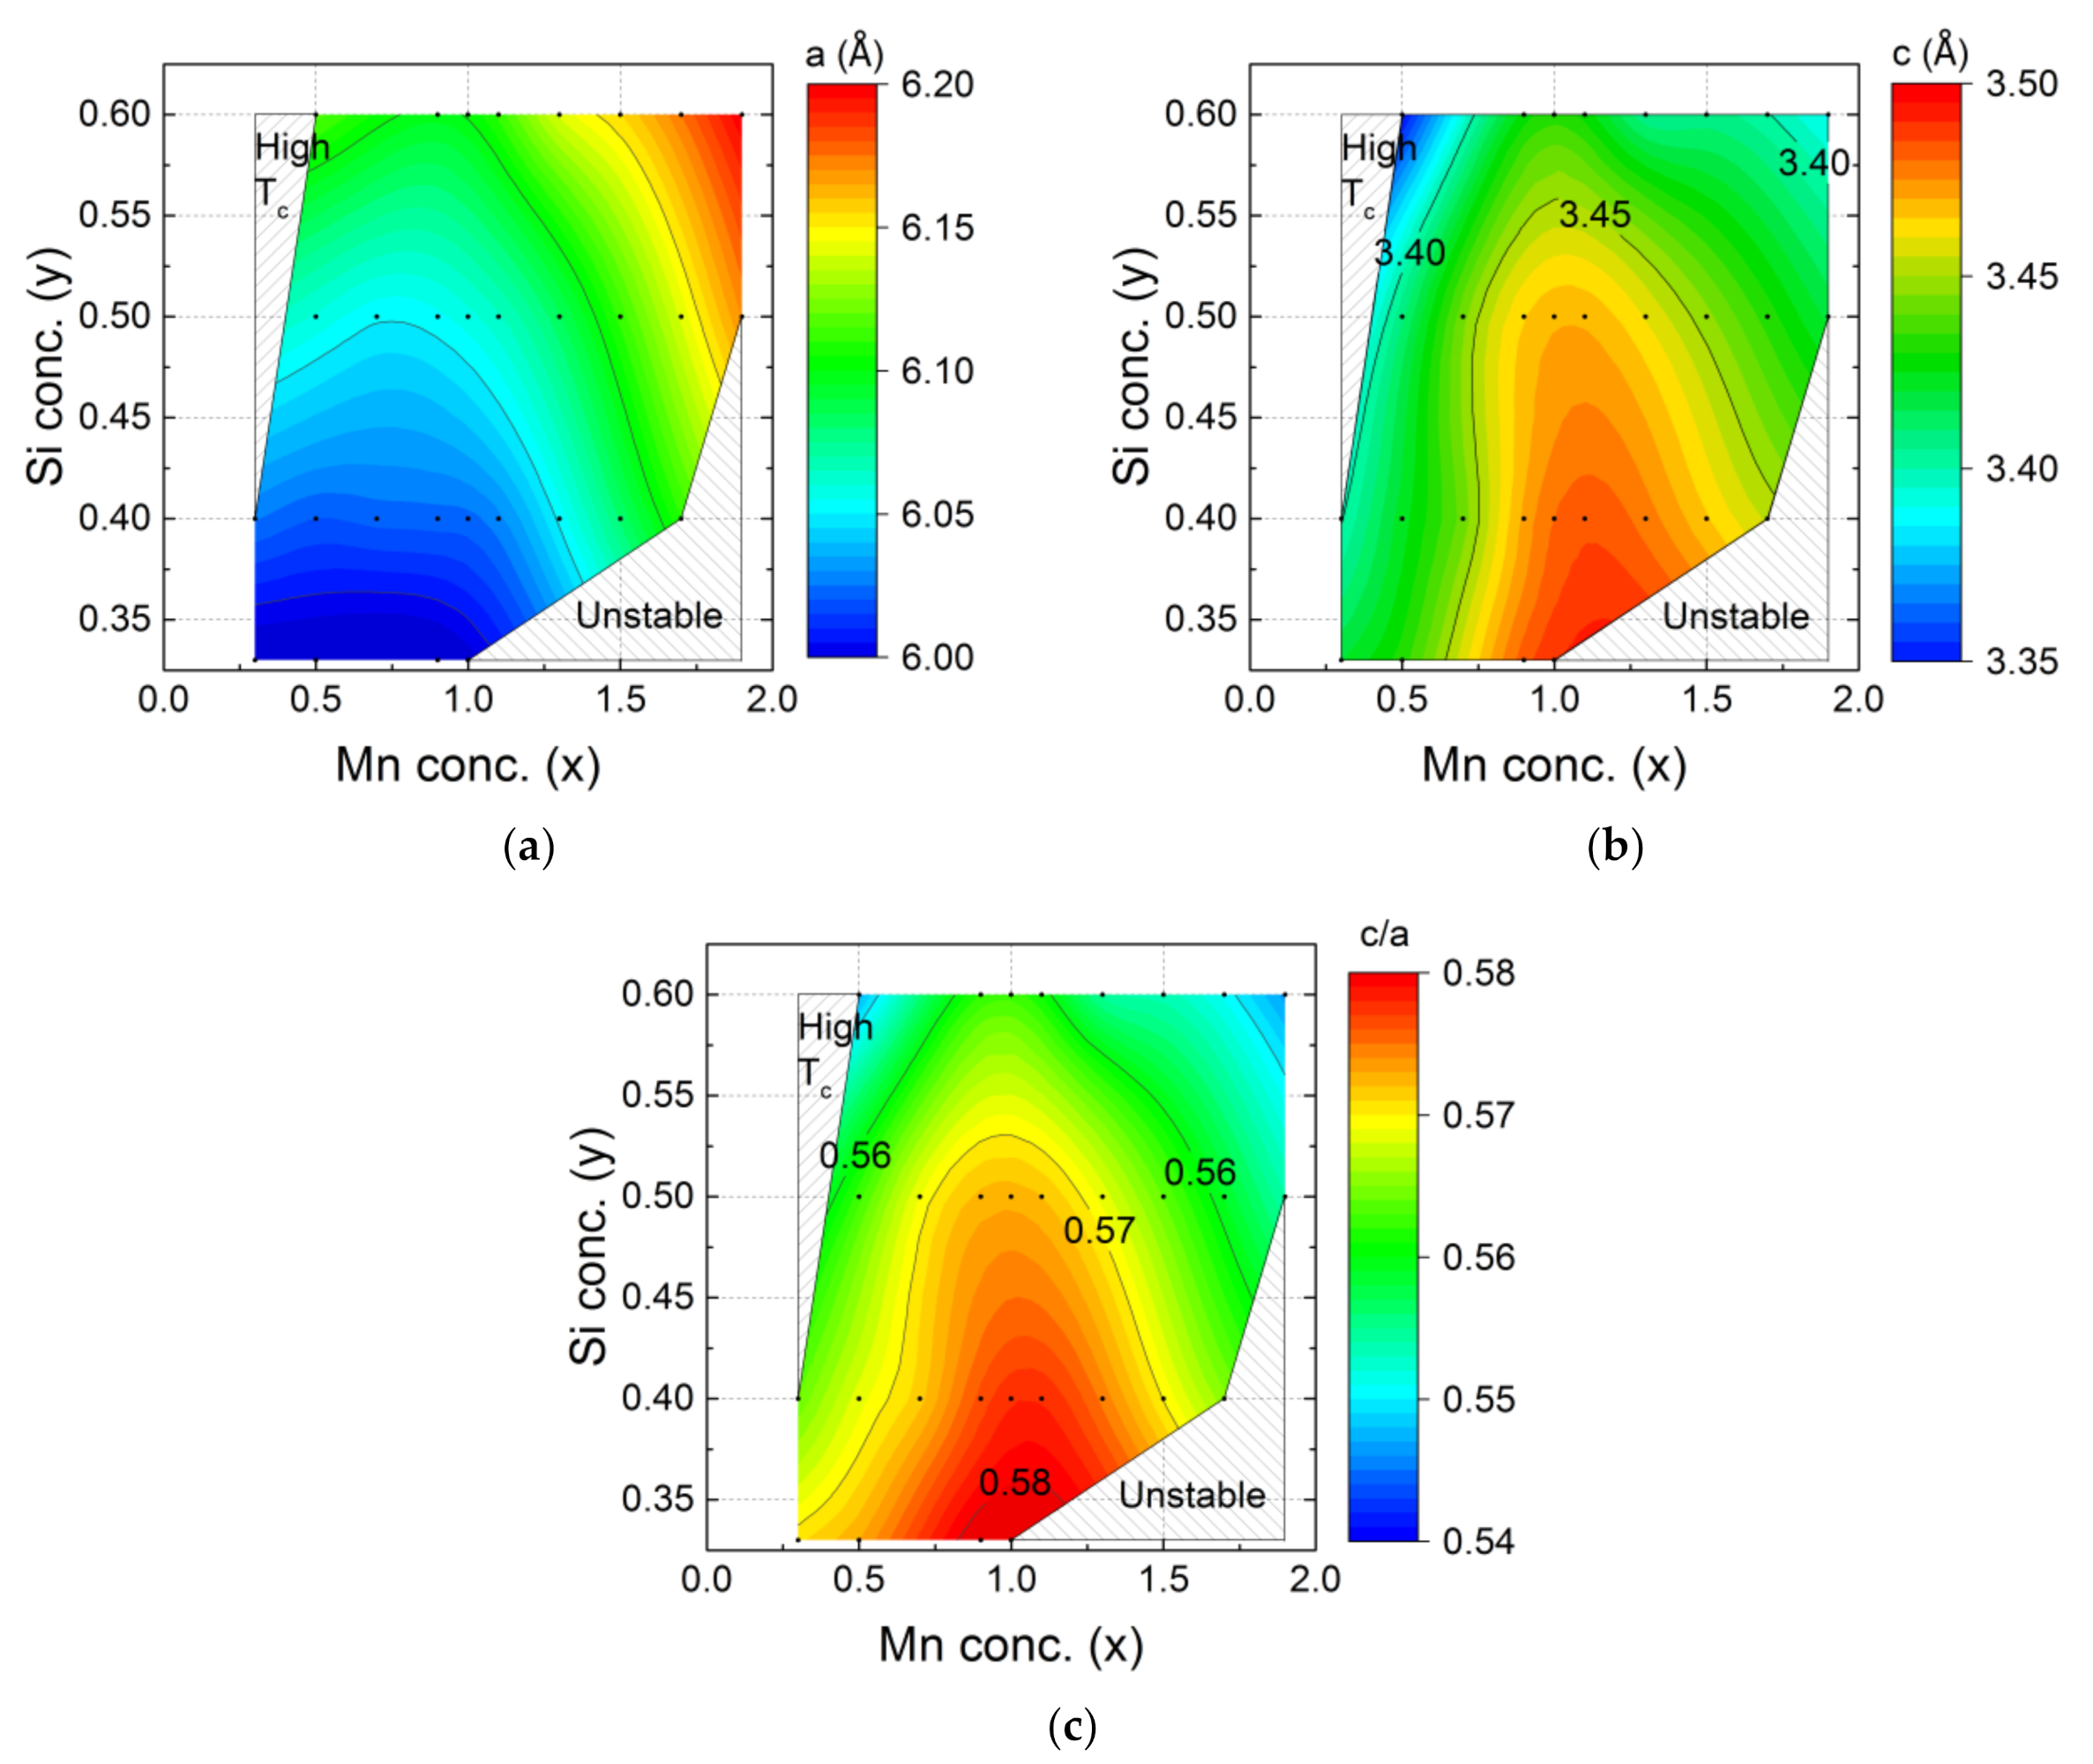
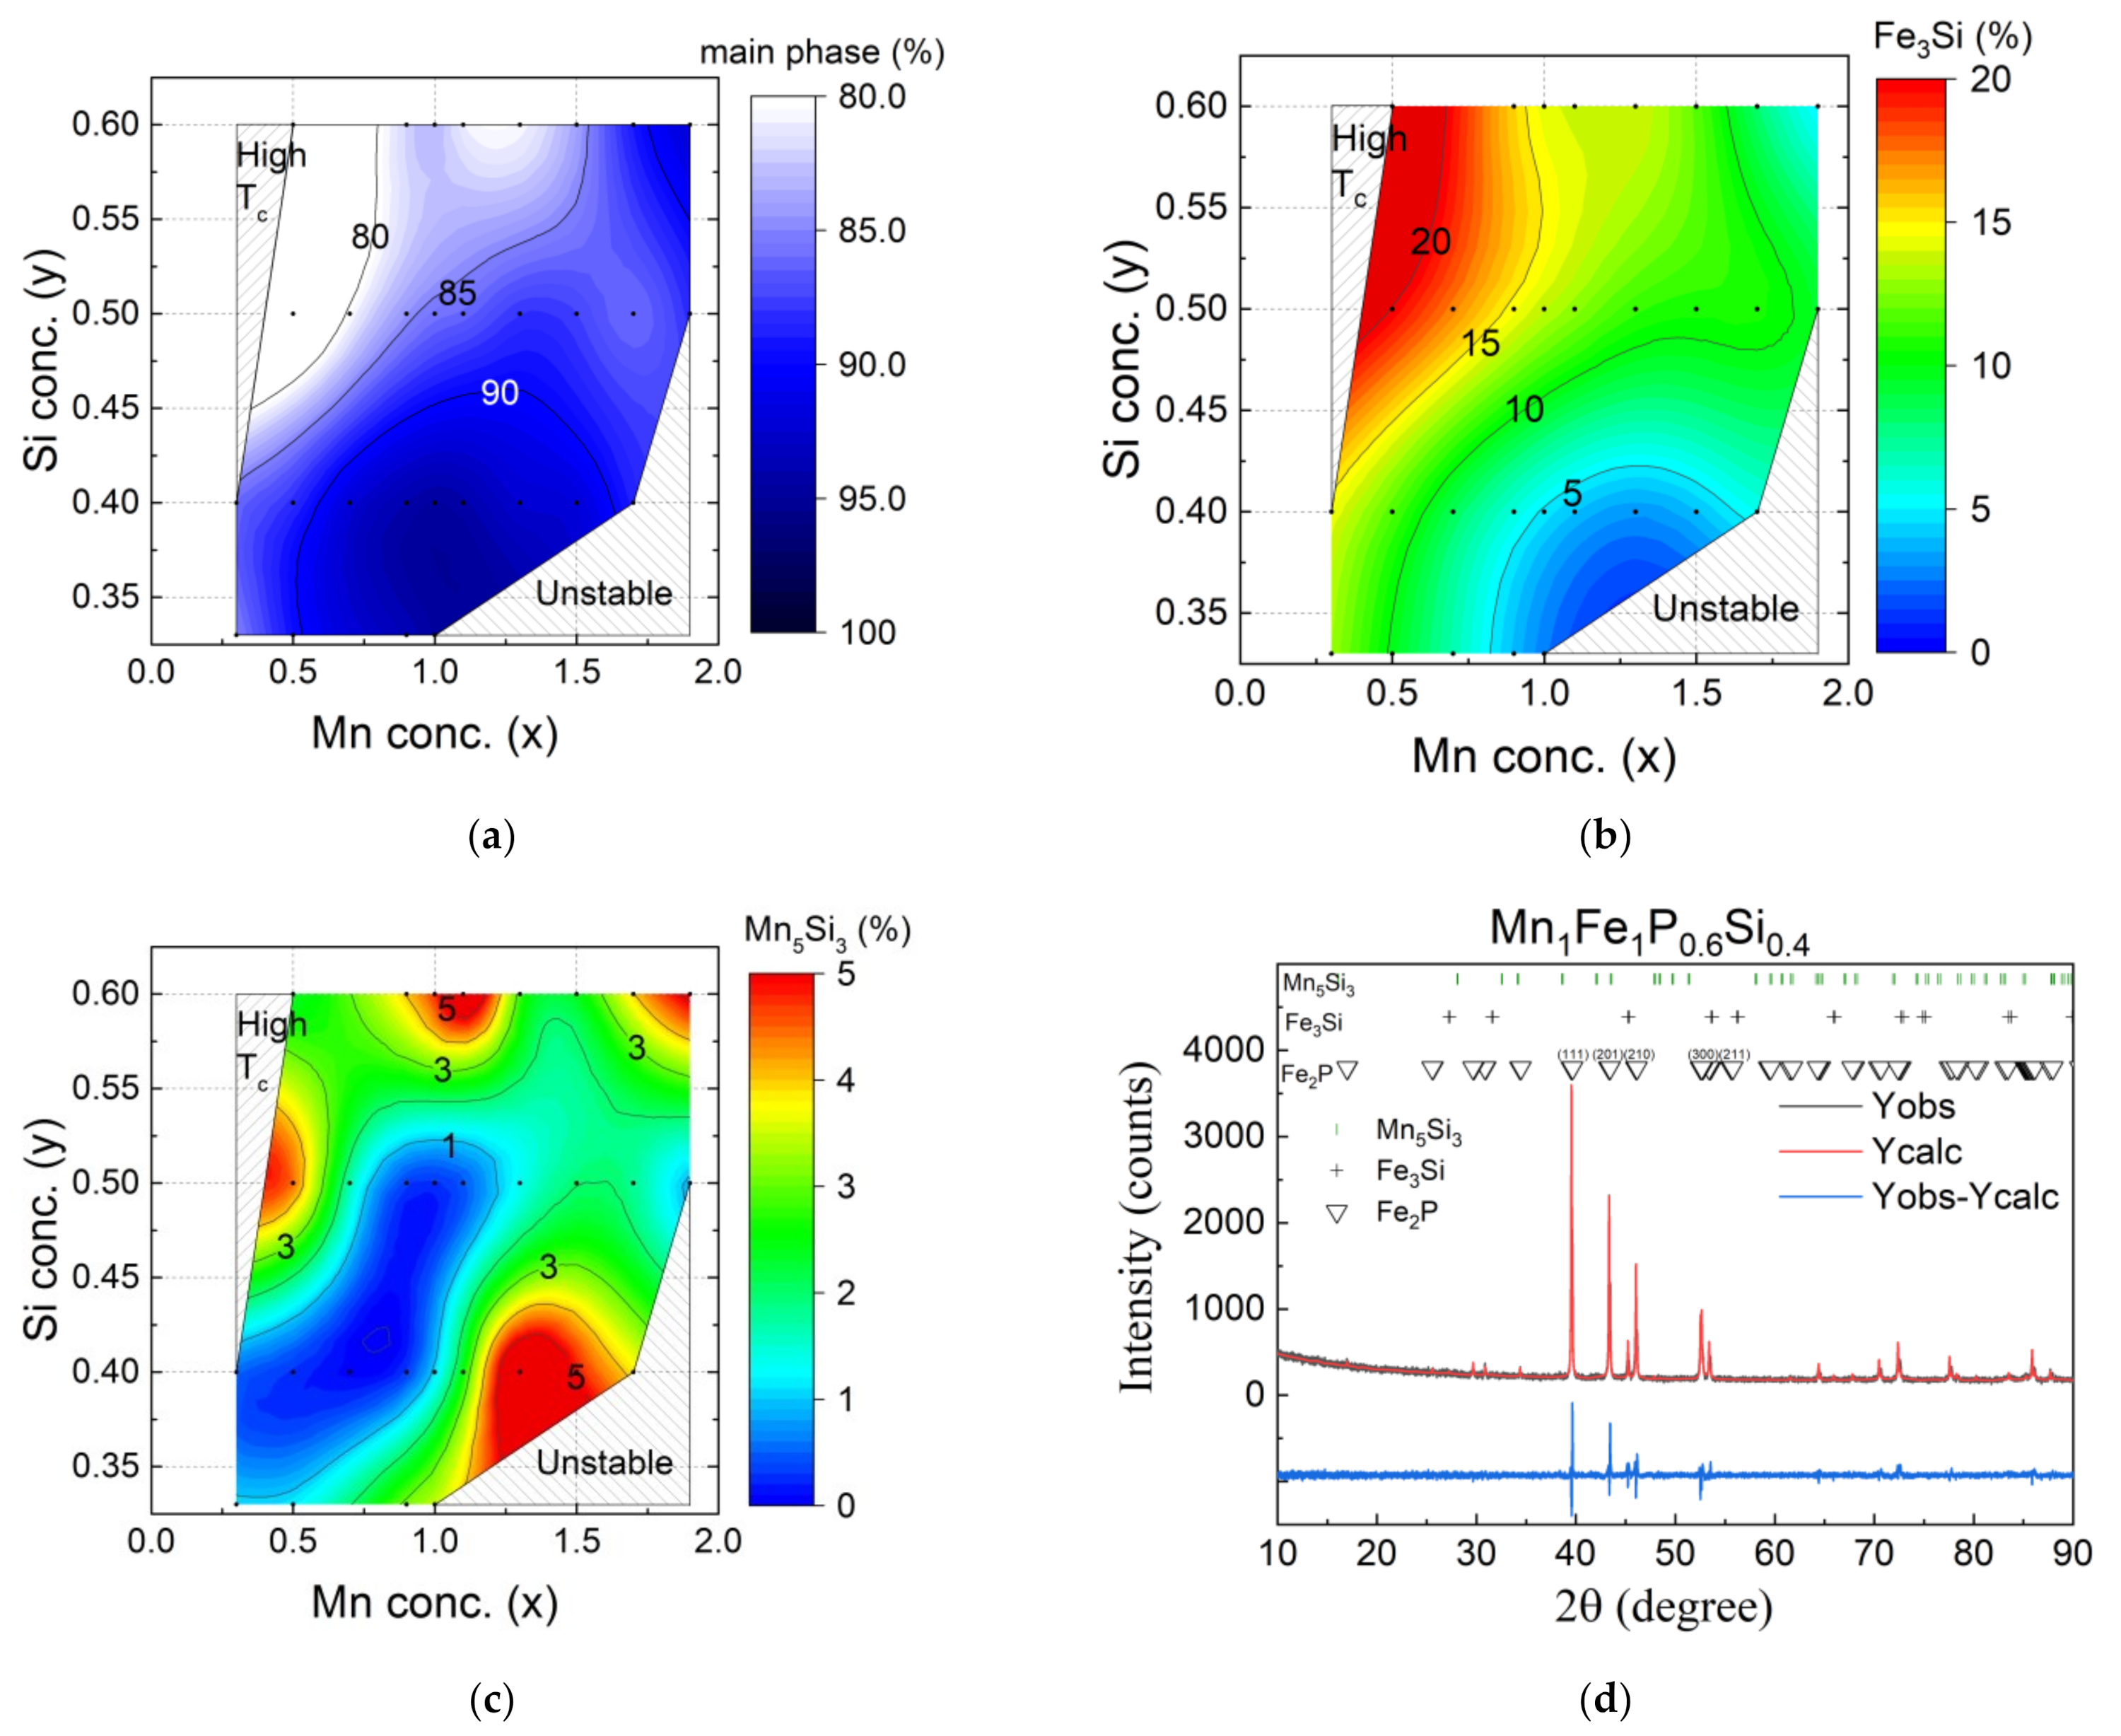
3.1. Structure
3.2. Magnetic Properties of MnxFe2−xP1−ySiy
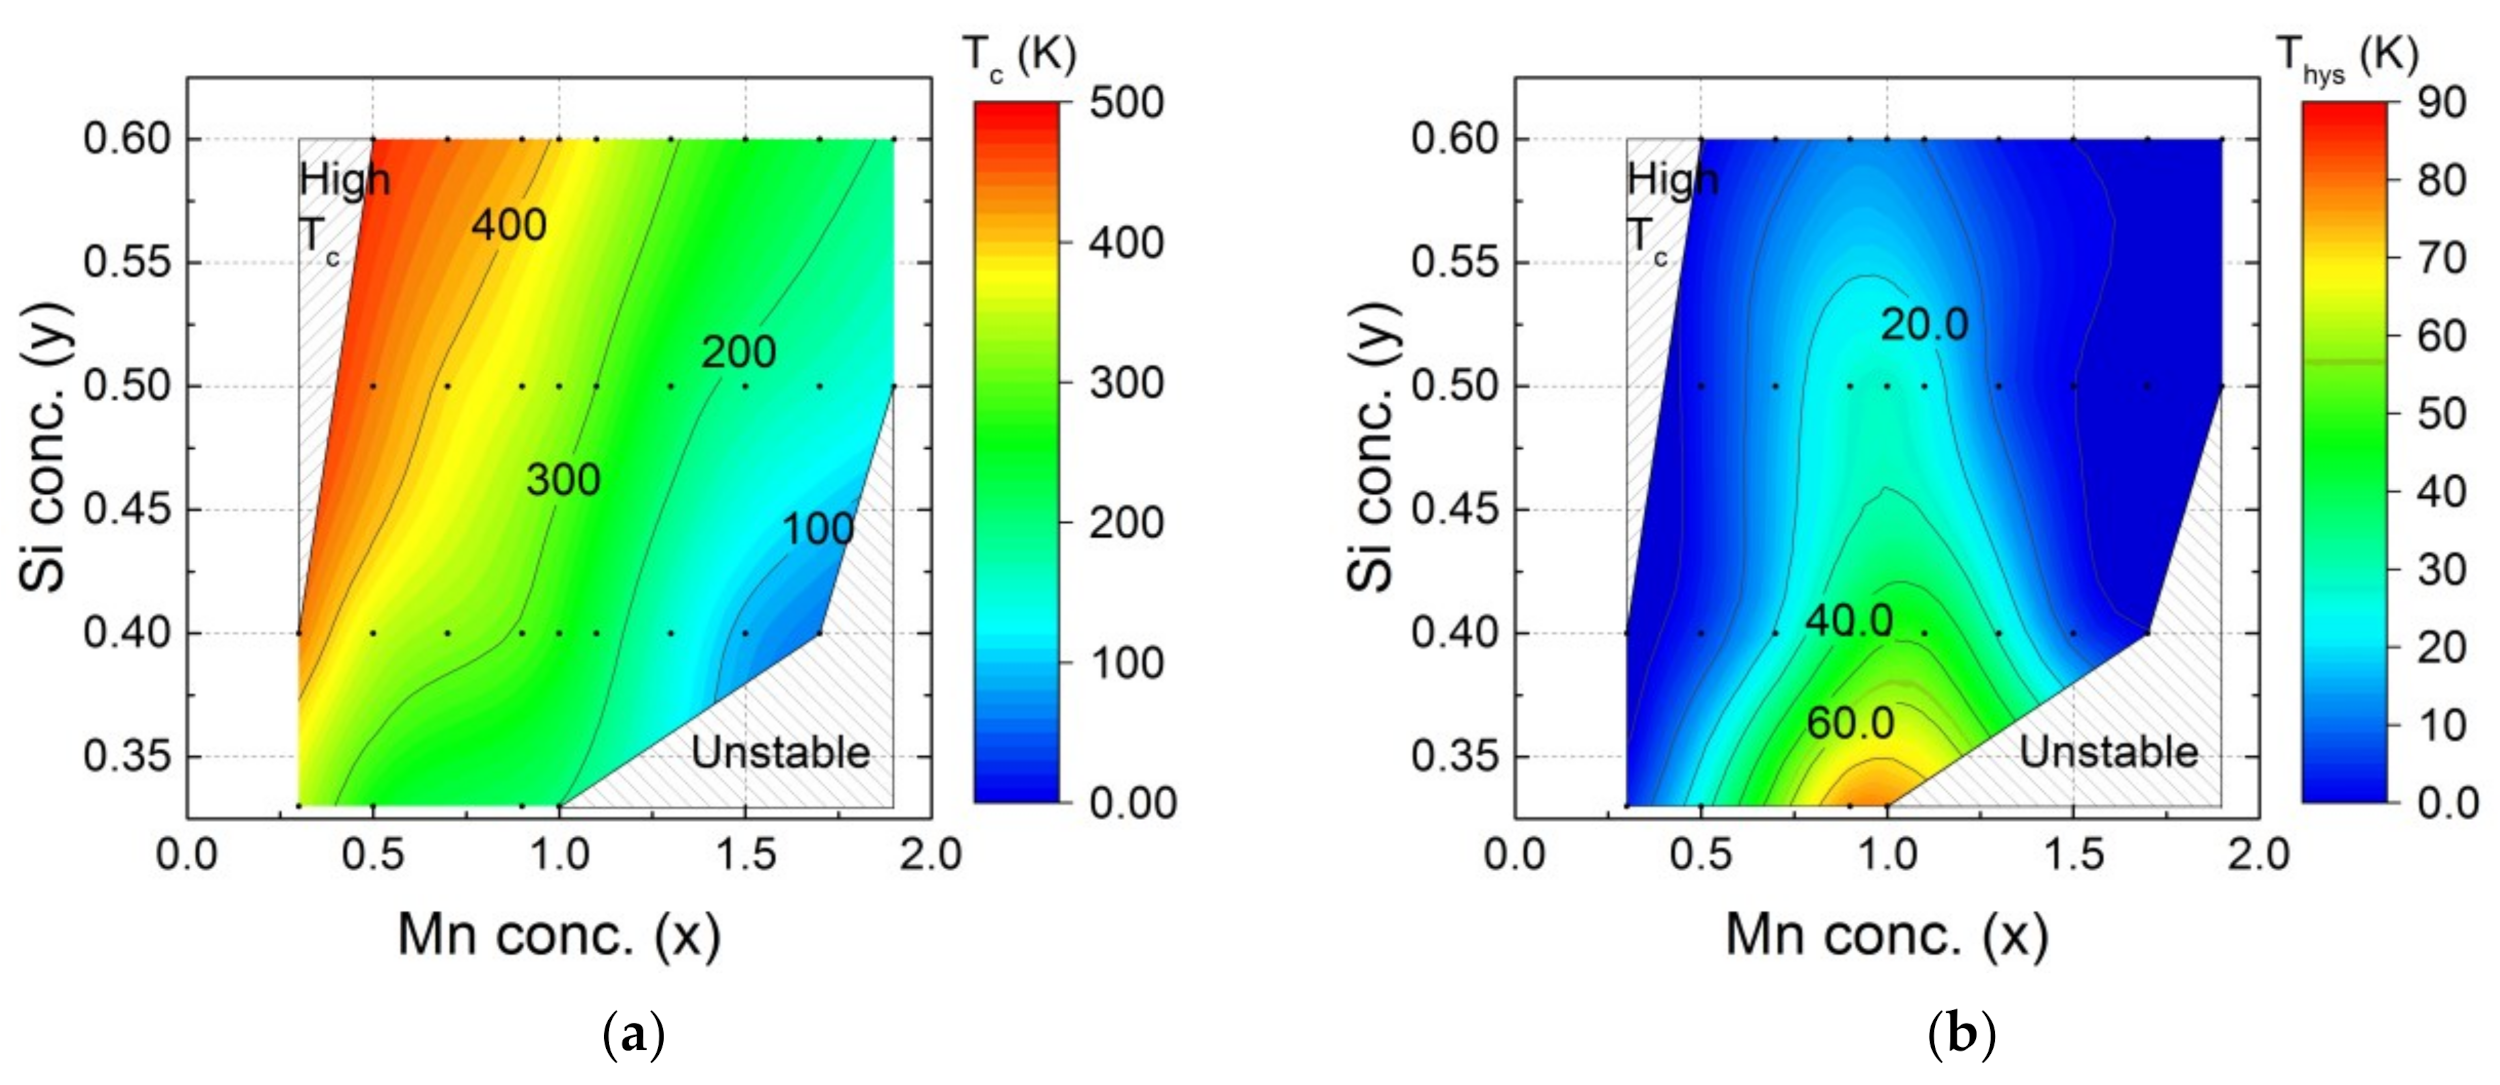
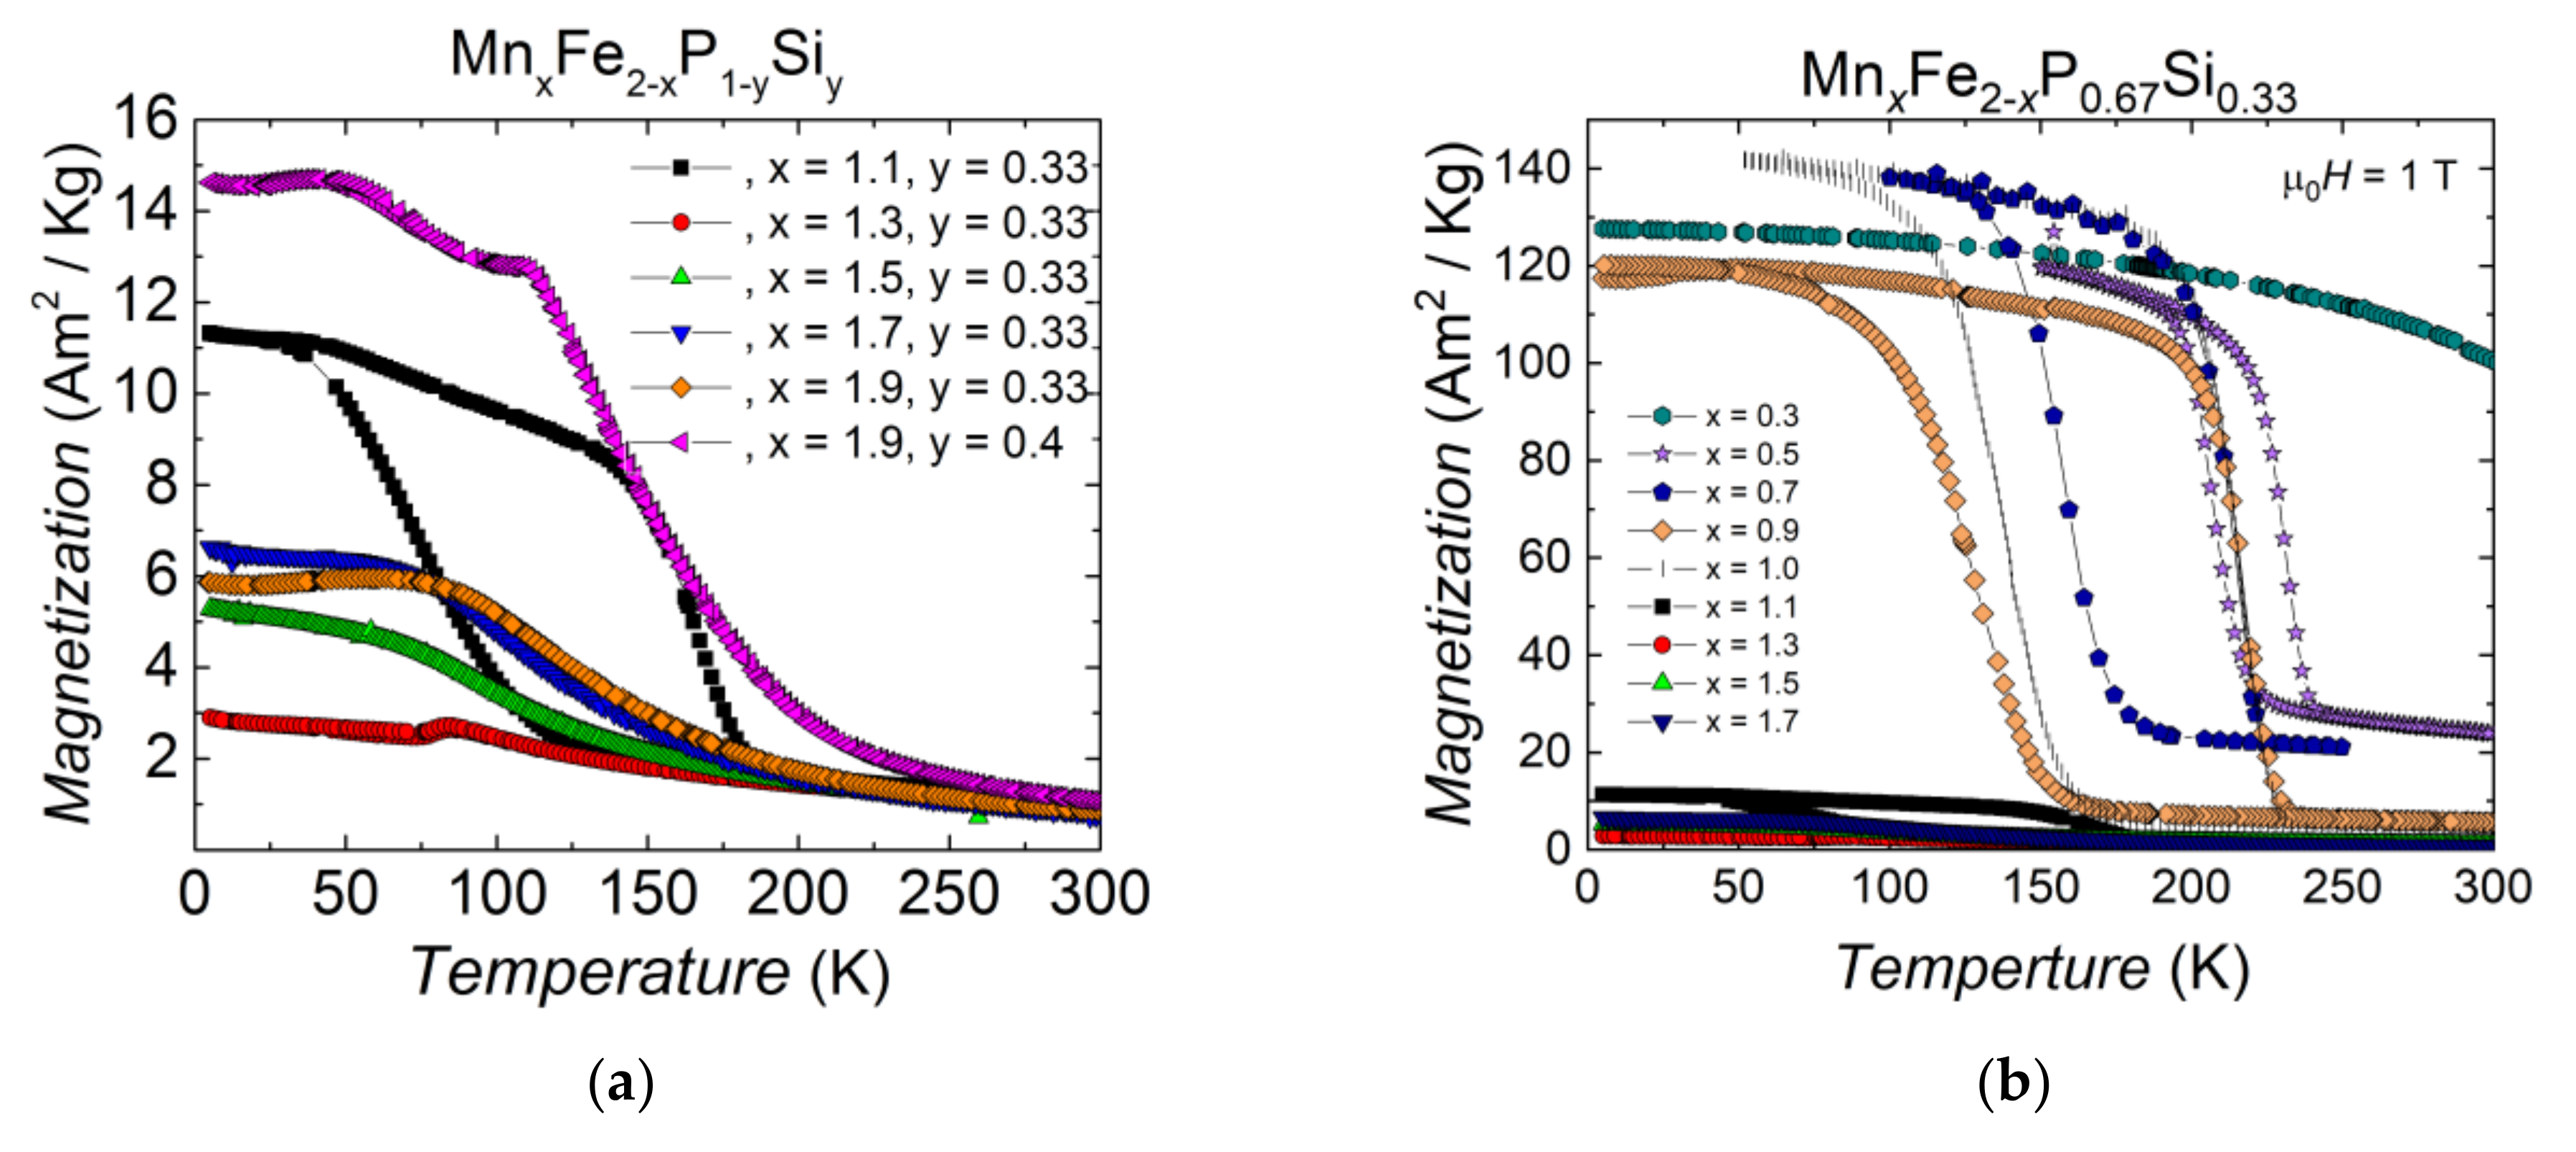
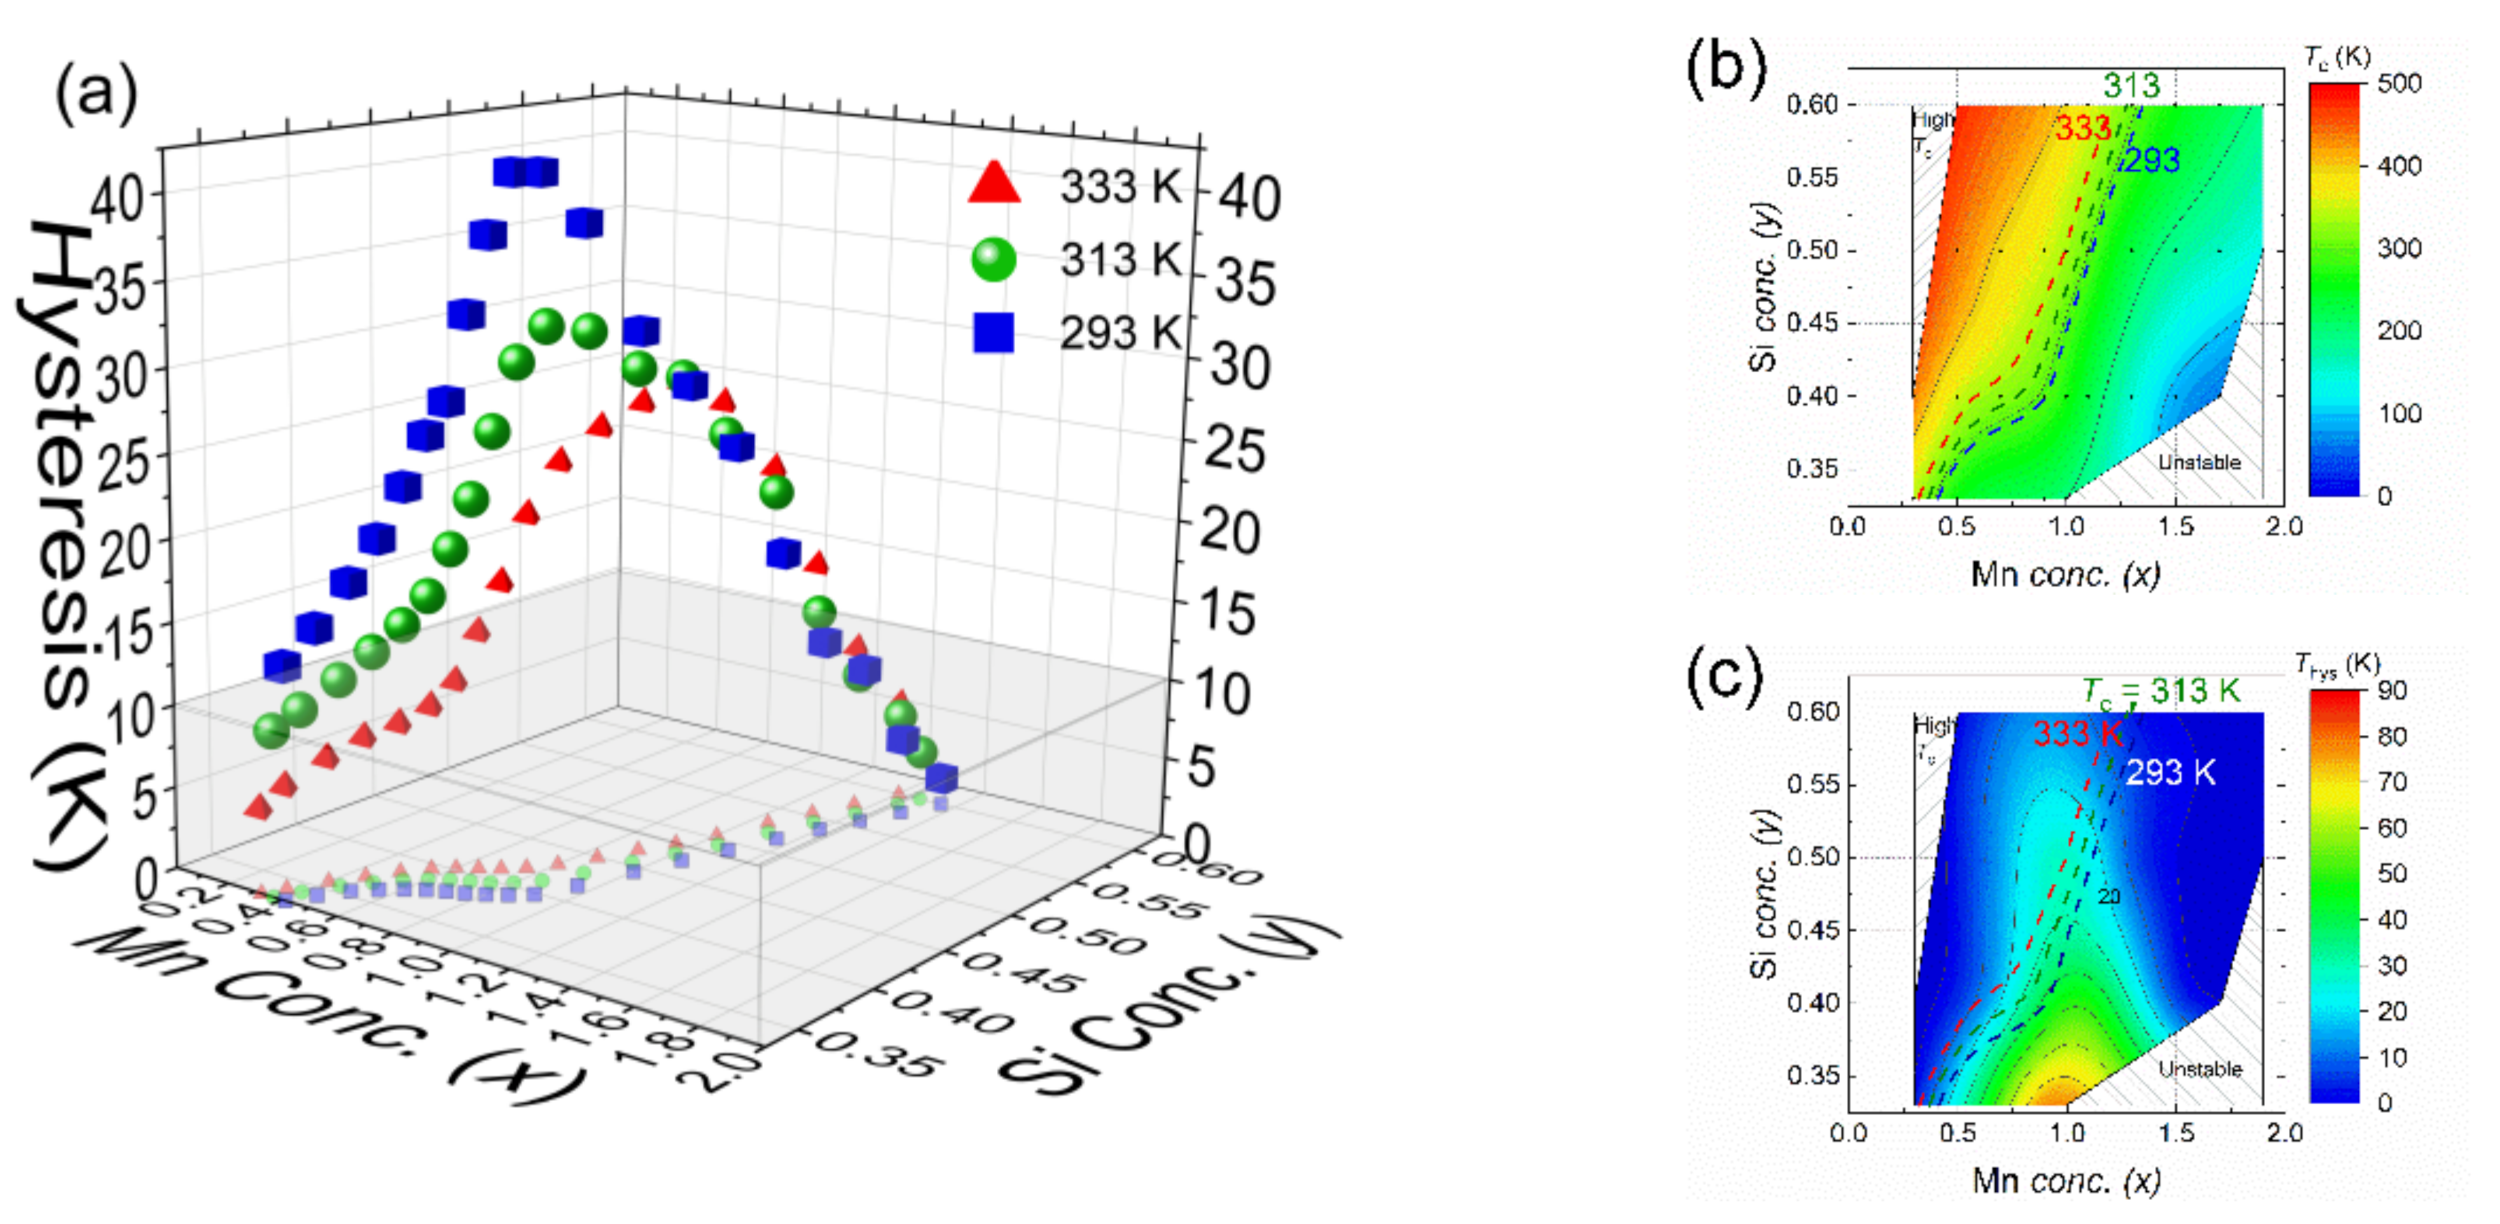
3.2.1. Transition Temperature and Thermal Hysteresis
3.2.2. Unstable Compositions
4. Discussion
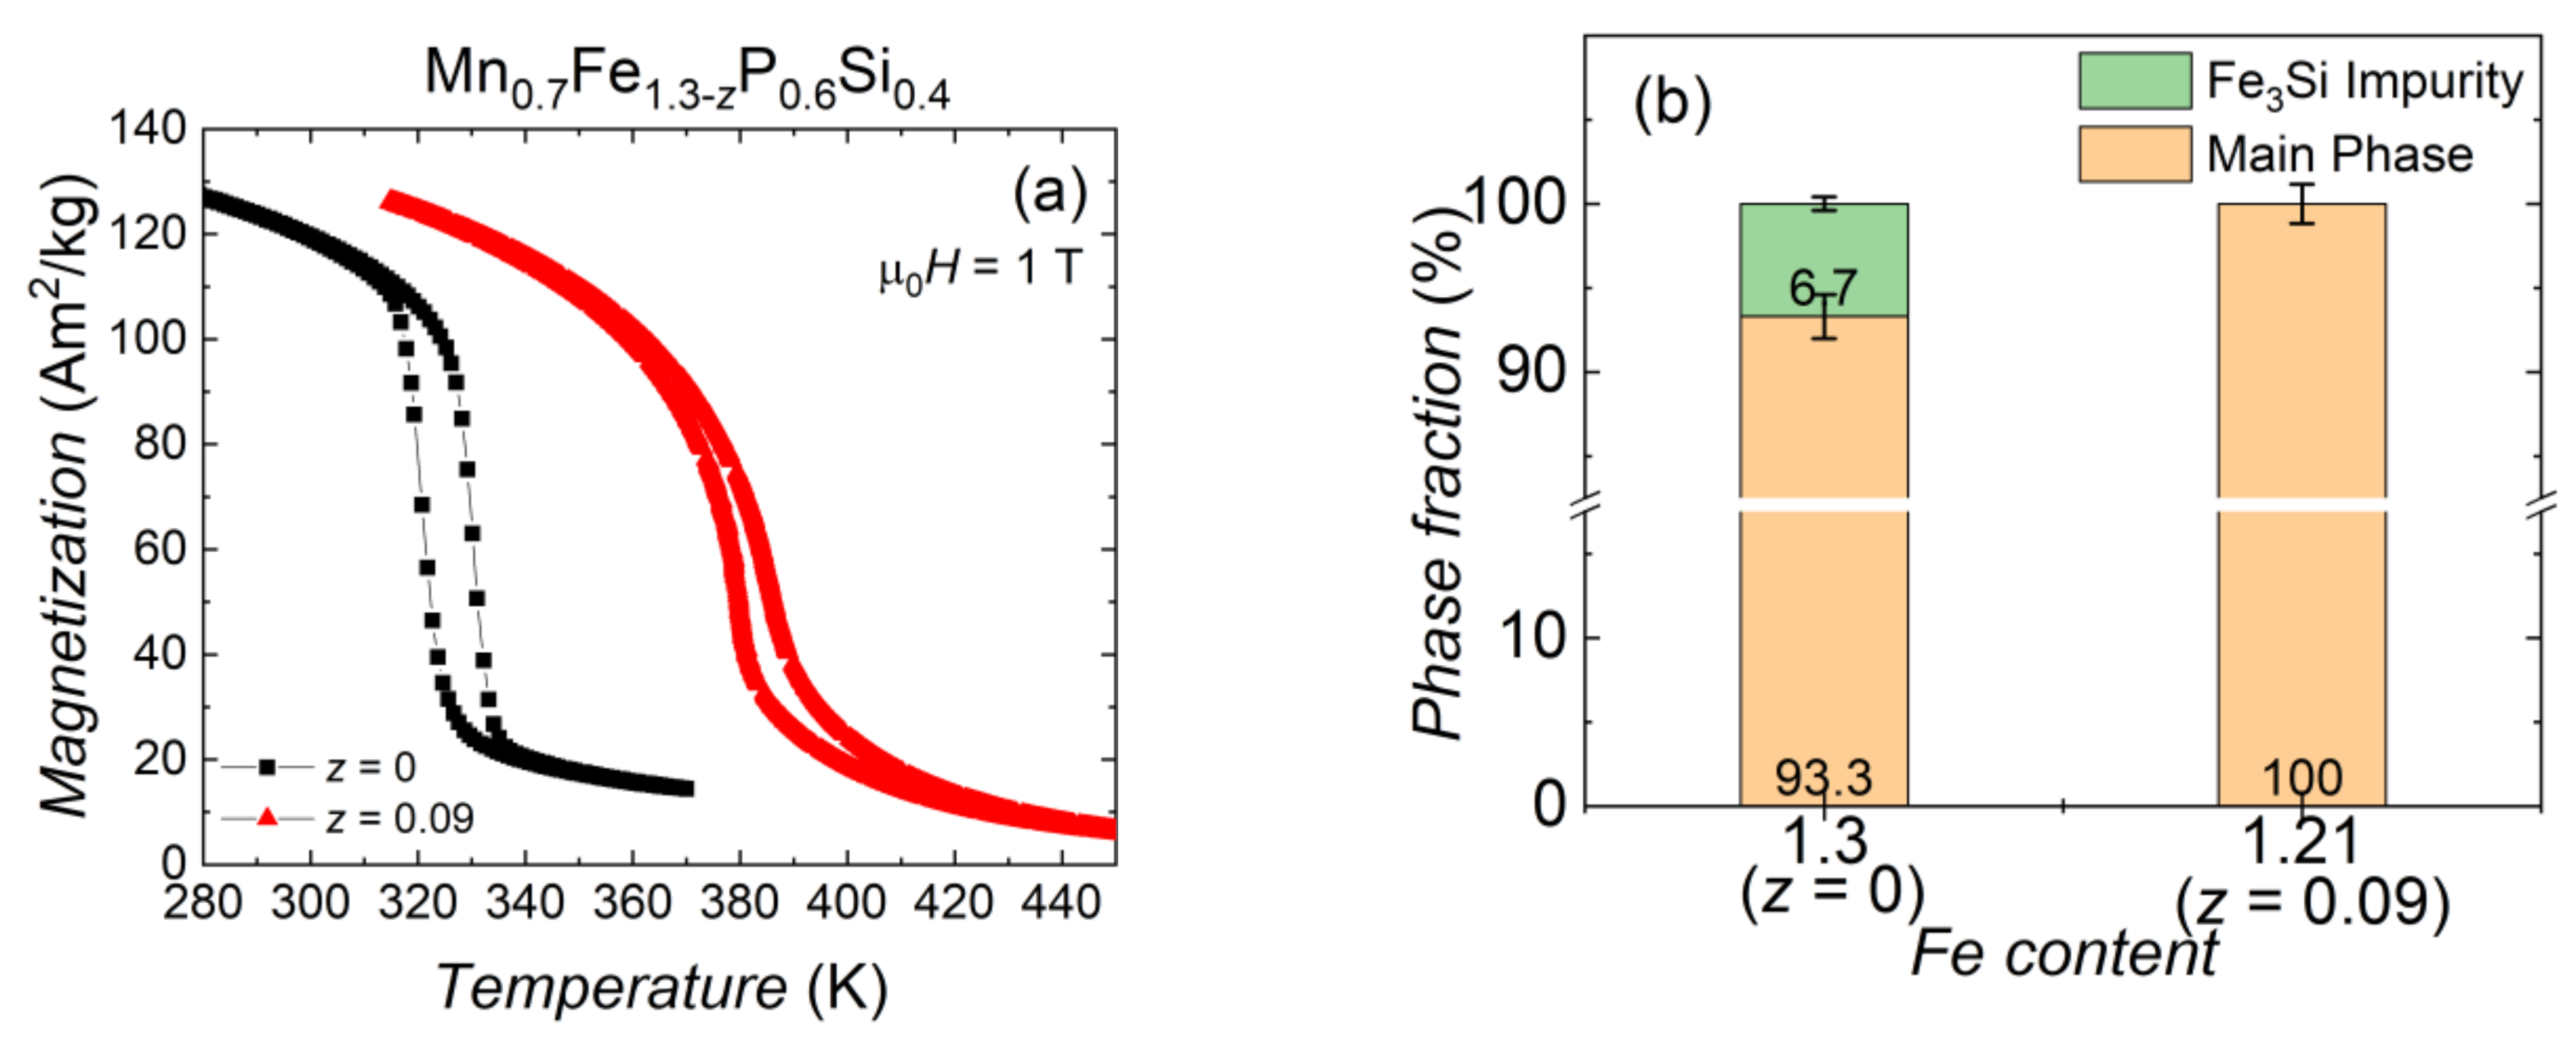
4.1. Impurity Phase
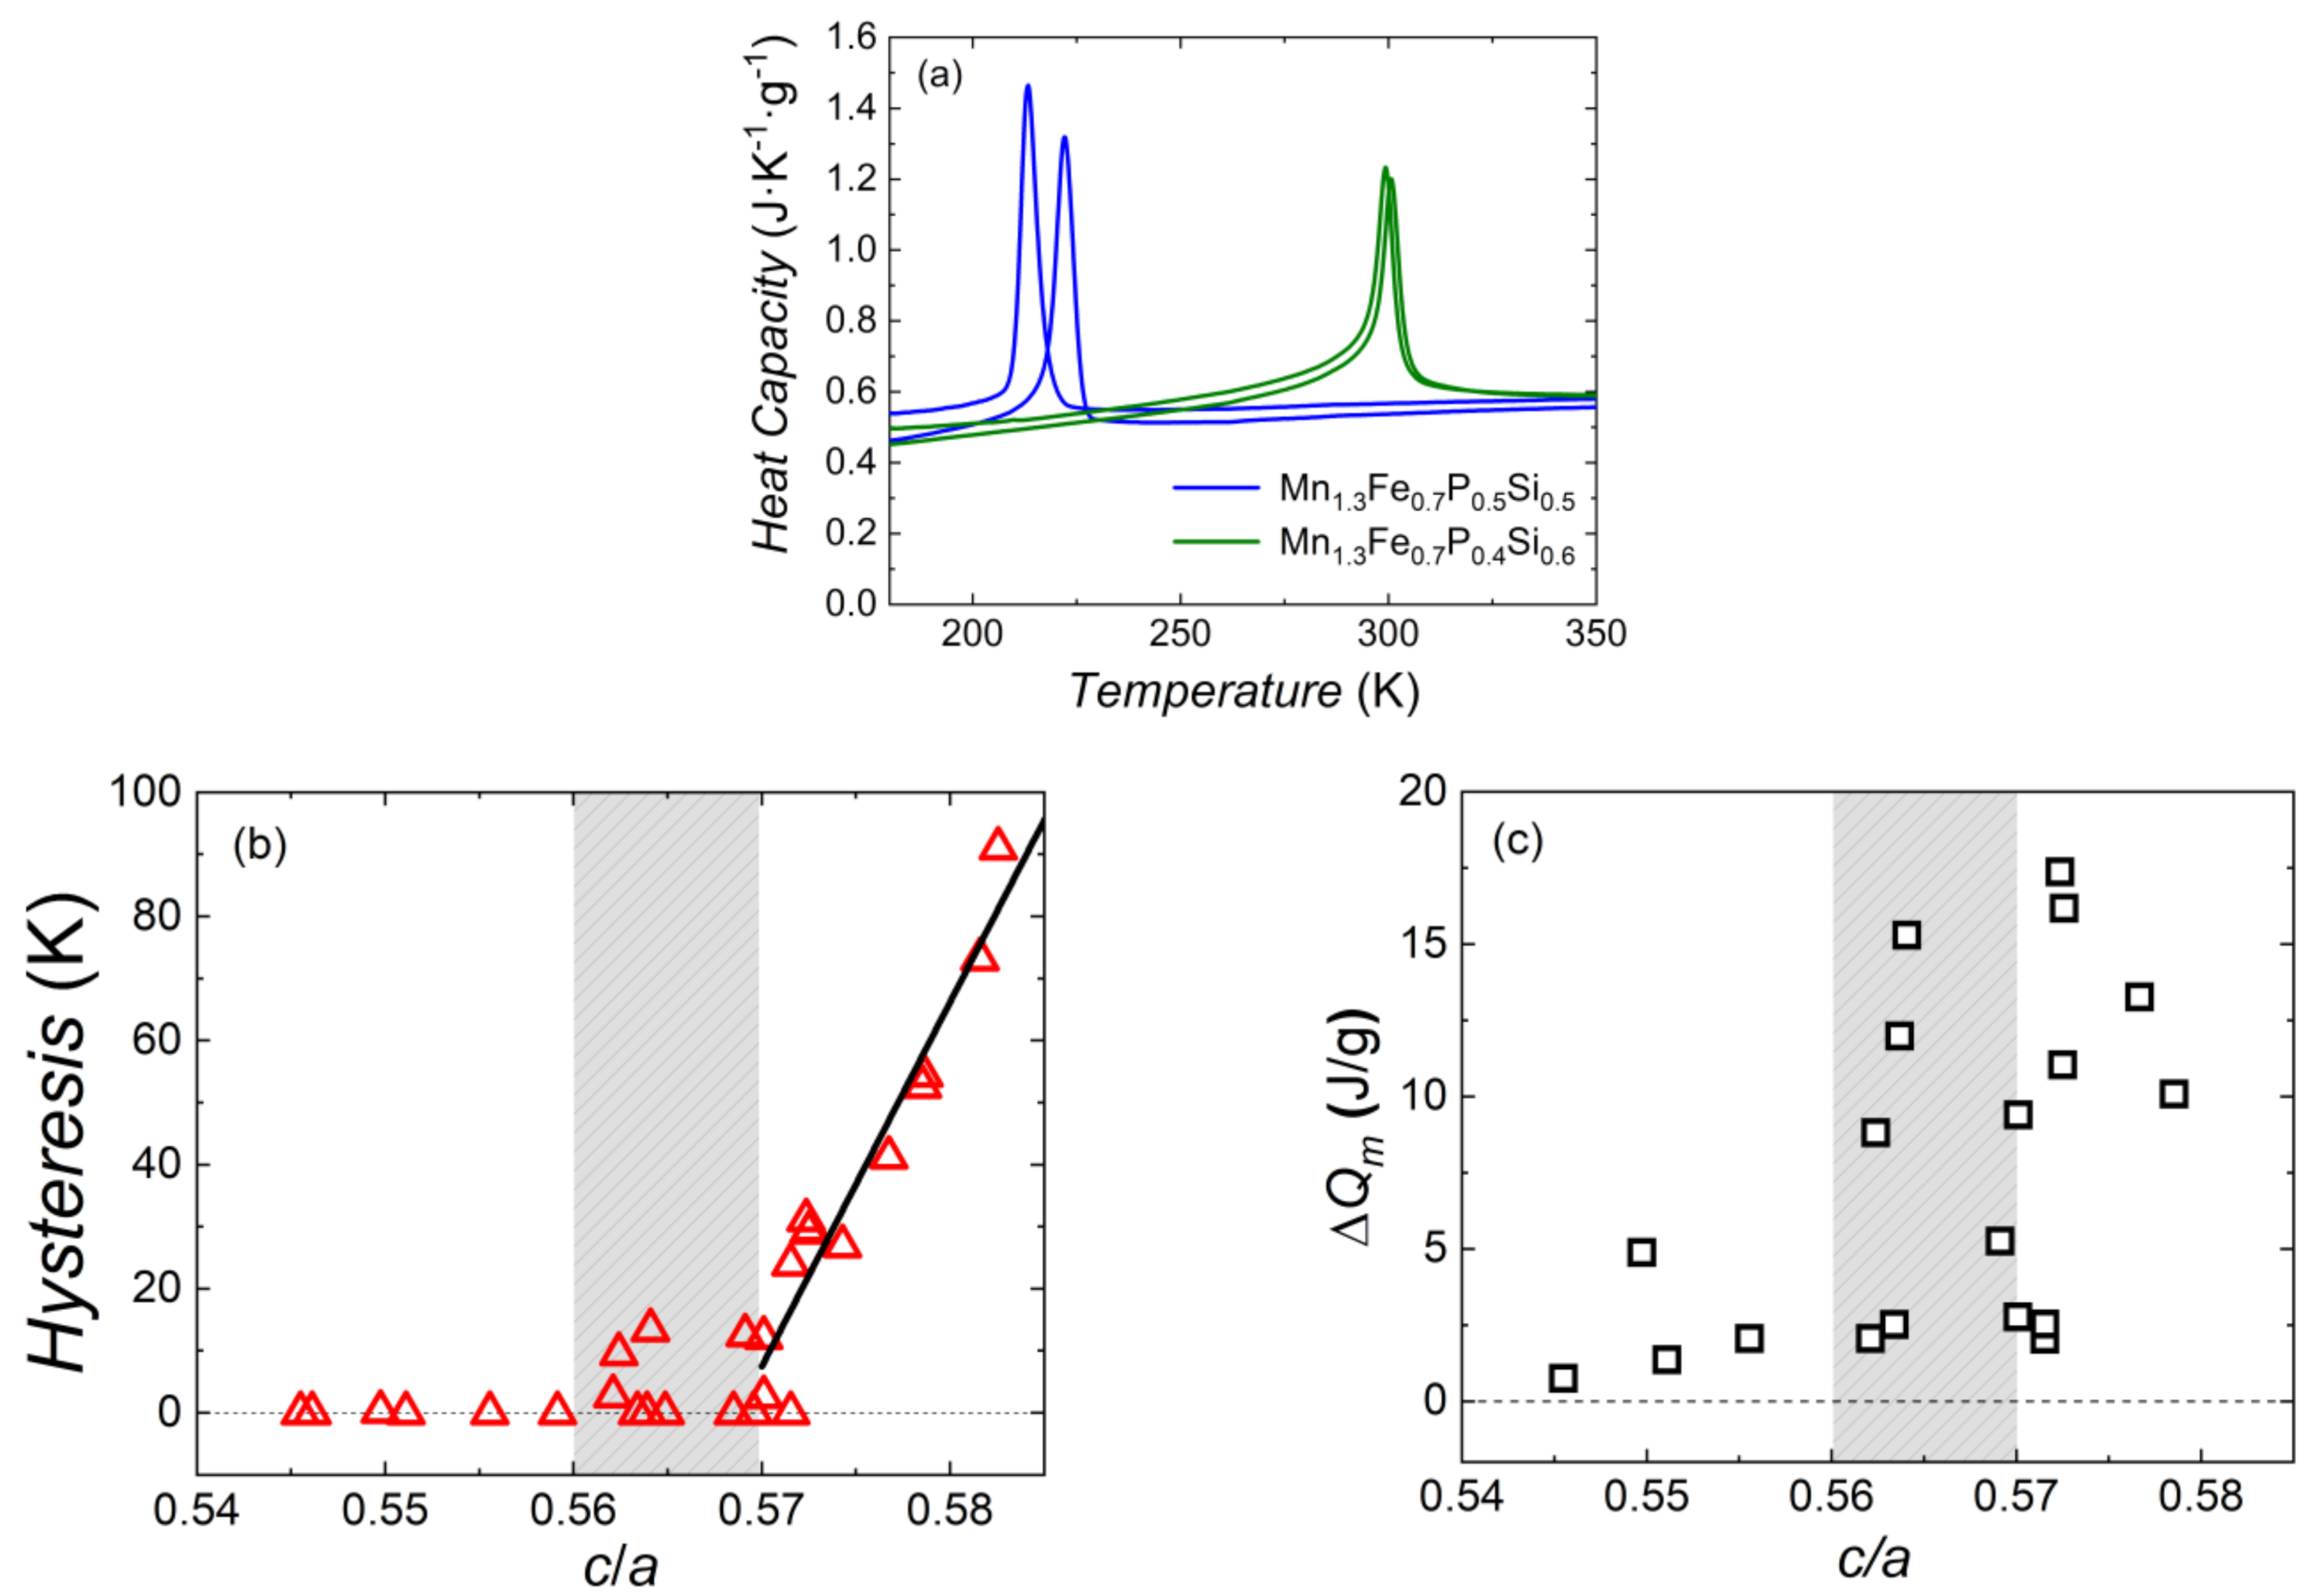
4.2. Heat of Transformation and Thermal Hysteresis as a Function of Structural Parameters
4.3. Suitable Materials for Magnetic Energy Conversion Applications
5. Conclusions
Author Contributions
Funding
Data Availability Statement
Acknowledgments
Conflicts of Interest
References
- Cyrot, M.; Décorps, M.; Diény, B.; de Lacheisserie, E.d.T.; Néel, L.L.; Geoffroy, O. Magnetism, Materials ans Applications; Lacheisserie, É.d.T.d., Gignoux, D., Schlenker, M., Eds.; Springer: Berlin/Heidelberg, Germany, 2005; p. 542. [Google Scholar]
- Pecharsky, V.K.; Gschneidner, K.A. Magnetocaloric effect and magnetic refrigeration. J. Magn. Magn. Mater. 1999, 200, 44–56. [Google Scholar] [CrossRef]
- Phan, M.-H.; Yu, S.-C. Review of the magnetocaloric effect in manganite materials. J. Magn. Magn. Mater. 2007, 308, 325–340. [Google Scholar] [CrossRef]
- Kirol, L.D.; Mills, J.I. Numerical analysis of thermomagnetic generators. J. Appl. Phys. 1984, 56, 824–828. [Google Scholar] [CrossRef]
- Zhan, G.-D.; Kuntz, J.D.; Mukherjee, A.K.; Zhu, P.; Koumoto, K.J.S.M. Thermoelectric properties of carbon nanotube/ceramic nanocomposites. Scr. Mater. 2006, 54, 77–82. [Google Scholar] [CrossRef]
- Pecharsky, V.K.; Gschneidner, K.A. Giant magnetocaloric effect in Gd-5(Si2Ge2). Phys. Rev. Lett 1997, 78, 4494–4497. [Google Scholar] [CrossRef]
- Pecharsky, V.K.; Gschneidner, K.A. Tunable magnetic regenerator alloys with a giant magnetocaloric effect for magnetic refrigeration from similar to 20 to similar to 290 K. Appl. Phys. Lett. 1997, 70, 3299–3301. [Google Scholar] [CrossRef]
- Aksoy, S.; Yucel, A.; Elerman, Y.; Krenke, T.; Acet, M.; Moya, X.; Manosa, L. The influence of gallium on the magnetocaloric properties of Gd5Si2Ge2. J. Alloys Compd. 2008, 460, 94–98. [Google Scholar] [CrossRef]
- Hu, F.; Shen, B.-g.; Sun, J.-r.; Cheng, Z.-h.; Rao, G.-h.; Zhang, X.-x. Influence of negative lattice expansion and metamagnetic transition on magnetic entropy change in the compound LaFe11.4Si1.6. Appl. Phys. Lett. 2001, 78, 3675–3677. [Google Scholar] [CrossRef]
- Fujieda, S.; Fujita, A.; Fukamichi, K. Large magnetocaloric effect in La (FexSi1−x)13 itinerant-electron metamagnetic compounds. Appl. Phys. Lett. 2002, 81, 1276–1278. [Google Scholar] [CrossRef]
- Hu, F.X.; Shen, B.G.; Sun, J.R.; Wang, G.J.; Cheng, Z.H. Very large magnetic entropy change near room temperature in LaFe11.2Co0.7Si1.1. Appl. Phys. Lett. 2002, 80, 826–828. [Google Scholar] [CrossRef]
- Tegus, O.; Bruck, E.; Buschow, K.H.J.; de Boer, F.R. Transition-metal-based magnetic refrigerants for room-temperature applications. Nature 2002, 415, 150–152. [Google Scholar] [CrossRef] [PubMed]
- Trung, N.T.; Ou, Z.Q.; Gortenmulder, T.J.; Tegus, O.; Buschow, K.H.J.; Bruck, E. Tunable thermal hysteresis in MnFe(P,Ge) compounds. Appl. Phys. Lett. 2009, 94, 102513. [Google Scholar] [CrossRef] [Green Version]
- Dung, N.H.; Zhang, L.; Ou, Z.Q.; Brück, E. From first-order magneto-elastic to magneto-structural transition in (Mn,Fe)1.95P0.50Si0.50 compounds. Appl. Phys. Lett. 2011, 99, 092511. [Google Scholar] [CrossRef] [Green Version]
- Yibole, H.; Guillou, F.; Zhang, L.; Van Dijk, N.; Brück, E.J.J.o.P.D.A.P. Direct measurement of the magnetocaloric effect in MnFe (P, X)(X= As, Ge, Si) materials. J. Phys. D Appl. Phys. 2014, 47, 075002. [Google Scholar] [CrossRef]
- Tegus, O.; Fuquan, B.; Dagula, W.; Zhang, L.; Brück, E.; Si, P.Z.; Boer, F.R.; Buschow, K.H.J. Magnetic-entropy change in Mn1.1Fe0.9P0.7As0.3–xGex. J. Alloy. Compd. 2005, 396, 6–9. [Google Scholar] [CrossRef]
- Krenke, T.; Acet, M.; Wassermann, E.F.; Moya, X.; Mañosa, L.; Planes, A. Martensitic transitions and the nature of ferromagnetism in the austenitic and martensitic states of Ni−Mn−Sn alloys. Phys. Rev. B 2005, 72. [Google Scholar] [CrossRef] [Green Version]
- Liu, J.; You, X.; Huang, B.; Batashev, I.; Maschek, M.; Gong, Y.; Miao, X.; Xu, F.; van Dijk, N.; Brück, E. Reversible low-field magnetocaloric effect in Ni-Mn-In-based Heusler alloys. Phys. Rev. Mater. 2019, 3, 084409. [Google Scholar] [CrossRef] [Green Version]
- Wang, W.; Li, H.; Ren, J.; Fu, J.; Zhai, Q.; Luo, Z.; Zheng, H. Enhanced magnetocaloric properties in annealed Heusler Ni–Mn–Sn ribbons. J. Magn. Magn. Mater. 2015, 374, 153–156. [Google Scholar] [CrossRef]
- Trombi, L.; Cugini, F.; Rosa, R.; Amadè, N.S.; Chicco, S.; Solzi, M.; Veronesi, P. Rapid microwave synthesis of magnetocaloric Ni–Mn–Sn Heusler compounds. Scr. Mater. 2020, 176, 63–66. [Google Scholar] [CrossRef]
- Thanh, D.T.C.; Brueck, E.; Trung, N.T.; Klaasse, J.C.P.; Buschow, K.H.J.; Ou, Z.Q.; Tegus, O.; Caron, L. Structure, magnetism, and magnetocaloric properties of MnFeP1-xSix compounds. J. Appl. Phys. 2008, 103, 07B318. [Google Scholar] [CrossRef]
- Katagiri, K.; Nakamura, K.; Wada, H. Magnetocaloric properties and magnetic refrigerant capacity of MnFeP1−xSix. J. Alloy. Compd. 2013, 553, 286–290. [Google Scholar] [CrossRef]
- Höglin, V.; Hudl, M.; Sahlberg, M.; Nordblad, P.; Beran, P.; Andersson, Y. The crystal and magnetic structure of the magnetocaloric compound FeMnP0.5Si0.5. J. Solid State Chem. 2011, 184, 2434–2438. [Google Scholar] [CrossRef] [Green Version]
- Hudl, M.; Häggström, L.; Delczeg-Czirjak, E.-K.; Höglin, V.; Sahlberg, M.; Vitos, L.; Eriksson, O.; Nordblad, P.; Andersson, Y. Strongly enhanced magnetic moments in ferromagnetic FeMnP0. 5Si0. 5. Appl. Phys. Lett. 2011, 99, 152502. [Google Scholar] [CrossRef] [Green Version]
- Lai, J.; You, X.; Dugulan, I.; Huang, B.; Liu, J.; Maschek, M.; van Eijck, L.; van Dijk, N.; Brück, E. Tuning the magneto-elastic transition of (Mn,Fe,V)2(P,Si) alloys to low magnetic field applications. J. Alloys Compd. 2020, 821, 153451. [Google Scholar] [CrossRef]
- Lai, J.; Huang, B.; Miao, X.; Van Thang, N.; You, X.; Maschek, M.; van Eijck, L.; Zeng, D.; van Dijk, N.; Brück, E. Combined effect of annealing temperature and vanadium substitution for mangetocaloric Mn1.2-xVxFe0.75P0.5Si0.5 alloys. J. Alloys Compd. 2019, 803, 671–677. [Google Scholar] [CrossRef]
- Maschek, M.; You, X.; Boeije, M.F.J.; Chernyshov, D.; van Dijk, N.H.; Brück, E. Charge redistribution and the magnetoelastic transition across the first-order magnetic transition in (Mn,Fe)2(P,Si,B). Phys. Rev. B 2018, 98. [Google Scholar] [CrossRef] [Green Version]
- Guillou, F.; Porcari, G.; Yibole, H.; van Dijk, N.; Bruck, E. Taming the First-Order Transition in Giant Magnetocaloric Materials. Adv. Mater. 2014, 26, 2671–2675. [Google Scholar] [CrossRef] [PubMed] [Green Version]
- Guillou, F.; Yibole, H.; Porcari, G.; Zhang, L.; van Dijk, N.H.; Brück, E. Magnetocaloric effect, cyclability and coefficient of refrigerant performance in the MnFe(P, Si, B) system. J. Appl. Phys. 2014, 116, 063903. [Google Scholar] [CrossRef]
- Miao, X.F.; Thang, N.V.; Caron, L.; Yibole, H.; Smith, R.I.; van Dijk, N.H.; Brück, E. Tuning the magnetoelastic transition in (Mn,Fe)2(P,Si) by B, C, and N doping. Scr. Mater. 2016, 124, 129–132. [Google Scholar] [CrossRef]
- Thang, N.V.; Miao, X.F.; van Dijk, N.H.; Brück, E. Structural and magnetocaloric properties of (Mn,Fe)2(P,Si) materials with added nitrogen. J. Alloys Compd. 2016, 670, 123–127. [Google Scholar] [CrossRef] [Green Version]
- Thang, N.; Yibole, H.; Miao, X.; Goubitz, K.; Van Eijck, L.; Van Dijk, N.; Brück, E.J.J. Effect of Carbon Doping on the Structure and Magnetic Phase Transition in (Mn, Fe)2(P, Si). JOM 2017, 69, 1432–1438. [Google Scholar] [CrossRef] [Green Version]
- Dung, N.H.; Ou, Z.Q.; Caron, L.; Zhang, L.; Thanh, D.T.C.; de Wijs, G.A.; de Groot, R.A.; Buschow, K.H.J.; Bruck, E. Mixed Magnetism for Refrigeration and Energy Conversion. Adv. Energy Mater. 2011, 1, 1215–1219. [Google Scholar] [CrossRef] [Green Version]
- Höglin, V.; Cedervall, J.; Andersson, M.S.; Sarkar, T.; Hudl, M.; Nordblad, P.; Andersson, Y.; Sahlberg, M. Phase diagram, structures and magnetism of the FeMnP1−xSix system. RSC Adv. 2015, 5, 8278–8284. [Google Scholar] [CrossRef]
- Rodriguez-Carvajal, J. Abstract Satelite Meeting on Powder Diffraction; Congr. Int. Union of Crystallography: Toulouse, France, 1990. [Google Scholar]
- Brück, E.; Tegus, O.; Cam Thanh, D.T.; Trung, N.T.; Buschow, K.H.J. A review on Mn based materials for magnetic refrigeration: Structure and properties. Int. J. Refrig. 2008, 31, 763–770. [Google Scholar] [CrossRef]
- Leif, L.; Gulzar, T.; Olof, B.; Bertil, C.; Stig, R. First Order Magnetic Phase Transition in Fe2P. Phys. Scr. 1978, 17, 39. [Google Scholar]


| Mn Conc. | Si Conc. | TC | Thys | Heat of Trans-Formation | a | c | c/a | Main Phase % | Fe3Si Phase % | Fe5Si3 Phase | |||
|---|---|---|---|---|---|---|---|---|---|---|---|---|---|
| (x) | (y) | (K) | (K) | (J/g) | (Å) | (Å) | % | ||||||
| 0.3 | 0.33 | 362.3 | 0.0 | 2.0 | 5.99145(3) | 3.42440(3) | 0.5715 | 84.0 | ±0.8 | 14.8 | ±0.3 | 1.3 | ±0.4 |
| 0.5 | 0.33 | 224.3 | 23.9 | - 1 | 5.99147(5) | 3.42442(3) | 0.5715 | 90.4 | ±1.4 | 8.7 | ±0.3 | 1.0 | ±0.1 |
| 0.7 | 0.33 | 189.6 | 76.6 | - 1 | 5.97865(6) | 3.47447(4) | 0.5811 | 89.7 | ±1.3 | 9.0 | ±0.4 | 1.3 | ±0.2 |
| 0.9 | 0.33 | 214.5 | 91.0 | - 1 | 5.98880(4) | 3.48886(3) | 0.5826 | 92.1 | ±1.5 | 3.9 | ±0.3 | 4.0 | ±0.7 |
| 1.0 * | 0.33 | 211.7 | 73.1 | - 1 | 5.99761(4) | 3.48817(3) | 0.5816 | 95.8 | ±1.1 | 1.4 | ±0.2 | 2.8 | ±0.2 |
| 0.3 | 0.4 | 469.4 | 2.7 | 2.5 | 6.02914(5) | 3.39681(4) | 0.5634 | 88.2 | ±1.2 | 11.7 | ±0.4 | 0.1 | ±0.1 |
| 0.5 | 0.4 | 324.0 | 2.6 | 2.8 | 6.01422(5) | 3.42870(4) | 0.5701 | 86.5 | ±1.1 | 13.2 | ±0.4 | 0.3 | ±0.1 |
| 0.7 | 0.4 | 327.0 | 12.5 | 5.2 | 6.02434(5) | 3.45378(3) | 0.5733 | 93.7 | ±1.1 | 6.3 | ±0.4 | 0.3 | ±0.1 |
| 0.9 | 0.4 | 307.1 | 41.2 | 13.3 | 6.02771(4) | 3.47656(8) | 0.5768 | 93.3 | ±1.3 | 6.7 | ±0.4 | - | - |
| 1.0 | 0.4 | 282.2 | 56.4 | 10.1 | 6.01853(7) | 3.48194(5) | 0.5785 | 96.0 | ±1.6 | 3.4 | ±0.3 | 0.6 | ±0.1 |
| 1.1 | 0.4 | 219.6 | 54.4 | - 1 | 6.02441(5) | 3.48591(4) | 0.5786 | 94.4 | ±1.1 | 4.3 | ±0.2 | 1.3 | ±0.2 |
| 1.3 | 0.4 | 146.9 | 26.9 | - 1 | 6.05270(5) | 3.47604(4) | 0.5743 | 90.3 | ±1.2 | 0.2 | ±0.0 | 9.5 | ±0.6 |
| 1.5 | 0.4 | 73.9 | 0.0 | - 1 | 6.08221(4) | 3.46432(3) | 0.5696 | 94.7 | ±1.2 | 1.6 | ±0.4 | 3.7 | ±0.1 |
| 1.7 * | 0.4 | 64.9 | 0.0 | - 1 | 6.11159(5) | 3.45225(3) | 0.5649 | 86.9 | ±2.4 | 9.2 | ±2.6 | 3.9 | ±0.2 |
| 0.5 | 0.5 | 443.3 | 2.7 | 2.0 | 6.06083(6) | 3.40681(4) | 0.5621 | 72.2 | ±2.6 | 21.5 | ±0.8 | 6.3 | ±3.3 |
| 0.7 | 0.5 | 373.0 | 10.9 | 9.4 | 6.04712(8) | 3.44757(6) | 0.5701 | 81.3 | ±1.7 | 18.1 | ±0.7 | 0.6 | ±0.2 |
| 0.9 | 0.5 | 362.7 | 29.5 | 16.2 | 6.05370(6) | 3.46627(5) | 0.5726 | 84.2 | ±1.4 | 15.7 | ±0.5 | 0.2 | ±0.1 |
| 1.0 | 0.5 | 348.6 | 31.1 | 17.4 | 6.06062(4) | 3.46886(3) | 0.5724 | 87.4 | ±0.9 | 12.2 | ±3.4 | 0.4 | ±0.1 |
| 1.3 | 0.5 | 219.1 | 0.0 | - 1 | 6.08292(5) | 3.45815(4) | 0.5685 | 89.5 | ±1.5 | 9.2 | ±0.2 | 1.3 | ±0.2 |
| 1.5 | 0.5 | 182.7 | 0.3 | - 1 | 6.11228(3) | 3.44680(3) | 0.5639 | 88.7 | ±1.0 | 9.2 | ±0.3 | 2.1 | ±0.1 |
| 1.7 | 0.5 | 162.5 | 0.0 | - 1 | 6.14091(5) | 3.43373(4) | 0.5592 | 83.2 | ±1.1 | 14.4 | ±0.6 | 2.4 | ±0.2 |
| 1.9 * | 0.5 | 142.6 | 2.0 | - 1 | 6.17221(5) | 3.41687(3) | 0.5536 | 89.3 | ±1.0 | 10.7 | ±0.7 | - | - |
| 0.5 | 0.6 | 473.9 | 0.0 | 0.7 | 6.12222(5) | 3.33965(4) | 0.5455 | 71.9 | ±0.8 | 26.3 | ±0.5 | 1.8 | ±0.2 |
| 0.7 | 0.6 | 443.6 | 4.4 | 15.4 | 6.13927(5) | 3.34006(4) | 0.5440 | 79.6 | ±1.0 | 17.8 | ±0.4 | 2.6 | ±0.2 |
| 0.9 | 0.6 | 421.9 | 15.4 | 12.0 | 6.09298(8) | 3.43456(6) | 0.5637 | 81.0 | ±1.5 | 14.6 | ±0.6 | 4.4 | ±0.4 |
| 1.0 | 0.6 | 403.0 | 13.4 | 15.3 | 6.09631(5) | 3.43886(4) | 0.5641 | 90.6 | ±1.2 | 8.1 | ±0.4 | 1.3 | ±0.1 |
| 1.1 | 0.6 | 364.3 | 15.2 | 8.8 | 6.1067(1) | 3.4357(9) | 0.5626 | 81.5 | ±1.3 | 16.2 | ±0.5 | 2.3 | ±0.2 |
| 1.3 | 0.6 | 302.1 | 0.2 | 4.9 | 6.1563(1) | 3.38444(9) | 0.5497 | 79.7 | ±1.3 | 20.1 | ±0.5 | 0.3 | ±0.1 |
| 1.5 | 0.6 | 255.2 | 0.0 | 2.0 | 6.14830(5) | 3.41576(3) | 0.5556 | 83.1 | ±1.1 | 15.0 | ±0.5 | 1.9 | ±0.1 |
| 1.7 | 0.6 | 225.8 | 1.3 | 1.4 | 6.17386(8) | 3.40240(5) | 0.5511 | 90.8 | ±1.1 | 4.9 | ±0.0 | 4.4 | ±0.2 |
| 1.9 | 0.6 | 191.6 | 0.4 | - 1 | 6.20058(7) | 3.38632(4) | 0.5461 | 92.1 | ±1.8 | 2.2 | ±0.3 | 5.7 | ±0.6 |
Publisher’s Note: MDPI stays neutral with regard to jurisdictional claims in published maps and institutional affiliations. |
© 2021 by the authors. Licensee MDPI, Basel, Switzerland. This article is an open access article distributed under the terms and conditions of the Creative Commons Attribution (CC BY) license (https://creativecommons.org/licenses/by/4.0/).
Share and Cite
You, X.; Maschek, M.; van Dijk, N.H.H.; Brück, E. Magnetic Phase Diagram of the MnxFe2−xP1−ySiy System. Entropy 2022, 24, 2. https://doi.org/10.3390/e24010002
You X, Maschek M, van Dijk NHH, Brück E. Magnetic Phase Diagram of the MnxFe2−xP1−ySiy System. Entropy. 2022; 24(1):2. https://doi.org/10.3390/e24010002
Chicago/Turabian StyleYou, Xinmin, Michael Maschek, Niels Harmen H. van Dijk, and Ekkes Brück. 2022. "Magnetic Phase Diagram of the MnxFe2−xP1−ySiy System" Entropy 24, no. 1: 2. https://doi.org/10.3390/e24010002
APA StyleYou, X., Maschek, M., van Dijk, N. H. H., & Brück, E. (2022). Magnetic Phase Diagram of the MnxFe2−xP1−ySiy System. Entropy, 24(1), 2. https://doi.org/10.3390/e24010002