A Reliable Auto-Robust Analysis of Blood Smear Images for Classification of Microcytic Hypochromic Anemia Using Gray Level Matrices and Gabor Feature Bank

 , ,
, ,  , , and
Abstract
1. Introduction
2. Related Work
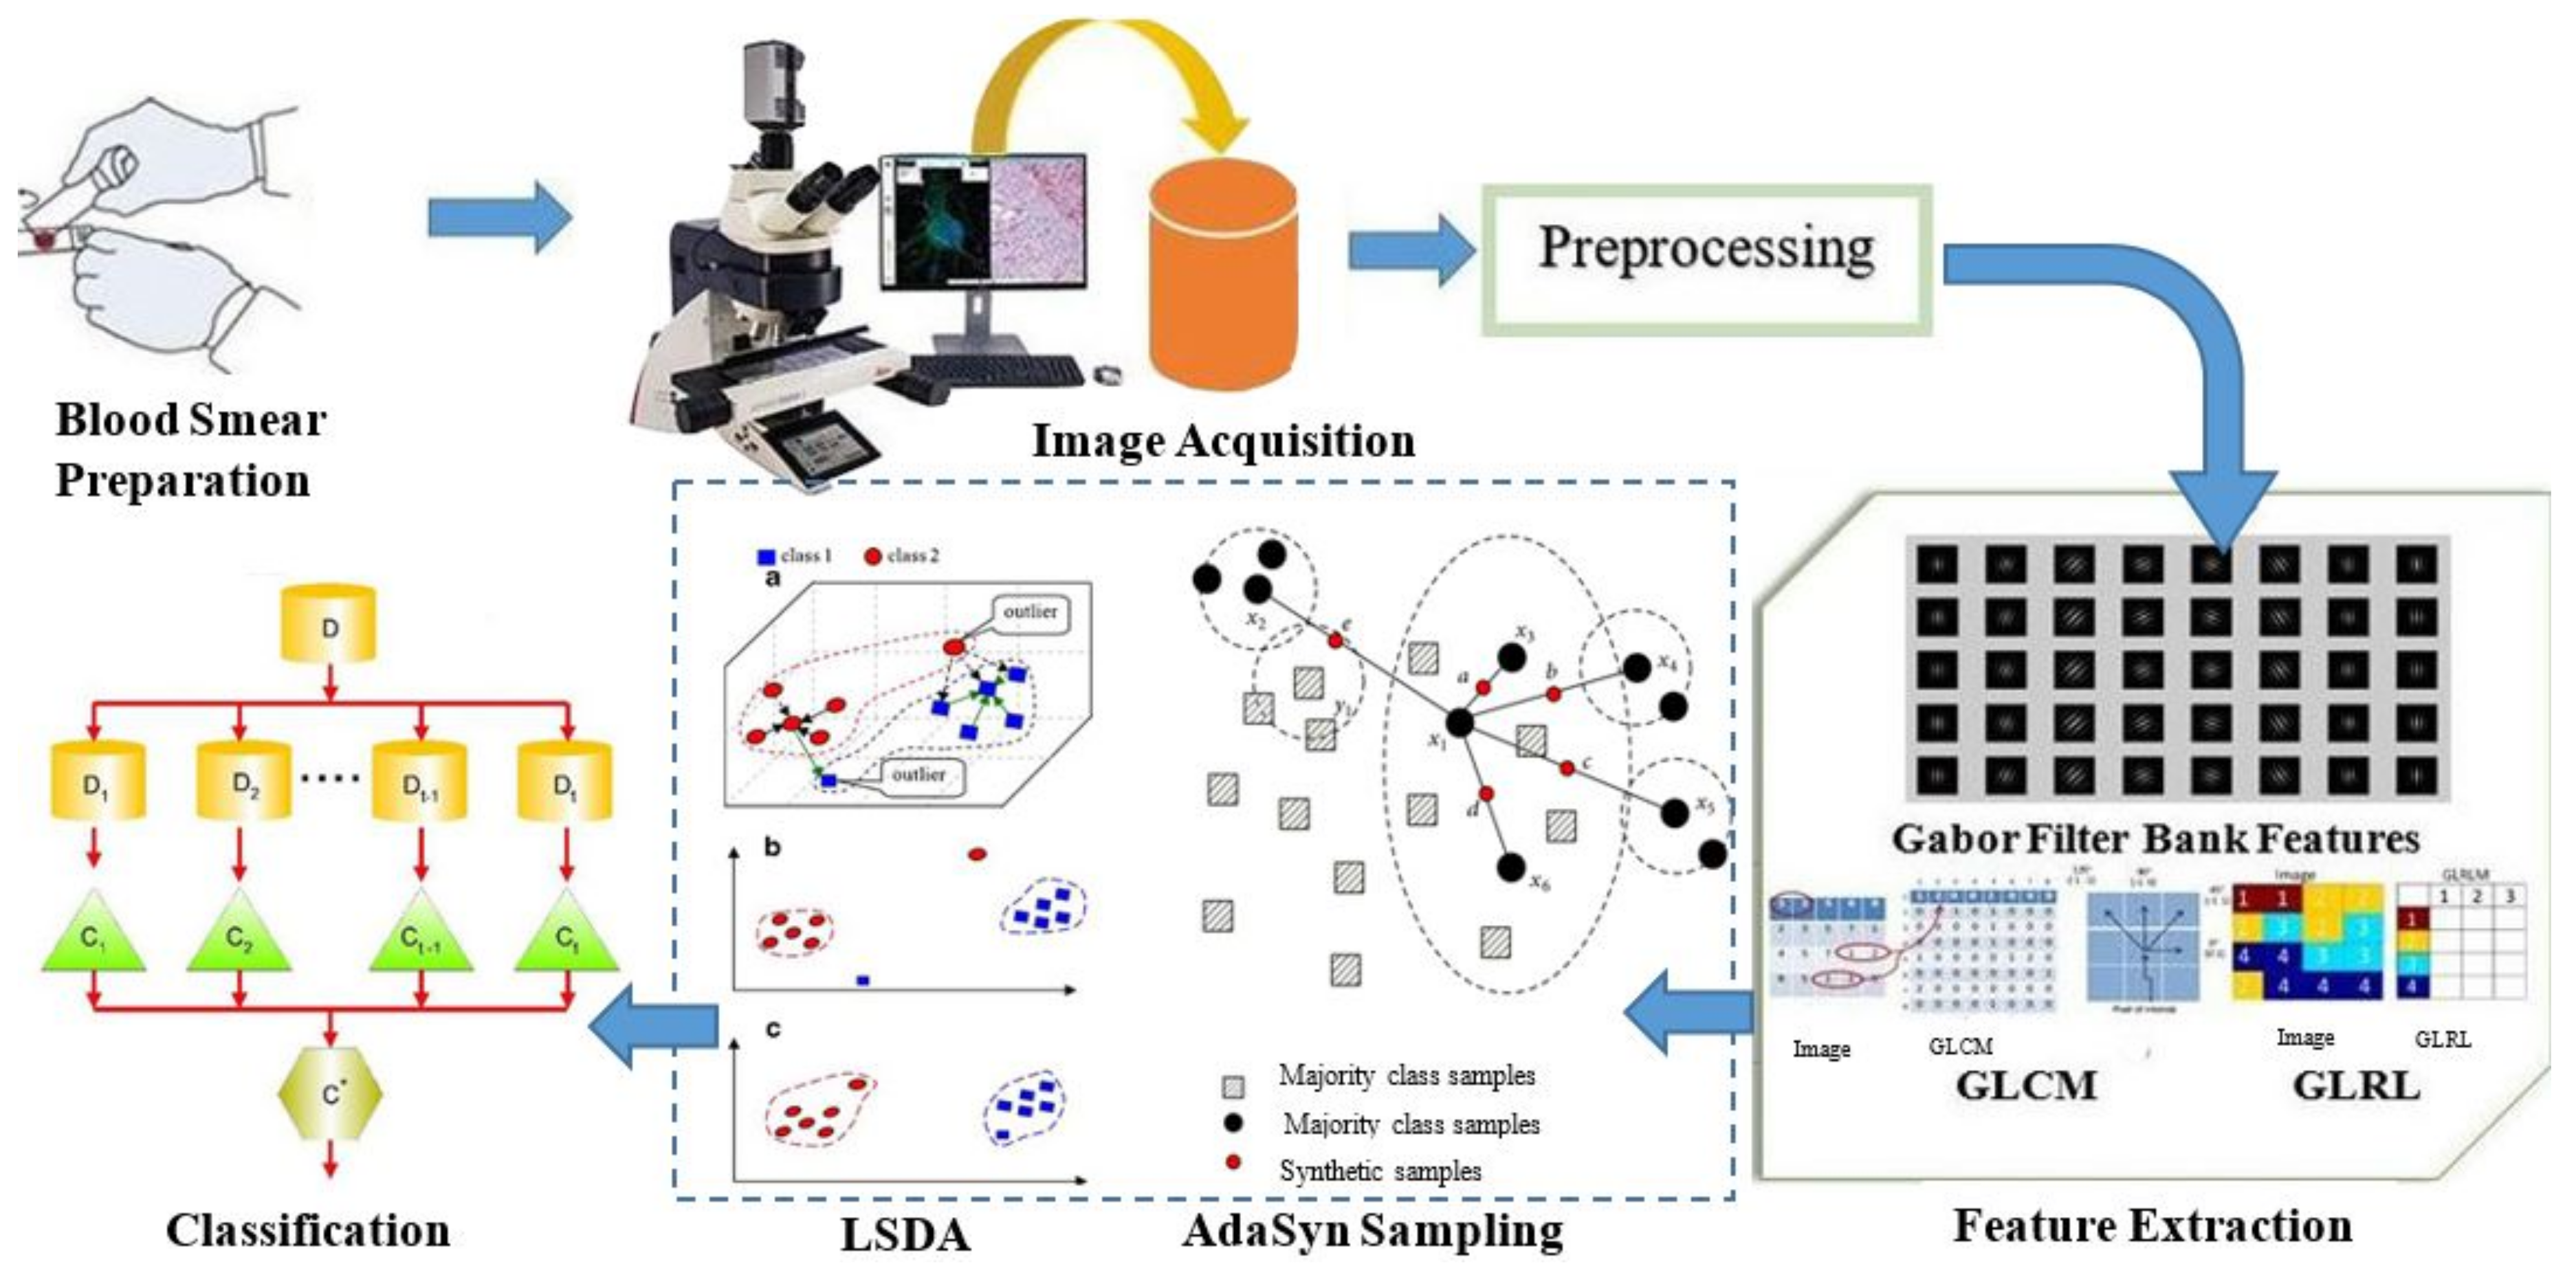
3. Materials and Methods
3.1. Blood Smear Slide Preparation
3.2. Image Acquisition
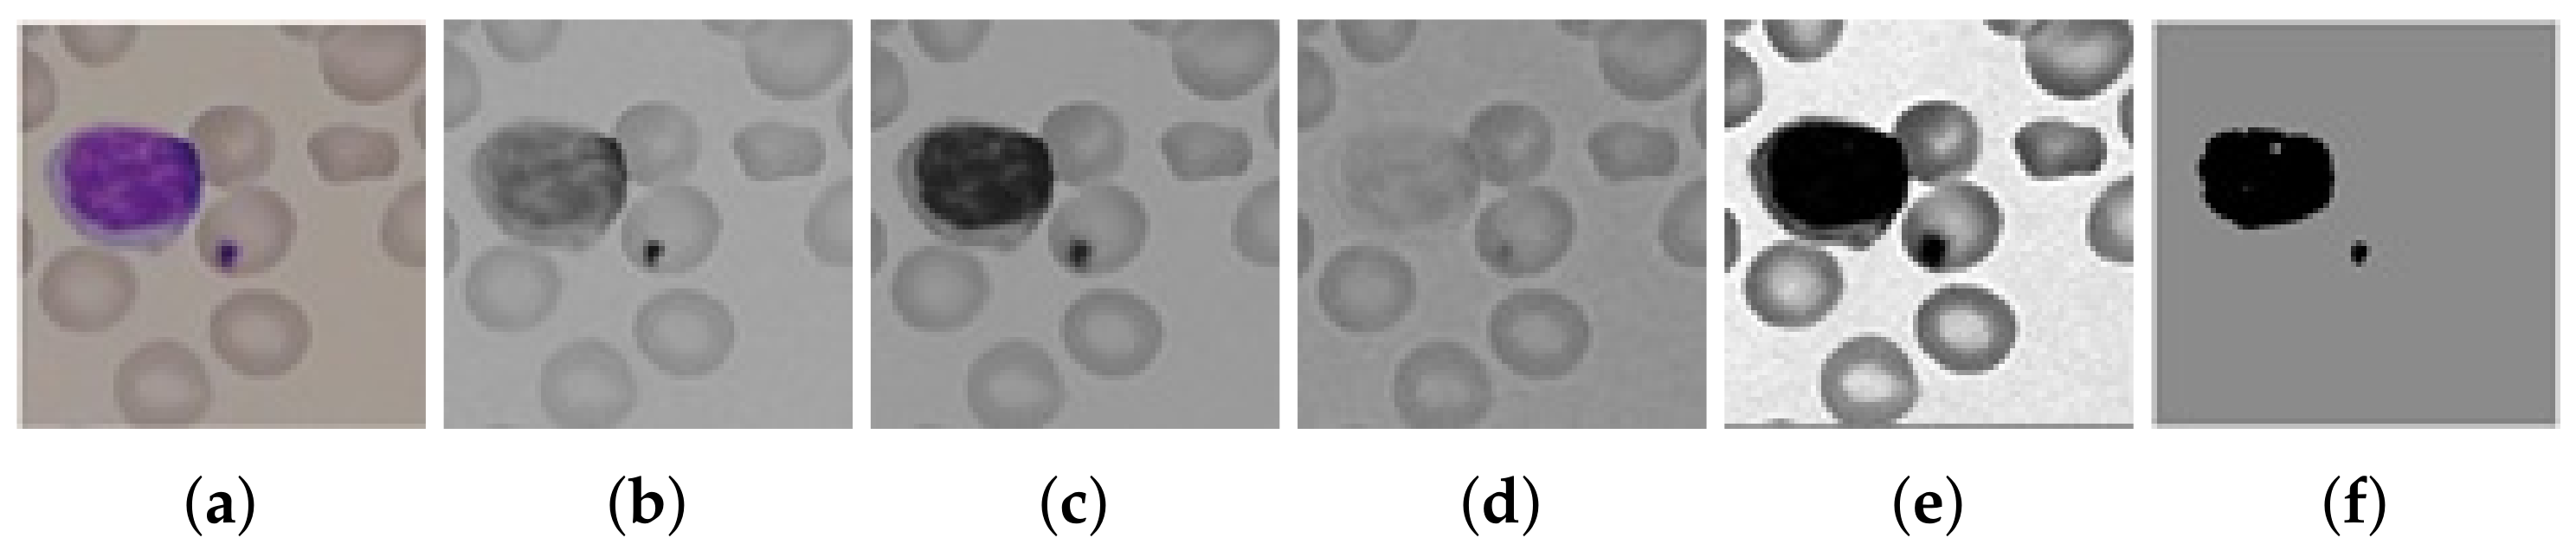
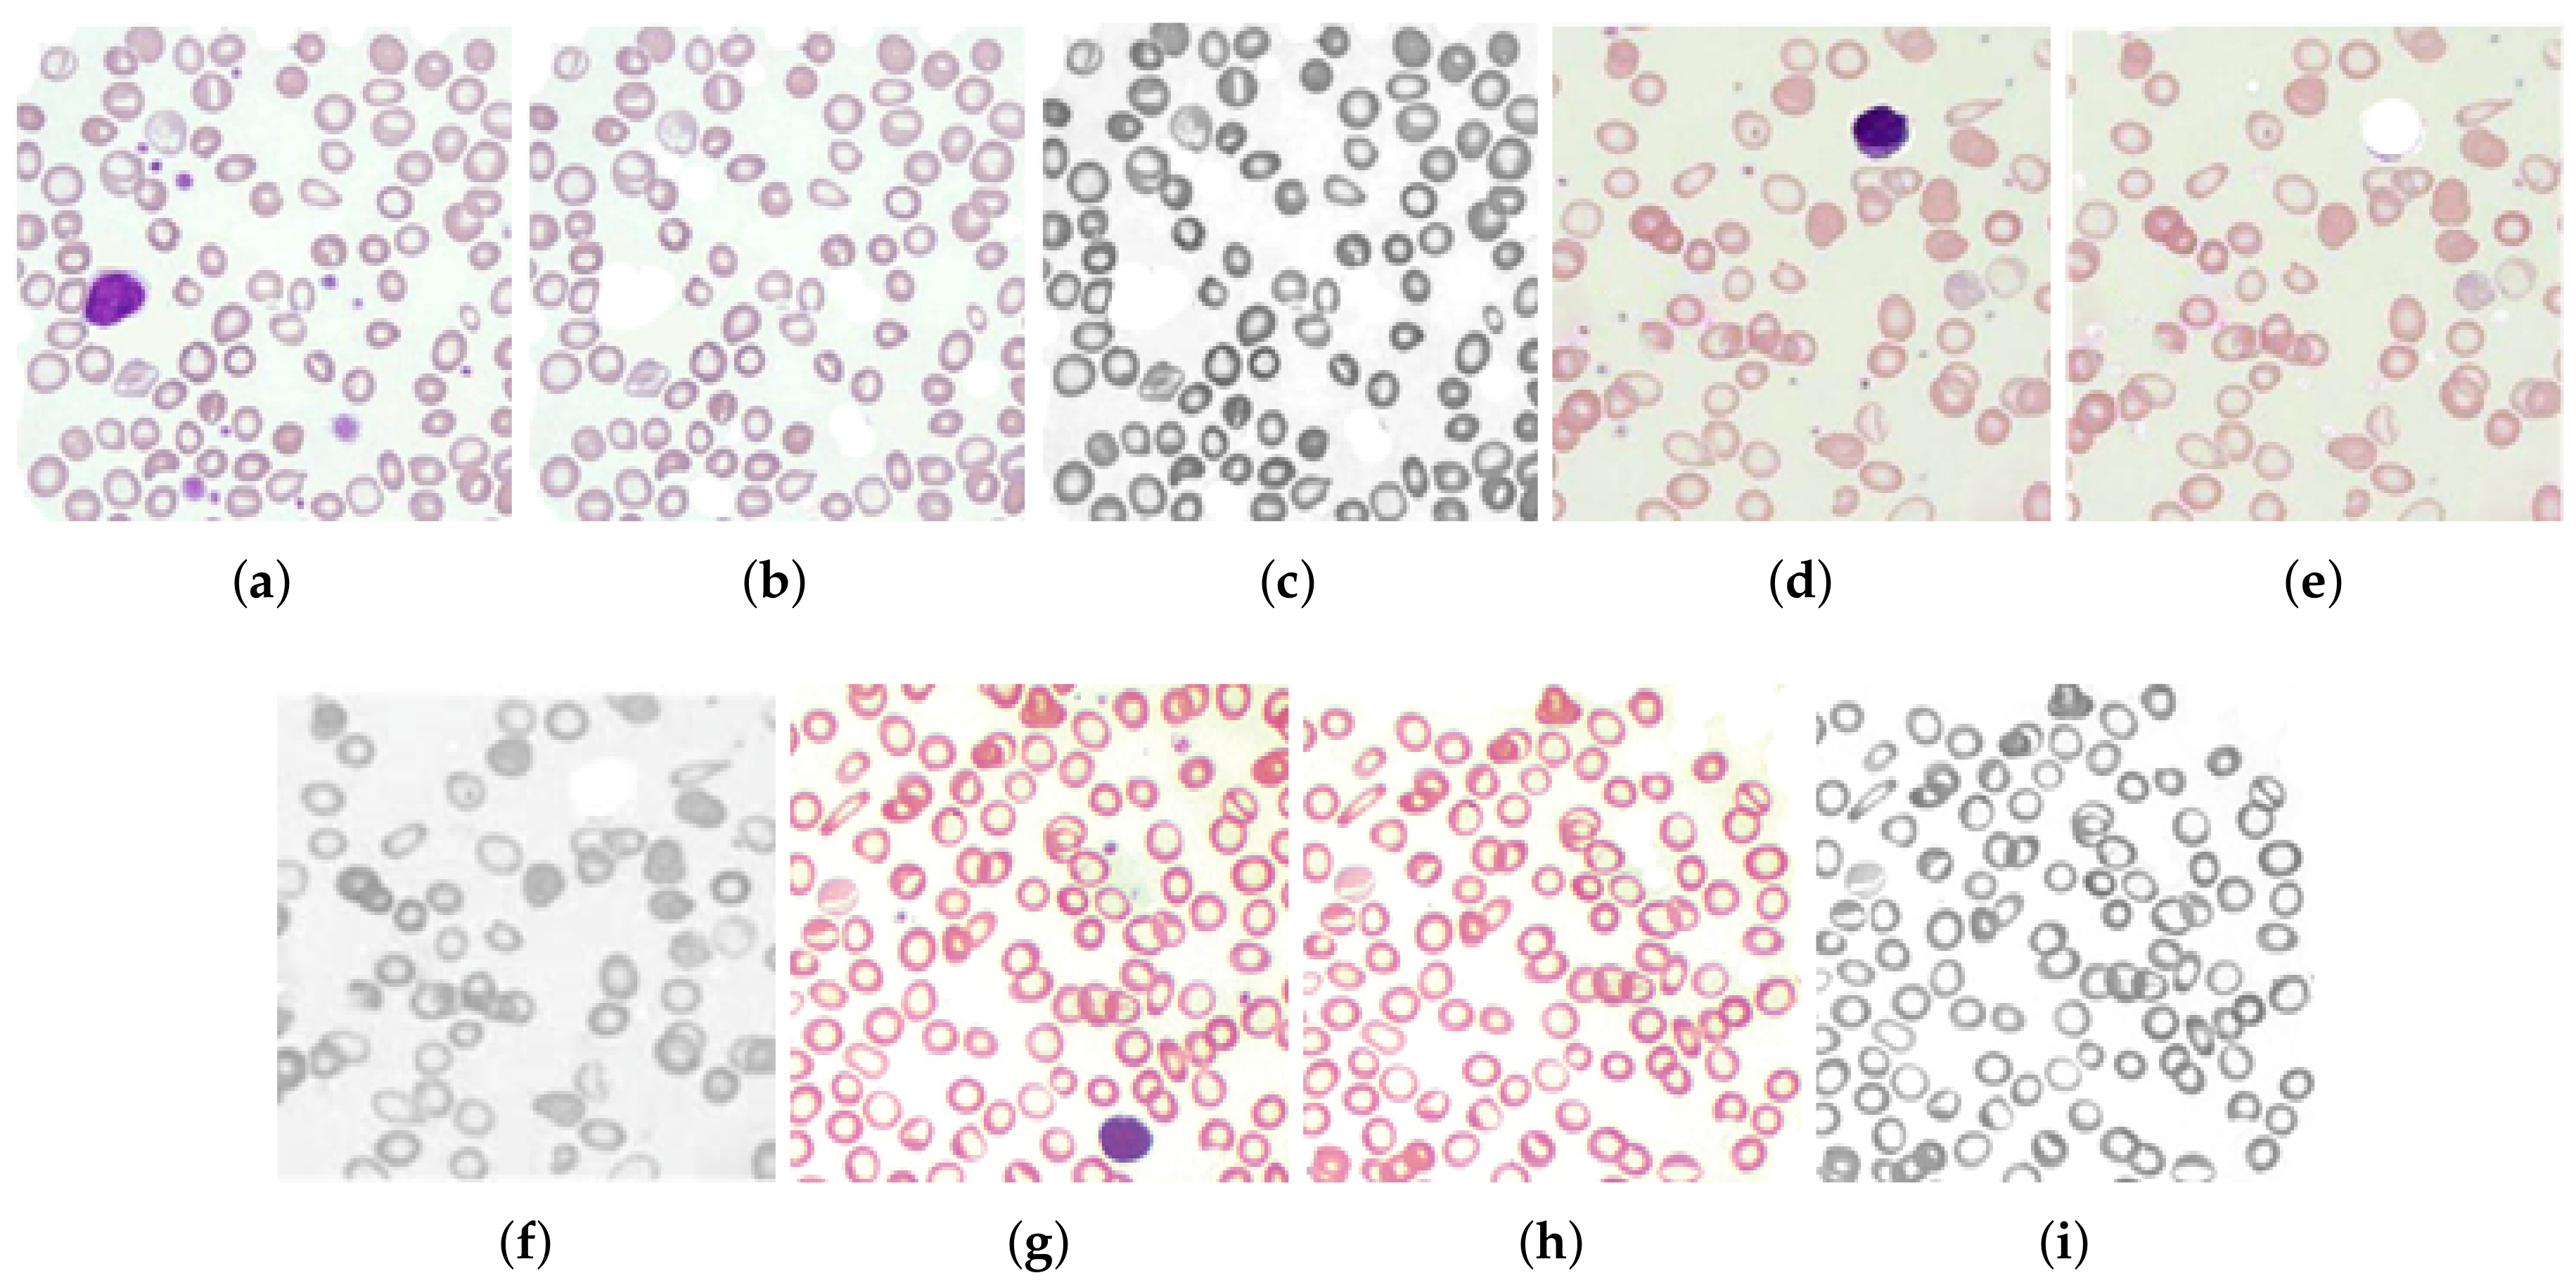
3.3. Preprocessing
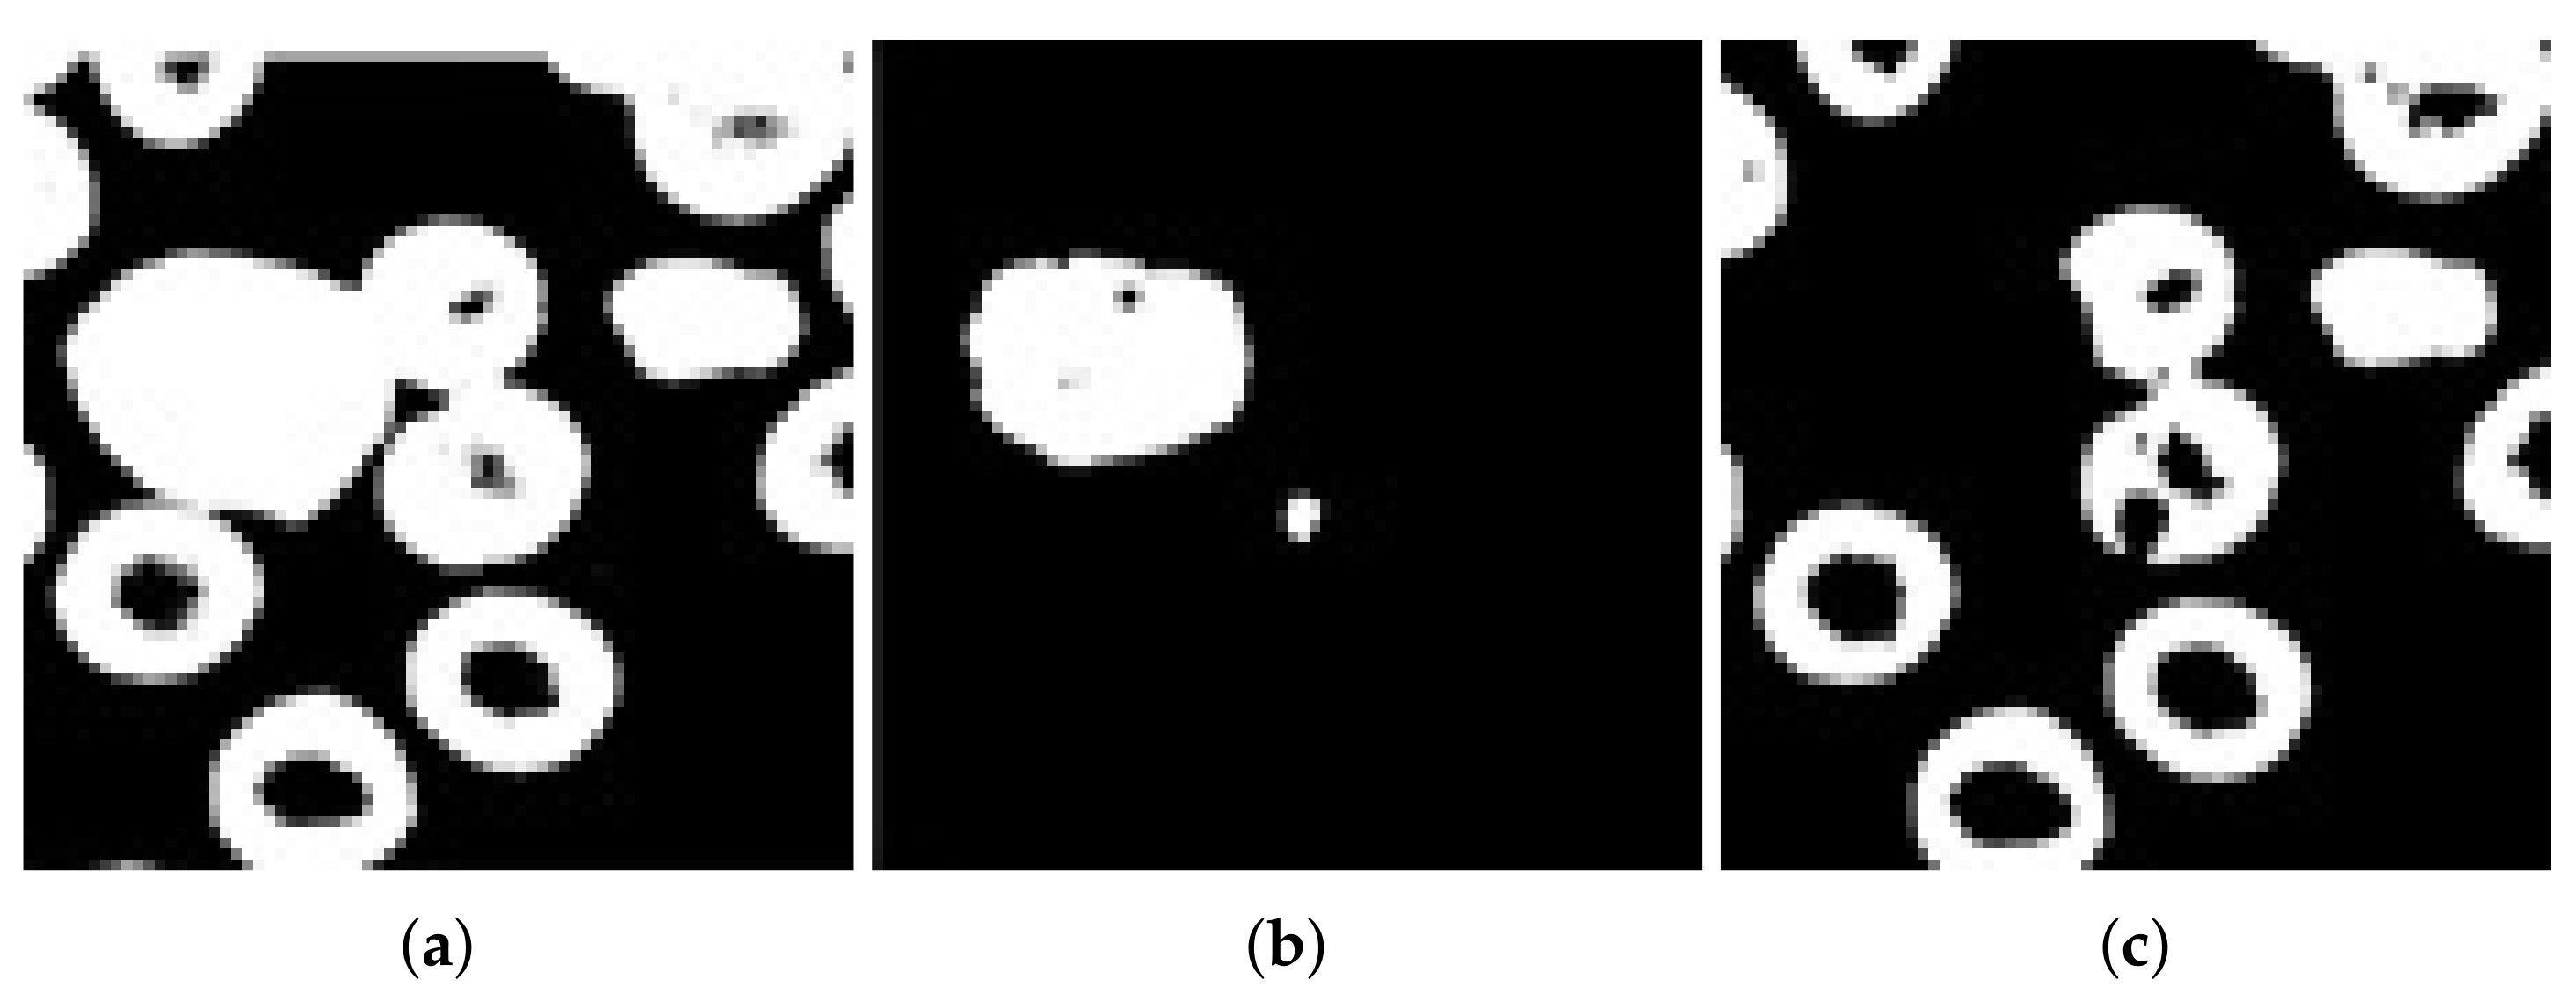
3.4. Segmentation
3.5. Feature Extraction
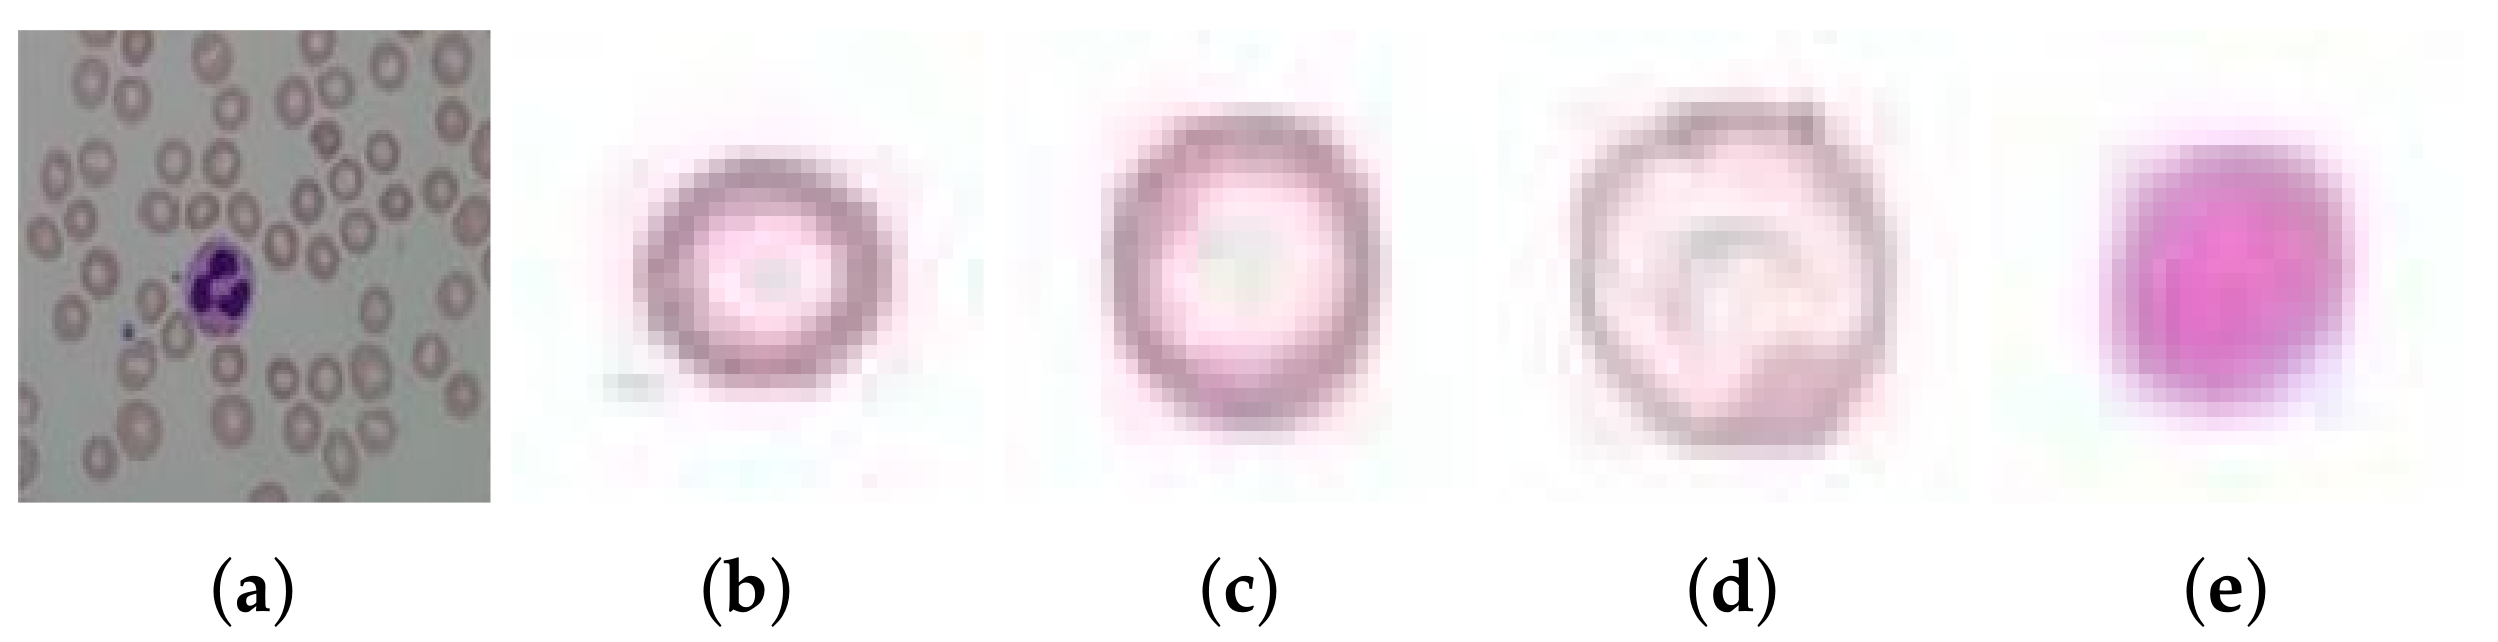
3.5.1. Geometric Morphology of Microcytic Hypochromic RBCs
- Area: Area is an important geometrical feature for the detection of microcytes, being small in size compared to other blood cells.
- Circularity: A size-invariant shape descriptor given in Equation (3) which describes a shape to be circular, if the value is closer to 1 and noncircular if the value is closer to 0, where A is Area and P is parameter of a cell.
- Rectangularity: It determines the degree of elongation with respect to a rectangle. Equation (4) shows its calculation, where is area of a shape and is the area of minimum bounding rectangle.
- Concavity: This property is used to determine how much an object is concave; we applied it on the shapes for identification of the amount of central pallor area occupied in an RBC, given by Equation (5)
- Convexity: A cell convexity can be determined by Equation (6), which identifies a shape through its boundary convexity.
3.5.2. RBC Texture Feature Calculation
- RGB mean and variance of hypochromic microcytic RBCs: The mean values , , and of pixels of each RBC in R, G, and B, respectively, were calculated in Equation (7).The variances , , and in the channels R, G, and B, respectively, are calculated in Equation (8)).
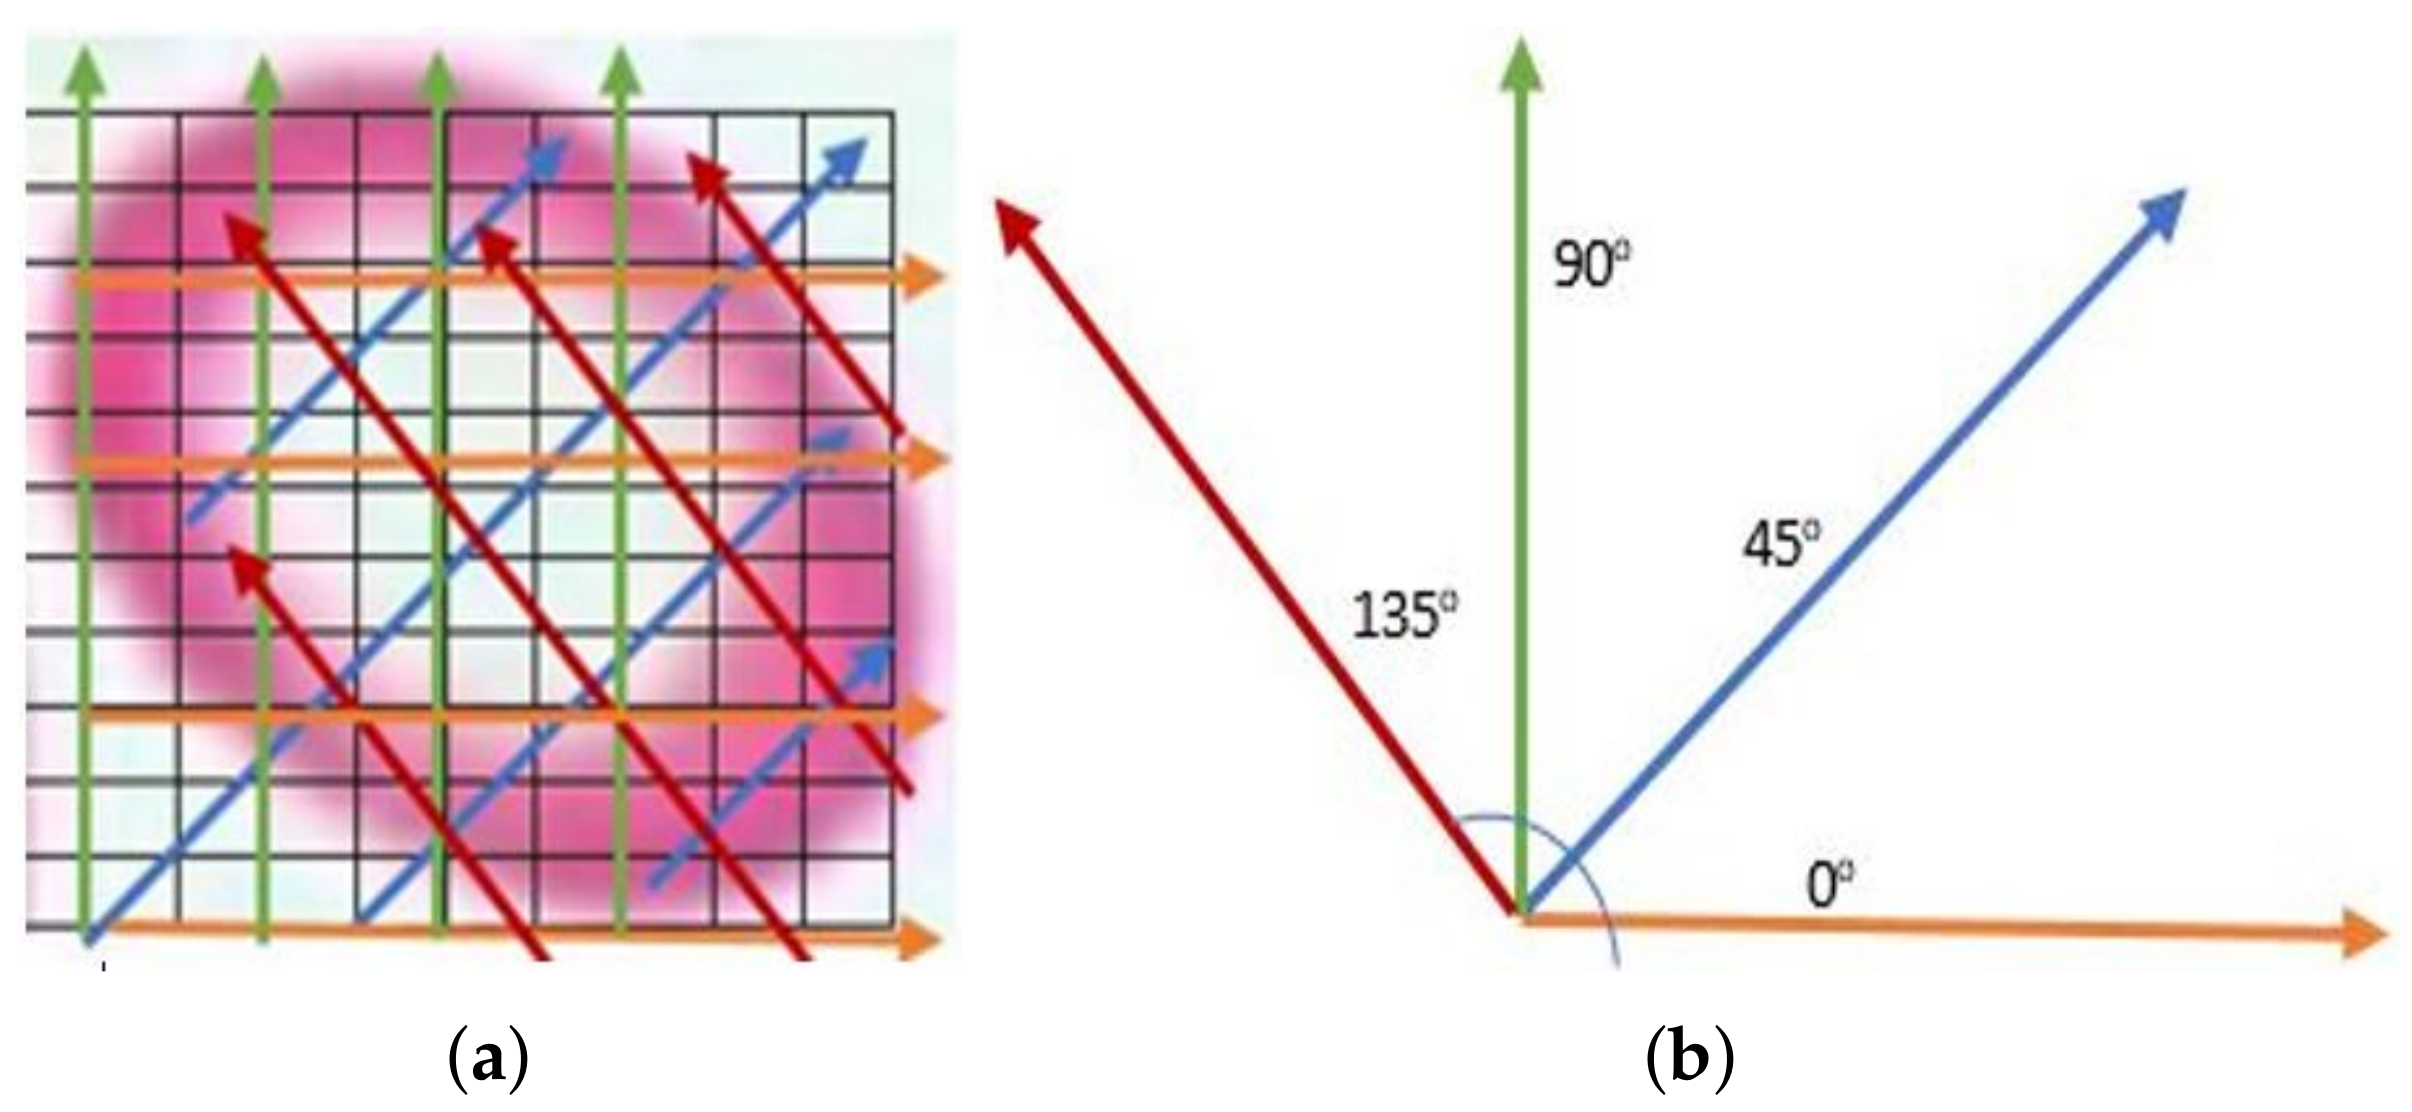
- GLCM features of Hypochromic Microcytic RBCs: GLCM is the distribution of cooccurring pixel values defined over an N × N image P at a specific offset, or every P’s element determines the occurrences of a pixel with value of gray level, i, lifted by a certain distance to a pixel with value j. Our next six textural features are GLCM features. The mean of 6 GLCM features were determined for offset values conforming to 0, 45, 90, and 135 consuming 8 gray levels (see Figure 5).Maximum Probability: It measures the strongest response of the cooccurrence matrix. The range of values is [0, 1] as given in Equation (9), where is the pixels of gray image.Correlation: The degree of correlation of a pixel to its neighbor is determined by the correlation factor of the cooccurrence matrix, ranging from 1 to −1 given by Equation (10). This measure cannot be defined if any of the standard deviation is 0 for the two existing correlations, perfect positive and perfect negative correlation.Pixels intensity contrast: It is a measure of intensity contrast between a pixel and its neighbor over the entire image (calculated in Equation (11)).Energy: It is the measurement of uniformity in the intensities of an image (as given in Equation (12)). Its value is 1, if an image is constant and 0 if the intensities are variable.Homogeneity: It measures the spatial closeness of the distribution of elements in the cooccurrence matrix to the diagonal given by (13). The values range is [0, 1], and the maximum value is attained when the matrix is a diagonal.Entropy: It measure the degree of variability of the elements of the cooccurrence matrix. Its value is 0 if all intensities of are 0 and is maximum when all are equal. It may be calculated by (14).
- Run length matrix features of each RBC: The other textural features are created on the gray-level run length matrix (calculated in Equations (15)–(24). The matrix p, where l is the number of gray levels and k is the maximum run length, is defined for a certain image as the total runs with pixels of gray level i and run length j. Likewise, as in the GLCM, the run length matrices were calculated using 8 gray-levels for 30, 60, 90, and 135.Short Run Emphasis (SRE):Long Run Emphasis (LRE):Gray-Level Nonuniformity (GLN):Run Length Nonuniformity (RLN):Low Gray-level Run Emphasis (LGRE):High Gray-level Run Emphasis (HGRE):Short Run Low Gray-level Emphasis (SRLGE):Short Run High Gray-level Emphasis (SRHGE):Long Run Low Gray-level Emphasis (LRLGE):Long Run High Gray-level Emphasis (LRHGE):
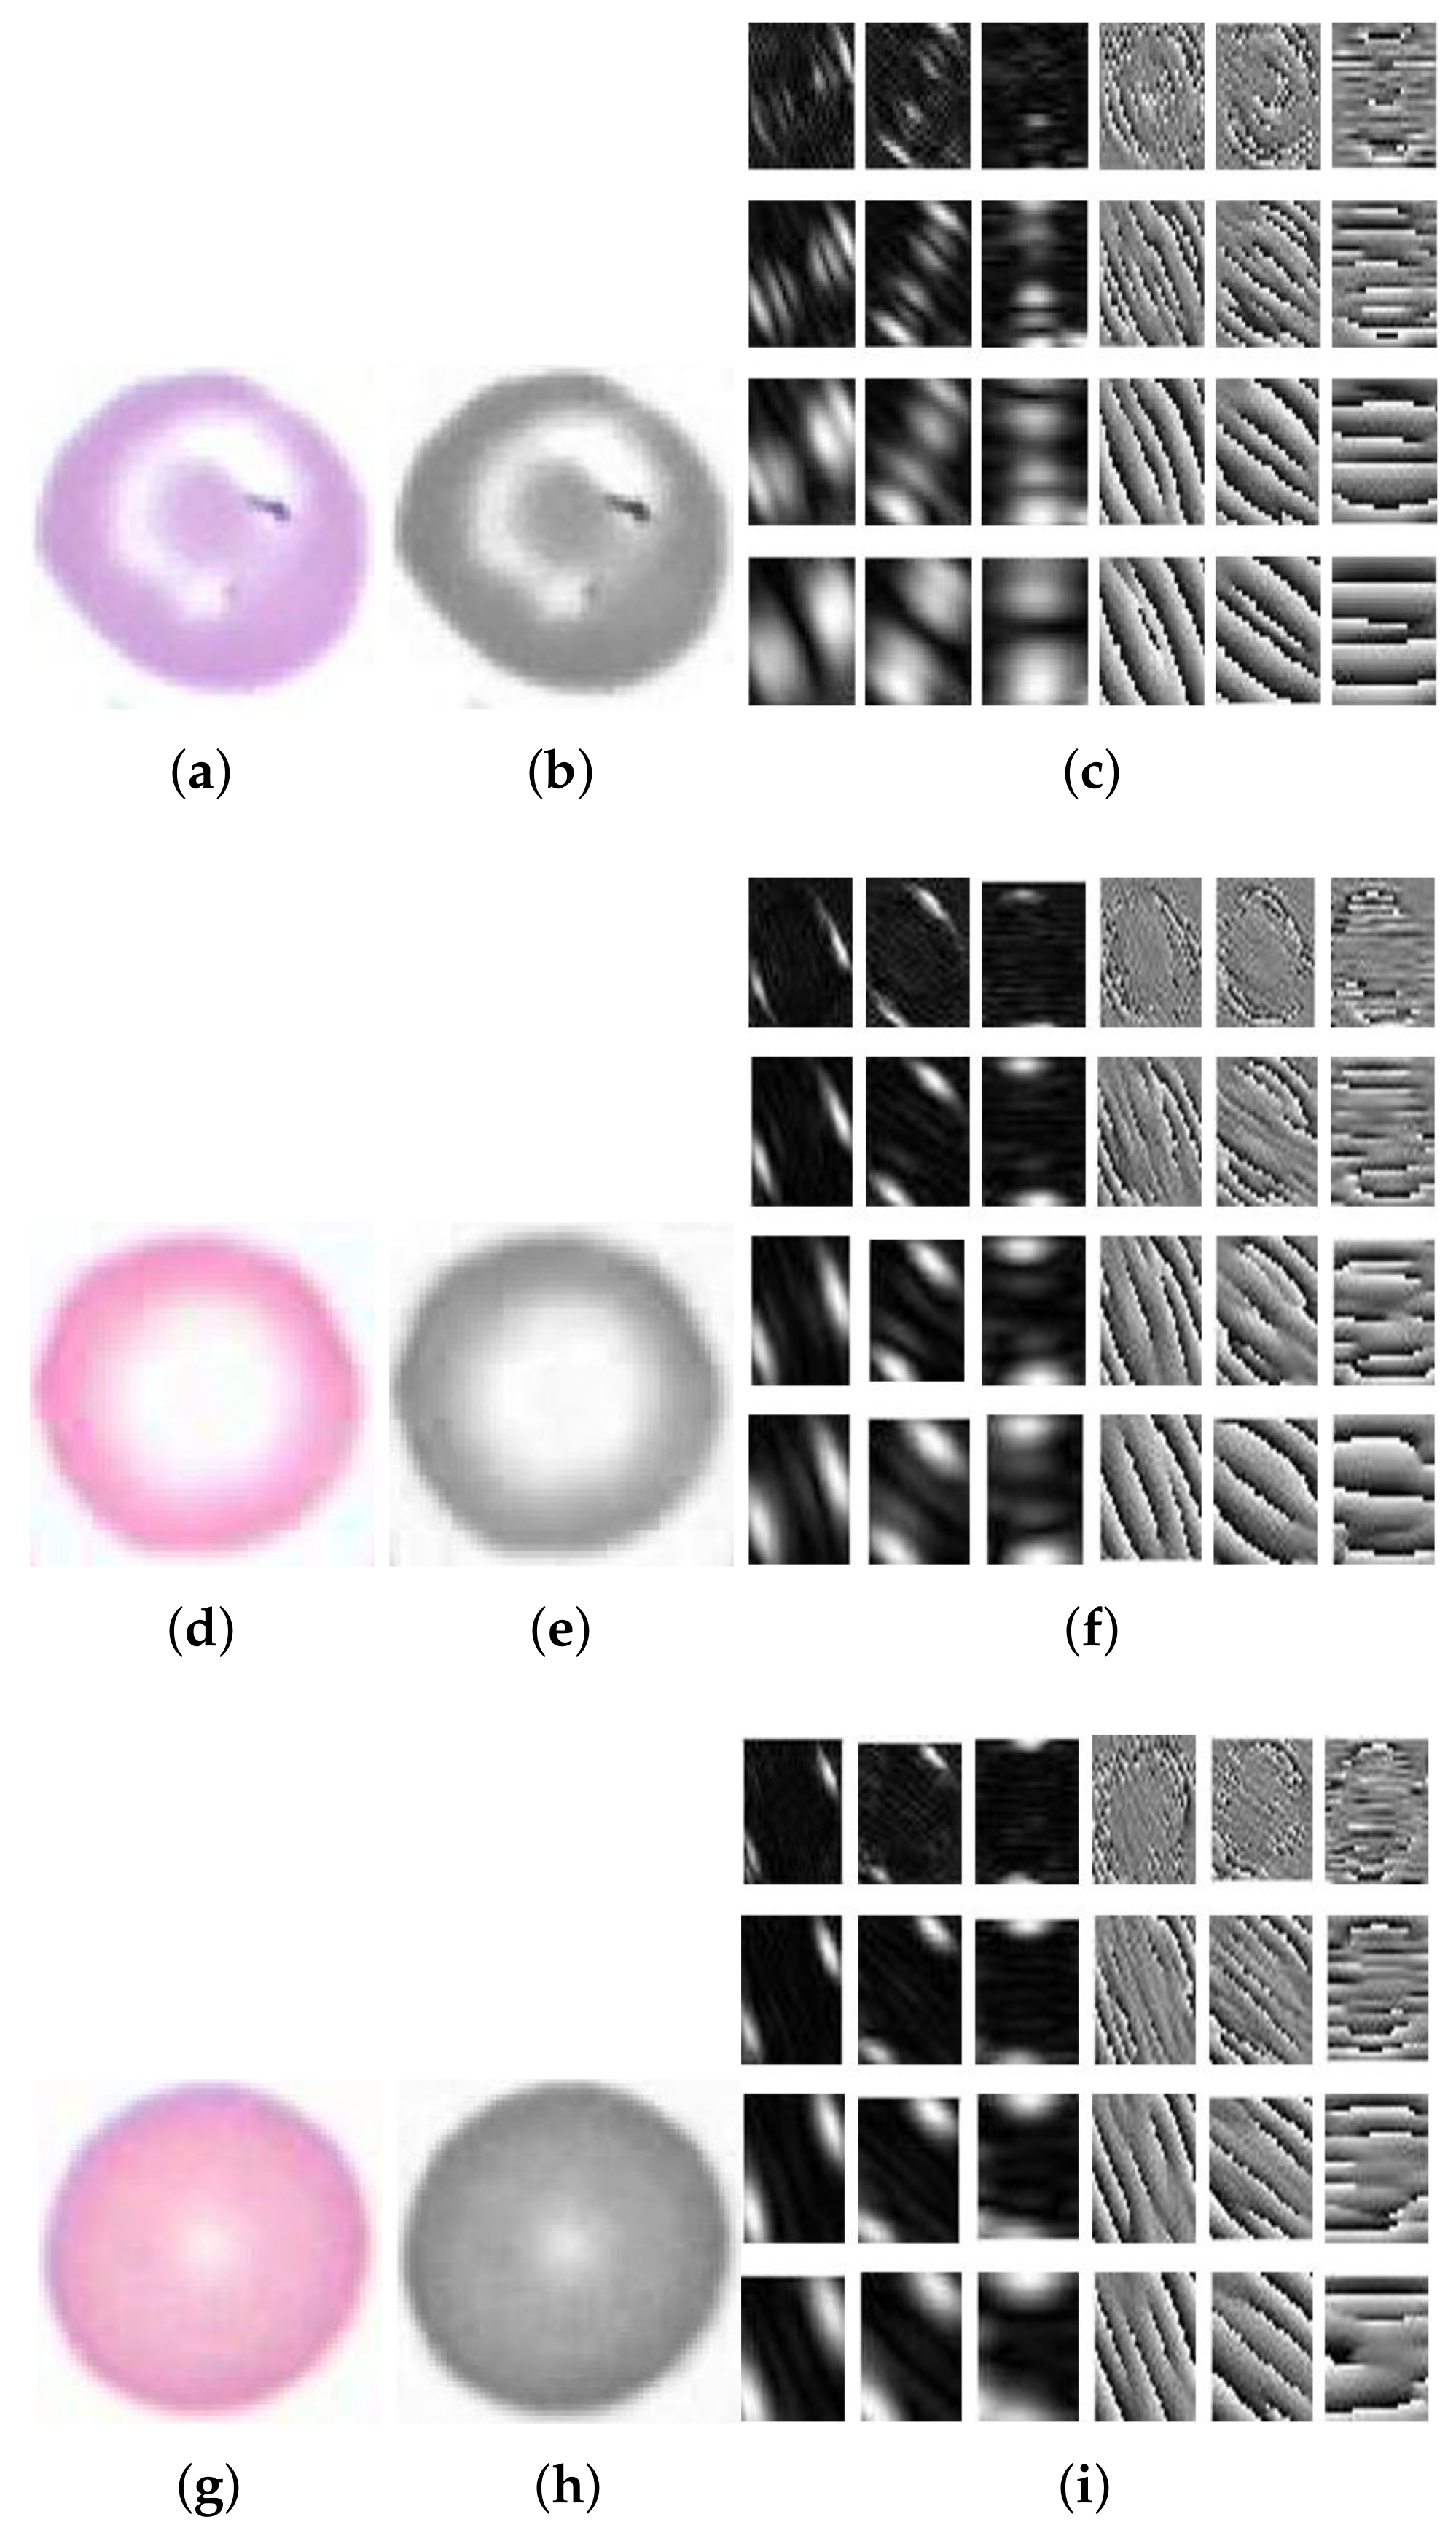
- Gabor Feature Extraction: like a human visual processing system, the Gabor filter extracts features at different amplitudes and orientation.The Gabor filter is the product of a 2D Fourier basis function and origin-centred Gaussian given in Equation (25), where f is the central frequency of the filter, and are the sharpness or bandwidth measure along the minor and major axes of Gaussian respectively, is the angle of rotation, and (/) is the aspect ratio. The analytical form of this function in frequency domain is given in Equation (26) as follow:In the frequency domain given by Equation (27), the function is a single real-valued Gaussian centered at f. A simplified version of a general 2D Gabor filter function in Equations (25) and (26) was formulated by [23], which implements a set of self-similar filters, i.e., Gabor wavelets (rotated and scaled forms of each other, irrespective of the frequency f and orientation .Gabor bank or Gabor features were created from responses of Gabor filters in Equations (25) and (26) by using multiple filters on several frequencies and orientations . Frequency in this case corresponds to scale information and is thus drawn from [23]where fm is the mth frequency, is the highest frequency desired, and is the frequency scaling factor. The filter orientations are drawn from [24]. Gabor features were calculated at 4 wavelengths (3, 6, 9, and 12) and 3 orientations (30, 60, and 90); see Figure 6a–c. Then, each filter was convolved with the real image, and the response image of the same image was produced; here, each image gave us a feature vector. Each feature vector consisted of mean amplitude and mean squared energy. Finally, two matrices were obtained, that were of [1 × 12] each. The matrices were appended to each other, and a [1 × 24] matrix was produced for one image having a [n × 24] vector for n images for supplementary training purpose in the preceding step of classification (as shown in Figure 6).
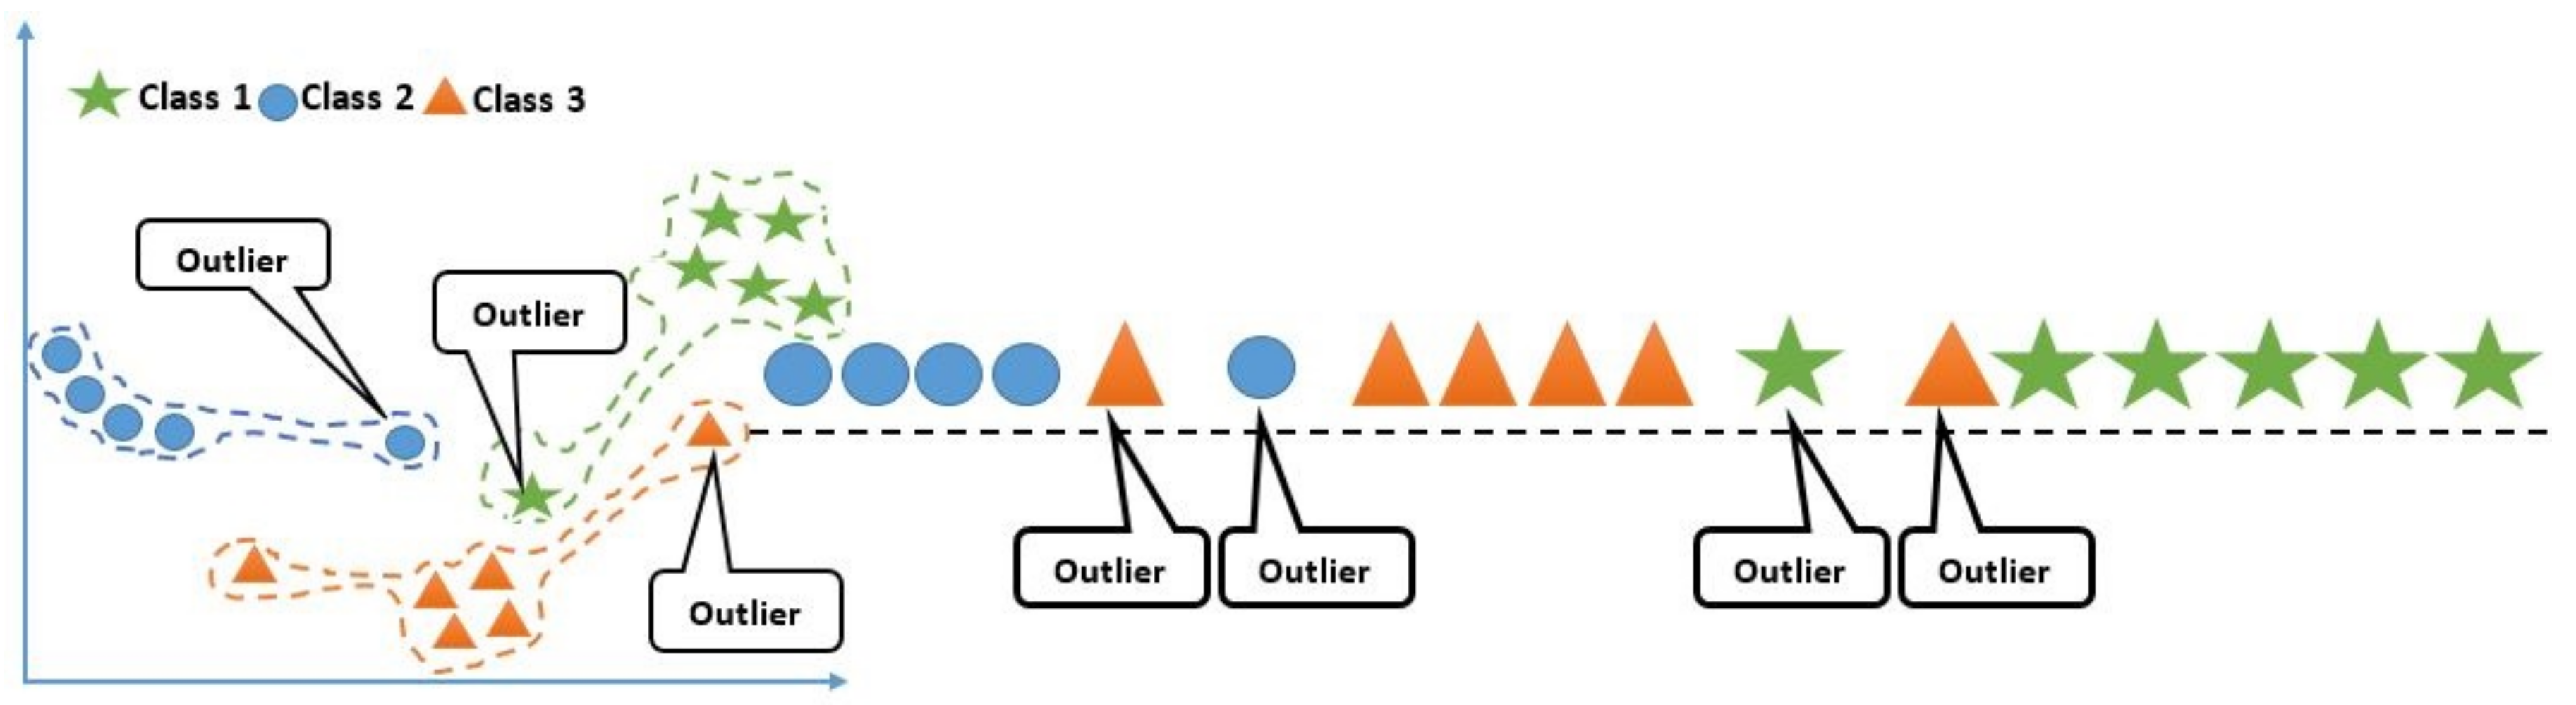
3.6. ADASYN Sampling
3.7. Features Reduction
4. Classification
5. Results
5.1. Dataset
5.2. Qualitative Results
5.3. Quantitative Results
6. Conclusions
Author Contributions
Funding
Conflicts of Interest
References
- World Health Organization. Haemoglobin Concentrations for the Diagnosis of Anaemia and Assessment of Severity; World Health Organization: Geneva, Switzerland, 2011. [Google Scholar]
- Farooqi, N.; Naqvi, M.; Jaffery, S.; Anemia, H.F. Anemia; moderate to severe during pregnancy. Prof. Med. J. 2014, 21, 247–252. [Google Scholar]
- Stevens, G.A.; Finucane, M.M.; De-Regil, L.M.; Paciorek, C.J.; Flaxman, S.R.; Branca, F.; Peña-Rosas, J.P.; Bhutta, Z.A.; Ezzati, M. Global, regional, and national trends in haemoglobin concentration and prevalence of total and severe anaemia in children and pregnant and non-pregnant women for 1995–2011: A systematic analysis of population-representative data. Lancet Glob. Health 2013, 1, e16–e25. [Google Scholar] [CrossRef]
- Jandl, J.H. Blood: Textbook of hematology. Blood 1996, 4, 3. [Google Scholar]
- Brecher, G.; Jakobek, E.F.; Schneiderman, M.A.; Williams, G.Z.; Schmidt, P.J. Size distribution of erythrocytes. Ann. N. Y. Acad. Sci. 1962, 99, 242–261. [Google Scholar] [CrossRef] [PubMed]
- Vreugdenhil, G.; Baltus, C.; Eijk, H.V.; Swakk, A. Anaemia of chronic disease: Diagnostic significance of erythrocyte and serological parameters in iron deficient rhuematiod arthritis pateints. Rheumatology 1990, 29, 105–110. [Google Scholar] [CrossRef] [PubMed]
- Aulakh, R.; Sohi, I.; Singh, T.; Kakkar, N. Red cell distribution width (rdw) in the diagnosis of iron deficiency with microcytic hypochromic anemia. Indian J. Pediatr. 2009, 76, 265–268. [Google Scholar] [CrossRef] [PubMed]
- Bachman, A.L. Macrocytic hyperchromic anemia in early infancy: Report of a case and review of the literature. Am. J. Dis. Child. 1936, 52, 633–647. [Google Scholar] [CrossRef]
- Habib, M.A.; Black, K.; Soofi, S.B.; Hussain, I.; Bhatti, Z.; Bhutta, Z.A.; Raynes-Greenow, C. Prevalence and predictors of iron deficiency anemia in children under five years of age in pakistan, a secondary analysis of national nutrition survey data 2011–2012. PLoS ONE 2016, 11, e0155051. [Google Scholar] [CrossRef] [PubMed]
- Gonzalez, R.C.; Woods, R.E.; Eddins, S.L. Digital Image Processing Using MATLAB; Pearson-Prentice-Hall: Upper Saddle River, NJ, USA, 2004; Volume 624. [Google Scholar]
- Moallem, G.; Sari-Sarraf, H.; Poostchi, M.; Maude, R.J.; Silamut, K.; Hossain, M.A.; Antani, S.; Jaeger, S.; Thoma, G. Detecting and segmenting overlapping red blood cells in microscopic images of thin blood smears. In Proceedings of the Medical Imaging 2018: Digital Pathology, Houston, TX, USA, 10–15 February 2018. [Google Scholar]
- Tomari, R.; Zakaria, W.N.W.; Jamil, M.M.A.; Nor, F.M.; Fuad, N.F.N. Computer aided system for red blood cell classification in blood smear image. Procedia Comput. Sci. 2014, 42, 206–213. [Google Scholar] [CrossRef]
- Alomari, Y.M.; Abdullah, S.; Huda, S.N.; Azma, R.Z.; Omar, K. Automatic detection and quantification of wbcs and rbcs using iterative structured circle detection algorithm. Comput. Math. Methods Med. 2014, 2014, 979302. [Google Scholar] [CrossRef] [PubMed]
- Aggarwal, P.; Khatter, A.; Vyas, G. An intensity threshold based image segmentation of malaria infected cells. In Proceedings of the 2018 Second International Conference on Computing Methodologies and Communication (ICCMC), Erode, India, 15–16 February 2018; pp. 549–553. [Google Scholar]
- Tek, F.B.; Dempster, A.G.; Kale, Z. Parasite detection and identification for automated thin blood film malaria diagnosis. Comput. Vis. Image Underst. 2010, 114, 21–32. [Google Scholar] [CrossRef]
- Chen, H.-M.; Tsao, Y.-T.; Tsai, S.-N. Automatic image segmentation and classification based on direction texton technique for hemolytic anemia in thin blood smears. Mach. Vis. Appl. 2014, 25, 501–510. [Google Scholar] [CrossRef]
- Xu, M.; Papageorgiou, D.P.; Abidi, S.Z.; Dao, M.; Zhao, H.; Karniadakis, G.E. A deep convolutional neural network for classification of red blood cells in sickle cell anemia. PLoS Comput. Biol. 2017, 13, e1005746. [Google Scholar] [CrossRef] [PubMed]
- Sharma, V.; Rathore, A.; Vyas, G. Detection of sickle cell anaemia and thalassaemia causing abnormalities in thin smear of human blood sample using image processing. In Proceedings of the 2016 International Conference on Inventive Computation Technologies (ICICT), Coimbatore, India, 26–27 August 2016; pp. 1–5. [Google Scholar]
- Ahirwar, N.; Pattnaik, S.; Acharya, B. Advanced image analysis based system for automatic detection and classification of malarial parasite in blood images. Int. J. Inf. Technol. Knowl. Manag. 2012, 5, 59–64. [Google Scholar]
- Bhagavathi, S.; Niba, S.T. An automatic system for detecting and counting rbc and wbc using fuzzy logic. ARPN J. Eng. Appl. Sci. 2016, 11, 6891–6894. [Google Scholar]
- Chandrasiri, S.; Samarasinghe, P. Morphology based automatic disease analysis through evaluation of red blood cells. In Proceedings of the 2014 5th International Conference on Intelligent Systems, Modelling and Simulation, Langkawi, Malaysia, 27–29 January 2014; pp. 318–323. [Google Scholar]
- Adewoyin, A. Peripheral blood film-a review. Ann. Ib. Postgrad. Med. 2014, 12, 71–79. [Google Scholar] [PubMed]
- Daugman, J.G. Uncertainty relation for resolution in space, spatial frequency, and orientation optimized by two-dimensional visual cortical filters. JOSA A 1985, 2, 1160–1169. [Google Scholar] [CrossRef] [PubMed]
- Ilonen, J.; Kamarainen, J.-K.; Paalanen, P.; Hamouz, M.; Kittler, J.; Kalviainen, H. Image feature localization by multiple hypothesis testing of gabor features. IEEE Trans. Image Process. 2008, 17, 311–325. [Google Scholar] [CrossRef] [PubMed]
- Yung, M.; Brown, E.T.; Rasin, A.; Furst, J.D.; Raicu, D.S. Synthetic sampling for multi-class malignancy prediction. arXiv 2018, arXiv:1807.02608. [Google Scholar]
- Gao, Y.-L.; Luo, S.-Z.; Wang, Z.-H.; Chen, C.-C.; Pan, J.-Y. Locality sensitive discriminative unsupervised dimensionality reduction. Symmetry 2019, 11, 1036. [Google Scholar] [CrossRef]


| Cell Type | Original | Synthetic | Total |
|---|---|---|---|
| Microcyte | 157 | 197 | 354 |
| Normocytes | 270 | 57 | 327 |
| Macrocytes | 101 | 211 | 312 |
| Hypochromic | 157 | 150 | 340 |
| Narmochromic | 380 | 0 | 380 |
| Cell No. | Contrast | Correlation | Energy | Homogeneity |
|---|---|---|---|---|
| Cell1 | 85.40 | 406.62 | 123.52 | 105.8 |
| Cell2 | 80.02758 | −112.132 | 136.3636 | 108.52 |
| Cell3 | 116.9 | 394.59 | 100 | 93.68 |
| Cell4 | 96.18 | 94.716 | 117.85 | 100.0 |
| Cell5 | 121.1 | −79.49 | 80 | 92.77 |
| Cell6 | 106.2 | −148.7 | 80 | 98.03 |
| Cell7 | 86.6 | −201.2 | 120 | 104.07 |
| Cell8 | 88.12 | 88.12 | 120 | 104 |
| Cell9 | 106.1 | 97.47 | 100 | 98 |
| Cell10 | 100 | 100 | 100 | 100 |
| Cell No. | SRE | LRE | GLN | RLN | RP | LGRE | HGRE | SRLGE | SRHGE | LRLGE | LRHGE |
|---|---|---|---|---|---|---|---|---|---|---|---|
| Cell1 | 0.56 | 44.24 | 116.35 | 113.27 | 8.74 | 2.09 | 50.11 | 0.22 | 12.46 | 24.79 | 209.57 |
| Cell2 | 0.7 | 40.25 | 126.78 | 108.01 | 8.69 | 2.26 | 39.37 | 0.29 | 14.12 | 25.91 | 127.59 |
| Cell3 | 0.43 | 44.88 | 135.02 | 139.61 | 8.47 | 2.02 | 51.45 | 0.18 | 10.59 | 24.89 | 268.0 |
| Cell4 | 0.5 | 65.18 | 137.38 | 115.35 | 12.93 | 2.62 | 48.2 | 0.23 | 7.83 | 45.05 | 134.07 |
| Cell5 | 88.24 | 106.62 | 94.77 | 106.14 | 102.68 | 93.53 | 110.29 | 80.23 | 86.07 | 96.51 | 118.61 |
| Cell6 | 115.4 | 100.85 | 94.51 | 98.77 | 103.26 | 92.73 | 99.82 | 120.77 | 73.02 | 88.5 | 120.18 |
| Cell7 | 0.39 | 61.57 | 132.04 | 111.73 | 11.22 | 2.6 | 43.64 | 0.19 | 7.9 | 42.7 | 130.44 |
| Cell8 | 1.25 | 89.76 | 103.12 | 103.36 | 29.92 | 7.01 | 81.33 | 0.59 | 19.3 | 70.39 | 130.52 |
| Cell9 | 0.33 | 47.64 | 309.2 | 216.5 | 11.1 | 2.44 | 28.86 | 0.15 | 6.02 | 32.81 | 254.73 |
| Cell10 | 0.37 | 45.41 | 355.65 | 206.29 | 10.46 | 2.56 | 28.17 | 0.18 | 5.99 | 31.69 | 325.68 |
| Cell No. | MSE1 | MSE2 | MSE3 | MSE4 | MSE5 | MSE6 | MSE7 | MSE8 | MSE9 | MSE10 | MSE11 | MSE12 |
|---|---|---|---|---|---|---|---|---|---|---|---|---|
| Cell1 | 376 | 263 | 165.7 | 155.2 | 414.9 | 301.7 | 216.3 | 204.5 | 424.4 | 313.3 | 226.3 | 197 |
| Cell2 | 258 | 350 | 274.6 | 316.8 | 436.3 | 380.9 | 264.9 | 306.7 | 439.7 | 382.9 | 273.3 | 299 |
| Cell3 | 269 | 403 | 419.8 | 554.9 | 328.8 | 457.5 | 386.6 | 493.4 | 314.5 | 440.3 | 377.1 | 462 |
| Cell4 | 234 | 205 | 207.9 | 153.3 | 177.8 | 157.8 | 186.5 | 174.7 | 173.5 | 153 | 200.3 | 172 |
| Cell5 | 62 | 96 | 121.3 | 164.9 | 72.1 | 110.4 | 157.8 | 173.6 | 73.3 | 109.7 | 155.8 | 167 |
| Cell6 | 45 | 70 | 91.5 | 113.5 | 40.8 | 70.5 | 93.3 | 104.4 | 41.5 | 72.4 | 102 | 105 |
| Cell7 | 120 | 115 | 149.8 | 136 | 79.1 | 140 | 201.2 | 149.7 | 70.6 | 102.6 | 147.2 | 156 |
| Cell8 | 50 | 101 | 138.6 | 120 | 51.8 | 101 | 149.7 | 146 | 54.2 | 113.4 | 163.6 | 131 |
| Cell9 | 701 | 682 | 737.9 | 862.7 | 669 | 592 | 692 | 784 | 70 | 653.5 | 685.5 | 820 |
| Cell10 | 730 | 695 | 700 | 850 | 670 | 590 | 701 | 770 | 715 | 1373.9 | 1396.1 | 1397 |
| Cell No. | MA1 | MA2 | MA3 | MA4 | MA5 | MA6 | MA7 | MA8 | MA9 | MA10 | MA11 | MA12 |
|---|---|---|---|---|---|---|---|---|---|---|---|---|
| Cell1 | 2 | 5 | 11 | 20 | 2 | 6 | 13 | 21 | 2 | 6 | 13 | 21 |
| Cell2 | 1 | 5 | 12 | 23 | 1 | 5 | 12 | 21 | 1 | 5 | 12 | 22 |
| Cell3 | 1 | 4 | 11 | 23 | 1 | 4 | 11 | 21 | 1 | 4 | 10 | 21 |
| Cell4 | 2 | 5 | 16 | 24 | 2 | 5 | 16 | 24 | 1 | 5 | 16 | 24 |
| Cell5 | 1 | 4 | 13 | 25 | 1 | 5 | 15 | 26 | 1 | 5 | 15 | 26 |
| Cell6 | 1 | 4 | 11 | 21 | 1 | 4 | 12 | 21 | 1 | 4 | 12 | 21 |
| Cell7 | 1 | 4 | 13 | 22 | 1 | 5 | 16 | 23 | 1 | 4 | 13 | 23 |
| Cell8 | 1 | 4 | 14 | 22 | 1 | 5 | 16 | 25 | 1 | 5 | 16 | 24 |
| Cell9 | 1 | 4 | 12 | 18 | 1 | 4 | 12 | 17 | 1 | 4 | 11 | 17 |
| Cell10 | 1 | 4 | 12 | 16 | 1 | 4 | 12 | 16 | 1 | 4 | 12 | 16 |
| Statistical | K-means Clustering (%) | Logistic Regression (%) | Naive Bayes (%) | Proposed Classifier (%) |
|---|---|---|---|---|
| Precision | 81.1 | 86.4 | 87.1 | 92.3 |
| Accuracy | 80.7 | 86.2 | 88.3 | 93.2 |
| Recall | 80.3 | 83.2 | 84.3 | 95.4 |
| F1-Score | 79.8 | 82.1 | 84.1 | 94.1 |
© 2020 by the authors. Licensee MDPI, Basel, Switzerland. This article is an open access article distributed under the terms and conditions of the Creative Commons Attribution (CC BY) license (http://creativecommons.org/licenses/by/4.0/).
Share and Cite
Azam, B.; Ur Rahman, S.; Irfan, M.; Awais, M.; Alshehri, O.M.; Saif, A.; Nahari, M.H.; Mahnashi, M.H. A Reliable Auto-Robust Analysis of Blood Smear Images for Classification of Microcytic Hypochromic Anemia Using Gray Level Matrices and Gabor Feature Bank. Entropy 2020, 22, 1040. https://doi.org/10.3390/e22091040
Azam B, Ur Rahman S, Irfan M, Awais M, Alshehri OM, Saif A, Nahari MH, Mahnashi MH. A Reliable Auto-Robust Analysis of Blood Smear Images for Classification of Microcytic Hypochromic Anemia Using Gray Level Matrices and Gabor Feature Bank. Entropy. 2020; 22(9):1040. https://doi.org/10.3390/e22091040
Chicago/Turabian StyleAzam, Bakht, Sami Ur Rahman, Muhammad Irfan, Muhammad Awais, Osama Mohammed Alshehri, Ahmed Saif, Mohammed Hassan Nahari, and Mater H. Mahnashi. 2020. "A Reliable Auto-Robust Analysis of Blood Smear Images for Classification of Microcytic Hypochromic Anemia Using Gray Level Matrices and Gabor Feature Bank" Entropy 22, no. 9: 1040. https://doi.org/10.3390/e22091040
APA StyleAzam, B., Ur Rahman, S., Irfan, M., Awais, M., Alshehri, O. M., Saif, A., Nahari, M. H., & Mahnashi, M. H. (2020). A Reliable Auto-Robust Analysis of Blood Smear Images for Classification of Microcytic Hypochromic Anemia Using Gray Level Matrices and Gabor Feature Bank. Entropy, 22(9), 1040. https://doi.org/10.3390/e22091040