A Neutrosophic Forecasting Model for Time Series Based on First-Order State and Information Entropy of High-Order Fluctuation


Abstract
:1. Introduction
2. Preliminaries
2.1. Fluctuation Time Series
2.2. Information Entropy of the mth-Order Fluctuation in a Time Series
2.3. Neutrosophic Fluctuation Time Series
2.4. Neutrosophic Logical Relationship
2.5. Aggregation Operator for NLRs
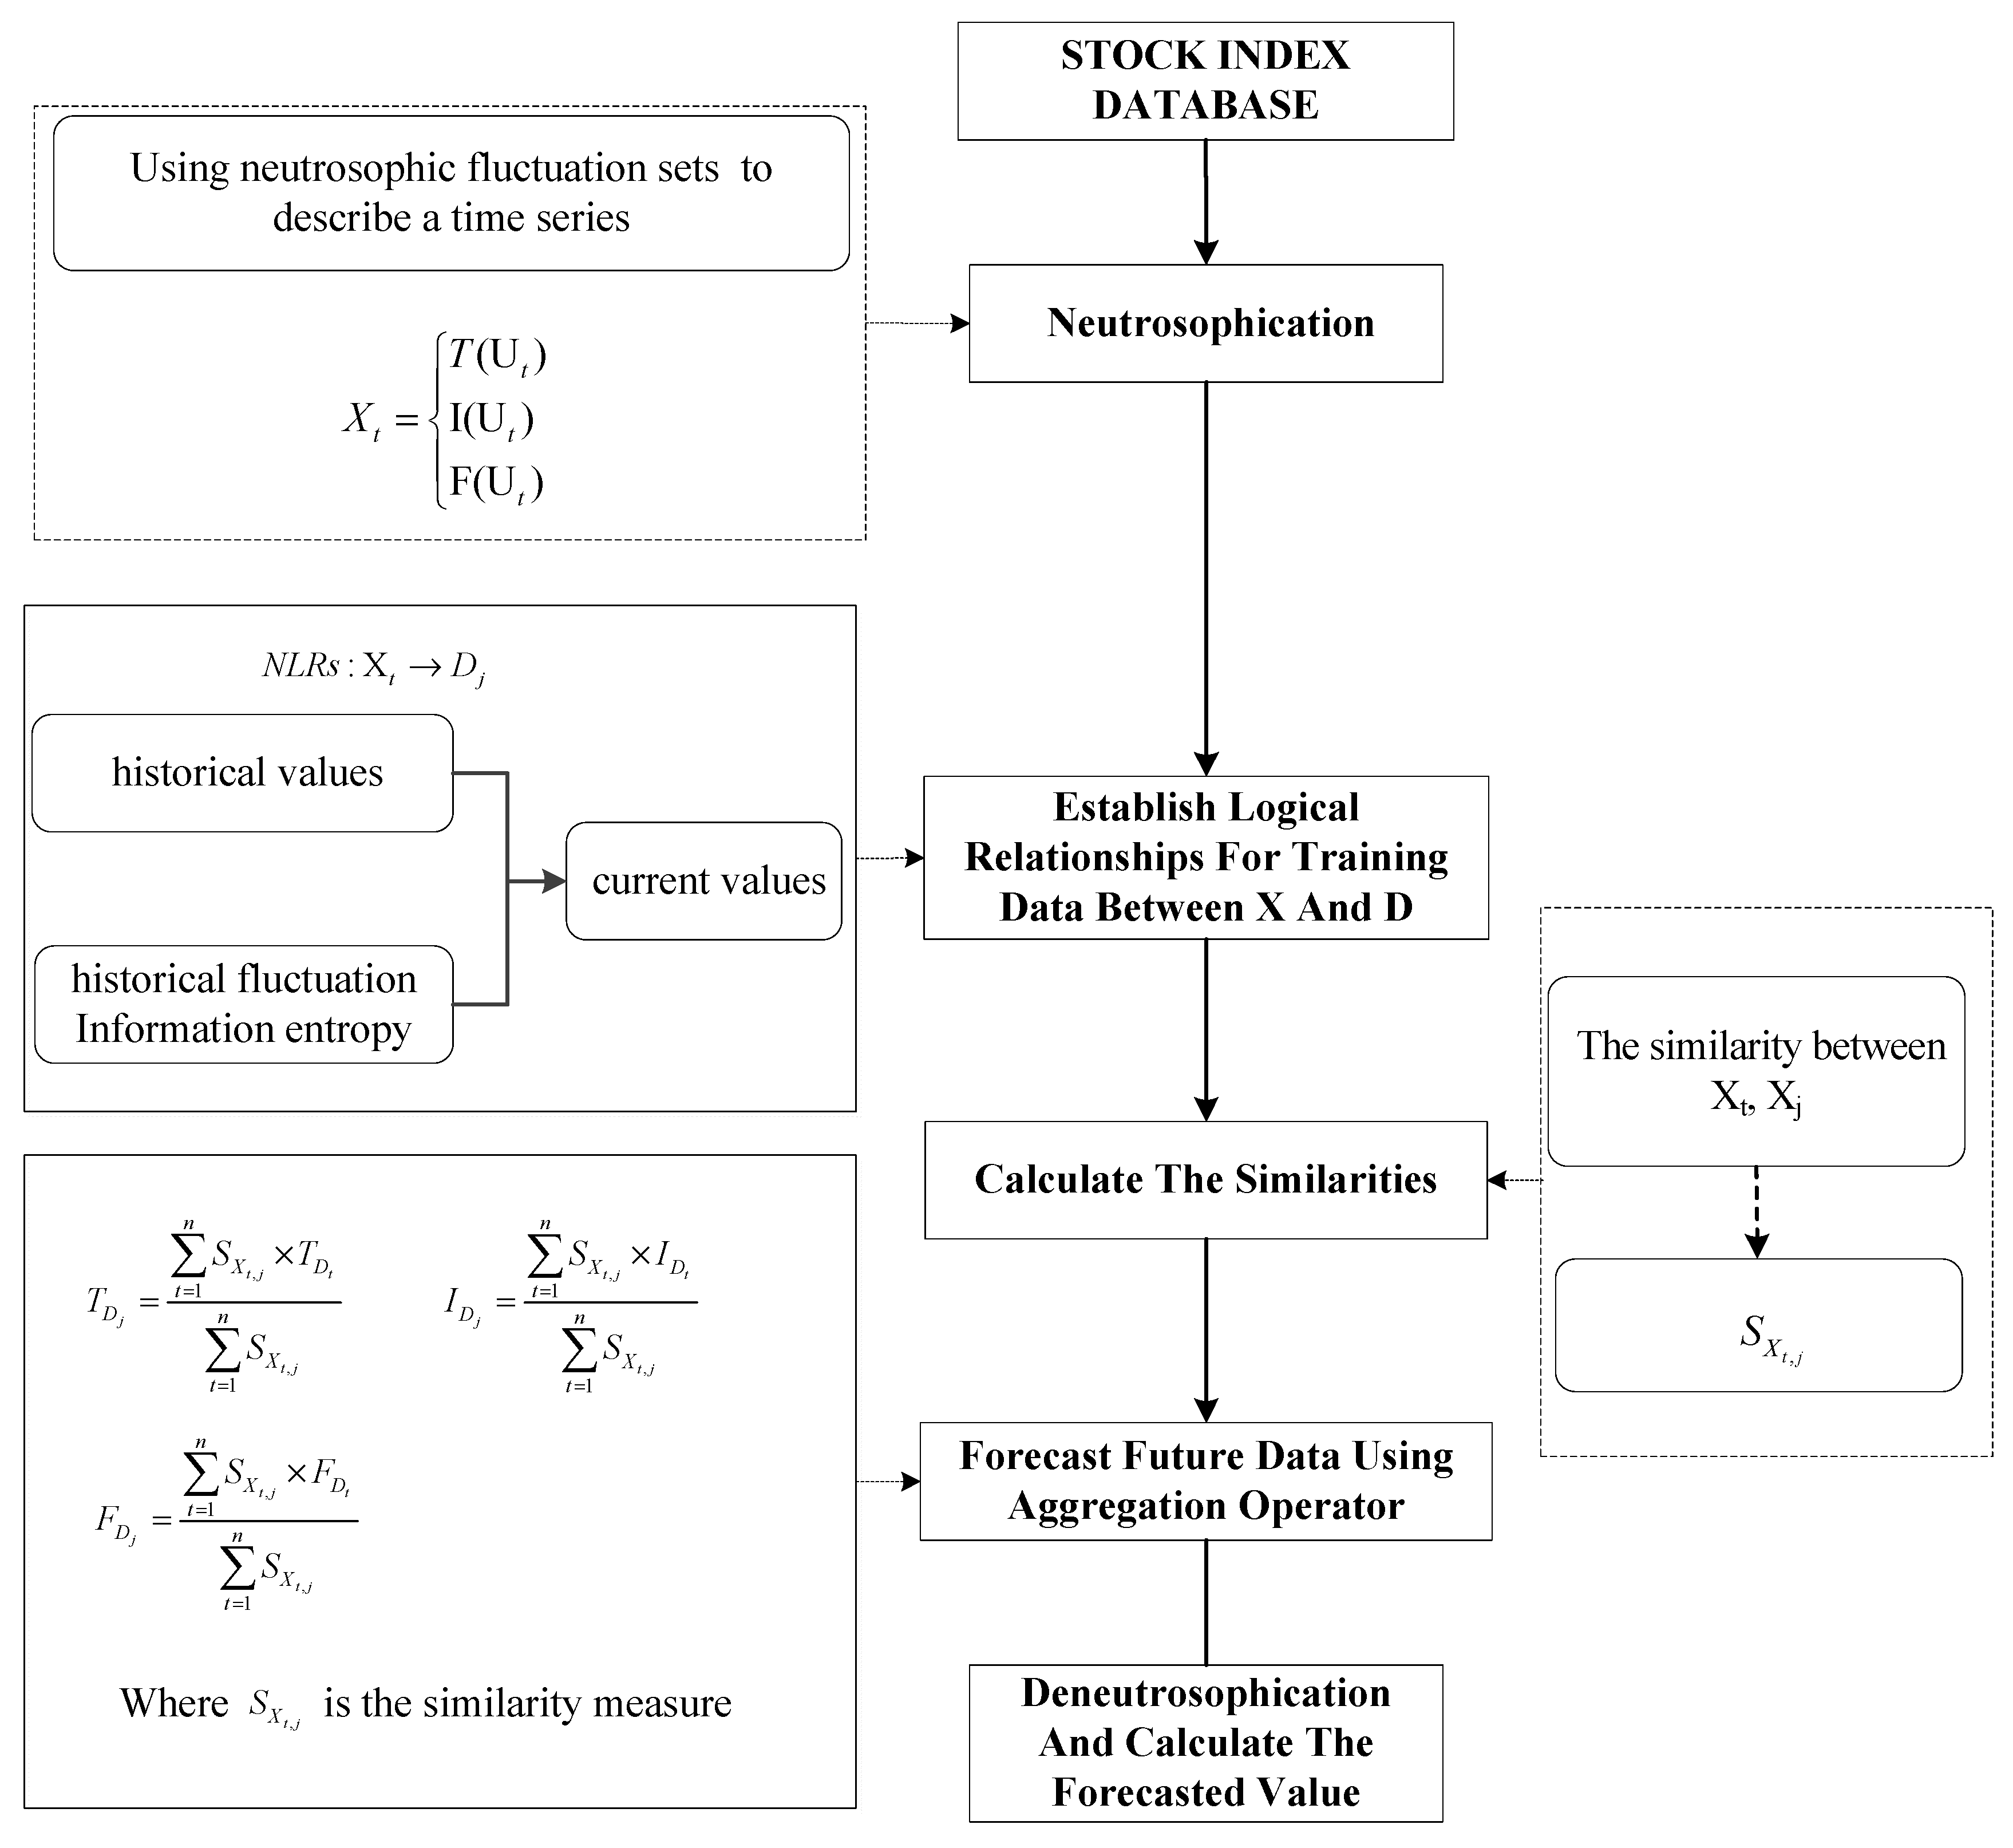
3. Research Methodology
3.1. Step 1: Using Neutrosophic Fluctuation Sets to Describe a Time Series
3.2. Step 2: Using Information Entropy to Represent the Complexity of Historical Fluctuations
3.3. Step 3: Establishing Logical Relationships for Training Data
3.4. Step 4: Calculating the Similarities between Current Data and Training Data
3.5. Step 5: Forecasting Neutrosophic Value Using the Aggregation Operator
3.6. Step 6: Deneutrosophication for the Neutrosophic Fluctuation Set and Calculating the Forecasted Value
4. Empirical Analysis
4.1. Prediction Process
4.1.1. Step 1: After Calculating the Fluctuation Value in Stock Time Series, the Fluctuation Values Will Be Converted to Neutrosophic Time Series
4.1.2. Step 2: According to Definition 5, Establishing Mapping Relationships Based on Historical Values, Historical Trends, and Current Values
4.1.3. Step 3: Calculating the Jaccard Similarity
4.1.4. Step 4: Forecasting the Neutrosophic Fluctuation Point Using the Aggregation Operator
4.1.5. Step 5: Calculating the Forecasted Value
4.2. Performance Assessments
5. Results Analysis
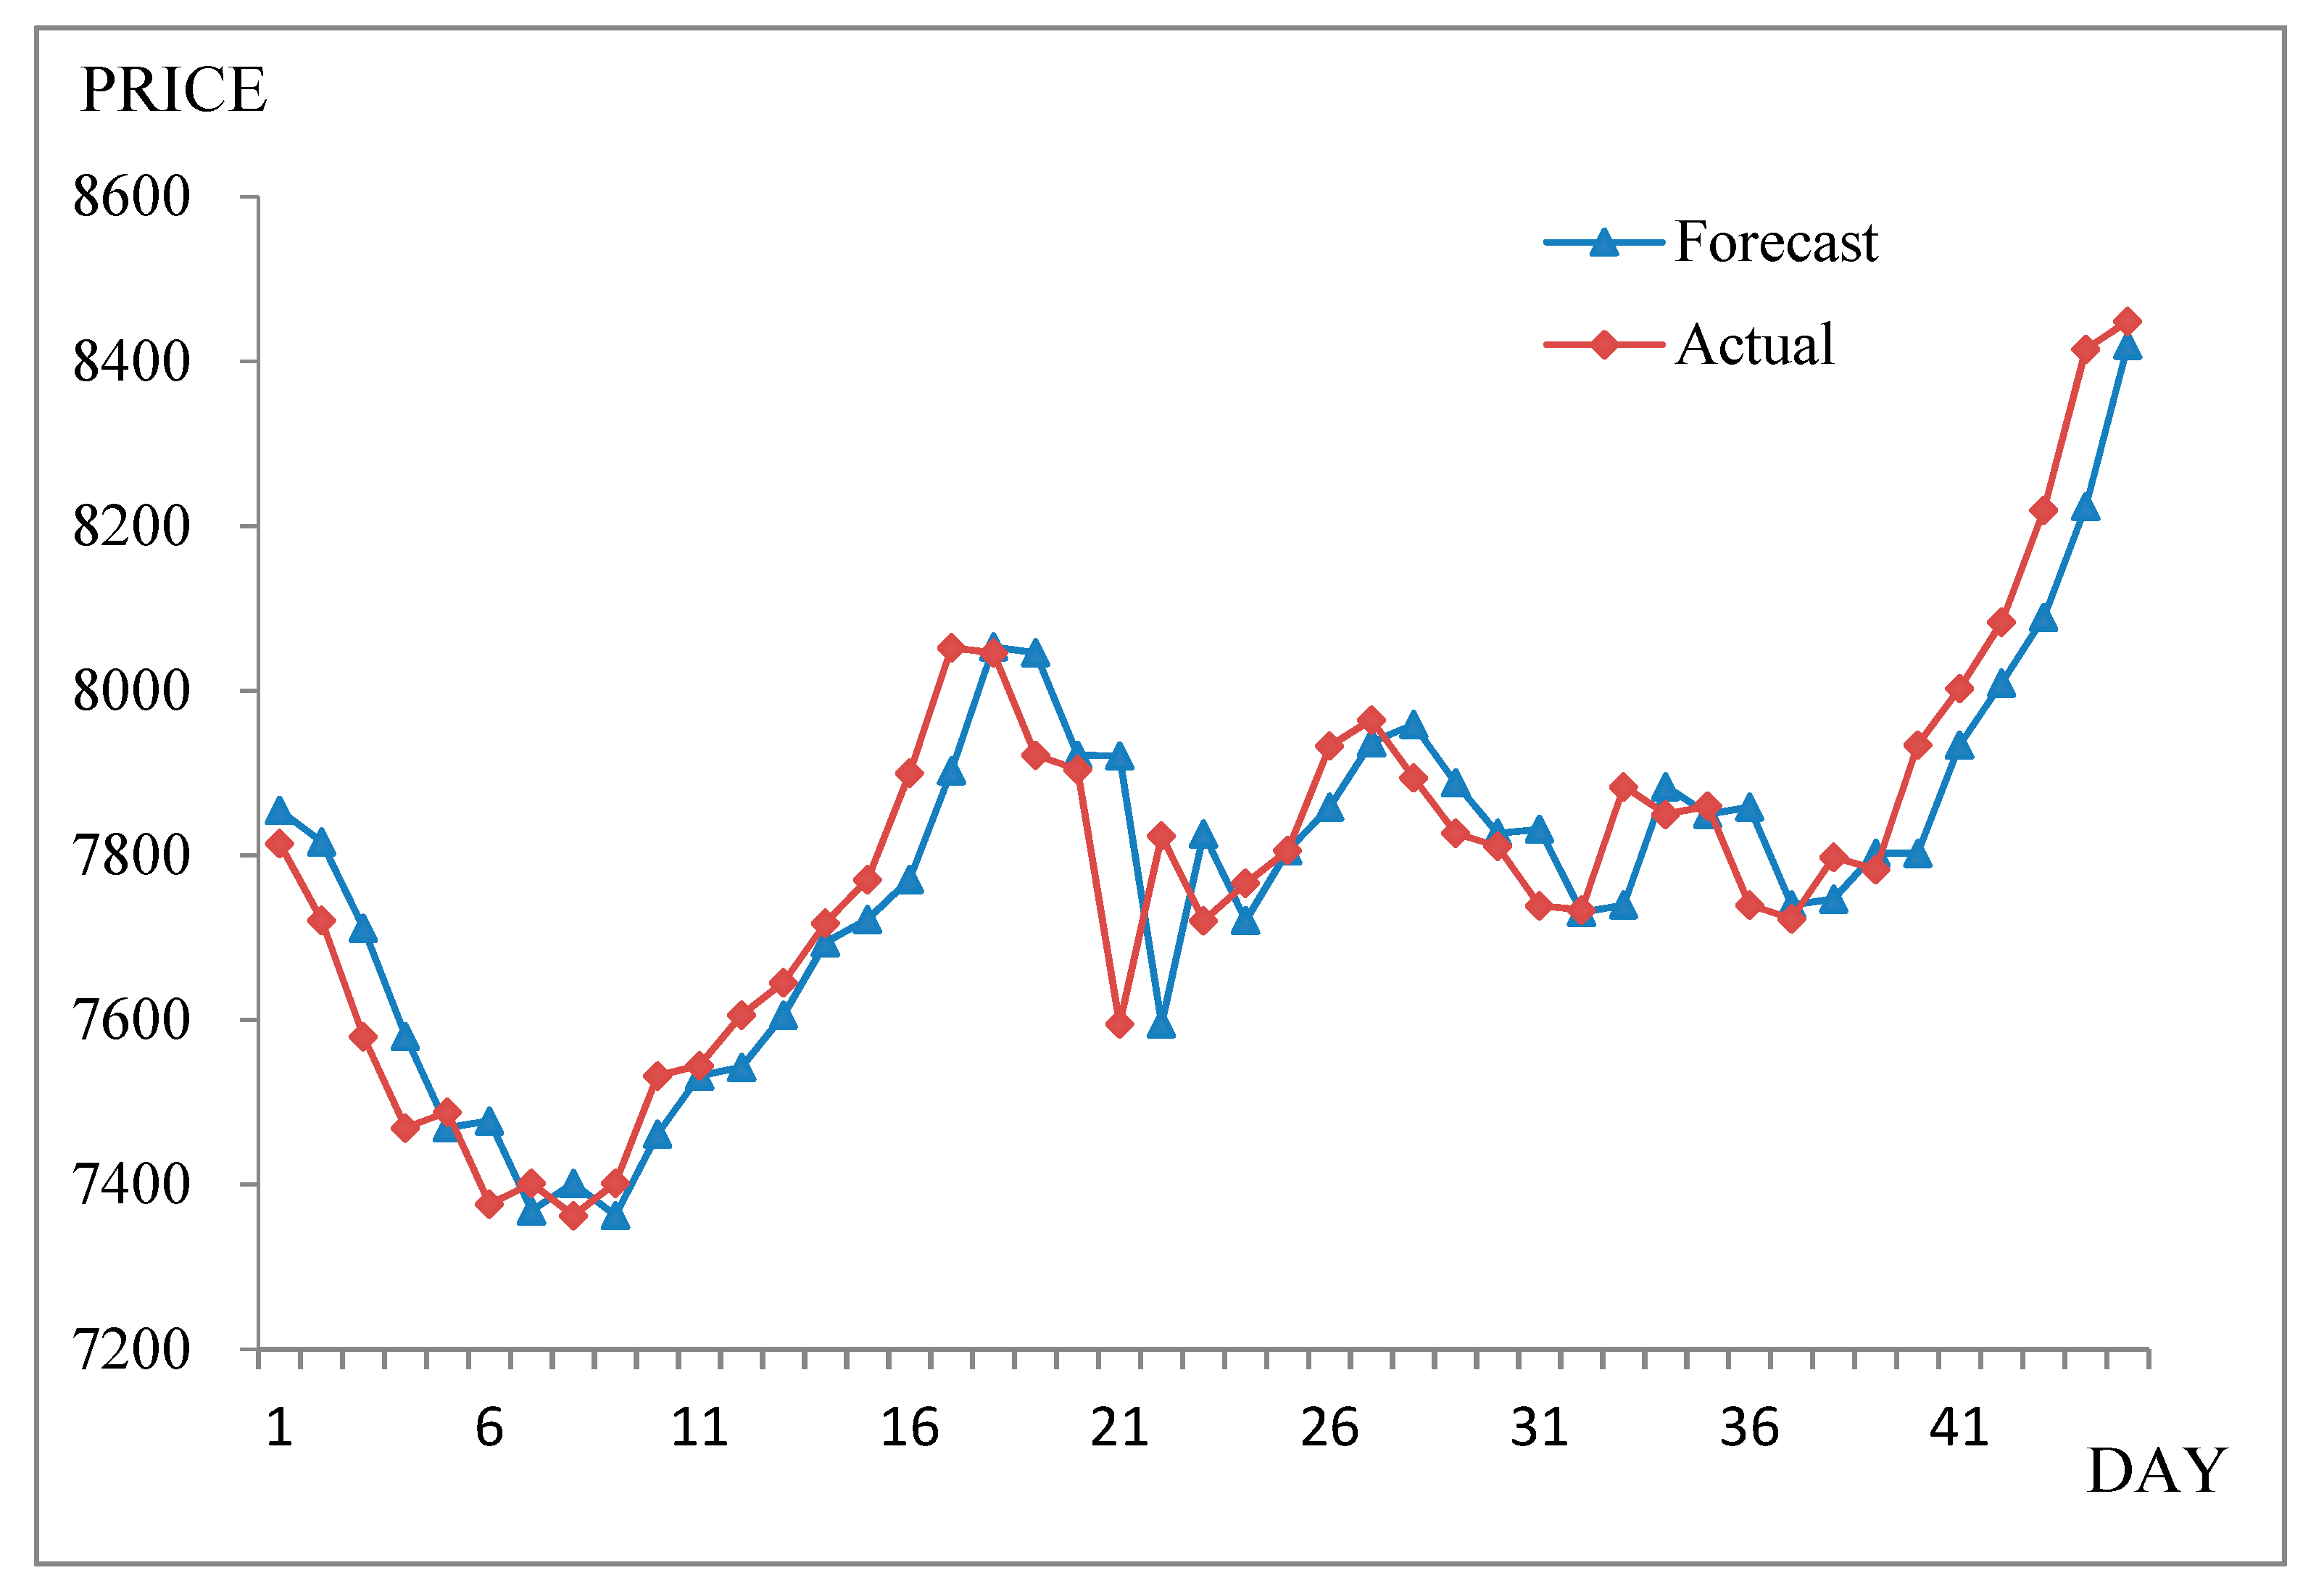
5.1. Taiwan Stock Exchange Capitalization Weighted Stock Index
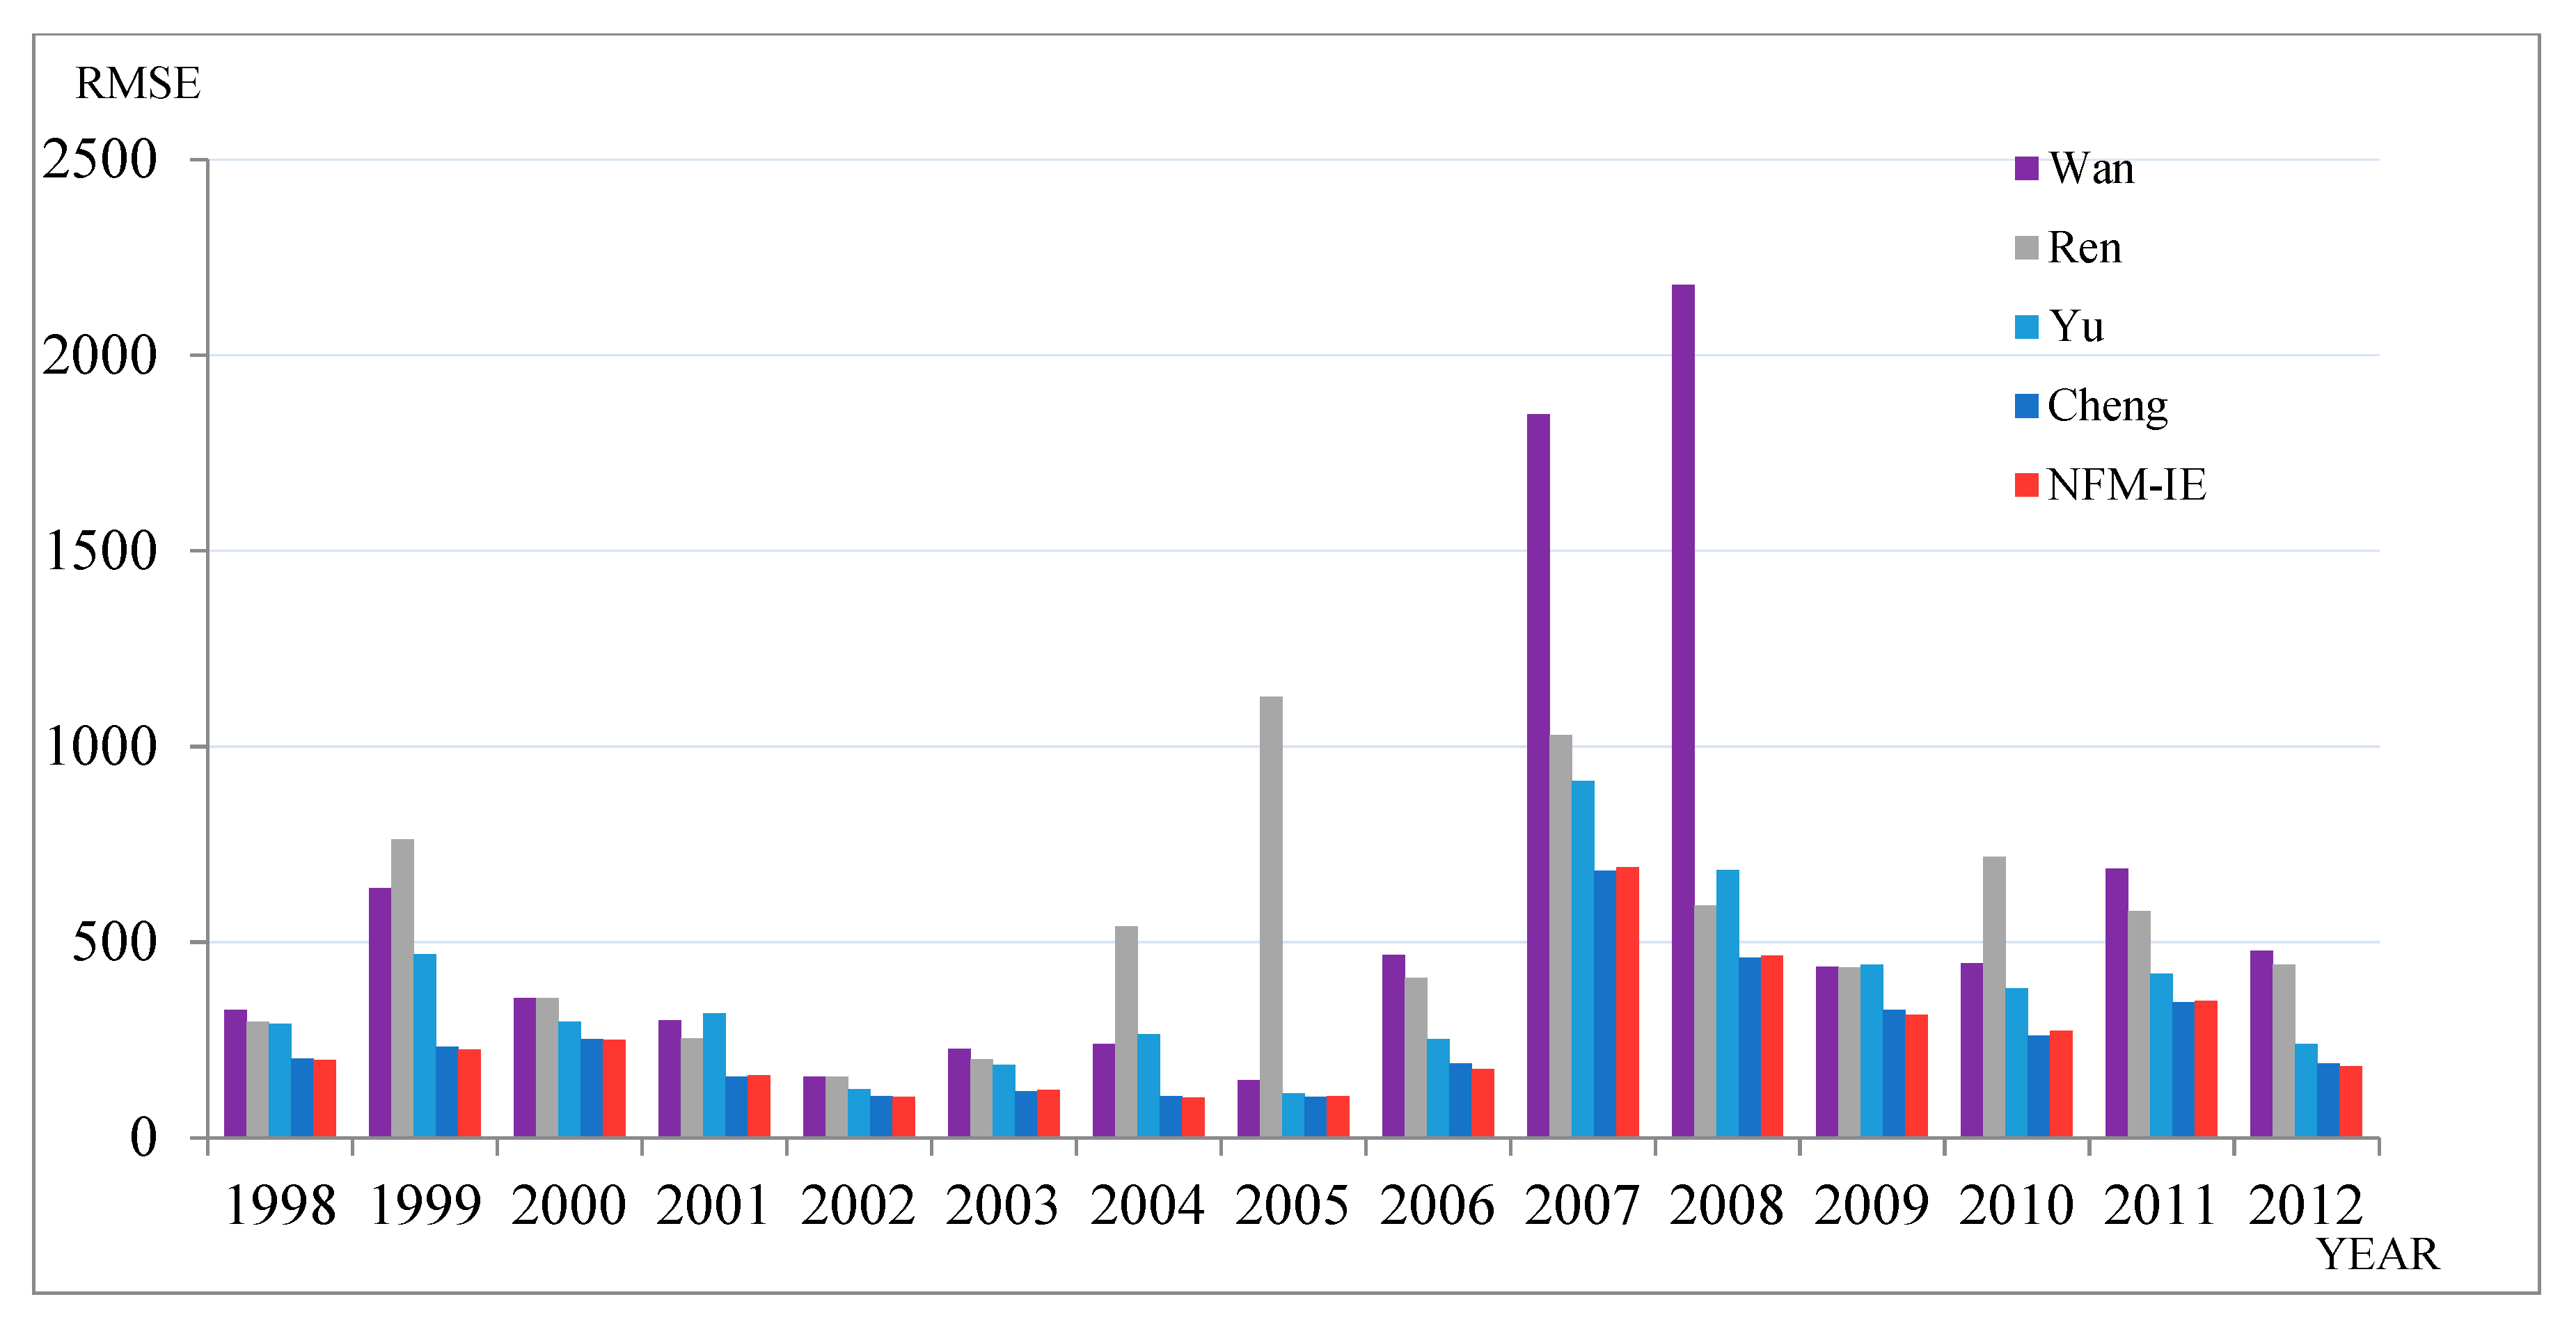
5.2. Forecasting Shanghai Stock Exchange Composite Index
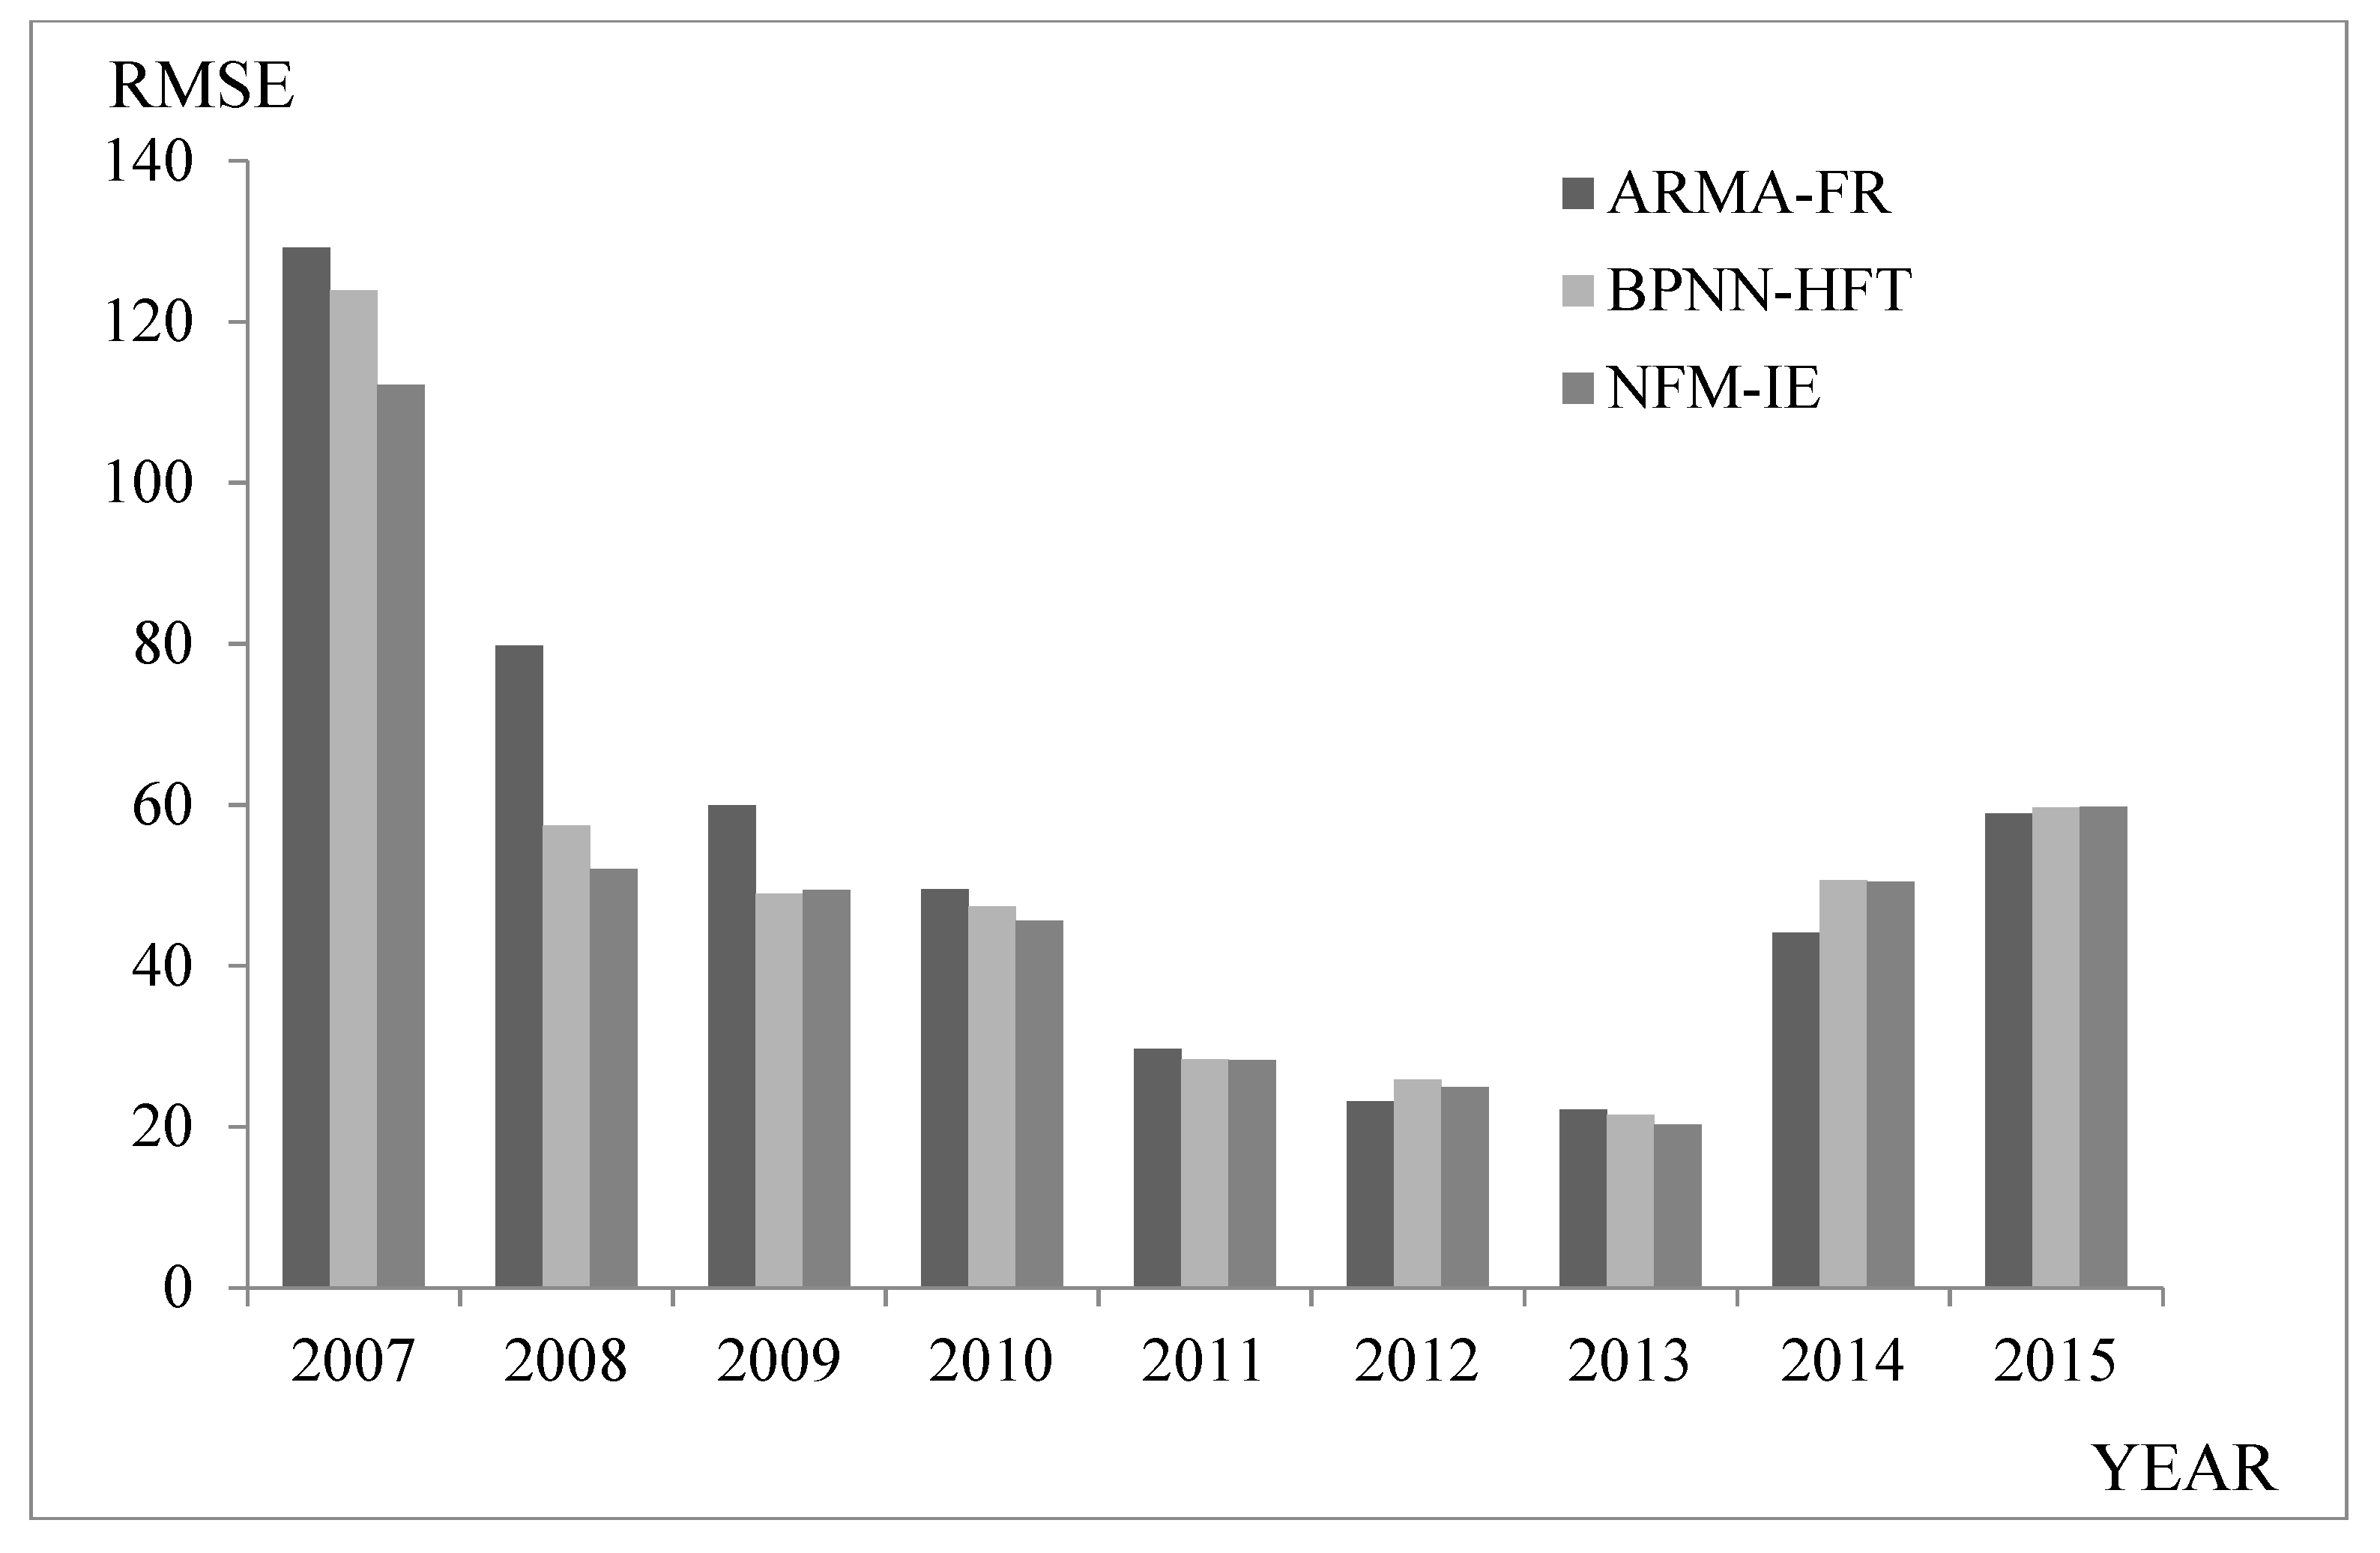
5.3. Forecasting Hong Kong-Hang Seng Index
5.4. Discussion
6. Conclusions
Author Contributions
Funding
Acknowledgments
Conflicts of Interest
References
- Han, M.; Xu, M. Laplacian Echo State Network for Multivariate Time Series Prediction. IEEE Trans. Neural Netw. Learn. Syst. 2018, 29, 238–244. [Google Scholar] [CrossRef] [PubMed]
- Mishra, N.; Soni, H.K.; Sharma, S.; Upadhyay, A.K. Development and Analysis of Artificial Neural Network Models for Rainfall Prediction by Using Time-Series Data. Int. J. Intell. Syst. Appl. 2018, 10, 16–23. [Google Scholar] [CrossRef]
- Safari, N.; Chung, C.Y.; Price, G.C.D. A Novel Multi-Step Short-Term Wind Power Prediction Framework Based on Chaotic Time Series Analysis and Singular Spectrum Analysis. IEEE Trans. Power Syst. 2018, 33, 590–601. [Google Scholar] [CrossRef]
- Moskowitz, D. Implementing the template method pattern in genetic programming for improved time series prediction. Genet. Program. Evol. Mach. 2018, 19, 271–299. [Google Scholar] [CrossRef]
- Soto, J.; Melin, P.; Castillo, O. Ensembles of Type 2 Fuzzy Neural Models and Their Optimization with Bio-Inspired Algorithms for Time Series Prediction; Springer Briefs in Applied Sciences & Technology; Springer: Basel, Switzerland, 2018. [Google Scholar]
- Soares, E.; Costa, P., Jr.; Costa, B.; Leite, D. Ensemble of evolving data clouds and fuzzy models for weather time series prediction. Appl. Soft Comput. 2018, 64, 445–453. [Google Scholar] [CrossRef]
- Song, Q.; Chissom, B.S. Forecasting enrollments with fuzzy time series—Part I. Fuzzy Sets Syst. 1993, 54, 1–9. [Google Scholar] [CrossRef]
- Song, Q.; Chissom, B.S. Fuzzy time series and its models. Fuzzy Sets Syst. 1993, 54, 269–277. [Google Scholar] [CrossRef]
- Song, Q.; Chissom, B.S. Forecasting enrollments with fuzzy time series—Part II. Fuzzy Sets Syst. 1991, 62, 1–8. [Google Scholar] [CrossRef]
- Cheng, C.H.; Yang, J.H. Fuzzy Time-Series Model Based on Rough Set Rule Induction For Forecasting Stock Price. Neurocomputing 2018, 302, 33–45. [Google Scholar] [CrossRef]
- Kumar, S.; Gangwar, S. Intuitionistic fuzzy time series: An approach for handling non-determinism in time series forecasting. IEEE Trans. Fuzzy Syst. 2016, 24, 1270–1281. [Google Scholar] [CrossRef]
- Smarandache, F. A unifying field in logics: Neutrosophic logic. Mult.-Valued Log. 1999, 8, 489–503. [Google Scholar]
- Wang, H.; Smarandache, F.; Zhang, Y.Q.; Sunderraman, R. Single valued neutrosophic sets. Multispace Multistruct 2010, 4, 410–413. [Google Scholar]
- Wang, H.; Smarandache, F.; Zhang, Y.Q.; Sunderraman, R. Interval Neutrosophic Sets and Logic: Theory and Applications in Computing; Hexis: Phoenix, AZ, USA, 2005. [Google Scholar]
- Zadeh, L.A. Probability measure of fuzzy events. J. Math. Anal. Appl. 1968, 23, 421–427. [Google Scholar] [CrossRef]
- DeLuca, A.S.; Termini, S. A definition of nonprobabilistic entropy in the setting of fuzzy set theory. Inf. Control 1972, 20, 301–312. [Google Scholar] [CrossRef]
- Vu, T.M.; Mishra, A.K.; Konapala, G. Information Entropy Suggests Stronger Nonlinear Associations between Hydro-Meteorological Variables and ENSO. Entropy 2018, 20, 38. [Google Scholar] [CrossRef]
- Zeng, X.; Wu, J.; Wang, D.; Zhu, X.; Long, Y. Assessing Bayesian model averaging uncertainty of groundwater modeling based on information entropy method. J. Hydrol. 2016, 538, 689–704. [Google Scholar] [CrossRef]
- Arellano-Valle, R.B.; Contreras-Reyes, J.E.; Stehlík, M. Generalized skew-normal negentropy and its application to fish condition factor time series. Entropy 2017, 19, 528. [Google Scholar] [CrossRef]
- Liu, Z.; Shang, P. Generalized information entropy analysis of financial time series. Physica A 2018, 505, 1170–1185. [Google Scholar] [CrossRef]
- Ye, G.; Pan, C.; Huang, X.; Zhao, Z.; He, J. A Chaotic Image Encryption Algorithm Based on Information Entropy. Int. J. Bifurcation Chaos 2018, 28, 9. [Google Scholar] [CrossRef]
- Tang, Y.; Liu, Z.; Pan, M.; Zhang, Q.; Wan, C.; Guan, F.; Wu, F.; Chen, D. Detection of Magnetic Anomaly Signal Based on Information Entropy of Differential Signal. IEEE Geosci. Remote Sens. Lett. 2018, 15, 512–516. [Google Scholar] [CrossRef]
- He, H.; An, L.; Liu, W.; Zhang, J. Prediction Model of Collapse Risk Based on Information Entropy and Distance Discriminant Analysis Method. Math. Prob. Eng. 2017, 2017. [Google Scholar] [CrossRef]
- Bariviera, A.F.; Martín, M.T.; Plastino, A.; Vampa, V. LIBOR troubles: Anomalous movements detection based on maximum entropy. Physica A 2016, 449, 401–407. [Google Scholar] [CrossRef]
- Liang, X.; Si, D.; Xu, J. Quantitative Evaluation of the Sustainable Development Capacity of Hydropower in China Based on Information Entropy. Sustainability 2018, 10, 529. [Google Scholar] [CrossRef]
- Zhang, Z.; Li, Y.; Jin, S.; Zhang, Z.; Wang, H.; Qi, L.; Zhou, R. Modulation Signal Recognition Based on Information Entropy and Ensemble Learning. Entropy 2018, 20, 198. [Google Scholar] [CrossRef]
- Shannon, C.E. A mathematical theory of communication. Bell Labs Tech. J. 1948, 27, 379–423. [Google Scholar] [CrossRef]
- Zadeh, L.A. The Concept of a Linguistic Variable and its Application to Approximate Reasoning. Inf. Sci. 1974, 8, 199–249. [Google Scholar] [CrossRef]
- Fu, J.; Ye, J. Simplified neutrosophic exponential similarity measures for the initial evaluation/diagnosis of benign prostatic hyperplasia symptoms. Symmetry 2017, 9, 154. [Google Scholar] [CrossRef]
- Ali, M.; Son, L.H.; Thanh, N.D.; Minh, N.V. A neutrosophic recommender system for medical diagnosis based on algebraic neutrosophic measures. Appl. Soft Comput. 2017, 71, 1054–1071. [Google Scholar] [CrossRef]
- Theil, H. Applied Economic Forecasting; North-Holland: Amsterdam, The Netherlands, 1966. [Google Scholar]
- Yu, T.H.K.; Huarng, K.H. A bivariate fuzzy time series model to forecast the TAIEX. Expert Syst. Appl. 2008, 34, 2945–2952. [Google Scholar] [CrossRef]
- Yu, T.H.K.; Huarng, K.H. Corrigendum to ‘‘A bivariate fuzzy time series model to forecast the TAIEX”. Expert Syst. Appl. 2010, 37, 5529. [Google Scholar] [CrossRef]
- Sullivan, J.; Woodall, W.H. A comparison of fuzzy forecasting and Markov modeling. Fuzzy Sets Syst. 1994, 64, 279–293. [Google Scholar] [CrossRef]
- Chen, S.M.; Chang, Y.C. Multi-variable fuzzy forecasting based on fuzzy clustering and fuzzy rule interpolation techniques. Inf. Sci. 2010, 180, 4772–4783. [Google Scholar] [CrossRef]
- Chen, S.M.; Chen, C.D. TAIEX Forecasting Based on Fuzzy Time Series and Fuzzy Variation Groups. IEEE Trans. Fuzzy Syst. 2011, 19, 1–12. [Google Scholar] [CrossRef]
- Chen, S.M.; Manalu, G.M.; Pan, J.S.; Liu, H.C. Fuzzy Forecasting Based on Two-Factors Second-Order Fuzzy-Trend Logical Relationship Groups and Particle Swarm Optimization Techniques. IEEE Trans. Cybern. 2013, 43, 1102–1117. [Google Scholar] [CrossRef]
- Jia, J.; Zhao, A.W.; Guan, S. Forecasting Based on High-Order Fuzzy-Fluctuation Trends and Particle Swarm Optimization Machine Learning. Symmetry 2017, 9, 124. [Google Scholar] [CrossRef]
- Guan, S.; Zhao, A. A Two-Factor Autoregressive Moving Average Model Based on Fuzzy Fluctuation Logical Relationships. Symmetry 2017, 9, 207. [Google Scholar] [CrossRef]
- Guan, H.; Dai, Z.; Zhao, A. A novel stock forecasting model based on High-order-fuzzy-fluctuation Trends and Back Propagation Neural Network. PLoS ONE 2018, 13. [Google Scholar] [CrossRef]
- Yu, H.K. A refined fuzzy time-series model for forecasting. Physica A 2005, 346, 657–681. [Google Scholar] [CrossRef]
- Wan, Y.; Si, Y.W. Adaptive neuro fuzzy inference system for chart pattern matching in financial time series. Appl. Soft Comput. 2017, 57, 1–18. [Google Scholar] [CrossRef]
- Ren, Y.; Suganthan, P.N.; Srikanth, N. A Novel Empirical Mode Decomposition With Support Vector Regression for Wind Speed Forecasting. IEEE Trans. Neural Netw. Learn. Syst. 2016, 27, 1793–1798. [Google Scholar] [CrossRef] [PubMed]
- Demšar, J. Statistical comparisons of classifiers over multiple datasets. J. Mach. Learn. Res. 2006. Available online: http://www.jmlr.org/papers/v7/demsar06a.html (accessed on 26 April 2019).
- Friedman, M. The use of ranks to avoid the assumption of normality implicit in the analysis of variance. J. Am. Stat. Assoc. 1937, 32, 675–701. [Google Scholar] [CrossRef]
- Friedman, M. A comparison of alternative tests of significance for theproblem of m rankings. Ann. Math. Stat. 1940, 11, 86–92. [Google Scholar] [CrossRef]
- Nemenyi, P. Distribution-free Multiple Comparisons. Ph.D. Thesis, Princeton University, Princeton, NJ, USA, 1963. [Google Scholar]

| Date (MM/DD/YYYY) | Actual | Forecast | (Forecast − Actual)2 | Date (MM/DD/YYYY) | Actual | Forecast | (Forecast − Actual)2 |
|---|---|---|---|---|---|---|---|
| 11/1/1999 | 7814.89 | 7868.47 | 2871.08 | 12/1/1999 | 7766.20 | 7719.40 | 2190.11 |
| 11/2/1999 | 7721.59 | 7821.82 | 10,046.31 | 12/2/1999 | 7806.26 | 7770.62 | 1270.07 |
| 11/3/1999 | 7580.09 | 7722.04 | 20,149.71 | 12/3/1999 | 7933.17 | 7814.75 | 14,022.27 |
| 11/4/1999 | 7469.23 | 7577.92 | 11,813.96 | 12/4/1999 | 7964.49 | 7944.99 | 380.16 |
| 11/5/1999 | 7488.26 | 7466.90 | 456.14 | 12/6/1999 | 7894.46 | 7968.41 | 5468.57 |
| 11/6/1999 | 7376.56 | 7489.54 | 12,764.37 | 12/7/1999 | 7827.05 | 7895.11 | 4631.50 |
| 11/8/1999 | 7401.49 | 7374.68 | 718.73 | 12/8/1999 | 7811.02 | 7826.02 | 225.13 |
| 11/9/1999 | 7362.69 | 7399.02 | 1320.19 | 12/9/1999 | 7738.84 | 7808.59 | 4864.78 |
| 11/10/1999 | 7401.81 | 7371.66 | 909.13 | 12/10/1999 | 7733.77 | 7738.76 | 24.94 |
| 11/11/1999 | 7532.22 | 7391.20 | 19,887.04 | 12/13/1999 | 7883.61 | 7723.92 | 25,501.56 |
| 11/15/1999 | 7545.03 | 7543.08 | 3.82 | 12/14/1999 | 7850.14 | 7897.06 | 2201.62 |
| 11/16/1999 | 7606.20 | 7536.55 | 4851.14 | 12/15/1999 | 7859.89 | 7854.28 | 31.42 |
| 11/17/1999 | 7645.78 | 7613.89 | 1017.07 | 12/16/1999 | 7739.76 | 7860.82 | 14,654.64 |
| 11/18/1999 | 7718.06 | 7643.21 | 5603.26 | 12/17/1999 | 7723.22 | 7738.34 | 228.50 |
| 11/19/1999 | 7770.81 | 7729.37 | 1716.87 | 12/18/1999 | 7797.87 | 7722.01 | 5754.66 |
| 11/20/1999 | 7900.34 | 7780.44 | 14,376.84 | 12/20/1999 | 7782.94 | 7811.00 | 787.09 |
| 11/22/1999 | 8052.31 | 7915.24 | 18,788.73 | 12/21/1999 | 7934.26 | 7782.84 | 22,929.50 |
| 11/23/1999 | 8046.19 | 8068.19 | 483.82 | 12/22/1999 | 8002.76 | 7946.35 | 3182.30 |
| 11/24/1999 | 7921.85 | 8046.12 | 15,443.79 | 12/23/1999 | 8083.49 | 8016.21 | 4526.63 |
| 11/25/1999 | 7904.53 | 7919.37 | 220.29 | 12/24/1999 | 8219.45 | 8096.51 | 15,113.68 |
| 11/26/1999 | 7595.44 | 7906.37 | 96,679.93 | 12/27/1999 | 8415.07 | 8233.25 | 33,058.13 |
| 11/29/1999 | 7823.90 | 7592.64 | 53,479.11 | 12/28/1999 | 8448.84 | 8429.73 | 365.06 |
| 11/30/1999 | 7720.87 | 7836.52 | 13,376.00 | Root Mean Square Error (RMSE) | 102.02 | ||
| Year | 1997 | 1998 | 1999 | 2000 | 2001 | 2002 | 2003 | 2004 | 2005 |
|---|---|---|---|---|---|---|---|---|---|
| RMSE | 141.42 | 114.69 | 102.02 | 129.94 | 114.22 | 66.84 | 53.88 | 55.24 | 53.1 |
| MSE | 19,999.62 | 13,153.80 | 10,408.08 | 16,884.40 | 13,046.21 | 4467.59 | 2903.05 | 3051.46 | 2819.61 |
| MAE | 113.42 | 96.31 | 79.38 | 96.65 | 92.48 | 51.65 | 41.11 | 38.65 | 41.27 |
| MAPE | 0.0143 | 0.0138 | 0.0102 | 0.0182 | 0.019 | 0.0111 | 0.007 | 0.0065 | 0.0067 |
| Theil’s U | 0.0089 | 0.0082 | 0.0065 | 0.0122 | 0.0119 | 0.0072 | 0.0046 | 0.0047 | 0.0043 |
| Order | 8 | 9 | 10 | 11 | 12 | 13 | 14 | 15 | 16 |
|---|---|---|---|---|---|---|---|---|---|
| 1997 | 141.41 | 141.42 | 141.46 | 141.9 | 141.53 | 141.72 | 141.68 | 141.8 | 141.69 |
| 1998 | 114.67 | 114.69 | 114.61 | 114.76 | 114.63 | 114.39 | 114.46 | 114.29 | 114.23 |
| 1999 | 101.86 | 102.02 | 101.7 | 101.66 | 101.55 | 101.59 | 101.7 | 101.26 | 101.54 |
| 2000 | 129.07 | 129.94 | 129.62 | 129.34 | 129.87 | 129.49 | 128.64 | 128.6 | 128.43 |
| 2001 | 113.97 | 114.22 | 114.53 | 114.86 | 115.37 | 115.11 | 115.39 | 116.06 | 116.02 |
| 2002 | 67.29 | 66.84 | 66.95 | 66.85 | 66.76 | 67.21 | 66.98 | 67.02 | 67.48 |
| 2003 | 53.84 | 53.88 | 53.99 | 53.68 | 53.74 | 53.8 | 53.55 | 53.48 | 53.45 |
| 2004 | 54.7 | 55.24 | 55.17 | 55.08 | 55.07 | 55.36 | 55.47 | 55.1 | 55.25 |
| 2005 | 53.09 | 53.1 | 53.22 | 53.09 | 53.14 | 53.11 | 53.13 | 53.04 | 52.97 |
| average | 92.21 | 92.37 | 92.36 | 92.36 | 92.41 | 92.42 | 92.33 | 92.29 | 92.34 |
| total | 829.9 | 831.35 | 831.25 | 831.22 | 831.66 | 831.78 | 831 | 830.65 | 831.06 |
| TYPE | Methods | RMSE | ||||||||||
|---|---|---|---|---|---|---|---|---|---|---|---|---|
| 1997 | 1998 | 1999 | 2000 | 2001 | 2002 | 2003 | 2004 | 2005 | Average | Total | ||
| Regression Model | Univariate conventional regression model (U_R) [32,33] | N/A | N/A | 164 | 420 | 1070 | 116 | 329 | 146 | N/A | 374.20 | 2245 |
| Bivariate conventional regression model (B_R) [32,33] | N/A | N/A | 103 | 154 | 120 | 77 | 54 | 85 | N/A | 98.80 | 593 | |
| Auto-regressive | Autoregressive model for order one (AR_1) [34] | 146.22 | 144.53 | 116.84 | 155.12 | 112.39 | 97.09 | 91.67 | 79.94 | N/A | 117.98 | 653.05 |
| Autoregressive model for order two (AR_2) [34] | 174.09 | 135.21 | 128.15 | 142.3 | 129.84 | 89.8 | 66.58 | 60.33 | N/A | 115.79 | 617 | |
| Neural network | Univariate neural network model (U_NN) [32,33] | N/A | N/A | 107 | 309 | 259 | 78 | 57 | 60 | N/A | 145.00 | 870 |
| Bivariate neural network mode (B_NN) [32,33] | N/A | N/A | 112 | 274 | 131 | 69 | 52 | 61 | N/A | 116.40 | 699 | |
| Fuzzy | fuzzy forecasting and fuzzy rule(F-R) [35] | N/A | N/A | 123.64 | 131.1 | 115.08 | 73.06 | 66.36 | 60.48 | N/A | 94.95 | 569.72 |
| Fuzzy time-series model based on rough set rule (F-RS) [10] | N/A | 120.8 | 110.7 | 150.6 | 113.2 | 66 | 53.1 | 58.6 | 53.5 | 90.81 | 605.7 | |
| Fuzzy variation groups (F-VG) [36] | 140.86 | 144.13 | 119.32 | 129.87 | 123.12 | 71.01 | 65.14 | 61.94 | N/A | 106.92 | 570.4 | |
| Fuzzy+ | Multi-variable fuzzy and particle swarm optimization (M_F-PSO) [37] | 138.41 | 113.88 | 102.34 | 131.25 | 113.62 | 65.77 | 52.23 | 56.16 | N/A | 96.71 | 521.37 |
| Univariate fuzzy and particle swarm optimization (U_F-PSO) [38] | 143.6 | 115.34 | 99.12 | 125.7 | 115.91 | 70.43 | 54.26 | 57.24 | 54.68 | 92.92 | 577.34 | |
| Autoregressive moving average and fuzzy logical Relationships (ARMA-FR) [39] | 141.89 | 119.85 | 99.03 | 128.62 | 125.64 | 66.29 | 53.2 | 56.11 | 55.83 | 94.05 | 584.72 | |
| Back propagation neural network and high-order fuzzy-fluctuation trends (BPNN-HFT) [40] | 142.99 | 112.51 | 96.77 | 126.85 | 120.12 | 66.39 | 54.87 | 58.1 | 54.7 | 92.59 | 577.8 | |
| NFM-IE | 141.42 | 114.69 | 102.02 | 129.94 | 114.22 | 66.84 | 53.88 | 55.24 | 53.1 | 92.37 | 575.24 | |
| Year | 2007 | 2008 | 2009 | 2010 | 2011 | 2012 | 2013 | 2014 | 2015 | Average |
|---|---|---|---|---|---|---|---|---|---|---|
| ARMA-FR (2017) [39] | 129.22 | 79.77 | 59.96 | 49.48 | 29.7 | 23.14 | 22.13 | 44.11 | 58.89 | 55.15 |
| BPNN-HFT (2018) [40] | 123.89 | 57.44 | 48.92 | 47.34 | 28.37 | 25.84 | 21.43 | 50.59 | 59.69 | 51.50 |
| NFM-IE | 112.10 | 51.98 | 49.37 | 45.58 | 28.22 | 24.92 | 20.21 | 50.44 | 59.77 | 49.17 |
| Method | 1998 | 1999 | 2000 | 2001 | 2002 | 2003 | 2004 | 2005 | 2006 | 2007 | 2008 | 2009 | 2010 | 2011 | 2012 | Average |
|---|---|---|---|---|---|---|---|---|---|---|---|---|---|---|---|---|
| Yu (2005) [41] | 291.4 | 469.6 | 297.05 | 316.85 | 123.7 | 186.16 | 264.34 | 112.4 | 252.44 | 912.67 | 684.9 | 442.64 | 382.06 | 419.67 | 239.11 | 359.66 |
| Wan (2017) [42] | 326.62 | 637.1 | 356.7 | 299.43 | 155.09 | 226.38 | 239.63 | 147.2 | 466.24 | 1847.8 | 2179 | 437.24 | 445.41 | 688.04 | 477.34 | 595.26 |
| Ren (2016) [43] | 296.67 | 761.9 | 356.81 | 254.07 | 155.4 | 199.58 | 540.19 | 1127 | 407.89 | 1028.7 | 593.8 | 435.18 | 718.33 | 578.7 | 442.44 | 526.46 |
| Cheng (2018) [10] | 201.99 | 231.91 | 251.7 | 156.58 | 106.26 | 118.74 | 105.38 | 103.96 | 189.2 | 682.08 | 460.12 | 326.65 | 260.67 | 346.33 | 190.13 | 248.78 |
| NFM-IE | 195.86 | 223.91 | 246.11 | 163.49 | 105.65 | 122.04 | 102.23 | 105.37 | 173.55 | 694.89 | 469.11 | 319.7 | 274.73 | 347.2 | 181.98 | 248.39 |
© 2019 by the authors. Licensee MDPI, Basel, Switzerland. This article is an open access article distributed under the terms and conditions of the Creative Commons Attribution (CC BY) license (http://creativecommons.org/licenses/by/4.0/).
Share and Cite
Guan, H.; Dai, Z.; Guan, S.; Zhao, A. A Neutrosophic Forecasting Model for Time Series Based on First-Order State and Information Entropy of High-Order Fluctuation. Entropy 2019, 21, 455. https://doi.org/10.3390/e21050455
Guan H, Dai Z, Guan S, Zhao A. A Neutrosophic Forecasting Model for Time Series Based on First-Order State and Information Entropy of High-Order Fluctuation. Entropy. 2019; 21(5):455. https://doi.org/10.3390/e21050455
Chicago/Turabian StyleGuan, Hongjun, Zongli Dai, Shuang Guan, and Aiwu Zhao. 2019. "A Neutrosophic Forecasting Model for Time Series Based on First-Order State and Information Entropy of High-Order Fluctuation" Entropy 21, no. 5: 455. https://doi.org/10.3390/e21050455
APA StyleGuan, H., Dai, Z., Guan, S., & Zhao, A. (2019). A Neutrosophic Forecasting Model for Time Series Based on First-Order State and Information Entropy of High-Order Fluctuation. Entropy, 21(5), 455. https://doi.org/10.3390/e21050455