Abstract
Background: Obstructive sleep apnea (OSA), a highly prevalent sleep disorder, is closely related to cardiovascular disease (CVD). Our previous work demonstrated that Shannon entropy of the degree distribution (EDD), obtained from the network domain of heart rate variability (HRV), might be a potential indicator for CVD. Method: To investigate the potential association between OSA and EDD, OSA patients and healthy controls (HCs) were identified from a sleep study database. Then EDD was calculated from electrocardiogram (ECG) signals during sleep, followed by cross-sectional comparisons between OSA patients and HCs, and longitudinal comparisons from baseline to follow-up visits. Furthermore, for OSA patients, the association between EDD and OSA severity, measured by apnea-hypopnea index (AHI), was also analyzed. Results: Compared with HCs, OSA patients had significantly increased EDD during sleep. A positive correlation between EDD and the severity of OSA was also observed. Although the value of EDD became larger with aging, it was not OSA-specified. Conclusion: Increased EDD derived from ECG signals during sleep might be a potential dynamic biomarker to identify OSA patients from HCs, which may be used in screening OSA with high risk before polysomnography is considered.
1. Introduction
Obstructive sleep apnea (OSA), characterized by cyclic collapse of the upper airway and partial or complete cessation of airflow during sleep, is highly prevalent with prevalence of 34% in men and 17% in women in the general population [1]. OSA patients have increased risks of developing comorbid cardiovascular disease (CVD) and have notorious outcomes related to CVD. It is estimated that 40–60% of patients are OSA with CVD [2]. Therefore, effective and early diagnosis of OSA will contribute substantially not only to the early intervention of OSA but also to the prevention of the complications [3].
Currently, the gold standard for OSA diagnosis is polysomnography (PSG), which is usually conducted in fully equipped and controlled sleep laboratories. In such PSG-based studies, multiple sensors are placed to record simultaneously nasal airflow, respiratory movement, oxygen saturation (SpO2), electroencephalogram (EEG), electro-oculogram (EOG), electromyogram (EMG), electrocardiogram (ECG) and body position [3]. OSA is diagnosed based on the symptoms and values of apnea–hypopnea index (AHI) of sleep [4]. Although PSG can provide an accurate diagnostic report, the study is expensive and the manual scoring is time-consuming. The need for alternative diagnosis approaches of OSA persists.
As a non-invasive exam, ECG is widely used in clinics [5]. Heart rate variability (HRV) is generally used to describe the variation of intervals between the peaks of successive R-wave in ECG [6] and often called RR intervals. HRV analysis has been recommended as a tool for screening OSA. Increasing number of studies confirmed the fact that healthy heart rate rhythms is complex, non-stationary and nonlinear [7,8,9], thus nonlinear dynamical analysis are more recommended. Compared to healthy subjects, decreased heart rate complexity measured by entropy has been reported as a sensitive indicator for the presence of OSA [10,11,12].
Fractal organization is another important nonlinear feature of healthy cardiac dynamics [13]. Our previous work demonstrated that abnormal activation of the cardiovascular controls with altered fractal organization during sleep might be a potential risk factor for adverse cardiovascular event [14]. Shannon entropy of the degree distribution (EDD), obtained from the network domain of HRV, was reported to be an indicator for monitoring the alterations in fractal organization of cardiac dynamics [14,15]. However, to our knowledge, no previous publication has evaluated the performance of this approach to distinguish patterns of HRV from OSA and healthy subjects.
In this study, we identified a group of OSA patients and healthy subjects in an open database. Because differences exist between sleep stages, we separately analyzed heart rate dynamics in rapid eye movement (REM) sleep and Stage 2 sleep, which is the most dominant non-REM sleep stage. We aimed to explore the potential associations between EDD and OSA, by cross-sectional comparisons between groups and longitudinal comparisons from baseline to follow-up visit. Meanwhile, we aimed to investigate whether EDD can be used to detect heart rate alterations in OSA patients.
2. Materials and Methods
2.1. Data Collection
2.1.1. Participants
Data analyzed in this retrospective study were obtained from the database of Sleep Heart Health Study (SHHS) [16], a multi-center cohort study that was implemented by the National Heart, Lung, and Blood Institute to determine cardiovascular and other consequences of sleep-disordered breathing. Participants were recruited for a baseline PSG in the first exam cycle (SHHS-1, 1995–1998) and a follow-up PSG in the second exam cycle (SHHS-2, 2001–2003).
To determine the association of HRV and OSA, we screened subjects with OSA but otherwise healthy at baseline. We excluded subjects if they: (1) had a value of AHI less than five; (2) drank every day; (3) had a history of diabetes, hypertension, stroke, congestive heart failure, angina, myocardial infarctions, revascularization procedure, myocardial infarction procedure, percutaneous transluminal coronary angioplasties, or coronary artery bypass graft surgeries prior to SHHS-2 exam; (4) took medication within two weeks prior to the exams with known effects on HRV (tricyclic anti-depressants, benzodiazepines, and non-tricyclic antidepressants); or (5) were lost for follow-up or with insufficient ECG data for HRV analysis.
Following the above exclusion criteria, 60 participants with baseline OSA were included in the present study. All of them had both baseline and follow-up PSG recordings. Moreover, healthy controls (HCs), who had a value of AHI less than five at SHHS-1, were selected using the same Exclusion Criteria (2)–(4). As a result, 48 subjects were included in the HC group at SHHS-1, whereas only 18 out of them had follow-up PSGs at SHHS-2. Thus, the longitudinal comparisons for the HCs were conducted in those 18 subjects.
2.1.2. PSG and Sleep Outcomes
Unattended overnight PSG was performed with a portable PS-2 system (Compumedics, Abottsville, Australia). Sensors were placed and equipment was calibrated during an evening home visit by a certified technician, including two channels of EEG (C3/A2 and C4/A1), EOG (right and left), bipolar submental EMG, thoracic and abdominal excursions (inductive plethysmography bands), airflow (by a nasal-oral thermocouple, Protec, Woodinville, WA, USA), finger pulse oximetry (Nonin, Minneapolis, MN, USA), ECG, body position (mercury gauge sensor), and ambient light (on/off, by a light sensor secured to the recording garment). After equipment retrieval, the data were forwarded to a central reading center (Case Western Reserve University, Cleveland, OH) for scoring according to a standard protocol. The polysomnographic methods, scoring protocol, and quality assurance procedures were described in other studies [17,18].
2.2. Signal Preprocessing
ECG was sampled at 125 Hz in baseline PSGs, and 250 Hz in follow-up PSGs. For each participant, maximal overlap discrete wavelet transformation was used to extract RR intervals from the ECG signals [19,20]. RR intervals are generally analyzed in a standardized duration of 5 min for short-term HRV analysis. However, most graph theoretic measures, such as EDD, are contingent on the number of nodes [21], which was directly determined by data length of the used time series in this study. Considering that heart rate is different among different individuals, we thus used a uniformed data length instead of a uniformed time duration to pick-up all the RR segments. As a data length of 500 has commonly been used in HRV studies [22,23,24], segments with 550 successive RR intervals (approximately 7–9 min duration in sleep) in all sleep stages (REM or Stages 1–4) were extracted. Then, after removing the artifacts or ectopic beats in these segments, a series with 500 data points (also called NN intervals) were used for further HRV analysis. As there were insufficient segments to be analyzed in Stages 1, 3 and 4 sleep for the majority of participants, only HRV in REM and Stage 2 sleep were further analyzed.
2.3. Conventional TIME and Frequency Domain HRV Measures
Measures derived from time domain and frequency domain analysis are commonly used in HRV studies [25,26,27]. Thus, in this study, HRV indices, such as mean NN intervals (meanNN), standard deviation of NN intervals (SDNN), percentage of heart period differences larger than 50 ms (pNN50), low frequency (0.04–0.15 Hz) power (LF), high frequency (0.15–0.40 Hz) power (HF), LF in normalized units (LFnorm), HF in normalized units (HFnorm) and total power (TP), were computed.
2.4. Nonlinear Measures
2.4.1. Sample Entropy (SampEn)
SampEn was developed as a refinement of the approximate entropy to reduce the bias induced by self-matching. It is independent of the length of recording and exhibits relative consistency under various circumstances [28]. For a time series with N data points, denoted as , to compute the SampEn, vectors are first constructed in the delayed m-dimensional space as:
By defining the distance between two vectors as the maximum difference between their corresponding components, for a vector , we can calculate the probability of vectors whose distance to is less than a predefined tolerance r, as shown in Equation (2),
Then, we can get the average of when i varies from 1 to N−m + 1 and denoted it as , as shown in Equation (3):
Similarly, as shown in Equation (4), can be obtained when the original time series is embedded in (m + 1)-dimensional space.
Finally, the SampEn of can be calculated as:
One issue in the calculation of SampEn is to determine the dimension m and tolerance r. Based on previous studies [29,30], we set m to 2 and r as 0.15 times the standard deviation of the time series .
2.4.2. Shannon Entropy of the Degree Distribution (EDD)
After converting the original time series into network domain, an important metric of the obtained network, EDD, seems promising in capturing the alterations of cardiac dynamics under different physiological and pathological conditions [14,15]. As proposed in the work of Lacasa et al. [31], a time series with N data points, denoted as , can be converted to a network through the visibility graph (VG) algorithm. To carry out the VG algorithm, first, take each data point as a node in the network sequentially. Then, determine connections between all node pairs in the network according to the visibility criteria, which is shown in the conditional expression below:
For a pair of nodes, x(i) and x(j), they will be connected in the network only when Equation (6) is satisfied. An example for the VG algorithm on a RR-interval time series with 20 data points is illustrated in Figure 1.
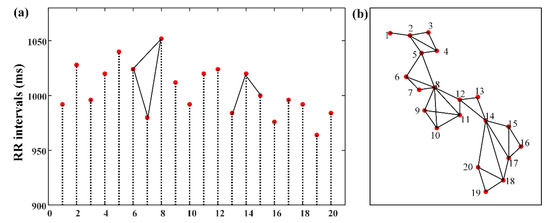
Figure 1.
(a) Example of an RR-interval time series with 20 data points. Solid lines illustrate the visibility criteria. Stem 6 can be seen from Stems 7 and 8. However, no visibility can be seen between Stems 13 and 15 because sight is blocked by Stem 14. (b) The associated graph extracted from time series in (a) using the VG algorithm.
Once the network is constructed via the VG algorithm, the degree of each node in the network can be calculated by counting the number of edges incident with the node. EDD can then be obtained as the Shannon entropy of the degree distribution, as shown in Equation (7):
where is defined as the fraction of nodes with degree in the network and as the maximum of [15].
2.5. Statistical Analyses
MATLAB R2012a (Mathworks Inc., Natick, MA) software was used for statistical evaluations. The normality of the data was firstly evaluated by Lilliefors test. For cross-sectional comparisons between the OSA and HC, comparisons of gender were made using the Fisher’s exact test and comparisons of continues variables were assessed by non-parametric test (Mann–Whitney U) if they violate the normality otherwise by t-test. For longitudinal comparisons, sign rank test was used if the data violate the normality, otherwise paired t-test was used. A p-value < 0.05 was considered as an indicator for significant difference.
3. Results
Table 1 summarizes the demographic characteristics of subjects included in this study. At SHHS-1, no significant differences were found in age, gender and BMI. Interestingly, as far as the PSG-based sleep measures were concerned, OSA patients had significantly less sleep in Stage 1 compared with the HCs. At SHHS-2, no significant differences were found in the demographics and sleep measures except for AHI. Longitudinally, for both groups, BMI remained stable in baseline and follow-up. In terms of PSG-based sleep measures, both groups exhibited a prominent deterioration in sleep quality with significantly decreased deep sleep in Stages 3 and 4. Moreover, increased percentage of sleep in Stage 1 and decreased sleep efficiency were found in OSA group (p < 0.05). Although there is no significant alteration in AHI for OSA patients, a significant increase of AHI was observed in HCs. Actually, in SHHS-2, 13 out of 18 HCs had an AHI value more than five and less than fifteen, suggesting a development of mild OSA occurred since baseline.

Table 1.
Baseline characteristics of studied subjects.
Table 2 and Table 3 summarize the results for HRV analysis. Note that, for each participant, HRV analysis was conducted on all the qualified segments with 500 NN intervals at each sleep stage (REM or Stage 2). Then, the average of each HRV measure during REM or Stage 2 sleep was calculated to provide a single number per subject, which was then subjected to statistical analysis.
Table 2.
Heart rate variability comparisons between groups during REM and Stage 2 sleep.
Table 3.
Longitudinal comparisons (SHHS-1 vs SHHS-2) during REM and Stage 2 sleep.
As shown in Table 2, at SHHS-1, compared with HC, significantly increased LFnorm and decreased HFnorm were found in OSA group during Stage 2 sleep. At SHHS-2, OSA patients exhibited a significantly shortened heart rate interval characterized by meanNN. Moreover, as also illustrated in Figure 2, during Stage 2 sleep, significant increases of EDD can be found in OSA related to HC in both SHHS-1 and SHHS-2 visits. During REM sleep, significant difference of EDD between OSA and HC was only observed at SHHS-1.
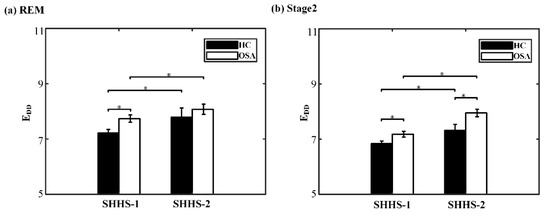
Figure 2.
Cross-sectional and longitudinal comparisons of EDD during different sleep stages. (a) REM sleep and (b) Stage 2 sleep. * indicates p < 0.05.
Regarding the longitudinal alterations of the HRV measures in sleep, it is worth noting that, as shown in Table 3, the majority of HRV measures derived from time domain and frequency domain analysis remained unchanged, even in the OSA group. However, significant increases of EDD were found, regardless of sleep stages or groups (Figure 2). Similarly, significantly decreased SampEn was found in OSA group during both sleep stages, while for the HC, only a significant decline of SampEn was found during REM sleep.
We further investigated the correlation (Pearson’s correlation coefficient) between EDD and AHI for the OSA patients. The results show that a Stage 2-specific positive correlation was found at both baseline (r = 0.41, p = 0.001) and follow-up (r = 0.30, p = 0.02) visits.
4. Discussion
The present study is an extension of our previous work [14,15], which demonstrated that EDD, obtained from HRV signals in network domain, might be a potential risk factor for CVD. As OSA is closely related to CVD, here we calculated EDD and other traditional HRV measures derived from time domain (meanNN, SDNN and pNN50), frequency domain (LF, HF, LFnorm, HFnorm and TP) and nonlinear analysis (SampEn) in OSA patients. Both cross-sectional and longitudinal comparisons were made based on an open database SHHS. Our main findings are threefold. Firstly, compared with HCs, significantly increased EDD during sleep can be found in OSA patients at both baseline and follow-up. Secondly, both OSA and HCs exhibited a significant increase of EDD in the follow-up visit compared with baseline. Thirdly, for OSA patients, a positive correlation between EDD and the severity of disease (characterized by the values of AHI) was found at both baseline and follow-up. As both OSA and aging are risk factors for CVD, our findings might suggest that increased EDD in sleep should be a sensitive indicator associated with the high risk for CVD. No other HRV indices investigated in this study shown coincident and significant alteration with the presence of OSA, aging and deterioration of OSA.
HRV is a physiological variable that is affected by the interaction of the sympathetic and the parasympathetic autonomous systems [32,33]. It is commonly recognized that the HF component of HRV is associated with parasympathetic activity, while the LF component might be an indicator of both sympathetic and parasympathetic activity [26,34,35]. Studies have demonstrated that OSA patients may develop enhanced sympathetic activity due to abnormal adaptability of cardiac autonomic system, leading to a decreased HF and increased LF [12,36]. In accordance with the previous studies, we observed a significant decreased HFnorm and increased LFnorm in the cross-sectional comparisons at baseline. However, in the follow-up visit, the differences in these HRV metrics between the OSA patients and HCs disappeared while the difference in EDD maintained from baseline to follow-up during Stage 2 sleep. As shown in Table 1, there is a significant increase of AHI for the HCs from SHHS-1 to SHHS-2, suggesting that the majority of the HCs (13 out of 18) had actually developed to mild OSA. Such an alteration might contribute to the insensitive of the investigated frequency metrics of HRV to differentiate OSA and HCs in SHHS-2.
Actually, heart rate is influenced by numerous interacting factors, including not only the sympathetic and parasympathetic activity, but also the physical activity, hormonal and temperature variations, digestion, circadian rhythms and so on, leading to exceedingly complex variations in healthy heart rate dynamics [37]. In recent years, along with system complexity becoming an established theory in health science, decreased complexity has been recognized as a common indicator of pathological conditions or aging [38,39]. Entropy-based measures have been widely used for the evaluation of complexity [10,11,40]. Amongst them, SampEn is frequently adopted in the analysis of clinical time series, such as HRV, ECG and EEG signals [28,41,42]. Numerous studies have demonstrated that biological aging is characterized by a loss of physiologic complexity in the dynamics of the cardiovascular [2,43]. Consistently, in our study, decreased SampEn was found in the follow-up visit compared with those at the baseline, for both OSA patients and HCs. However, in our observation, SampEn was not sensitive for capturing the difference between OSA and HC in sleep.
As far as the EDD was concerned, in our previous work, by using HRV data in daytime when subjects were awake, we reported that EDD was significant decreased in pathological individuals (e.g., congestive heart failure, atrial fibrillation and ventricular tachyarrhythmia) compared with healthy controls, revealing a reduction of EDD is possibly a dynamic marker of cardiac disorders [15]. However, in this study, significant increase of EDD in sleep (especially in Stage 2 sleep) was found with the presence of OSA, aging, and the deterioration of OSA. Although future work is required to investigate the mechanism underlying of EDD among different states (sleep or awake), our findings in the present work are consistent with one of our other studies [14]. We previously reported that a larger value of EDD during sleep was observed in older individuals than youth, in males than females, and in overweight participants than those with normal BMI values, suggesting a positive association between increased EDD and the high risks of CVD, such as aging and obesity [14].
Signals from physiological systems (e.g., cardiovascular system) are generally nonlinear and chaotic, coordinated and controlled by a variety of independent factors with complex and nonlinear components [44,45]. The nonlinear analysis of HRV has thus been suggested as a powerful supplement to the conventional time and frequency domain HRV approaches in recent years. This view was supported in the current work as EDD sensitively captured the alterations which may contribute to the presence and deterioration of OSA. Our findings make an addition to existing knowledge by showing that EDD might be a sensitive measure to capture the altered heart rate dynamics in OSA patients. Thus, our study may inspire and encourage future applications of nonlinear HRV analysis in this field.
5. Conclusions
The present study investigated the association between OSA and a measure derived from nonlinear analysis, the entropy of the degree distribution EDD. Increased EDD in sleep was found in OSA patients compared with HCs, in the aging process of OSA patients, and in the illness deterioration of OSA. However, in the current study, there is a relatively small sample for the healthy controls, especially in SHHS-2. Further prospective studies are encouraged to evaluate OSA in a broader range of population and to apply EDD in the OSA diagnostic and intervention system.
Author Contributions
F.H. and Y.M. conceived and designed the study and supervised the analysis. L.Z. and M.F. analyzed data. L.Z. interpreted the results and drafted the manuscript. F.H., Y.M. and F.X. polished and completed the paper. All authors have read and approved the final version of this manuscript.
Funding
This research was funded by National Natural Science Foundation of China (Grant Nos. 61401518 and 11974231), Jiangsu Provincial Key R & D Program (Social Development) (Grant Nos. BE2015700 and BE2016773), research grants funded by the National Institutes of Health of the United States (T32 AT000051) and the Double First-Class University project.
Acknowledgments
We would like to thank the support team of the forum in the Sleep Heart Health Study for their detailed explanations and assistance in our use of the dataset.
Conflicts of Interest
The authors declare no conflict of interest. The funders had no role in the design of the study; in the collection, analyses, or interpretation of data; in the writing of the manuscript, or in the decision to publish the results.
References
- Corben, L.A.; Michael, H.; Janet, C.; Geneieve, T.; Delatycki, M.B. Increased prevalence of sleep-disordered breathing in Friedreich ataxia. Neurology 2013, 81, 46–51. [Google Scholar] [CrossRef] [PubMed]
- Johnson, K.G.; Johnson, D.C. Frequency of sleep apnea in stroke and TIA patients: A meta-analysis. J. Clin. Sleep Med. 2010, 6, 131–137. [Google Scholar] [PubMed]
- Lettieri, C.J.; Eliasson, A.H.; Andrada, T.; Khramtsov, A.; Raphaelson, M.; Kristo, D.A. Obstructive sleep apnea syndrome: Are we missing an at-risk population? J. Clin. Sleep Med. 2005, 128, 381–385. [Google Scholar] [CrossRef]
- Sateia, M.J. International Classification of Sleep Disorders-Third Edition. Chest 2014, 146, 1387–1394. [Google Scholar] [CrossRef] [PubMed]
- Faust, O.; Acharya, U.R.; Ng, E.Y.K.; Fujita, H. A review of ecg-based diagnosis support systems for obstructive sleep apnea. J. Mech. Med. Biol. 2016, 16, 1640004. [Google Scholar] [CrossRef]
- Pumprla, J.; Howorka, K.; Groves, D.; Chester, M.; Nolan, J. Functional assessment of heart rate variability: Physiological basis and practical applications. Int. J. Cardiol. 2002, 84, 1–14. [Google Scholar] [CrossRef]
- Yan, M.; Tseng, P.H.; Ahn, A.; Wu, M.S.; Ho, Y.L.; Chen, M.F.; Peng, C.K. Cardiac Autonomic Alteration and Metabolic Syndrome: An Ambulatory ECG-based Study in A General Population. Sci. Rep. 2017, 7, 44363. [Google Scholar]
- Crespo, A.; Campo, F.D.; Gómez, J.; Álvarez, D.; Marcos, J.; Hornero, R. Nonlinear analysis of heart rate variability in patients with sleep apnea hypopnea syndrome (SAHS). A severity study. Sleep Med. 2013, 14, e262–e263. [Google Scholar] [CrossRef]
- Cysarz, D.; Bettermann, H.; Van, L.P. Entropies of short binary sequences in heart period dynamics. Am. J. Physiol. Heart Circ. Physiol. 2000, 278, H2163–H2172. [Google Scholar] [CrossRef]
- Al-Angari, H.M.; Sahakian, A.V. Use of sample entropy approach to study heart rate variability in obstructive sleep apnea syndrome. IEEE Trans. Biomed. Eng. 2007, 54, 1900–1904. [Google Scholar] [CrossRef]
- Ravelo-García, A.; Navarro-Mesa, J.; Casanova-Blancas, U.; Martin-Gonzalez, S.; Quintana-Morales, P.; Guerra-Moreno, I.; Canino-Rodríguez, J.; Hernández-Pérez, E. Application of the Permutation Entropy over the Heart Rate Variability for the Improvement of Electrocardiogram-based Sleep Breathing Pause Detection. Entropy 2015, 17, 914–927. [Google Scholar] [CrossRef]
- Pan, W.Y.; Su, M.C.; Wu, H.T.; Su, T.J.; Lin, M.C.; Sun, C.K. Multiscale entropic assessment of autonomic dysfunction in patients with obstructive sleep apnea and therapeutic impact of continuous positive airway pressure treatment. Sleep Med. 2016, 20, 12–17. [Google Scholar] [CrossRef] [PubMed]
- Lacasa, L.; Luque, B.; Ballesteros, F.; Luque, J.; Nuño, J.C. From time series to complex networks: The visibility graph. Proc. Natl. Acad. Sci. USA 2008, 105, 4972–4975. [Google Scholar] [CrossRef] [PubMed]
- Hou, F.Z.; Li, F.W.; Wang, J.; Yan, F.R. Visibility graph analysis of very short-term heart rate variability during sleep. Phys. A Stat. Mech. Appl. 2016, 458, 140–145. [Google Scholar] [CrossRef]
- Hou, F.Z.; Wang, J.; Wu, X.C.; Yan, F.R. A dynamic marker of very short-term heartbeat under pathological states via network analysis. EPL 2014, 107, 58001. [Google Scholar] [CrossRef]
- Zhang, G.Q.; Cui, L.; Mueller, R.; Tao, S.; Redline, S. The National Sleep Research Resource: Towards a sleep data commons. J. Am. Med Inform. Assoc. 2018, 25, 1351–1358. [Google Scholar] [CrossRef] [PubMed]
- Redline, S.; Sanders, M.H.; Lind, B.K.; Quan, S.F.; Iber, C.; Gottlieb, D.J.; Bonekat, W.H.; Rapoport, D.M.; Smith, P.L.; Kiley, J.P. Methods for obtaining and analyzing unattended polysomnography data for a multicenter study. Sleep Heart Health Research Group. Sleep 1998, 21, 759–767. [Google Scholar]
- Quan, S.F.; Howard, B.V.; Iber, C.; Kiley, J.P.; Nieto, F.J.; O’Connor, G.T.; Rapoport, D.M.; Redline, S.; Robbins, J.; Samet, J.M.; et al. The Sleep Heart Health Study: Design, rationale, and methods. Sleep 1997, 20, 1077–1085. [Google Scholar]
- Chernick, M.R. Wavelet Methods for Time Series Analysis; Cambridge University Press: Cambridge, UK, 2004. [Google Scholar]
- Percival, D.B.; Mofjeld, H.O. Analysis of subtidal coastal sea level fluctuations using wavelets. Publ. Am. Stat. Assoc. 1997, 92, 868–880. [Google Scholar] [CrossRef]
- Fornito, A.; Zalesky, A.; Breakspear, M. Graph analysis of the human connectome: Promise, progress, and pitfalls. Neuroimage 2013, 80, 426–444. [Google Scholar] [CrossRef]
- Marzbanrad, F.; Jelinek, H.; Ng, E.; Tamayo, M.; Hambly, B.; Mclachlan, C.; Matthews, S.; Palaniswami, M.; Khandoker, A. The effect of automated preprocessing of RR interval tachogram on discrimination capability of Heart Rate Variability parameters. In Proceedings of the 2013 Computing in Cardiology Conference, Zaragoza, Spain, 22–25 September 2013. [Google Scholar]
- Fleisher, L.A.; Fleckenstein, J.F.; Frank, S.M.; Thuluvath, P.J. Heart Rate Variability as a Predictor of Autonomic Dysfunction in Patients Awaiting Liver Transplantation. Dig. Dis. Sci. 2000, 45, 340–344. [Google Scholar] [CrossRef] [PubMed]
- Galland, B.C.; Hayman, R.M.; Taylor, B.J.; Bolton, D.P.; Sayers, R.M.; Williams, S.M. Factors affecting heart rate variability and heart rate responses to tilting in infants aged 1 and 3 months. Pediatric Res. 2000, 48, 360–368. [Google Scholar] [CrossRef] [PubMed]
- Smith, A.L.; Owen, H.; Reynolds, K.J. Heart rate variability indices for very short-term (30 beat) analysis. Part 1: Survey and toolbox. J. Clin. Monit. Comput. 2013, 27, 569–576. [Google Scholar] [CrossRef] [PubMed]
- Malik, M.; Bigger, J.T.; Camm, A.J.; Kleiger, R.E.; Malliani, A.; Moss, A.J.; Schwartz, P.J. Heart rate variabilityStandards of measurement, physiological interpretation, and clinical use. Ann. Noninvasive Electrocardiol. 1996, 93, 1043–1065. [Google Scholar]
- Tsuji, H.; Venditti, F.J.; Manders, E.S.; Evans, J.C.; Larson, M.G.; Feldman, C.L.; Levy, D. Reduced heart rate variability and mortality risk in an elderly cohort. The Framingham Heart Study. Circulation 1994, 90, 878–883. [Google Scholar] [CrossRef] [PubMed]
- Richman, J.S.; Moorman, J.R. Physiological time-series analysis using approximate entropy and sample entropy. Am. J. Physiol. Heart Circ. Physiol. 2000, 278, H2039–H2049. [Google Scholar] [CrossRef] [PubMed]
- Pincus, S.M.; Goldberger, A.L. Physiological Time-Series Analysis: What Does Regularity Quantify? Am. J. Physiol. 1994, 266, 1643–1656. [Google Scholar] [CrossRef]
- Montesinos, L.; Castaldo, R.; Pecchia, L. On the use of approximate entropy and sample entropy with centre of pressure time-series. J. Neuroeng. Rehabil. 2018, 15, 116. [Google Scholar] [CrossRef]
- Lacasa, L.; Just, W. Visibility graphs and symbolic dynamics. Phys. D Nonlinear Phenom. 2017, 374, 35–44. [Google Scholar] [CrossRef]
- La Rovere, M.T.; Pinna, G.D.; Hohnloser, S.H.; Marcus, F.I.; Mortara, A.; Nohara, R.; Bigger, J.T.; Camm, A.J.; Schwartz, P.J. Baroreflex sensitivity and heart rate variability in the identification of patients at risk for life-threatening arrhythmias: Implications for clinical trials. Circulation 2001, 103, 2072–2077. [Google Scholar] [CrossRef]
- Sztajzel, J. Heart rate variability: A noninvasive electrocardiographic method to measure the autonomic nervous system. Swiss Med. Wkly. 2004, 134, 514–522. [Google Scholar] [PubMed]
- Lahiri, M.K.; Kannankeril, P.J.; Goldberger, J.J. Assessment of Autonomic Function in Cardiovascular Disease: Physiological Basis and Prognostic Implications. J. Am. Coll. Cardiol. 2008, 51, 1725–1733. [Google Scholar] [CrossRef] [PubMed]
- Malliani, A.; Lombardi, F.; Pagani, M. Power spectrum analysis of heart rate variability: A tool to explore neural regulatory mechanisms. Br. Heart J. 1994, 71, 1. [Google Scholar] [CrossRef] [PubMed]
- Yoo Suk, K.; Sung Yul, K.; Do Yang, P.; Hee Won, W.; Gyo-Seung, H.; Hyun Jun, K. Clinical Implication of Heart Rate Variability in Obstructive Sleep Apnea Syndrome Patients. J. Craniofac. Surg. 2015, 26, 1592–1595. [Google Scholar]
- Goldberger, A.L. Is the normal heartbeat chaotic or homeostatic? News Physiol. Sci. 1991, 6, 87–91. [Google Scholar] [CrossRef] [PubMed]
- Lipsitz, L.A.; Goldberger, A.L. Loss of ‘complexity’ and aging. Potential applications of fractals and chaos theory to senescence. JAMA 1992, 267, 1806–1809. [Google Scholar] [CrossRef] [PubMed]
- Manor, B.; Lipsitz, L.A. Physiologic complexity and aging: Implications for physical function and rehabilitation. Prog. Neuropsychopharmacol. Biol. Psychiatry 2013, 45, 287–293. [Google Scholar] [CrossRef] [PubMed]
- Xie, H.B.; Chen, W.T.; He, W.X.; Liu, H. Complexity analysis of the biomedical signal using fuzzy entropy measurement. Appl. Soft Comput. 2011, 11, 2871–2879. [Google Scholar] [CrossRef]
- Alcaraz, R.; Rieta, J.J. A review on sample entropy applications for the non-invasive analysis of atrial fibrillation electrocardiograms. Biomed. Signal Process. Control 2010, 5, 1–14. [Google Scholar] [CrossRef]
- Myung-Kul, Y.; Ki-Young, J.; Hoon-Chul, K.; Heung Dong, K.; Young-Min, S.; Joong-Ku, K.; Il Keun, L.; Ki-Jong, P.; Oh-Young, K. Effect of a ketogenic diet on EEG: Analysis of sample entropy. Seizure J. Br. Epilepsy Assoc. 2008, 17, 561–566. [Google Scholar]
- Singh, J.P.; Larson, M.G.; Tsuji, H.; Evans, J.C.; O’Donnell, C.J.; Levy, D. Reduced heart rate variability and new-onset hypertension: Insights into pathogenesis of hypertension: The Framingham Heart Study. Hypertension 1998, 32, 293–297. [Google Scholar] [CrossRef] [PubMed]
- Ivanov, P.C.; Zhi, C.; Hu, K.; Stanley, H.E. Multiscale aspects of cardiac control. Phys. A Stat. Mech. Its Appl. 2004, 344, 685–704. [Google Scholar] [CrossRef][Green Version]
- Babloyantz, A.; Destexhe, A. Is the normal heart a periodic oscillator? Biol. Cybern. 1988, 58, 203–211. [Google Scholar] [CrossRef] [PubMed]


© 2019 by the authors. Licensee MDPI, Basel, Switzerland. This article is an open access article distributed under the terms and conditions of the Creative Commons Attribution (CC BY) license (http://creativecommons.org/licenses/by/4.0/).