Effects of Mo, Nb, Ta, Ti, and Zr on Mechanical Properties of Equiatomic Hf-Mo-Nb-Ta-Ti-Zr Alloys

 ,
,  and
and
Abstract
1. Introduction
2. Materials and Methods
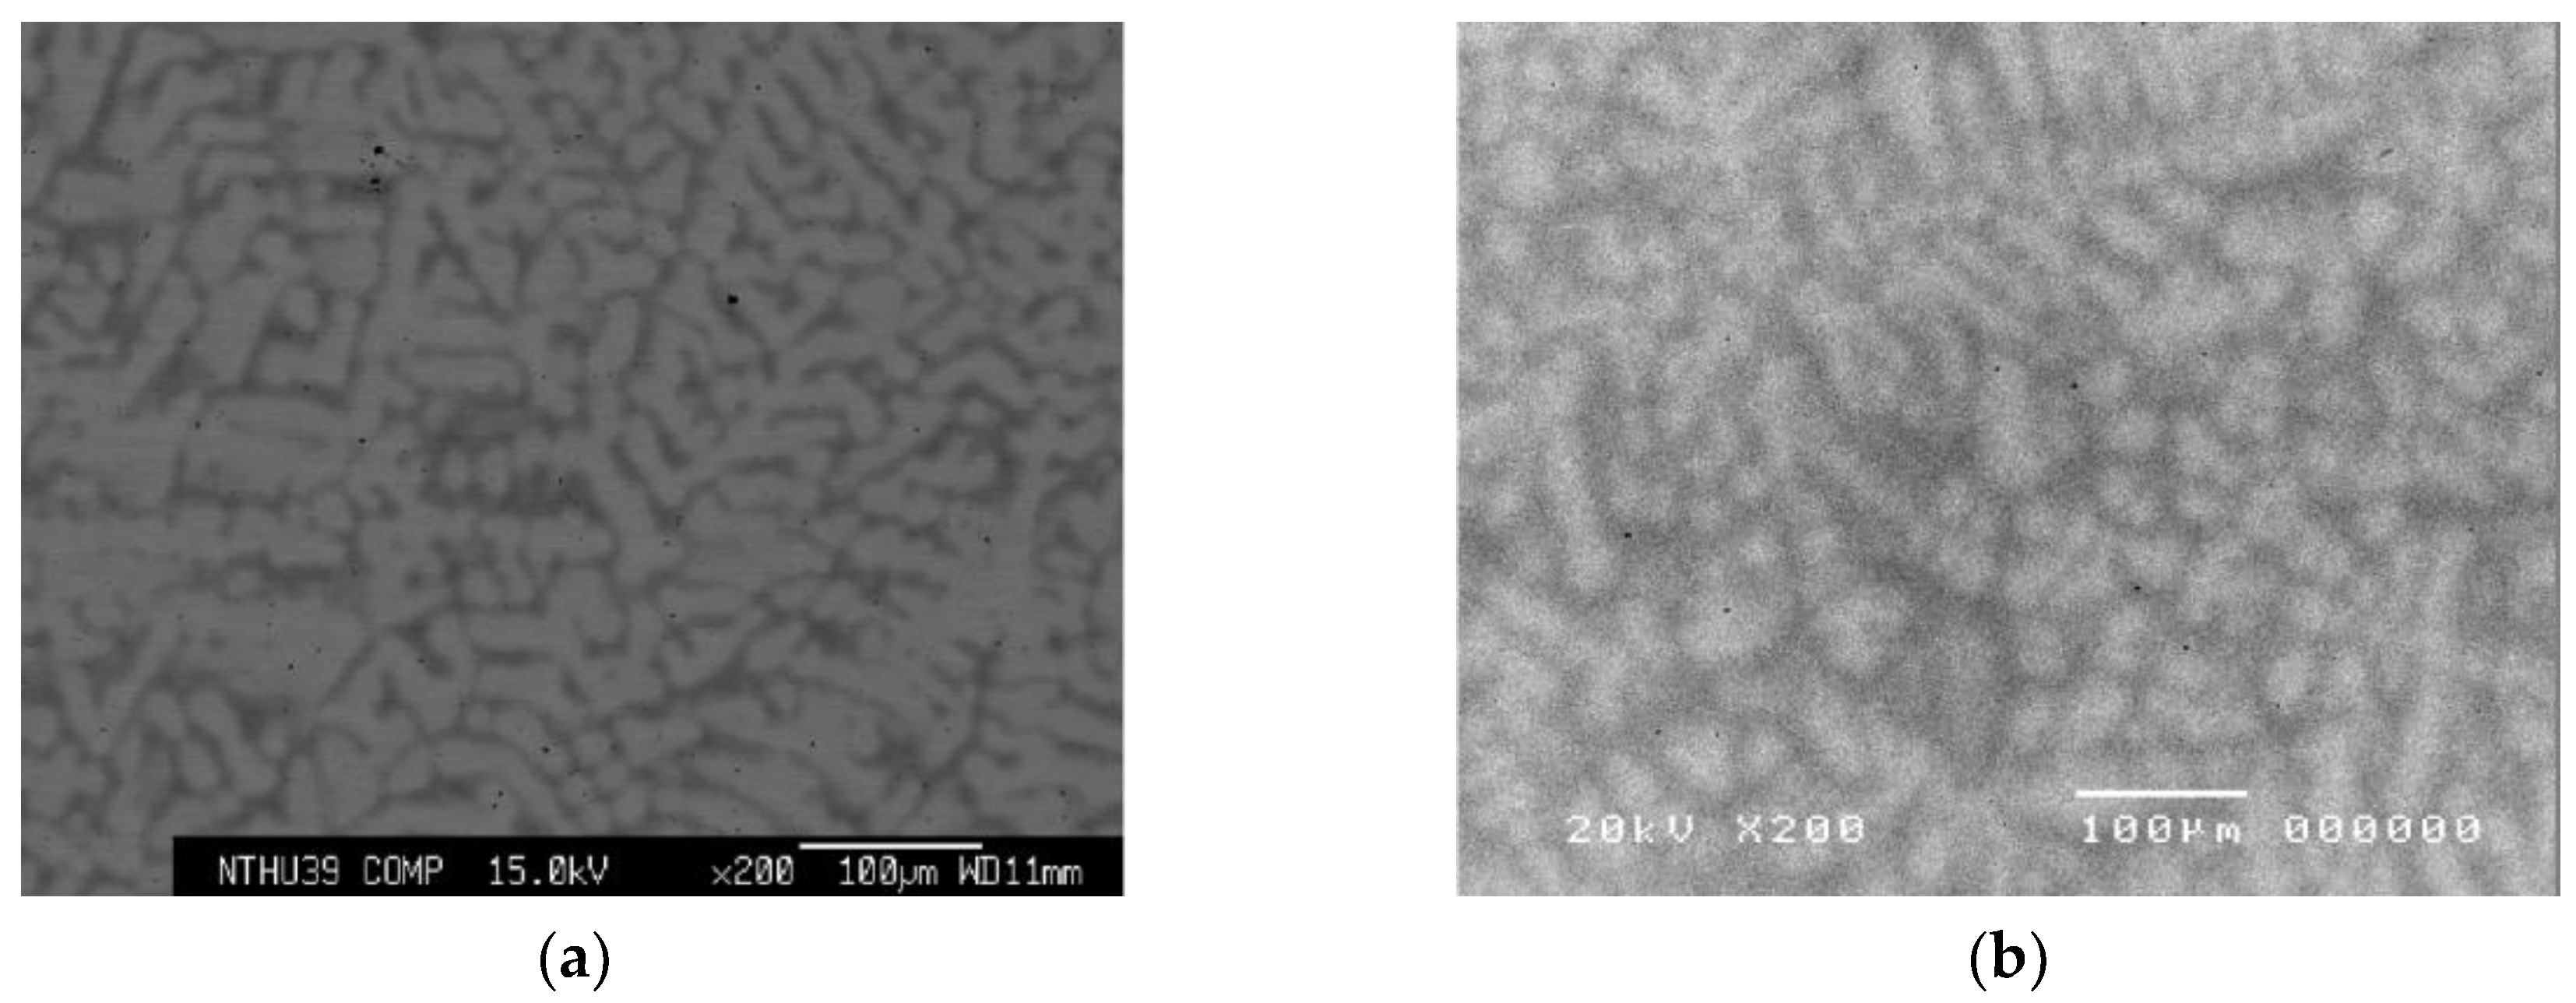
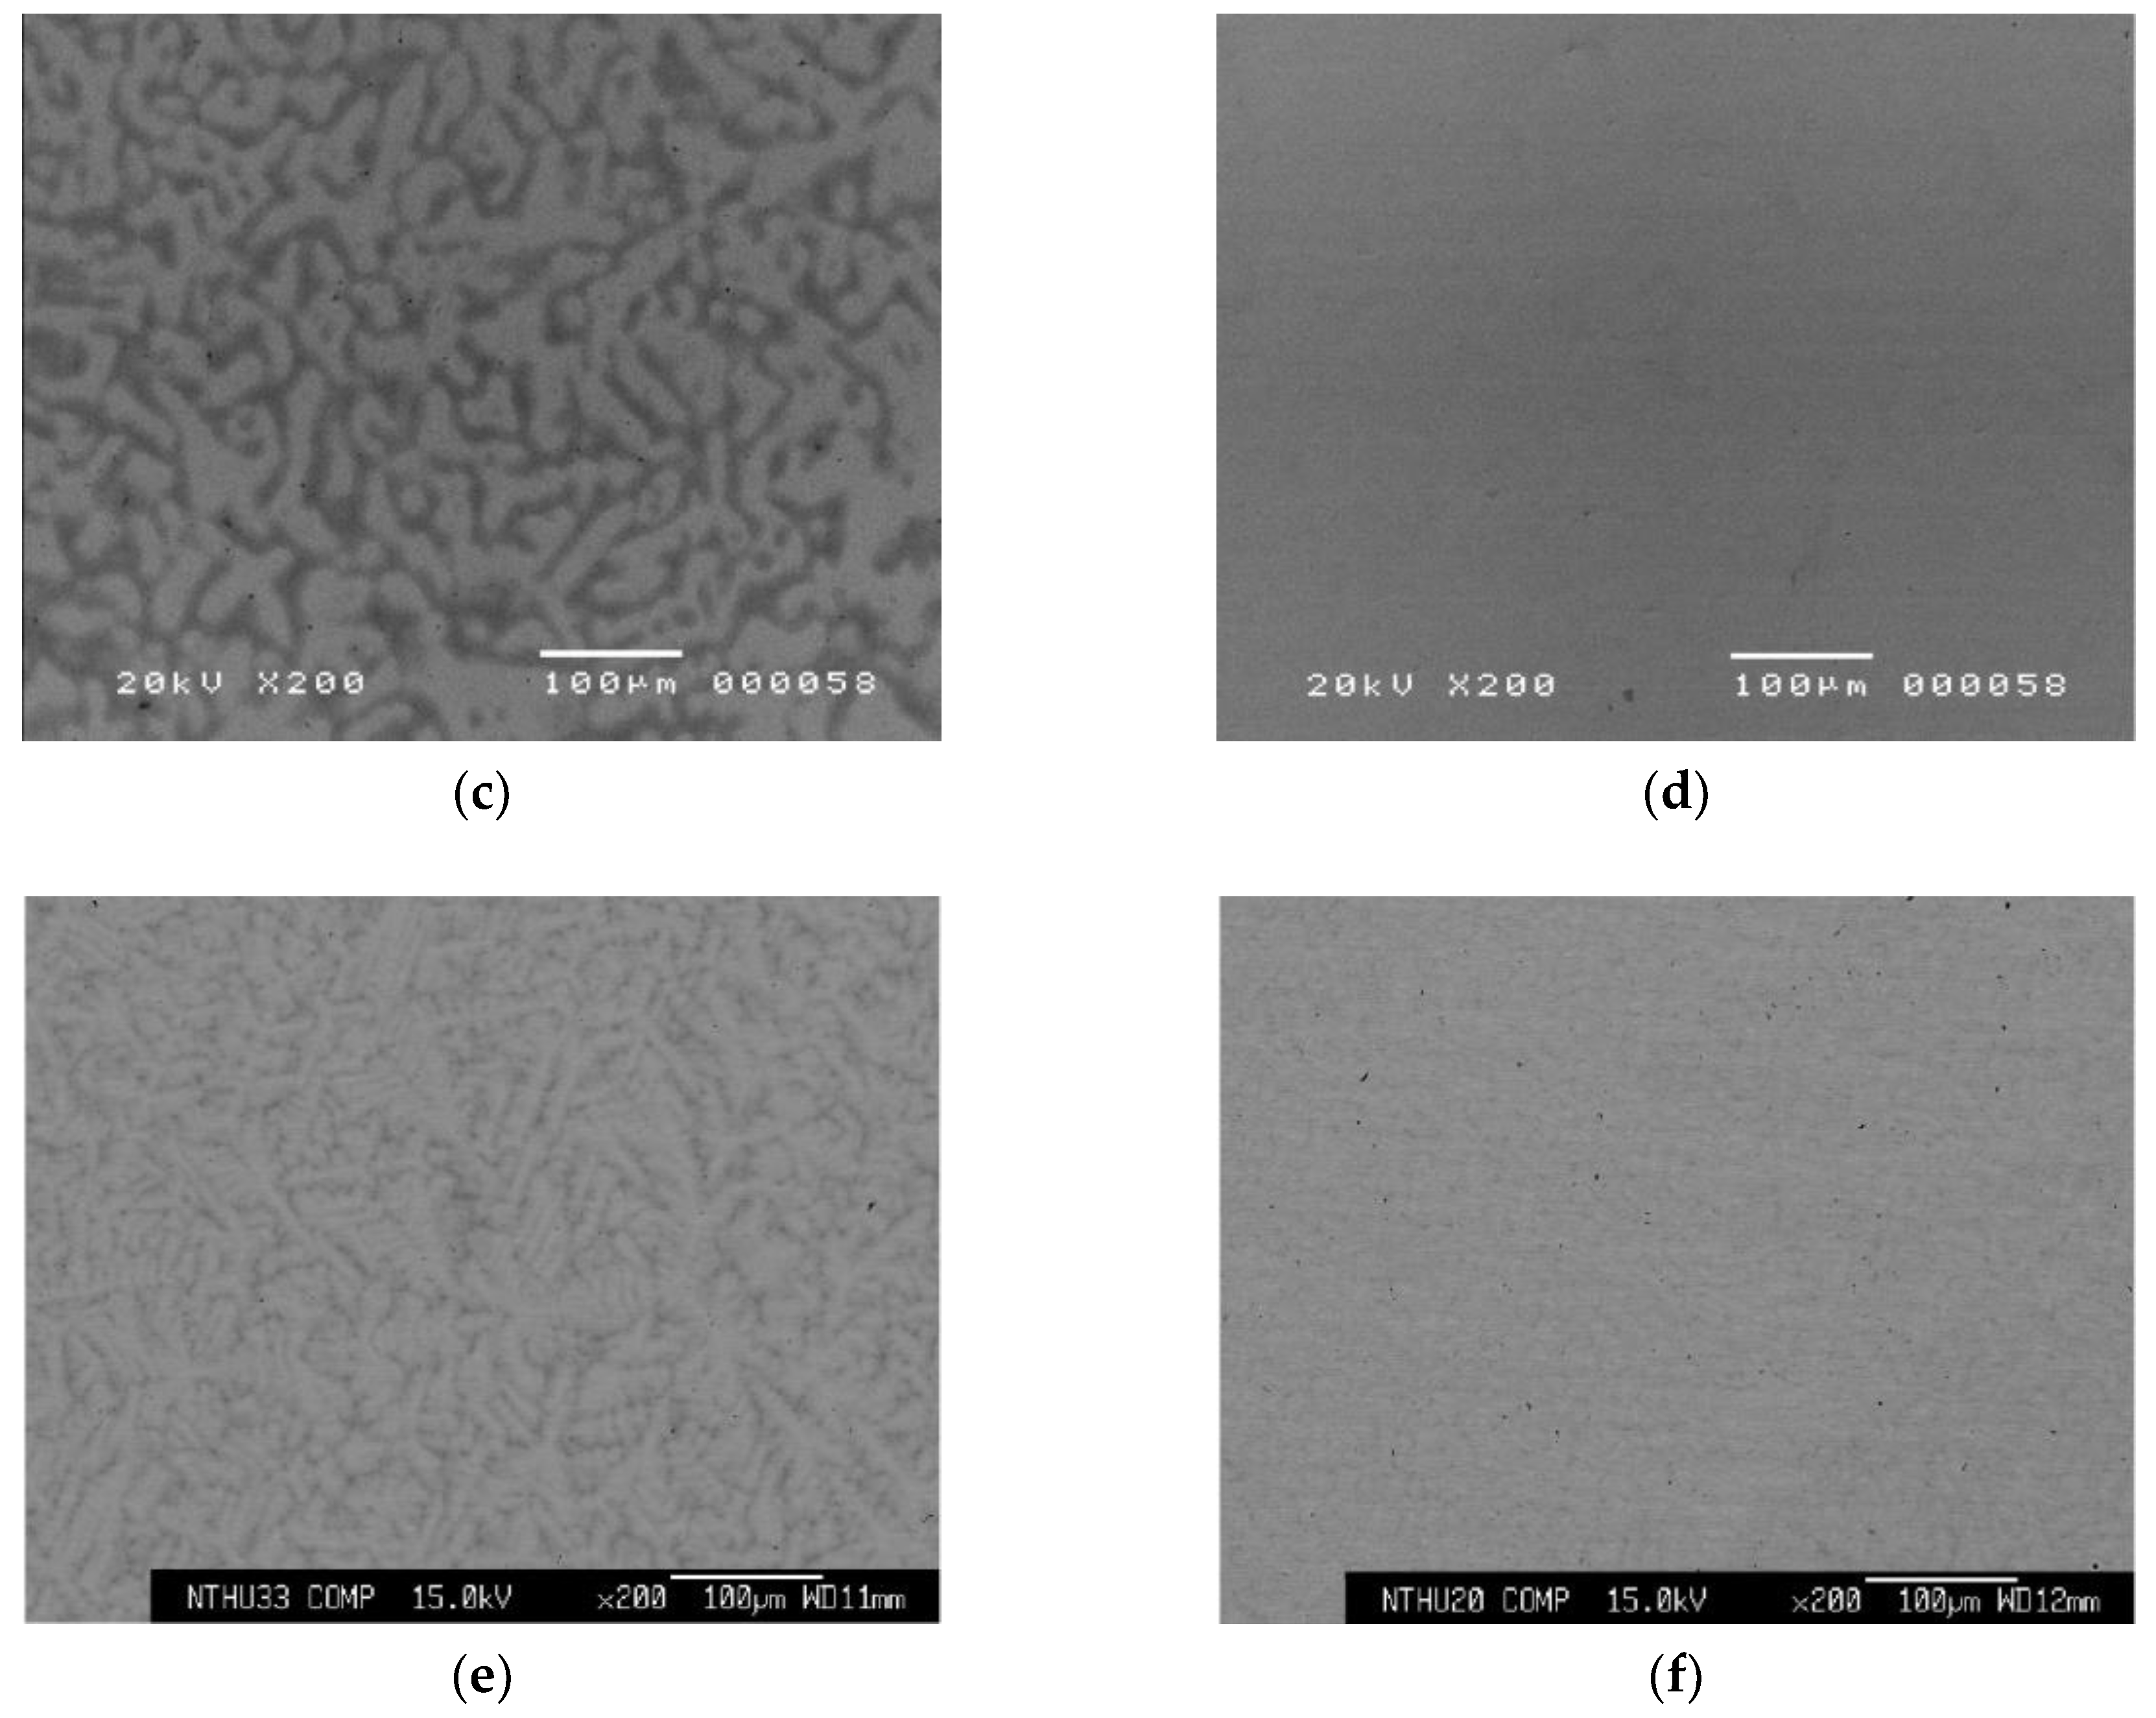
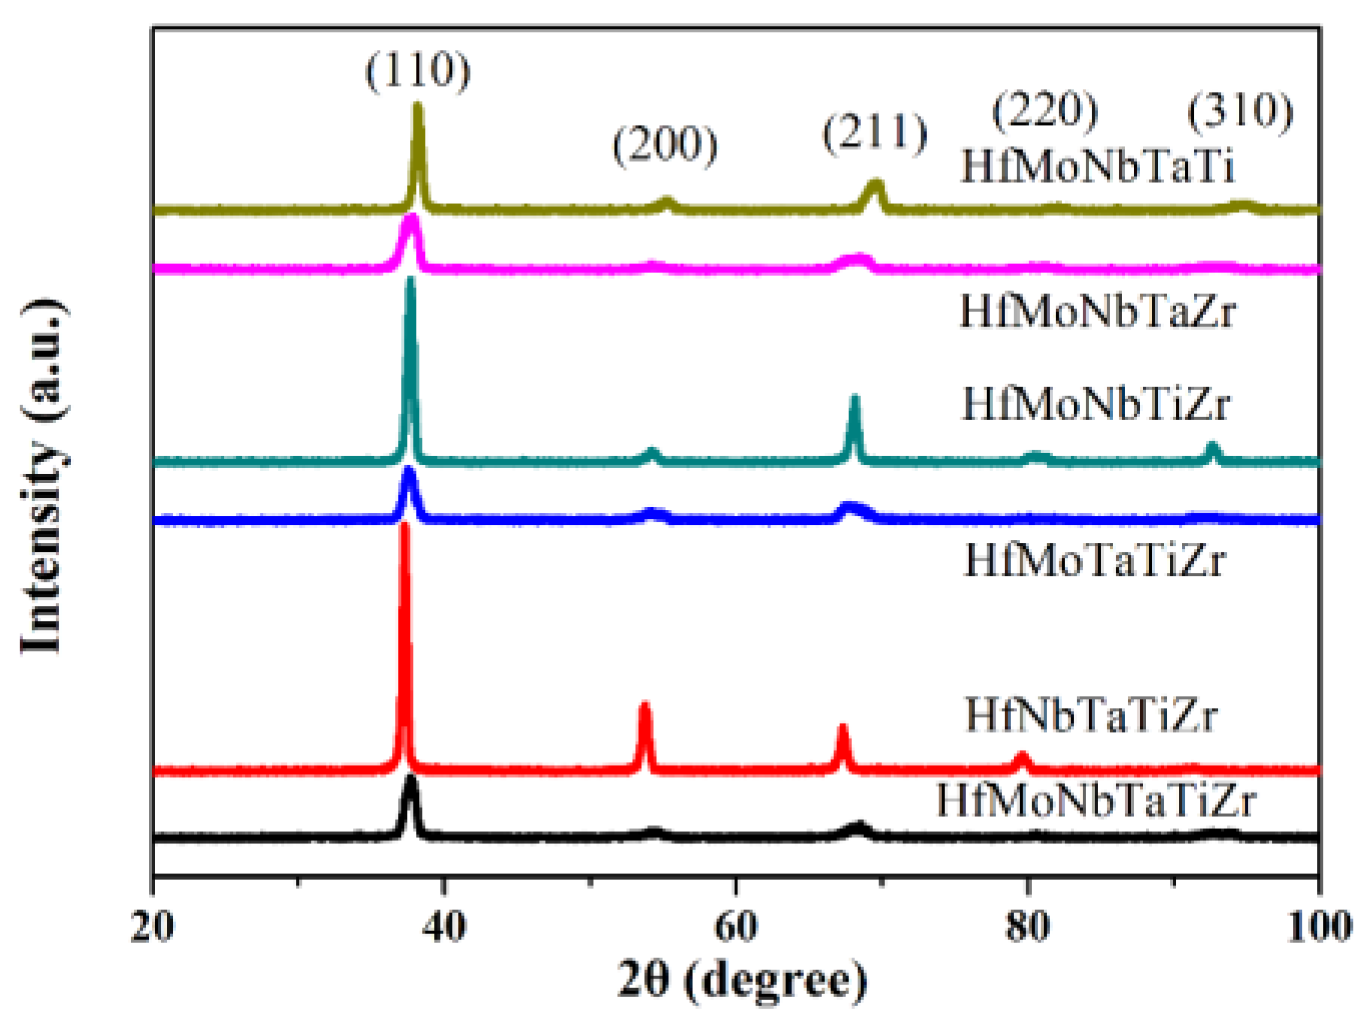
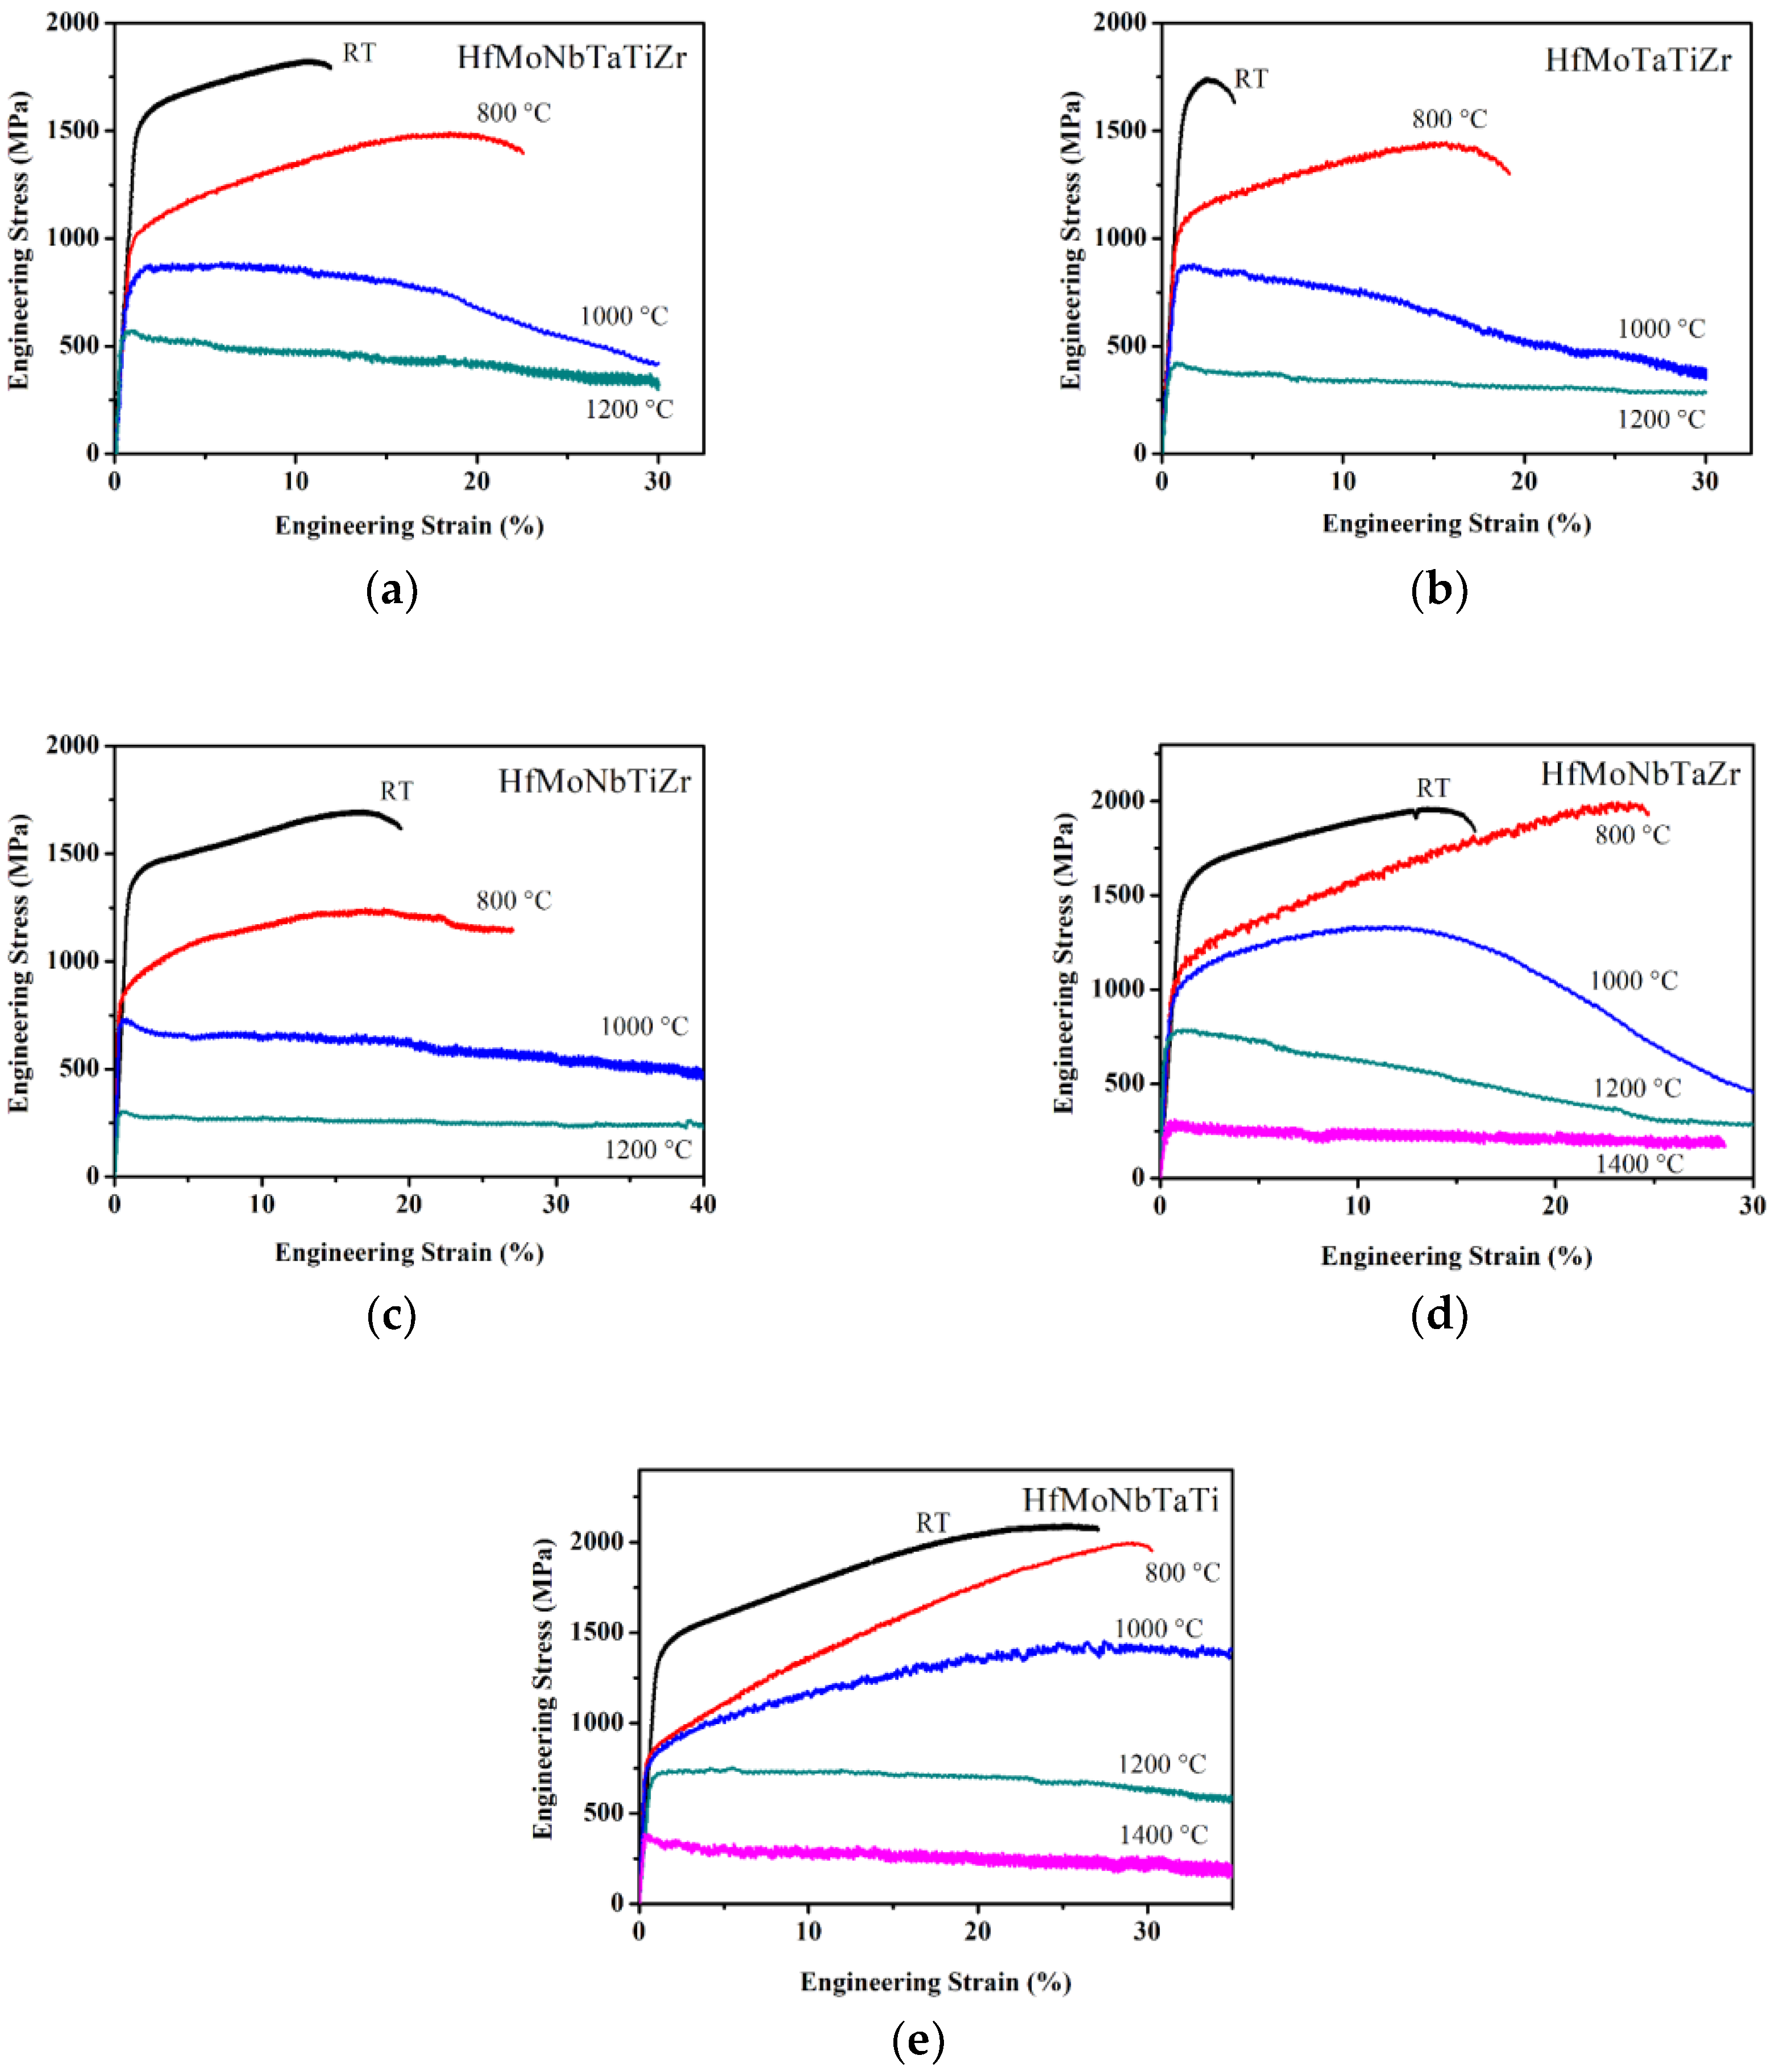
3. Results
4. Discussion
4.1. Phase Formation Rule
4.2. Solution Hardening Mechanism
5. Conclusions
Author Contributions
Funding
Acknowledgments
Conflicts of Interest
References
- International, A.S.M.; Handbook, C. Properties and Selection: Nonferrous Alloys and Special-Purpose Materials, ASM Handbook, 10th ed.; ASM International: Materials Park, OH, USA, 1990; Volume 2. [Google Scholar]
- Smith, W.F. Structure and Properties of Engineering Alloys, 2nd ed.; McGraw-Hill: New York, NY, USA, 1993; 630p. [Google Scholar]
- Reed, R.C. The Superalloys: Fundamentals and Applications; Cambridge University Press: Cambridge, UK, 2006. [Google Scholar] [CrossRef]
- Kawagishi, K.; Yeh, A.C.; Yokokawa, T.; Kobayashi, T.; Koizumi, Y.; Harada, H. Development of an Oxidation-Resistant High-Strength Sixth-Generation Single-Crystal Superalloy TMS-238. Superalloys 2012. [Google Scholar] [CrossRef]
- Satya Prasad, V.V.; Baligidad, R.G.; Gokhale, A.A. Niobium and Other High Temperature Refractory Metals for Aerospace Applications. In Aerospace Materials and Material Technologies: Volume 1: Aerospace Materials; Prasad, N.E., Wanhill, R.J.H., Eds.; Springer: Singapore, 2017; pp. 267–288. [Google Scholar]
- Yeh, J.W.; Chen, S.K.; Lin, S.J.; Gan, J.Y.; Chin, T.S.; Shun, T.T.; Tsau, C.H.; Chang, S.Y. Nanostructured high-entropy alloys with multiple principal elements: Novel alloy design concepts and outcomes. Adv. Eng. Mater. 2004, 6, 299–303. [Google Scholar] [CrossRef]
- Yeh, J.W. Recent progress in high-entropy alloys. Annales de Chimie Science des Matériaux 2006, 31, 633–648. [Google Scholar] [CrossRef]
- Miracle, D.B.; Senkov, O.N. A critical review of high entropy alloys and related concepts. Acta Mater. 2017, 122, 448–511. [Google Scholar] [CrossRef]
- Cheng, C.Y.; Yang, Y.C.; Zhong, Y.Z.; Chen, Y.Y.; Hsu, T.; Yeh, J.W. Physical metallurgy of concentrated solid solutions from low-entropy to high-entropy alloys. Curr. Opin. Solid State Mater. 2017, 21, 299–311. [Google Scholar] [CrossRef]
- Yeh, J.W. Alloy Design Strategies and Future Trends in High-Entropy Alloys. JOM 2013, 65, 1759–1771. [Google Scholar] [CrossRef]
- Gao, M.C.; Yeh, J.W.; Liaw, P.K.; Zhang, Y. High-Entropy Alloys: Fundamentals and Applications, 1st ed.; Springer International Publishing: Cham, Switzerland, 2016. [Google Scholar]
- Murty, B.S.; Yeh, J.W.; Ranganathan, S. High Entropy Alloys; Butterworth-Heinemann: Boston, MA, USA, 2014. [Google Scholar]
- Tsai, K.Y.; Tsai, M.H.; Yeh, J.W. Sluggish diffusion in Co–Cr–Fe–Mn–Ni high-entropy alloys. Acta Mater. 2013, 61, 4887–4897. [Google Scholar] [CrossRef]
- Shen, W.J.; Tsai, M.H.; Tsai, K.Y.; Juan, C.C.; Tsai, C.W.; Yeh, J.W.; Chang, Y.S. Superior Oxidation Resistance of (Al0.34Cr0.22Nb0.11Si0.11Ti0.22)50N50 High-Entropy Nitride. J. Electrochem. Soc. 2013, 160, C531–C535. [Google Scholar] [CrossRef]
- Shi, Y.; Yang, B.; Liaw, P. Corrosion-Resistant High-Entropy Alloys: A Review. Metals 2017, 7, 43. [Google Scholar] [CrossRef]
- Chen, P.; Lee, C.; Wang, S.Y.; Seifi, M.; Lewandowski, J.J.; Dahmen, K.A.; Jia, H.; Xie, X.; Chen, B.; Yeh, J.W.; et al. Fatigue behavior of high-entropy alloys: A review. Sci. China Technol. Sci. 2017, 61, 168–178. [Google Scholar] [CrossRef]
- Tsao, T.K.; Yeh, A.C.; Kuo, C.M.; Kakehi, K.; Murakami, H.; Yeh, J.W.; Jian, S.R. The High Temperature Tensile and Creep Behaviors of High Entropy Superalloy. Sci. Rep. 2017, 7, 12658. [Google Scholar] [CrossRef] [PubMed]
- Gludovatz, B.; Hohenwarter, A.; Catoor, D.; Chang, E.H.; George, E.P.; Ritchie, R.O. A fracture-resistant high-entropy alloy for cryogenic applications. Science 2014, 345, 1153–1158. [Google Scholar] [CrossRef] [PubMed]
- Senkov, O.N.; Miracle, D.B.; Chaput, K.J.; Couzinie, J.-P. Development and exploration of refractory high entropy alloys—A review. J. Mater. Res. 2018, 1–37. [Google Scholar] [CrossRef]
- Yeh, A.C.; Tsao, T.K.; Chang, Y.J.; Chang, K.C.; Yeh, J.W.; Chiou, M.S.; Jian, S.R.; Kuo, C.M.; Wang, W.R.; Murakami, H. Developing New Type of High Temperature Alloys–High Entropy Superalloys. Int. J.Metall. Mater. Eng. 2015, 1. [Google Scholar] [CrossRef]
- Lu, Y.; Dong, Y.; Guo, S.; Jiang, L.; Kang, H.; Wang, T.; Wen, B.; Wang, Z.; Jie, J.; Cao, Z.; et al. A promising new class of high-temperature alloys: Eutectic high-entropy alloys. Sci. Rep. 2014, 4, 6200. [Google Scholar] [CrossRef] [PubMed]
- Kumar, A.; Gupta, M. An Insight into Evolution of Light Weight High Entropy Alloys: A Review. Metals 2016, 6, 199. [Google Scholar] [CrossRef]
- Senkov, O.N.; Wilks, G.B.; Miracle, D.B.; Chuang, C.P.; Liaw, P.K. Refractory high-entropy alloys. Intermetallics 2010, 18, 1758–1765. [Google Scholar] [CrossRef]
- Senkov, O.N.; Wilks, G.B.; Scott, J.M.; Miracle, D.B. Mechanical properties of Nb25Mo25Ta25W25 and V20Nb20Mo20Ta20W20 refractory high entropy alloys. Intermetallics 2011, 19, 698–706. [Google Scholar] [CrossRef]
- Senkov, O.N.; Scott, J.M.; Senkova, S.V.; Miracle, D.B.; Woodward, C.F. Microstructure and room temperature properties of a high-entropy TaNbHfZrTi alloy. J. Alloys Compd. 2011, 509, 6043–6048. [Google Scholar] [CrossRef]
- Senkov, O.N.; Scott, J.M.; Senkova, S.V.; Meisenkothen, F.; Miracle, D.B.; Woodward, C.F. Microstructure and elevated temperature properties of a refractory TaNbHfZrTi alloy. J. Mater. Sci. 2012, 47, 4062–4074. [Google Scholar] [CrossRef]
- Yurchenko, N.; Stepanov, N.; Tikhonovsky, M.; Salishchev, G. Phase Evolution of the AlxNbTiVZr (x = 0; 0.5; 1; 1.5) High Entropy Alloys. Metals 2016, 6, 298. [Google Scholar] [CrossRef]
- Lin, C.M.; Juan, C.C.; Chang, C.H.; Tsai, C.W.; Yeh, J.W. Effect of Al addition on mechanical properties and microstructure of refractory AlxHfNbTaTiZr alloys. J. Alloys Compd. 2015, 624, 100–107. [Google Scholar] [CrossRef]
- Juan, C.C.; Tseng, K.K.; Hsu, W.L.; Tsai, M.H.; Tsai, C.W.; Lin, C.M.; Chen, S.K.; Lin, S.J.; Yeh, J.W. Solution strengthening of ductile refractory HfMoxNbTaTiZr high-entropy alloys. Mater. Lett. 2016, 175, 284–287. [Google Scholar] [CrossRef]
- Waseem, O.A.; Lee, J.; Lee, H.M.; Ryu, H.J. The effect of Ti on the sintering and mechanical properties of refractory high-entropy alloy TixWTaVCr fabricated via spark plasma sintering for fusion plasma-facing materials. Mater. Chem. Phys. 2017. [Google Scholar] [CrossRef]
- Wu, Y.D.; Cai, Y.H.; Chen, X.H.; Wang, T.; Si, J.J.; Wang, L.; Wang, Y.D.; Hui, X.D. Phase composition and solid solution strengthening effect in TiZrNbMoV high-entropy alloys. Mater. Des. 2015, 83, 651–660. [Google Scholar] [CrossRef]
- Yurchenko, N.Y.; Stepanov, N.D.; Zherebtsov, S.V.; Tikhonovsky, M.A.; Salishchev, G.A. Structure and mechanical properties of B2 ordered refractory AlNbTiVZrx (x = 0–1.5) high-entropy alloys. Mater. Sci. Eng. A 2017, 704, 82–90. [Google Scholar] [CrossRef]
- Zhang, Y.; Zhou, Y.J.; Lin, J.P.; Chen, G.L.; Liaw, P.K. Solid-Solution Phase Formation Rules for Multi-Component Alloys. Adv. Eng. Mater. 2008, 10, 534–538. [Google Scholar] [CrossRef]
- Yang, X.; Zhang, Y. Prediction of high-entropy stabilized solid-solution in multi-component alloys. Mater. Chem. Phys. 2012, 132, 233–238. [Google Scholar] [CrossRef]
- Boer, F.R.d. Cohesion in Metals: Transition Metal Alloys; North-Holland: Amsterdam, The Netherlands, 1988; 758p. [Google Scholar]
- Takeuchi, A.; Inoue, A. Classification of bulk metallic glasses by atomic size difference, heat of mixing and period of constituent elements and its application to characterization of the main alloying element. Mater. Trans. 2005, 46, 2817–2829. [Google Scholar] [CrossRef]
- Guo, S.; Ng, C.; Lu, J.; Liu, C.T. Effect of valence electron concentration on stability of fcc or bcc phase in high entropy alloys. J. Appl. Phys. 2011, 109, 103505. [Google Scholar] [CrossRef]
- Poletti, M.G.; Battezzati, L. Electronic and thermodynamic criteria for the occurrence of high entropy alloys in metallic systems. Acta Mater. 2014, 75, 297–306. [Google Scholar] [CrossRef]
- Guo, S.; Liu, C.T. Phase stability in high entropy alloys: Formation of solid-solution phase or amorphous phase. Prog. Nat. Sci: Mater. Int. 2011, 21, 433–446. [Google Scholar] [CrossRef]
- Mann, J.B.; Meek, T.L.; Knight, E.T.; Capitani, J.F.; Allen, L.C. Configuration Energies of the d-Block Elements. J. Am. Chem. Soc. 2000, 122, 5132–5137. [Google Scholar] [CrossRef]
- Yurchenko, N.; Stepanov, N.; Salishchev, G. Laves-phase formation criterion for high-entropy alloys. Mater. Sci. Technol. 2016, 33, 17–22. [Google Scholar] [CrossRef]
- Yao, H.W.; Qiao, J.W.; Hawk, J.A.; Zhou, H.F.; Chen, M.W.; Gao, M.C. Mechanical properties of refractory high-entropy alloys: Experiments and modeling. J. Alloy. Compd. 2017, 696, 1139–1150. [Google Scholar] [CrossRef]
- Juan, C.C.; Tsai, M.H.; Tsai, C.W.; Hsu, W.L.; Lin, C.M.; Chen, S.K.; Lin, S.J.; Yeh, J.W. Simultaneously increasing the strength and ductility of a refractory high-entropy alloy via grain refining. Mater. Lett. 2016, 184, 200–203. [Google Scholar] [CrossRef]


| Element | Hf | Mo | Nb | Ta | Ti | Zr | |
|---|---|---|---|---|---|---|---|
| HfMoNbTaTiZr | Nominal | 16.7 | 16.7 | 16.7 | 16.7 | 16.7 | 16.7 |
| DR | 14.3 | 18.4 | 19.5 | 24.4 | 12.4 | 10.8 | |
| ID | 21.1 | 13.6 | 12.3 | 9.9 | 18.3 | 24.7 | |
| HfNbTaTiZr | Nominal | 20.0 | - | 20.0 | 20.0 | 20.0 | 20.0 |
| DR | 18.5 | - | 22.4 | 27.4 | 18.2 | 13.5 | |
| ID | 22.6 | - | 17.5 | 12.8 | 20.2 | 26.9 | |
| HfMoTaTiZr | Nominal | 20.0 | 20.0 | - | 20.0 | 20.0 | 20.0 |
| DR | 20.6 | 21.4 | - | 23.9 | 18.3 | 15.7 | |
| ID | 24.4 | 16.2 | - | 11.0 | 21.2 | 27.1 | |
| HfMoNbTiZr | Nominal | 20.0 | 20.0 | 20.0 | - | 20.0 | 20.0 |
| Overall | 20.8 | 20.6 | 19.7 | - | 19.2 | 19.7 | |
| HfMoNbTaZr | Nominal | 20.0 | 20.0 | 20.0 | 20.0 | - | 20.0 |
| DR | 18.5 | 20.8 | 21.7 | 24.5 | - | 14.5 | |
| ID | 27.0 | 15.6 | 13.5 | 9.9 | - | 34.0 | |
| HfMoNbTaTi | Nominal | 20.0 | 20.0 | 20.0 | 20.0 | 20.0 | - |
| DR | 15.5 | 22.7 | 19.5 | 25.7 | 16.6 | - | |
| ID | 30.7 | 16.9 | 17.6 | 10.7 | 24.1 | - |
| HfMoNb TaTiZr | HfNbTa TiZr | HfMoTa TiZr | HfMoNb TiZr | HfMoNb TaZr | HfMoNb TaTi | |
|---|---|---|---|---|---|---|
| Cal. | 3.361 | 3.404 | 3.373 | 3.373 | 3.378 | 3.317 |
| Exp. | 3.345 | 3.400 | 3.364 | 3.369 | 3.347 | 3.305 |
| HfMoNb TaTiZr | HfNbTa TiZr [25] | HfMoTa TiZr | HfMoNb TiZr | HfMoNb TaZr | HfMoNb TaTi | |
|---|---|---|---|---|---|---|
| Yield strength (MPa) | 1512 | 929 | 1600 | 1351 | 1524 | 1369 |
| Fracture strain (%) | 12 | > 50 | 4 | 20 | 16 | 27 |
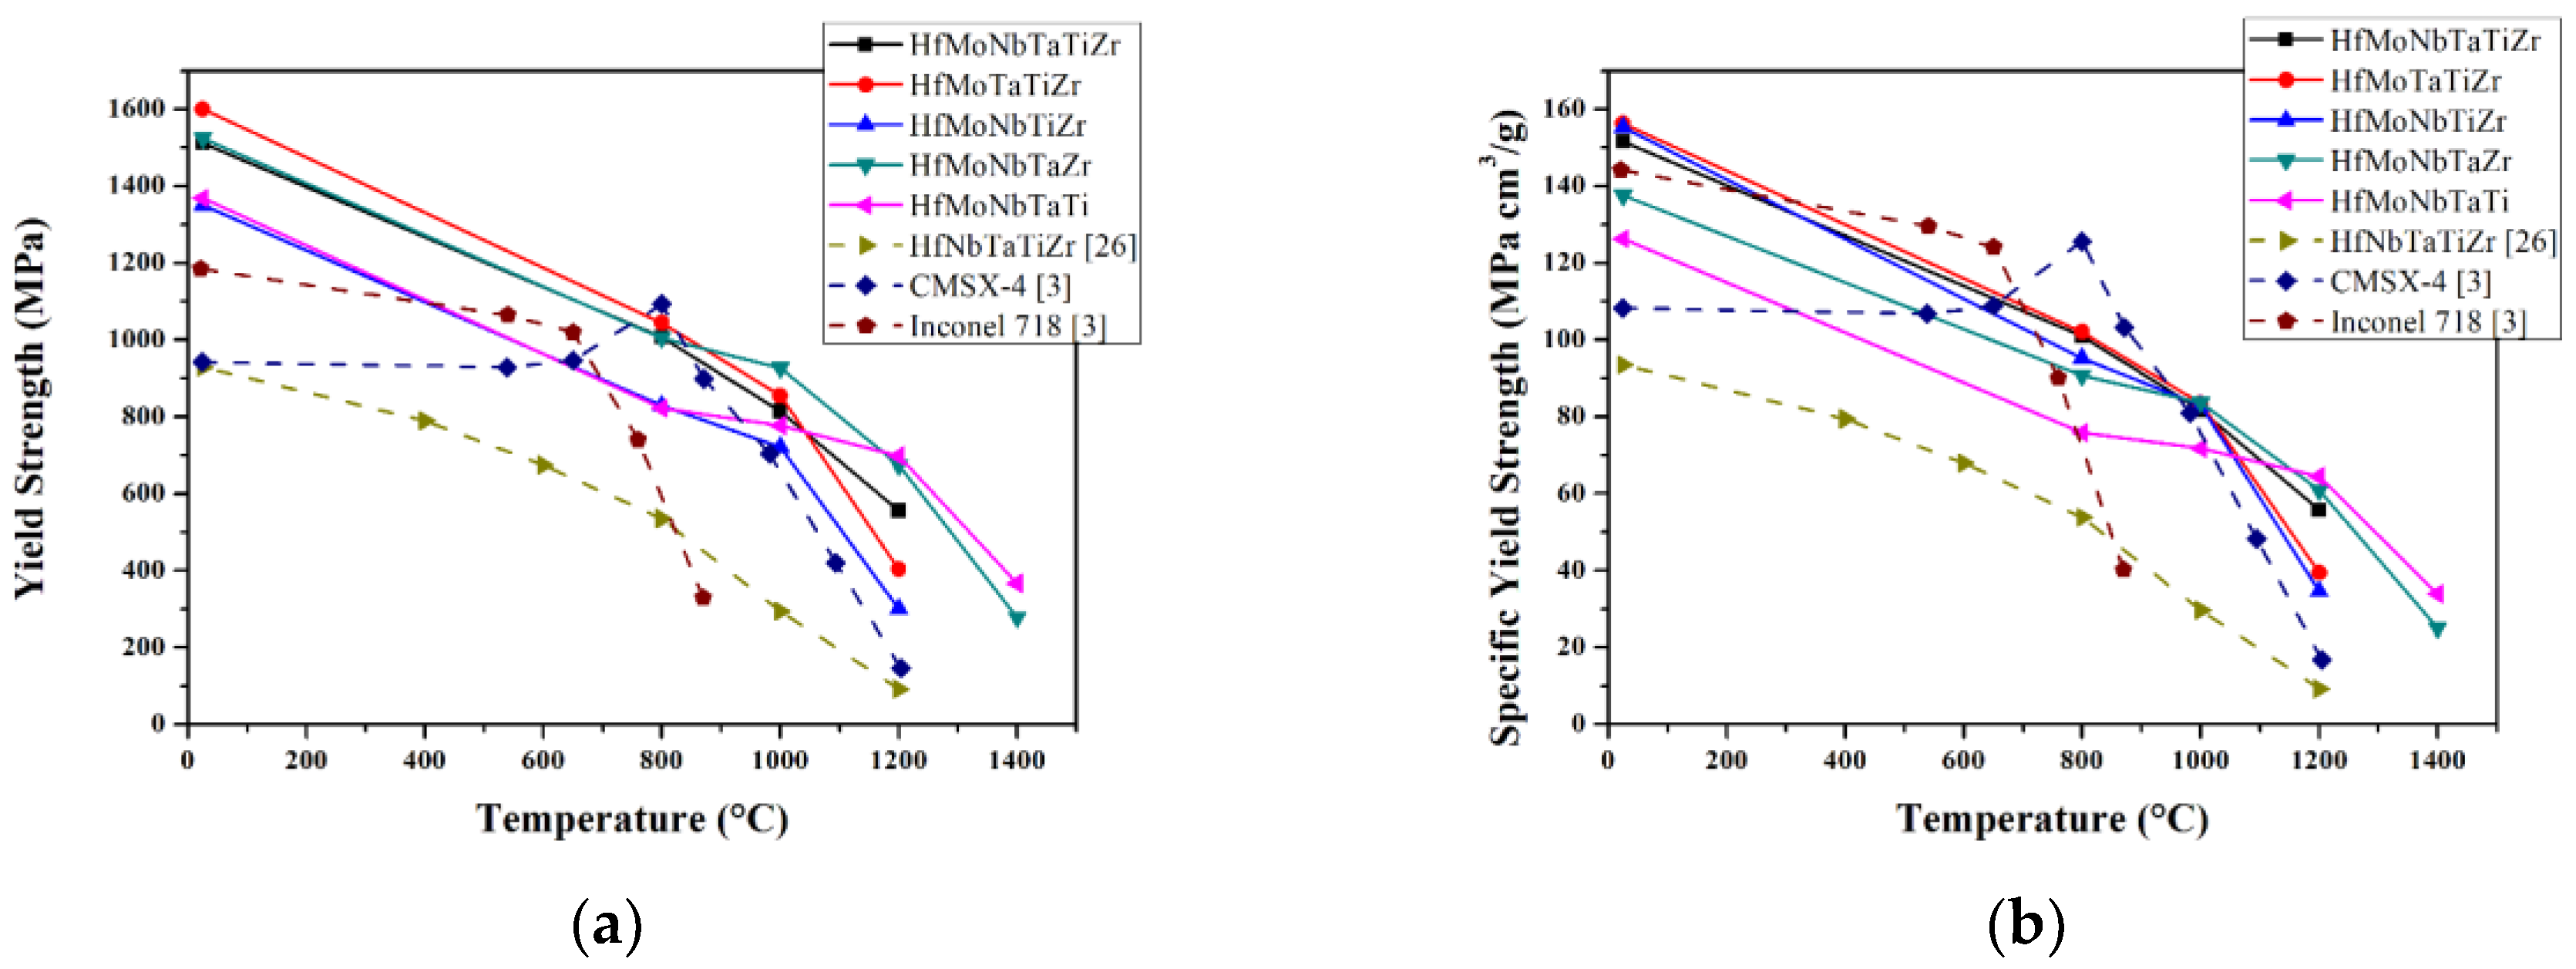
| Temperature (°C) | HfMoNb TaTiZr | HfNbTa TiZr [25] | HfMoTa TiZr | HfMoNb TiZr | HfMoNb TaZr | HfMoNb TaTi |
|---|---|---|---|---|---|---|
| 800 | 1007 | 535 | 1045 | 829 | 1005 | 822 |
| 1000 | 814 | 295 | 855 | 721 | 927 | 778 |
| 1200 | 556 | 92 | 404 | 301 | 694 | 699 |
| 1400 | N. A. | N. A. | N. A. | N. A. | 278 | 367 |
| ∆Hij (kJ/mol) | Hf | Mo | Nb | Ta | Ti | Zr |
|---|---|---|---|---|---|---|
| Hf | - | −4 | 4 | 3 | 0 | 0 |
| Mo | −4 | - | −6 | −5 | −4 | −6 |
| Nb | 4 | −6 | - | 0 | 2 | 4 |
| Ta | 3 | −5 | 0 | - | 1 | 3 |
| Ti | 0 | −4 | 2 | 1 | - | 0 |
| Zr | 0 | −6 | 4 | 3 | 0 | - |
| ri (nm) | 0.159 (HCP) 0.155 (BCC) | 0.136 | 0.143 | 0.143 | 0.147 (HCP) 0.142 (BCC) | 0.162 (HCP) 0.157 (BCC) |
| Tm,i (K) | 2506 | 2896 | 2750 | 3290 | 1941 | 2128 |
| 1.16 | 1.47 | 1.41 | 1.34 | 1.38 | 1.32 | |
| VECi | 4 | 6 | 5 | 5 | 4 | 4 |
| G (GPa) | 30 | 120 | 38 | 69 | 44 | 33 |
| HfMoNb TaTiZr | HfNbTa TiZr | HfMoTa TiZr | HfMoNb TiZr | HfMoNb TaZr | HfMoNb TaTi | |
|---|---|---|---|---|---|---|
| ∆Hmix (kJ) | −0.9 | 2.7 | −1.9 | −1.6 | −1.1 | −1.4 |
| ∆Smix (J) | 14.9 | 13.4 | 13.4 | 13.4 | 13.4 | 13.4 |
| Tm (K) | 2585.2 | 2523.0 | 2552.2 | 2444.2 | 2714.0 | 2676.6 |
| Ω | 43.3 | 12.4 | 17.8 | 20.4 | 32.4 | 24.9 |
| δ | 6.3% | 5.5% | 6.7% | 6.7% | 6.9% | 5.4% |
| VEC | 4.7 | 4.4 | 4.6 | 4.6 | 4.8 | 4.8 |
| ΔχAllen | 7.2% | 6.6% | 7.6% | 7.8% | 7.8% | 7.8% |
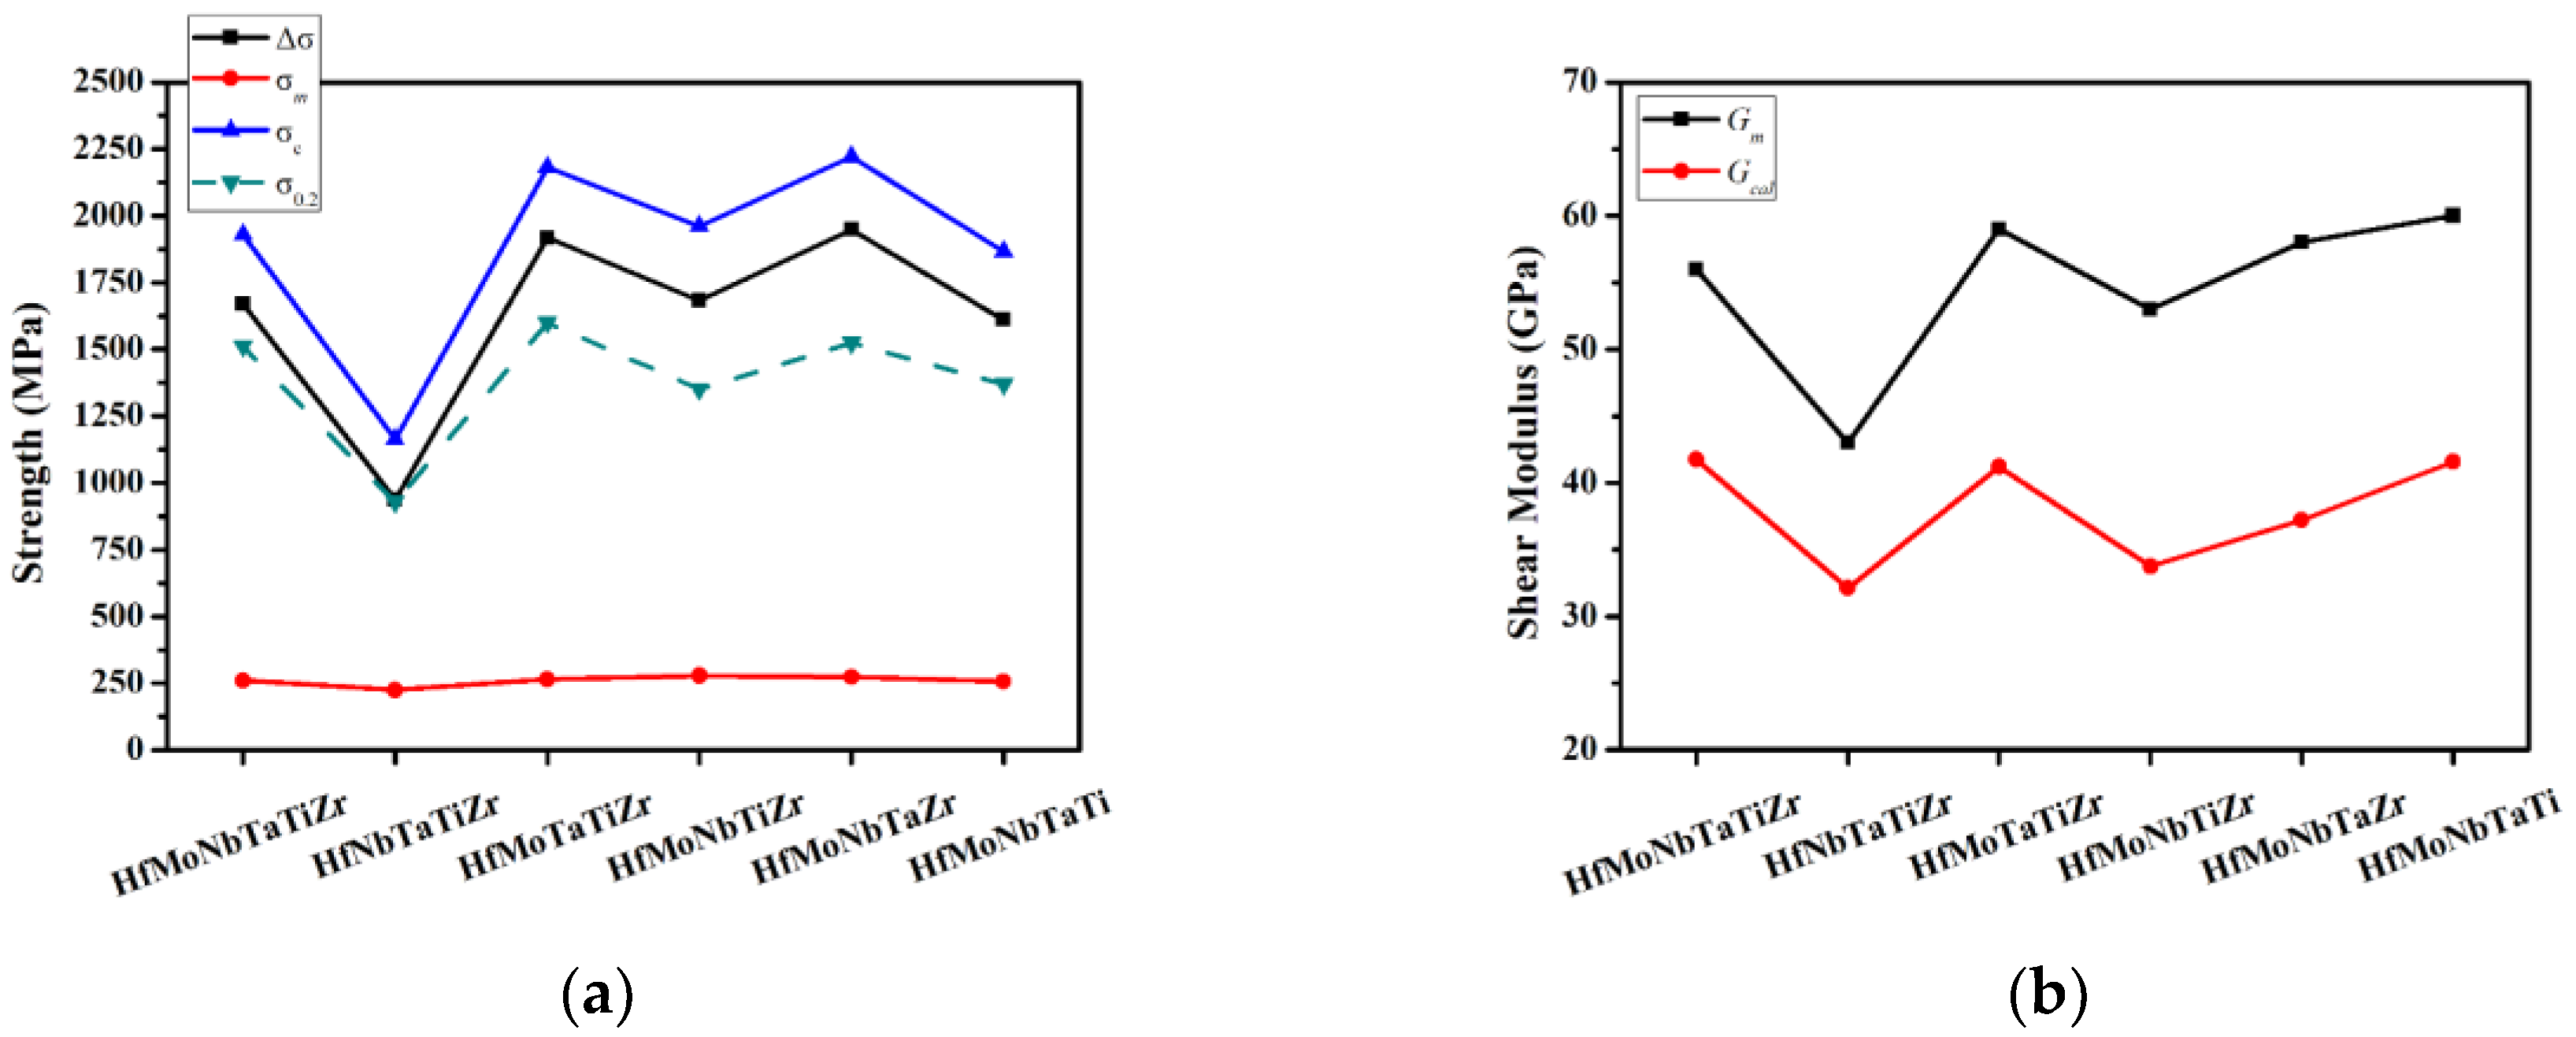
| Gm (GPa) | ∆σ (MPa) | σm (MPa) | σc (MPa) | σ0.2 (MPa) | Gcal (GPa) | |
|---|---|---|---|---|---|---|
| HfMoNbTaTiZr | 55 | 1669 | 260 | 1929 | 1512 | 41 |
| HfNbTaTiZr | 43 | 938 | 225 | 1163 | 929 [26] | 32 |
| HfMoTaTiZr | 60 | 1918 | 264 | 2182 | 1600 | 41 |
| HfMoNbTiZr | 53 | 1683 | 278 | 1961 | 1351 | 33 |
| HfMoNbTaZr | 58 | 1948 | 273 | 2221 | 1524 | 37 |
| HfMoNbTaTi | 60 | 1610 | 256 | 1866 | 1369 | 41 |
© 2018 by the authors. Licensee MDPI, Basel, Switzerland. This article is an open access article distributed under the terms and conditions of the Creative Commons Attribution (CC BY) license (http://creativecommons.org/licenses/by/4.0/).
Share and Cite
Tseng, K.-K.; Juan, C.-C.; Tso, S.; Chen, H.-C.; Tsai, C.-W.; Yeh, J.-W. Effects of Mo, Nb, Ta, Ti, and Zr on Mechanical Properties of Equiatomic Hf-Mo-Nb-Ta-Ti-Zr Alloys. Entropy 2019, 21, 15. https://doi.org/10.3390/e21010015
Tseng K-K, Juan C-C, Tso S, Chen H-C, Tsai C-W, Yeh J-W. Effects of Mo, Nb, Ta, Ti, and Zr on Mechanical Properties of Equiatomic Hf-Mo-Nb-Ta-Ti-Zr Alloys. Entropy. 2019; 21(1):15. https://doi.org/10.3390/e21010015
Chicago/Turabian StyleTseng, Ko-Kai, Chien-Chang Juan, Shuen Tso, Hsuan-Chu Chen, Che-Wei Tsai, and Jien-Wei Yeh. 2019. "Effects of Mo, Nb, Ta, Ti, and Zr on Mechanical Properties of Equiatomic Hf-Mo-Nb-Ta-Ti-Zr Alloys" Entropy 21, no. 1: 15. https://doi.org/10.3390/e21010015
APA StyleTseng, K.-K., Juan, C.-C., Tso, S., Chen, H.-C., Tsai, C.-W., & Yeh, J.-W. (2019). Effects of Mo, Nb, Ta, Ti, and Zr on Mechanical Properties of Equiatomic Hf-Mo-Nb-Ta-Ti-Zr Alloys. Entropy, 21(1), 15. https://doi.org/10.3390/e21010015