
Entropy in Investigation of Vasovagal Syndrome in Passive Head Up Tilt Test


Abstract
:1. Introduction
2. Materials and Methods
2.1. Approximate Entropy and Sample Entropy
2.2. Study Group
2.3. Measurements
2.4. Data Analysis and Statistical Methods
3. Results
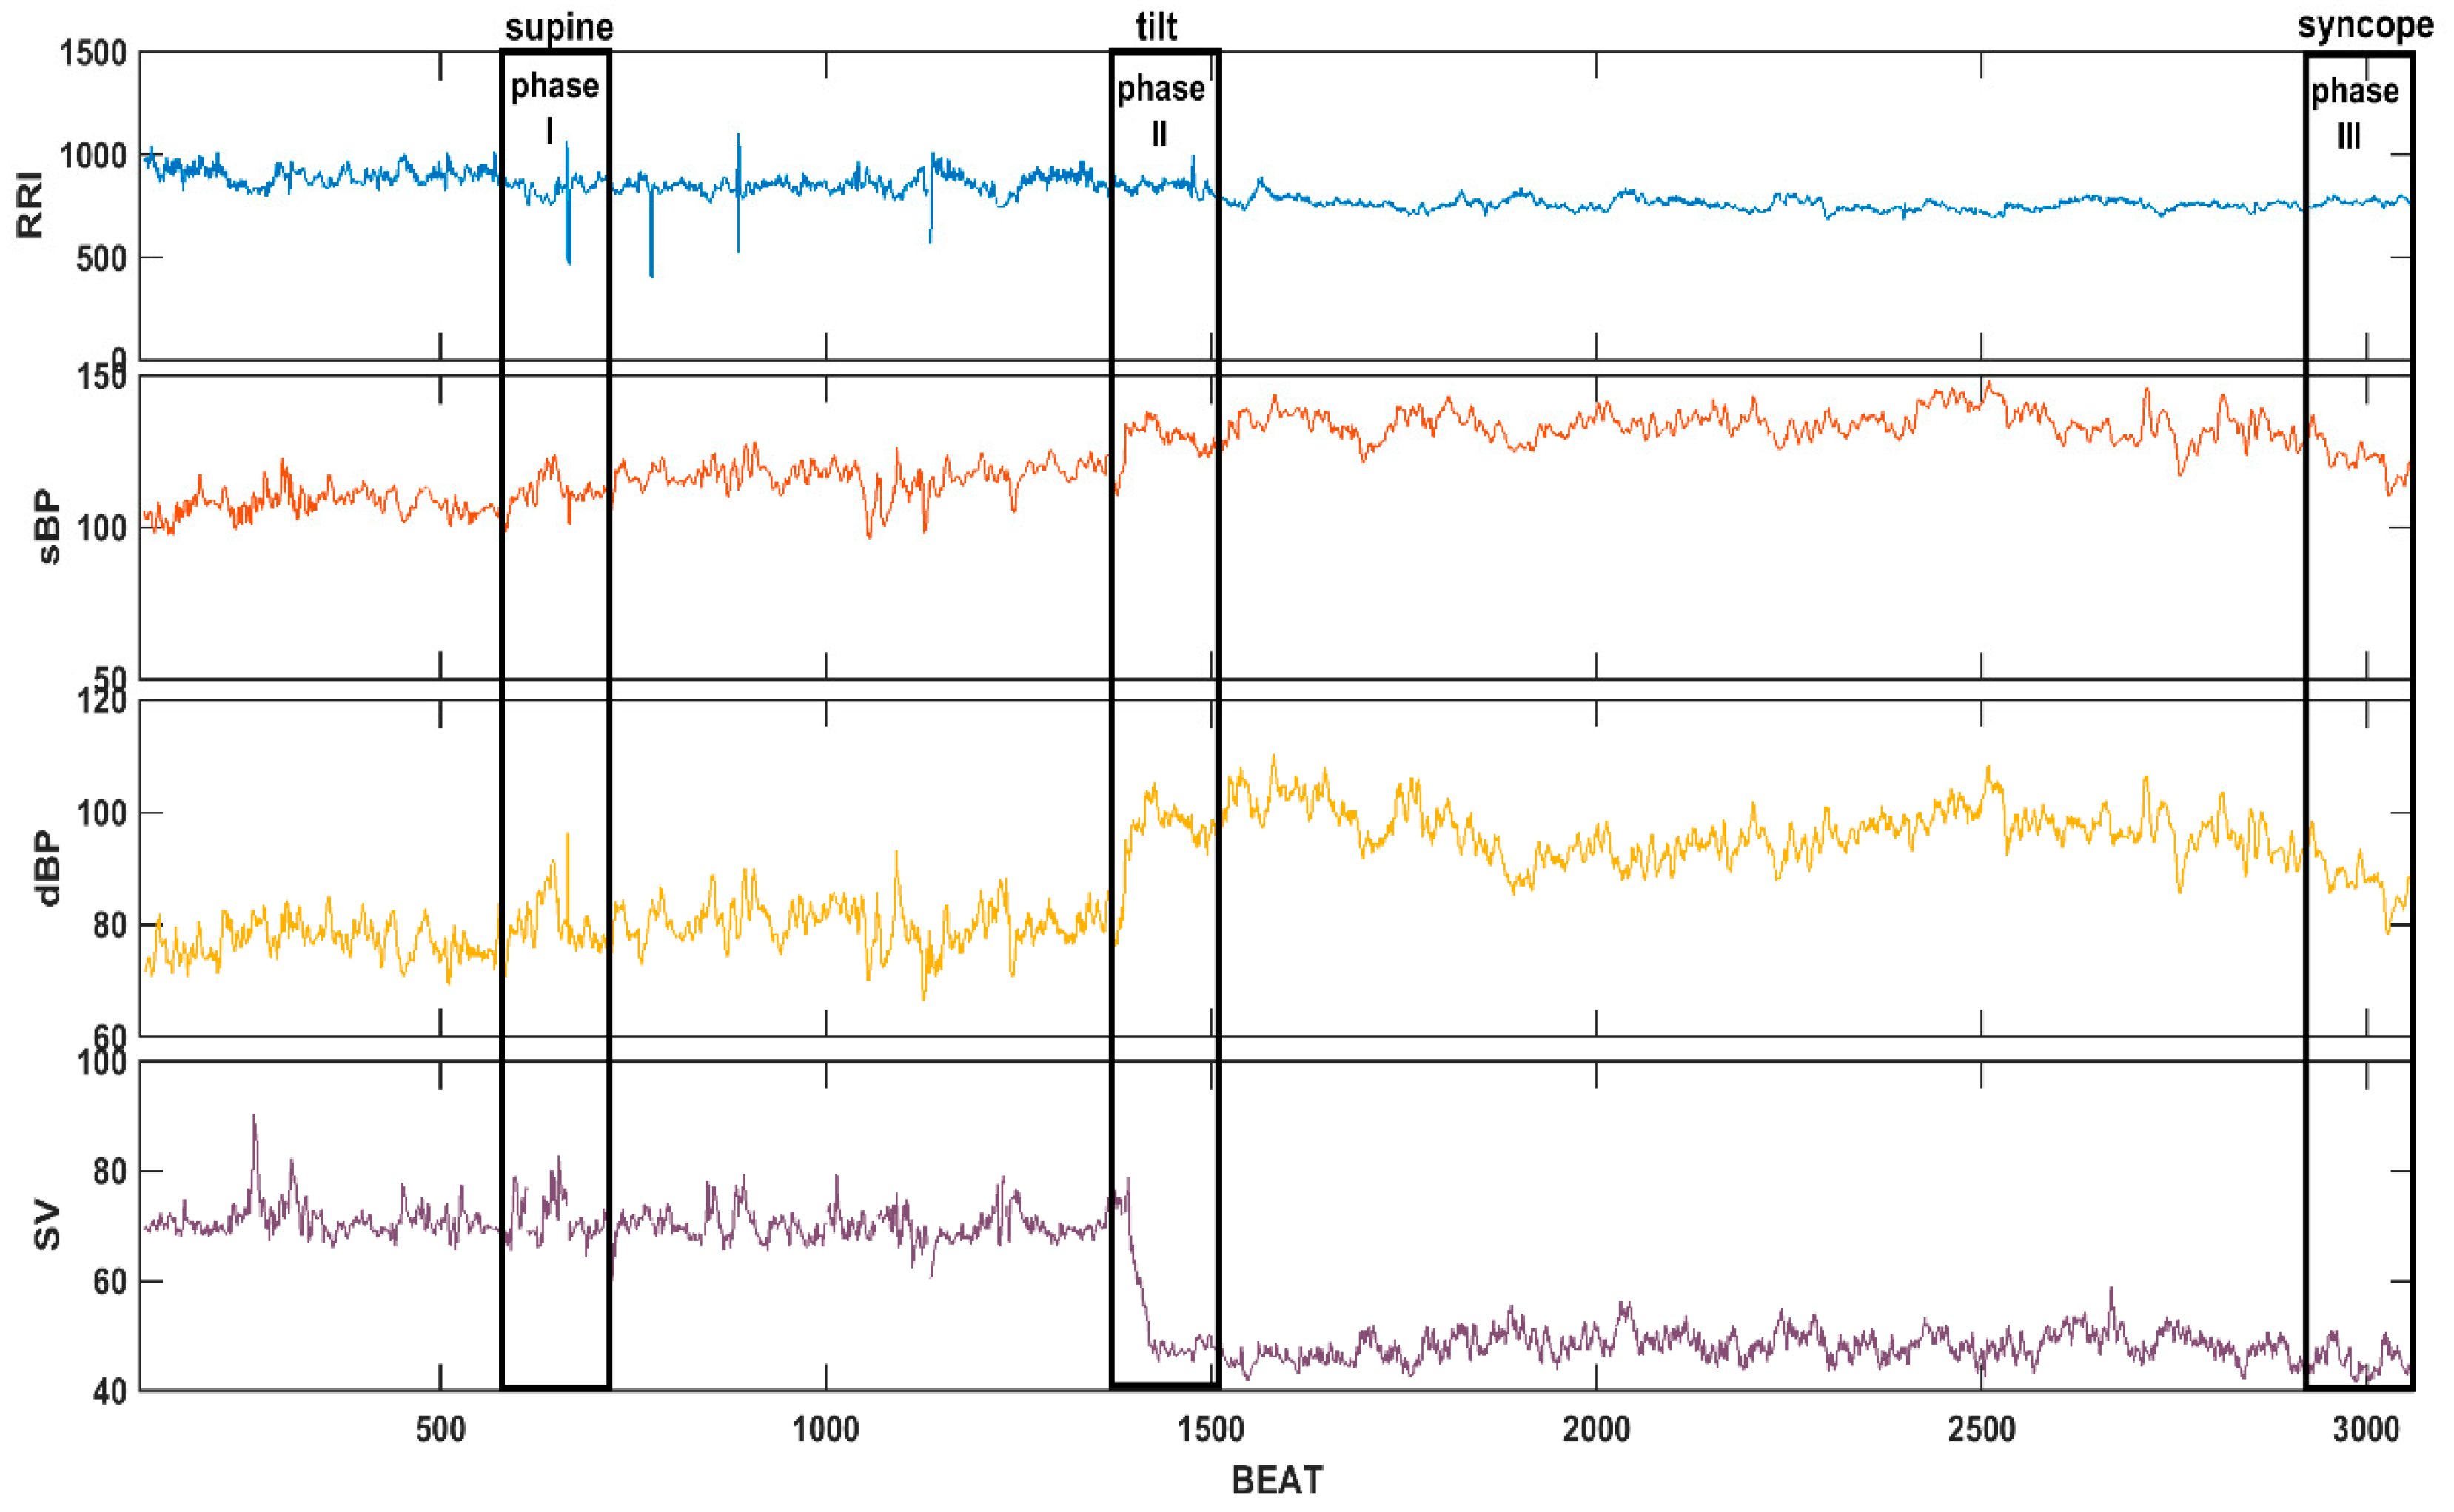
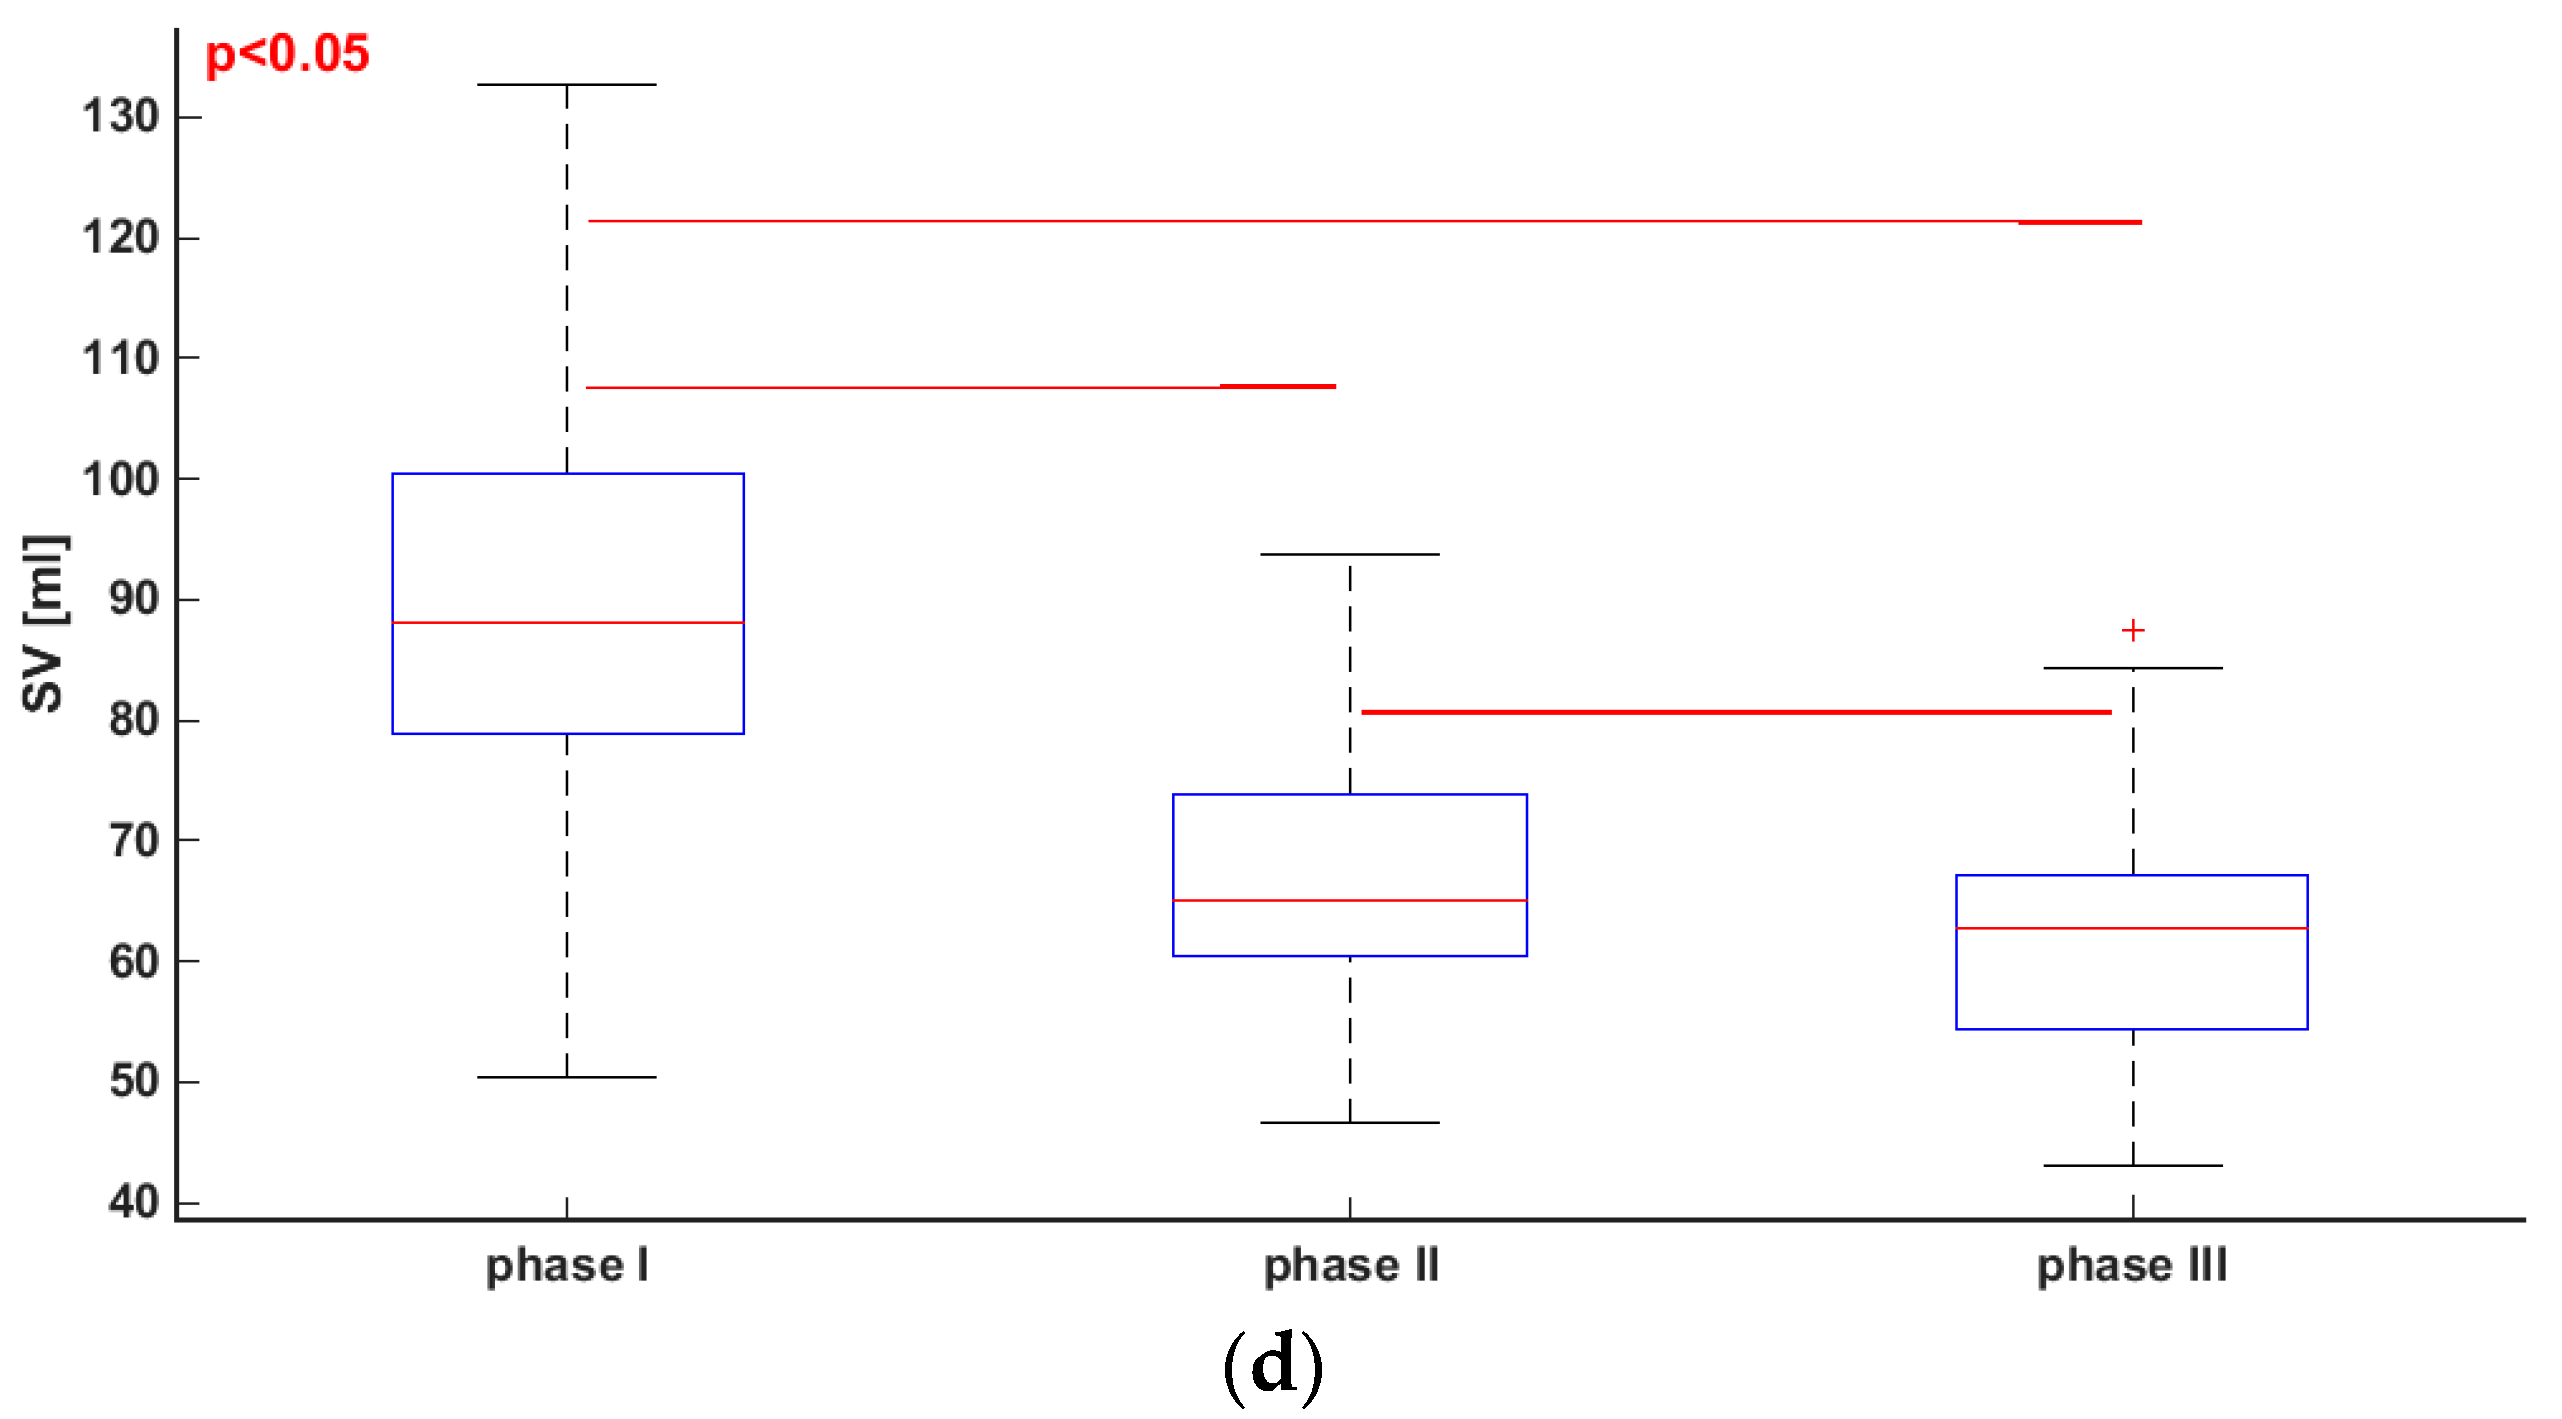
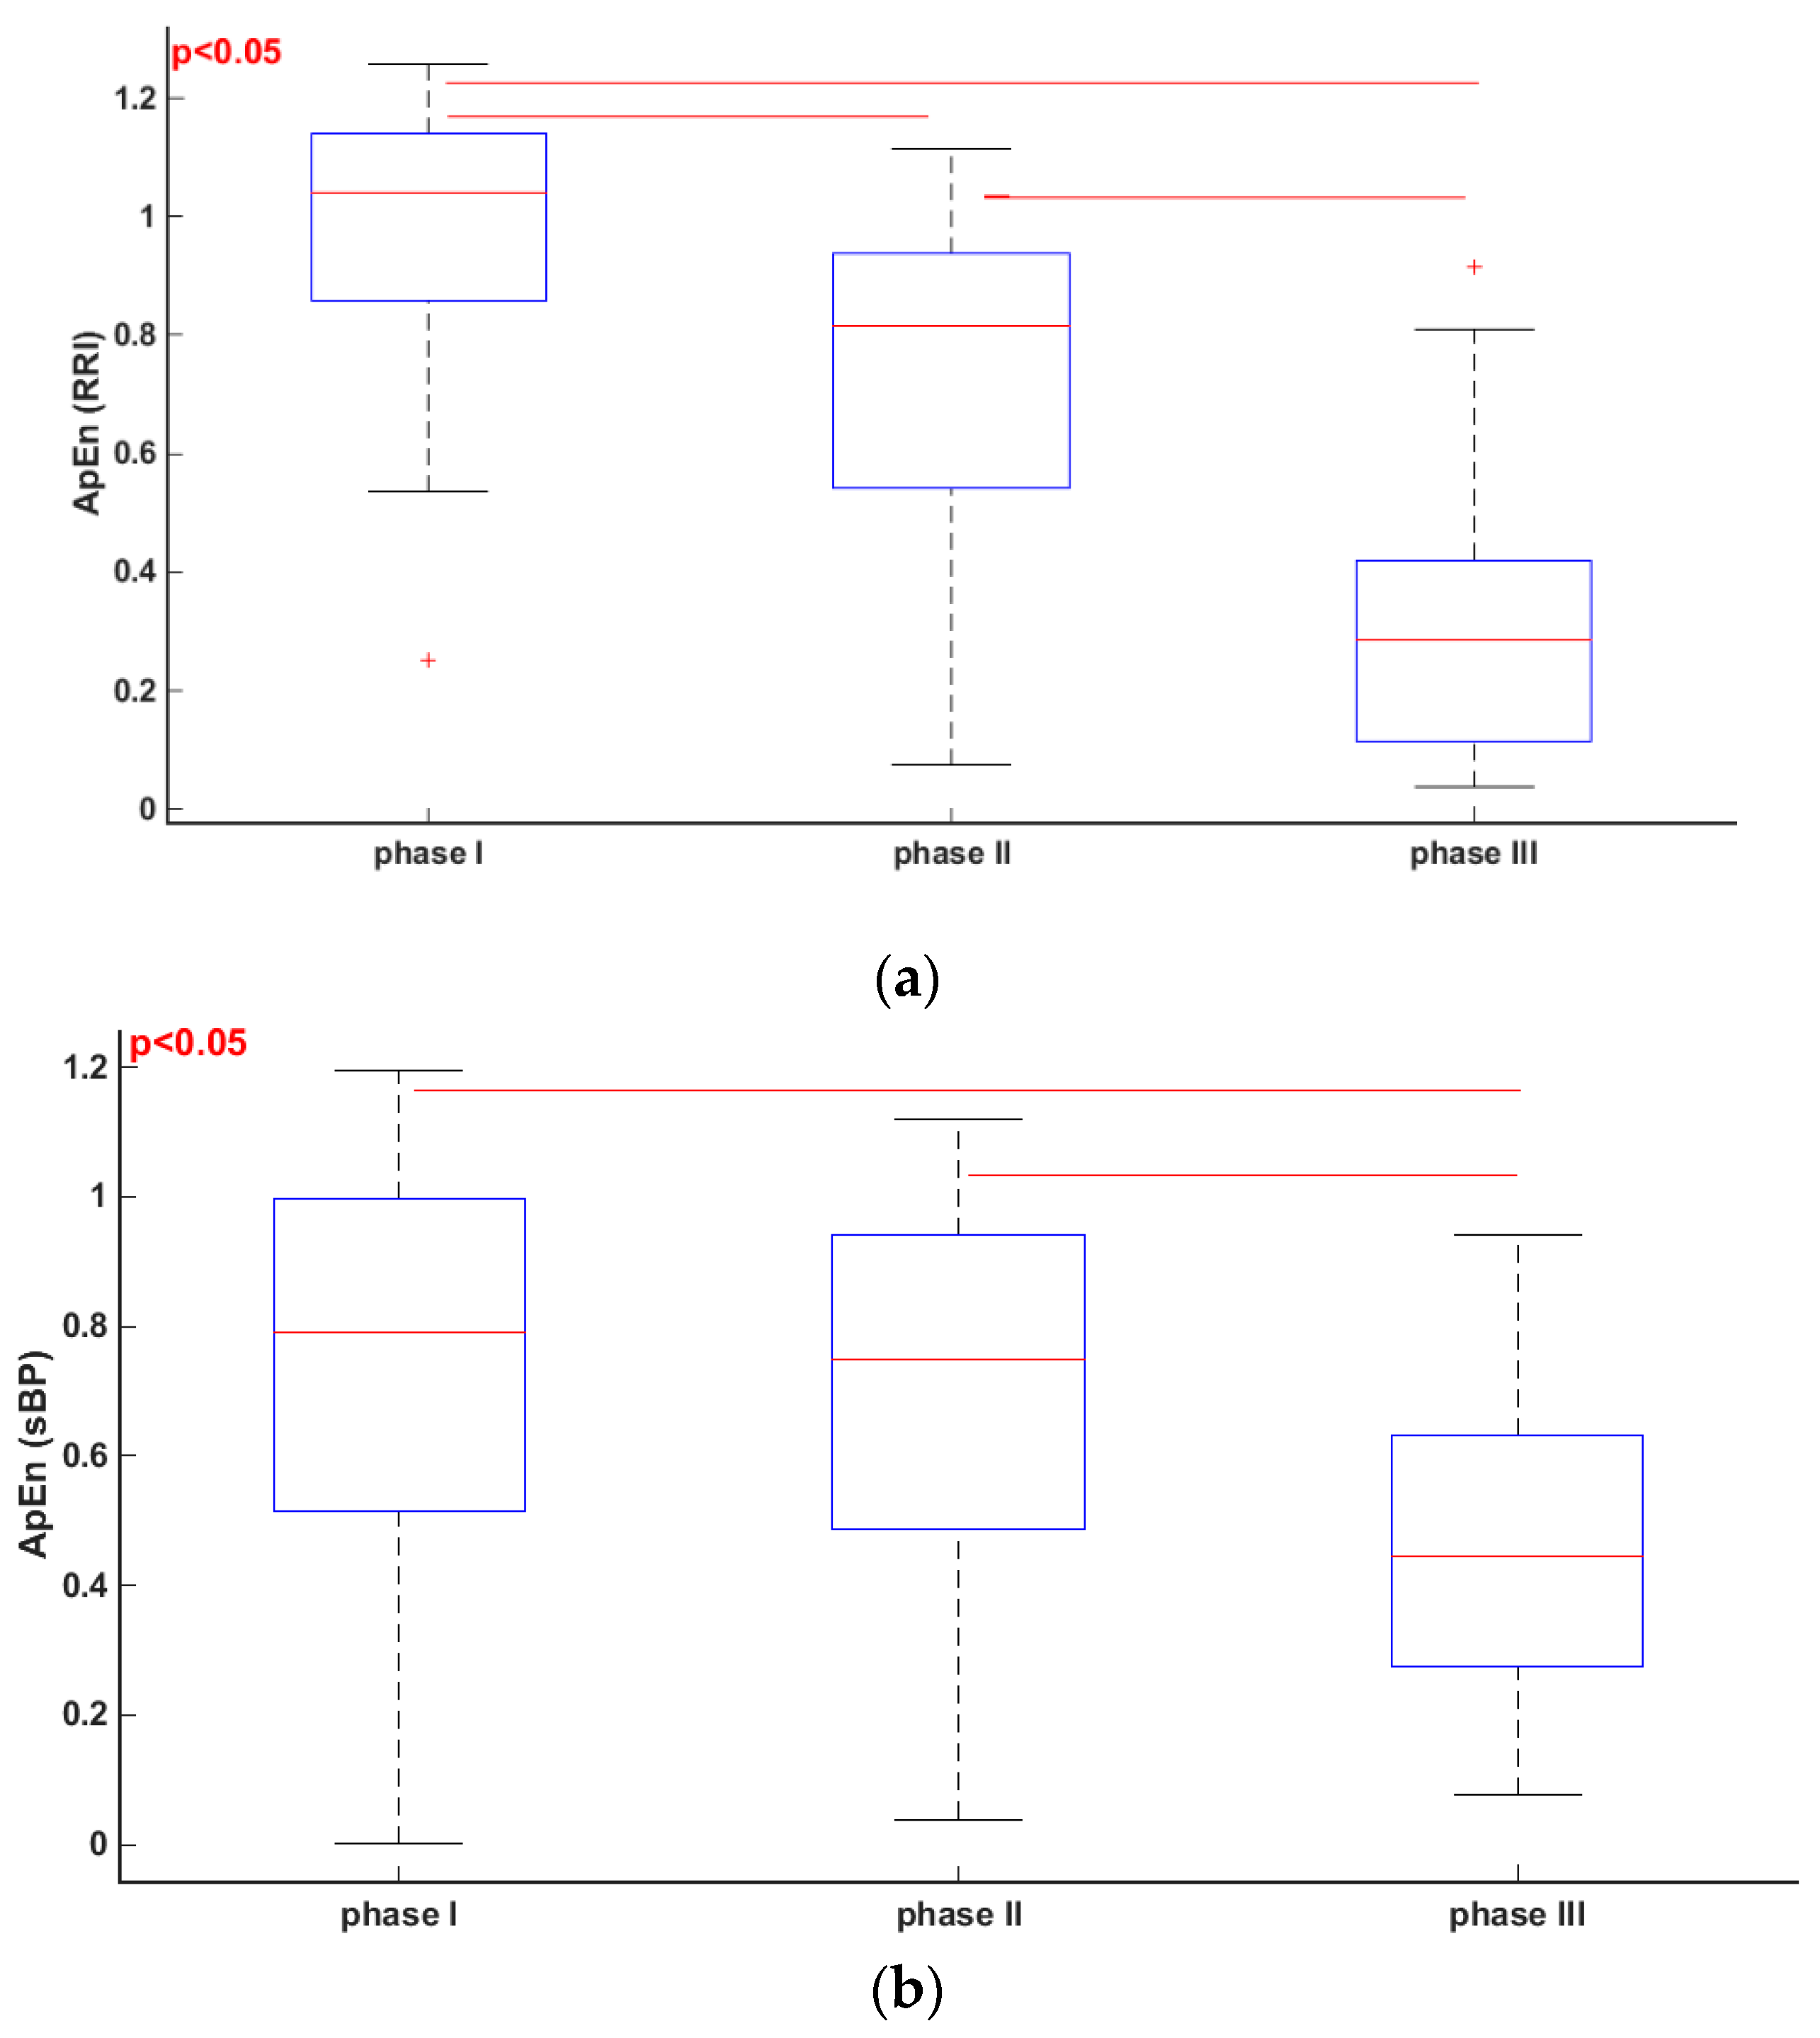
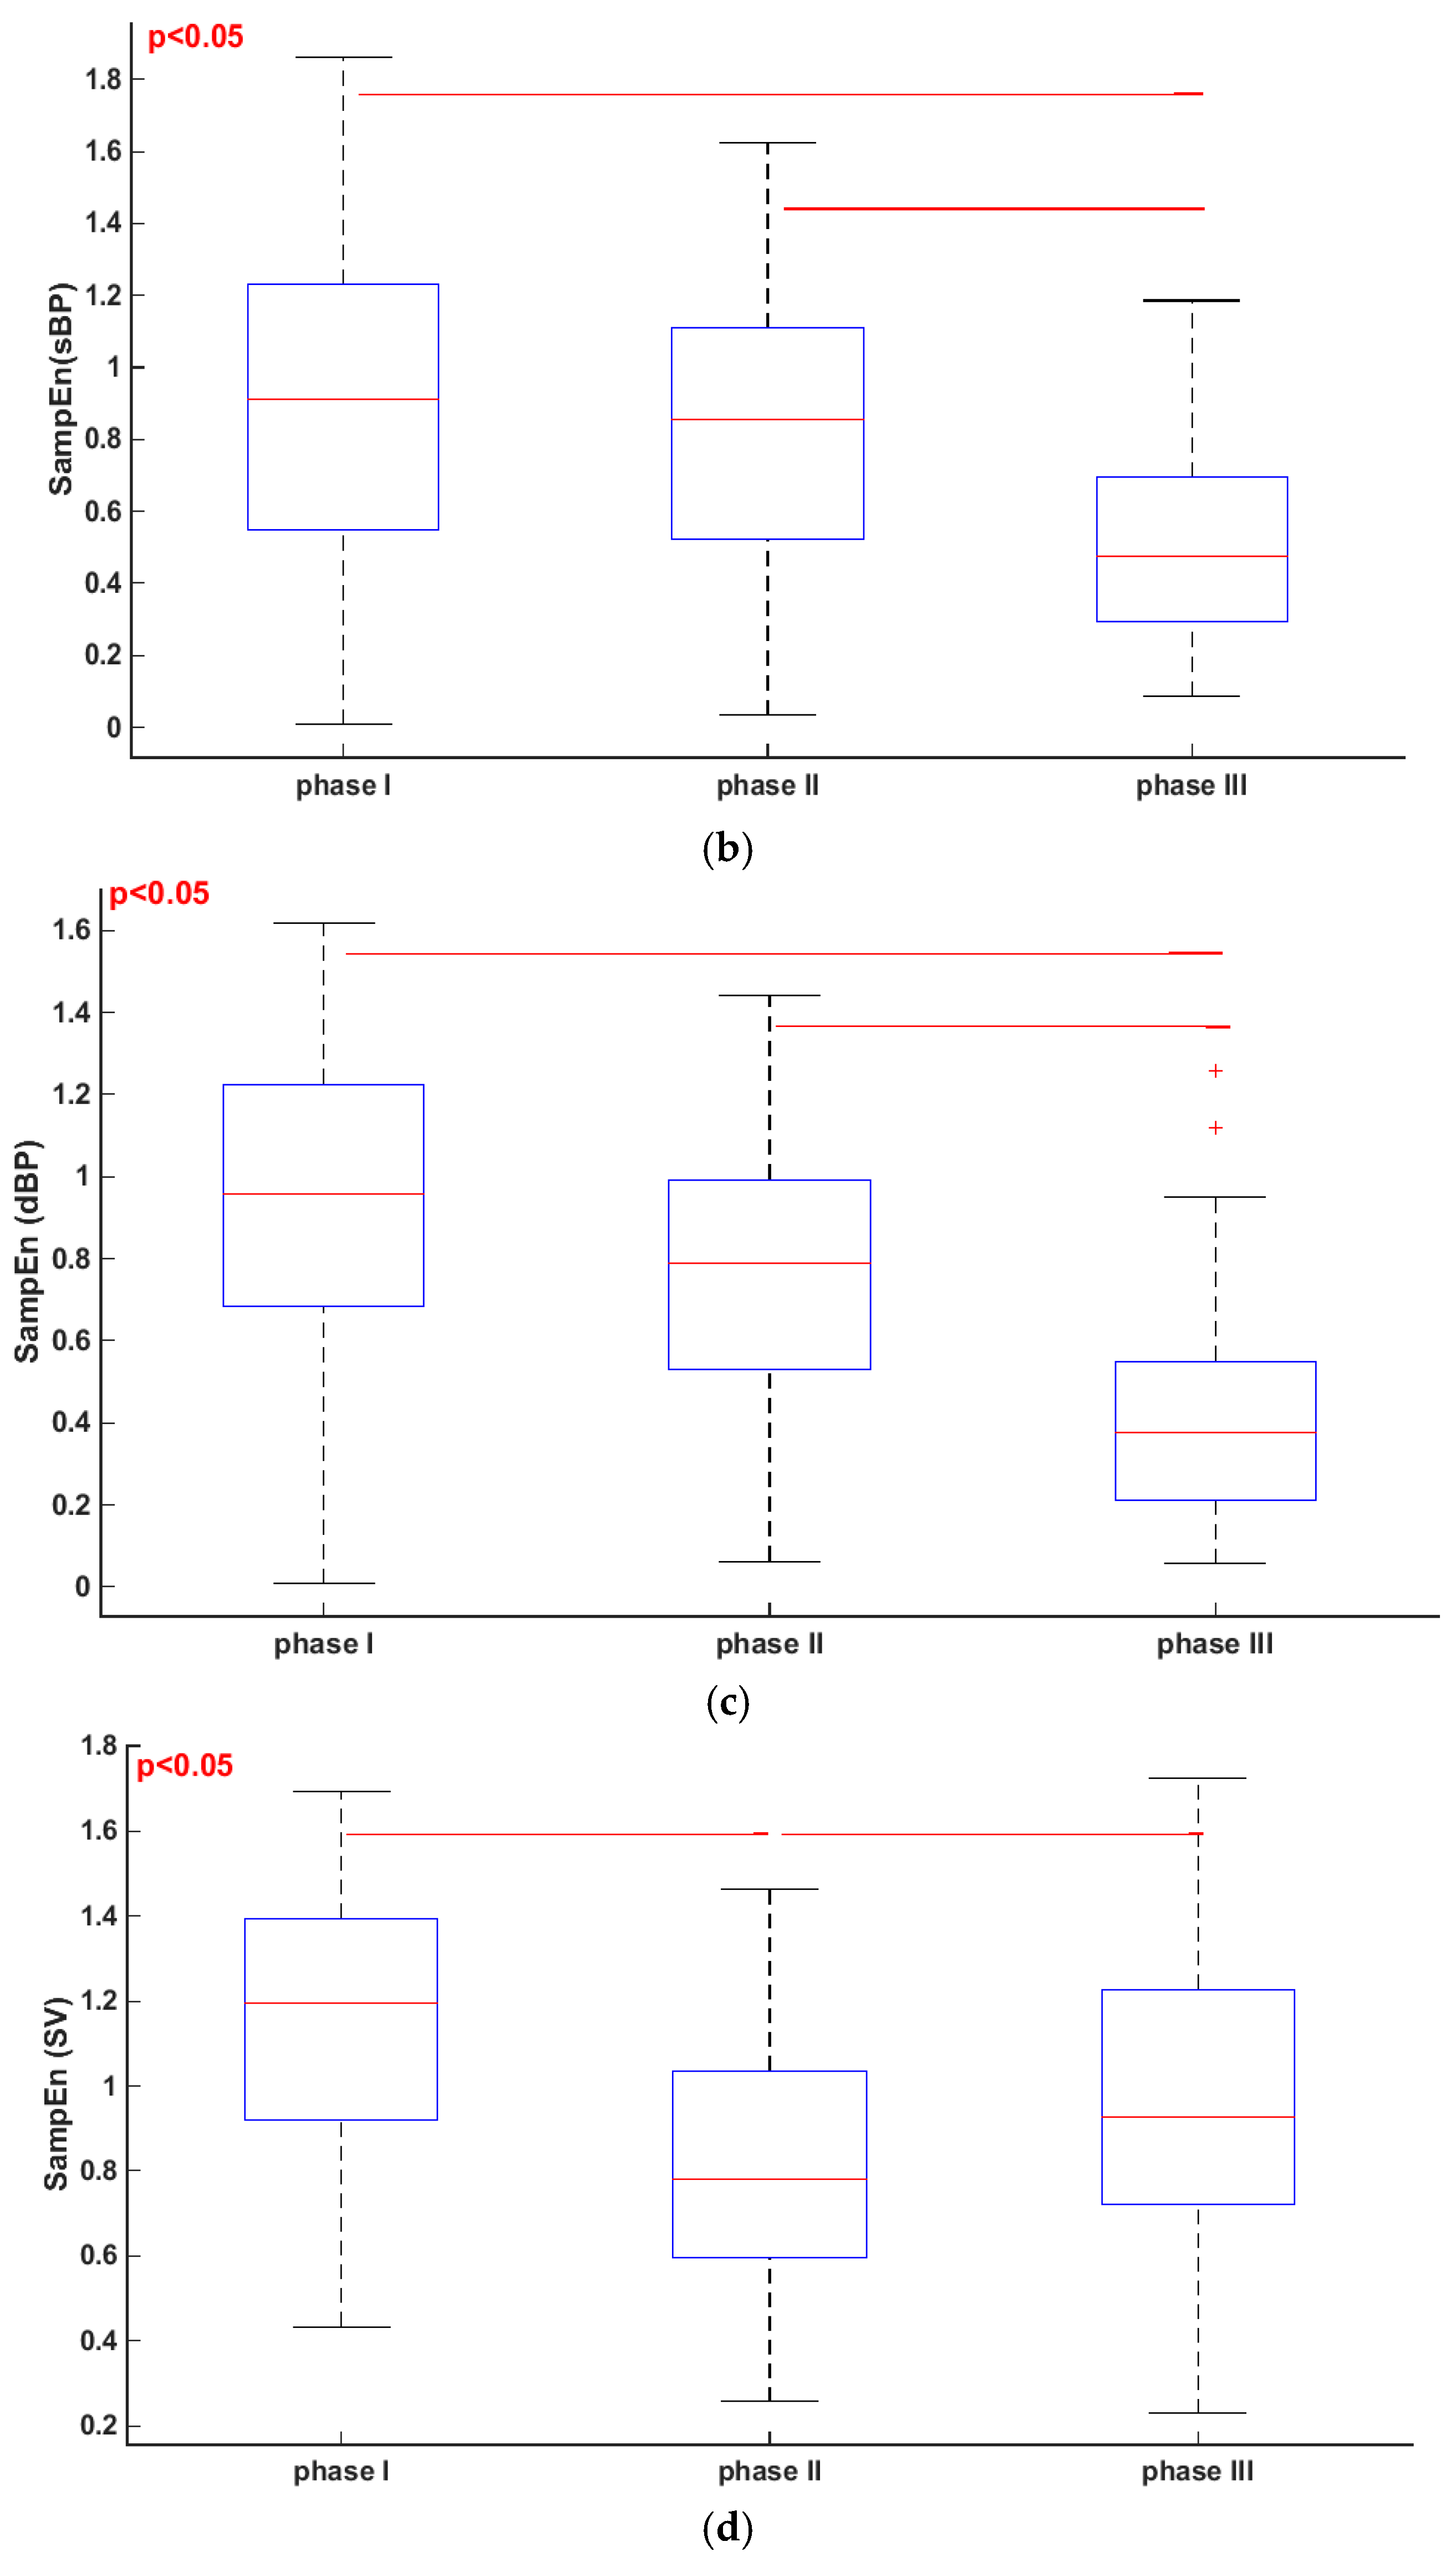
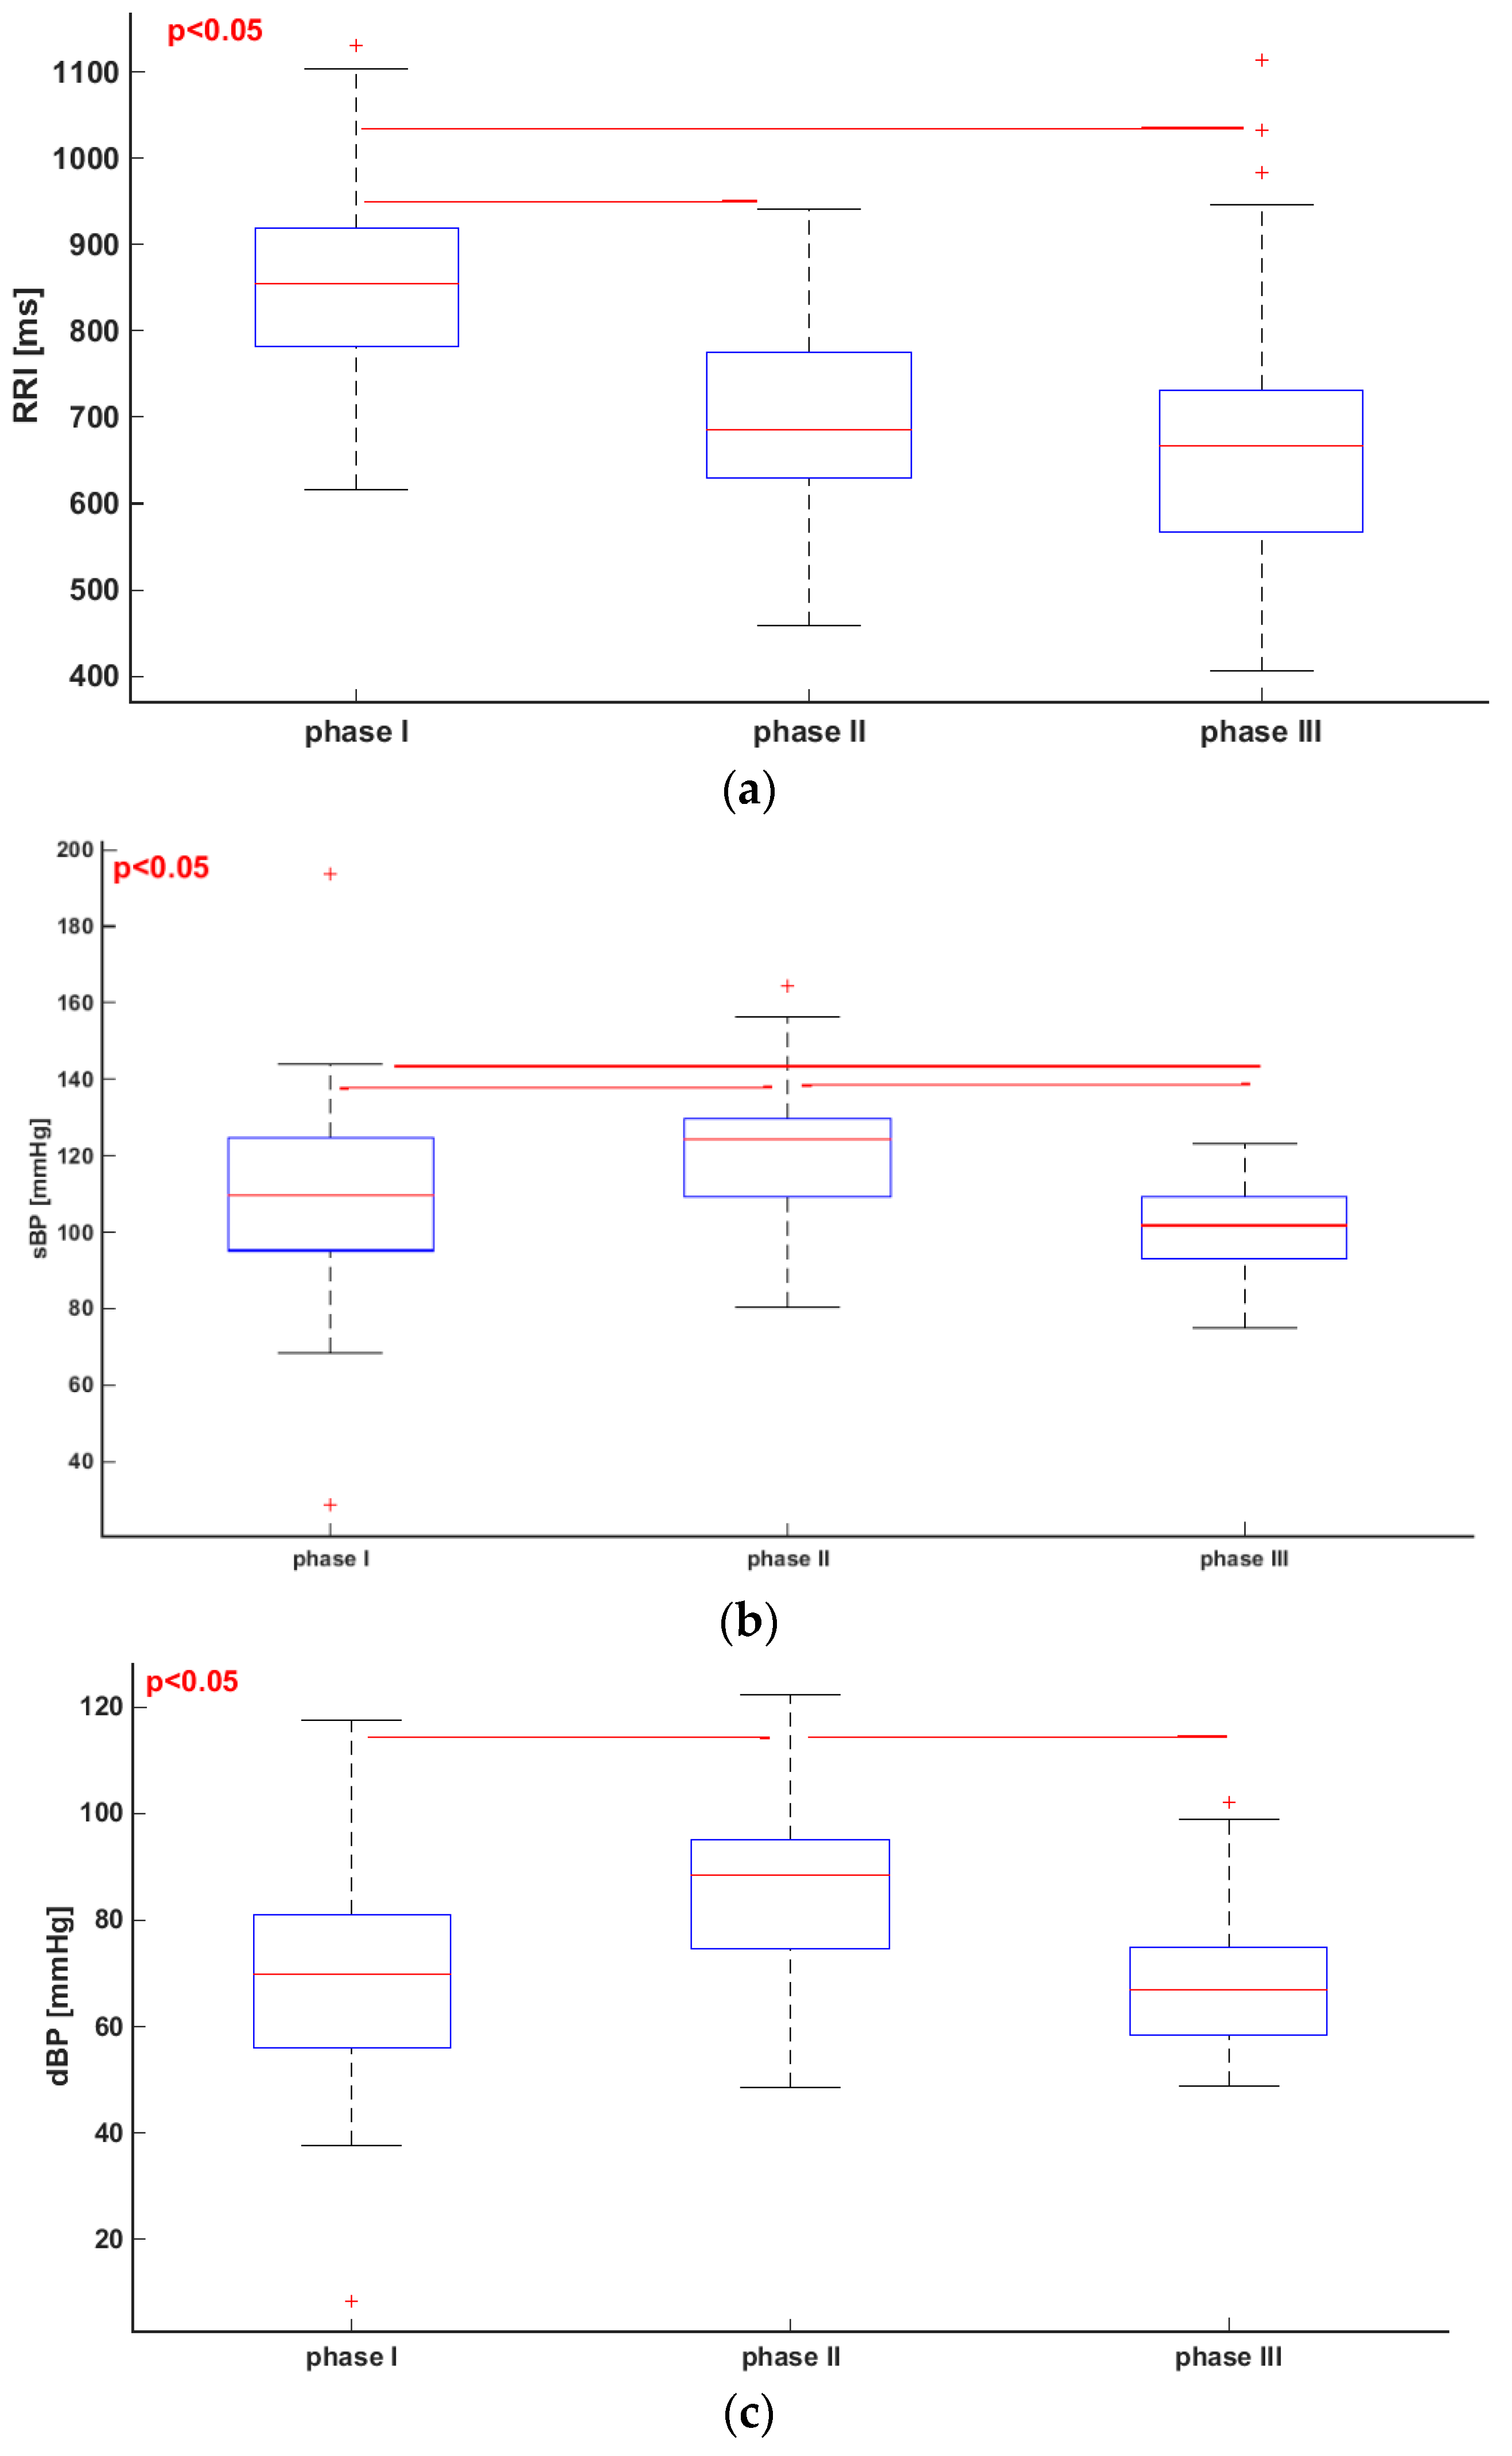
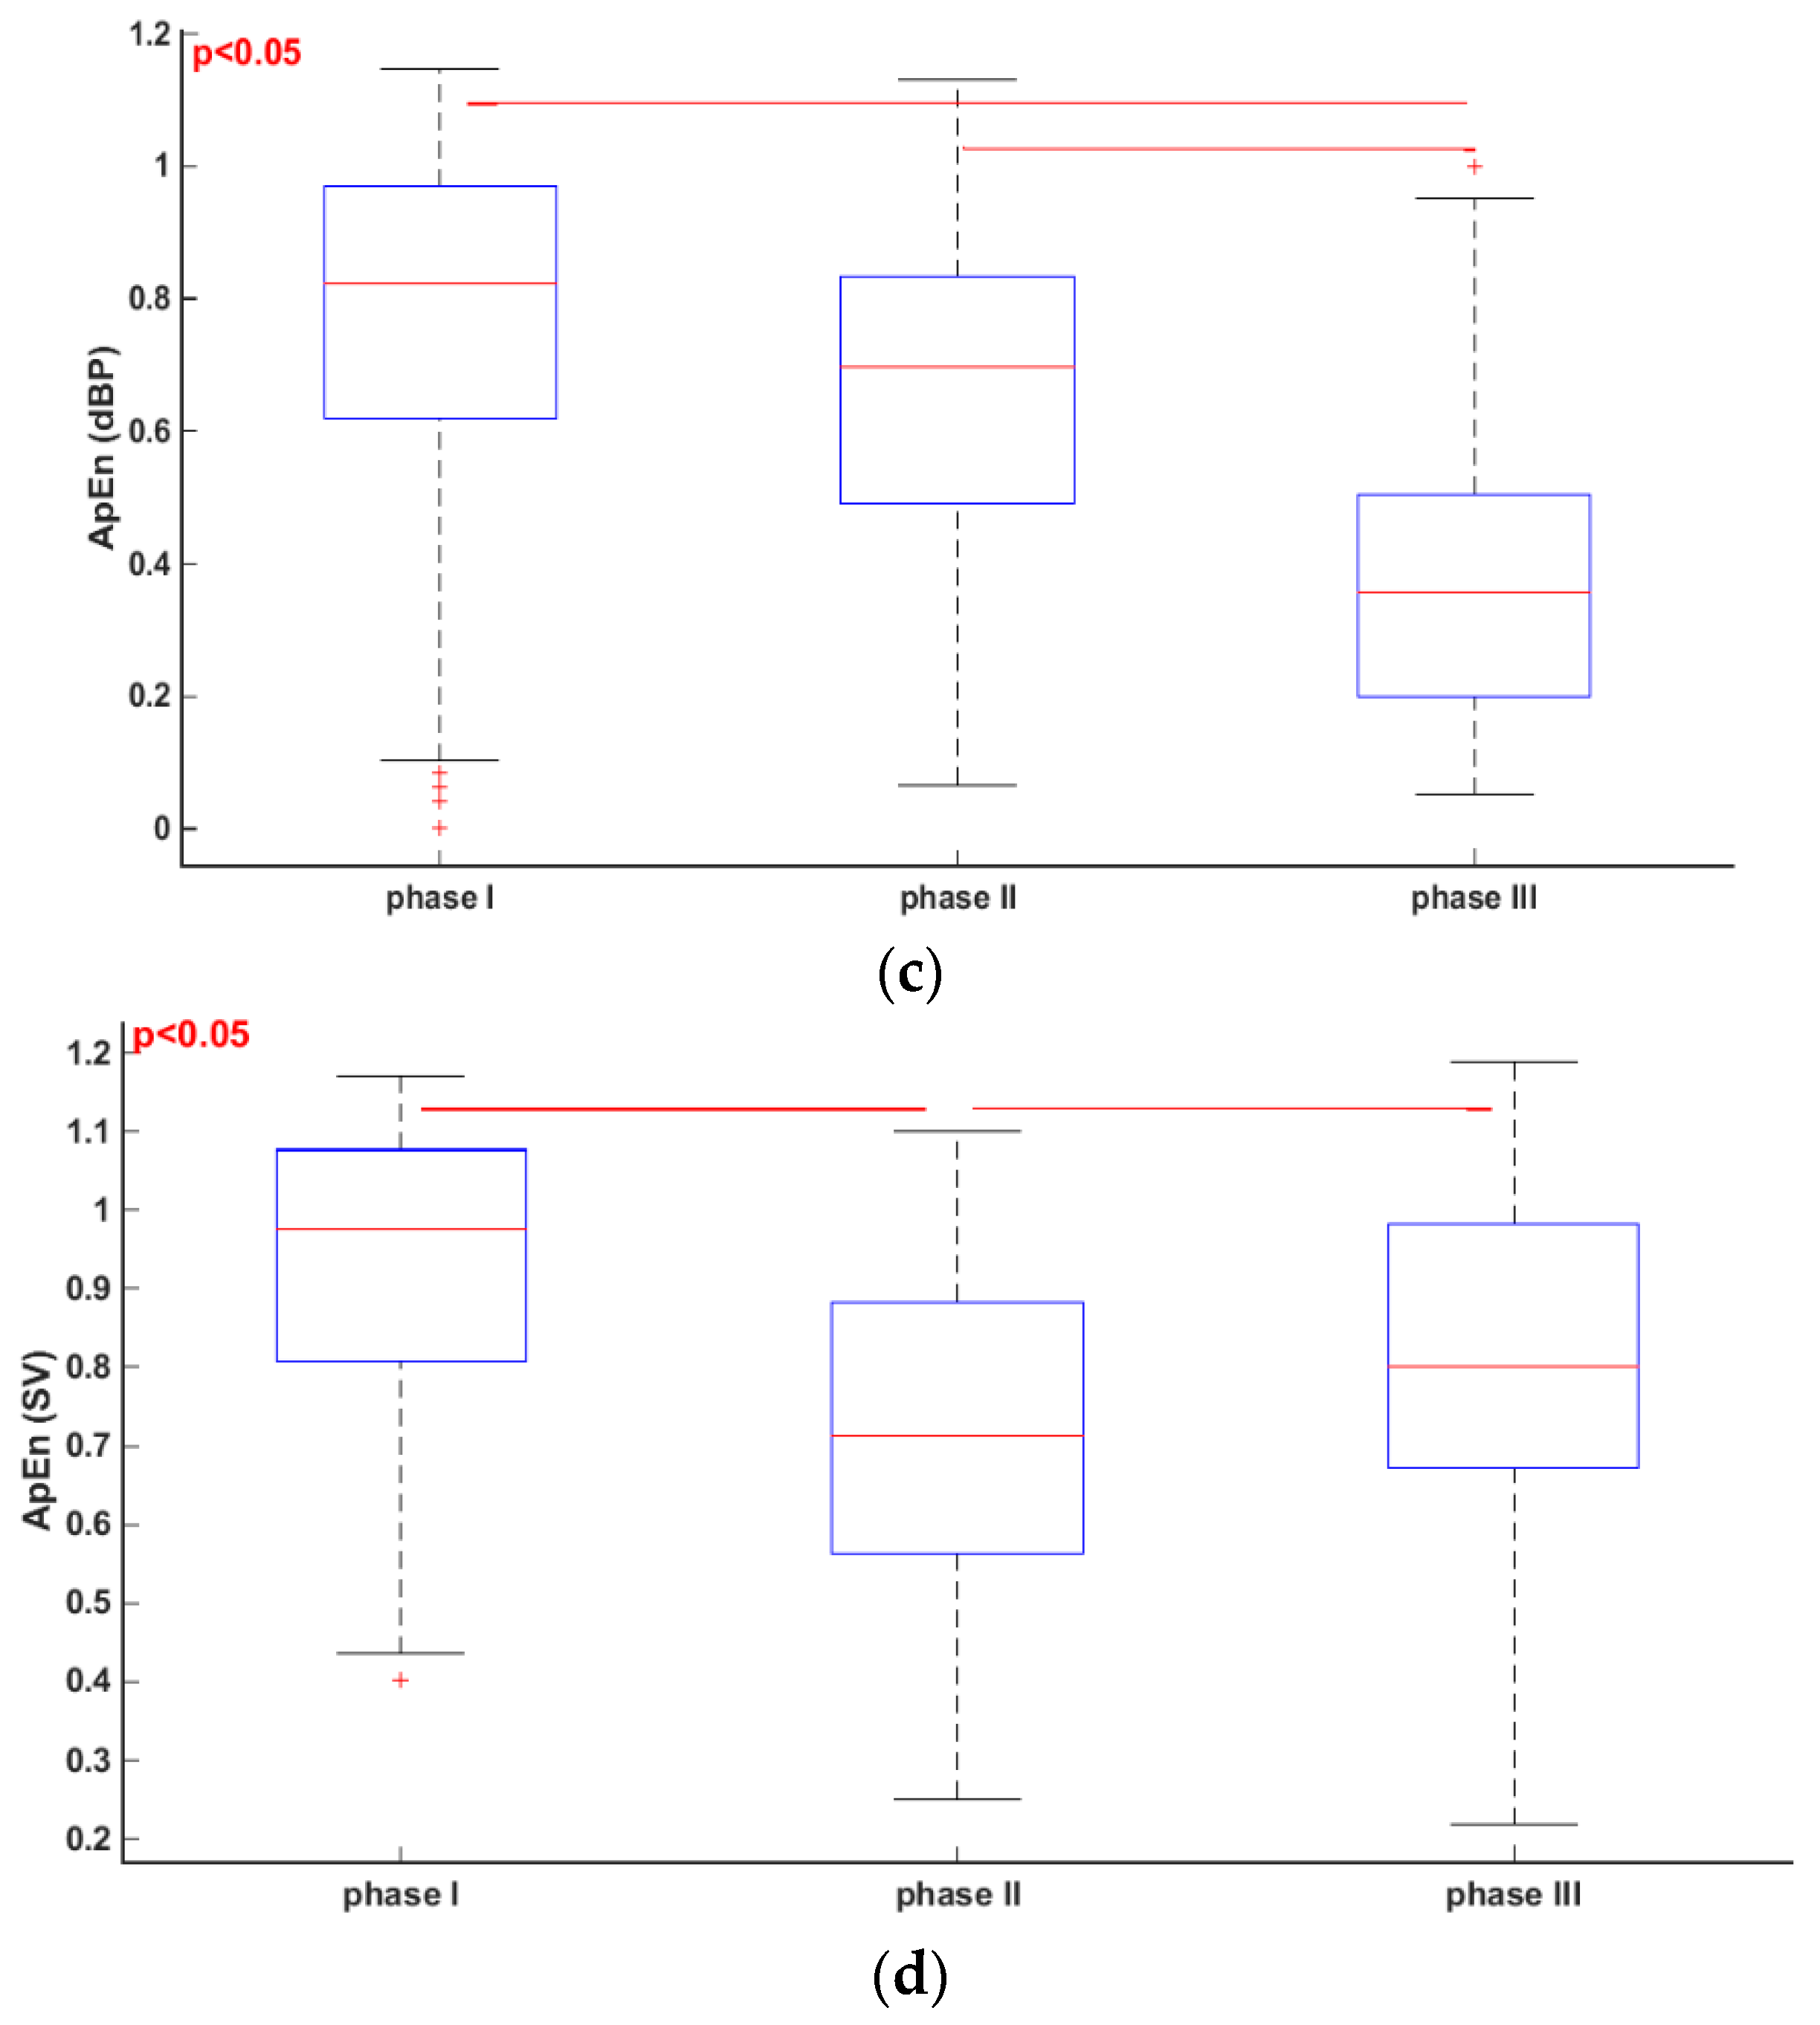
3.1. Comparisons of Parameters for Selected HUTT Stages
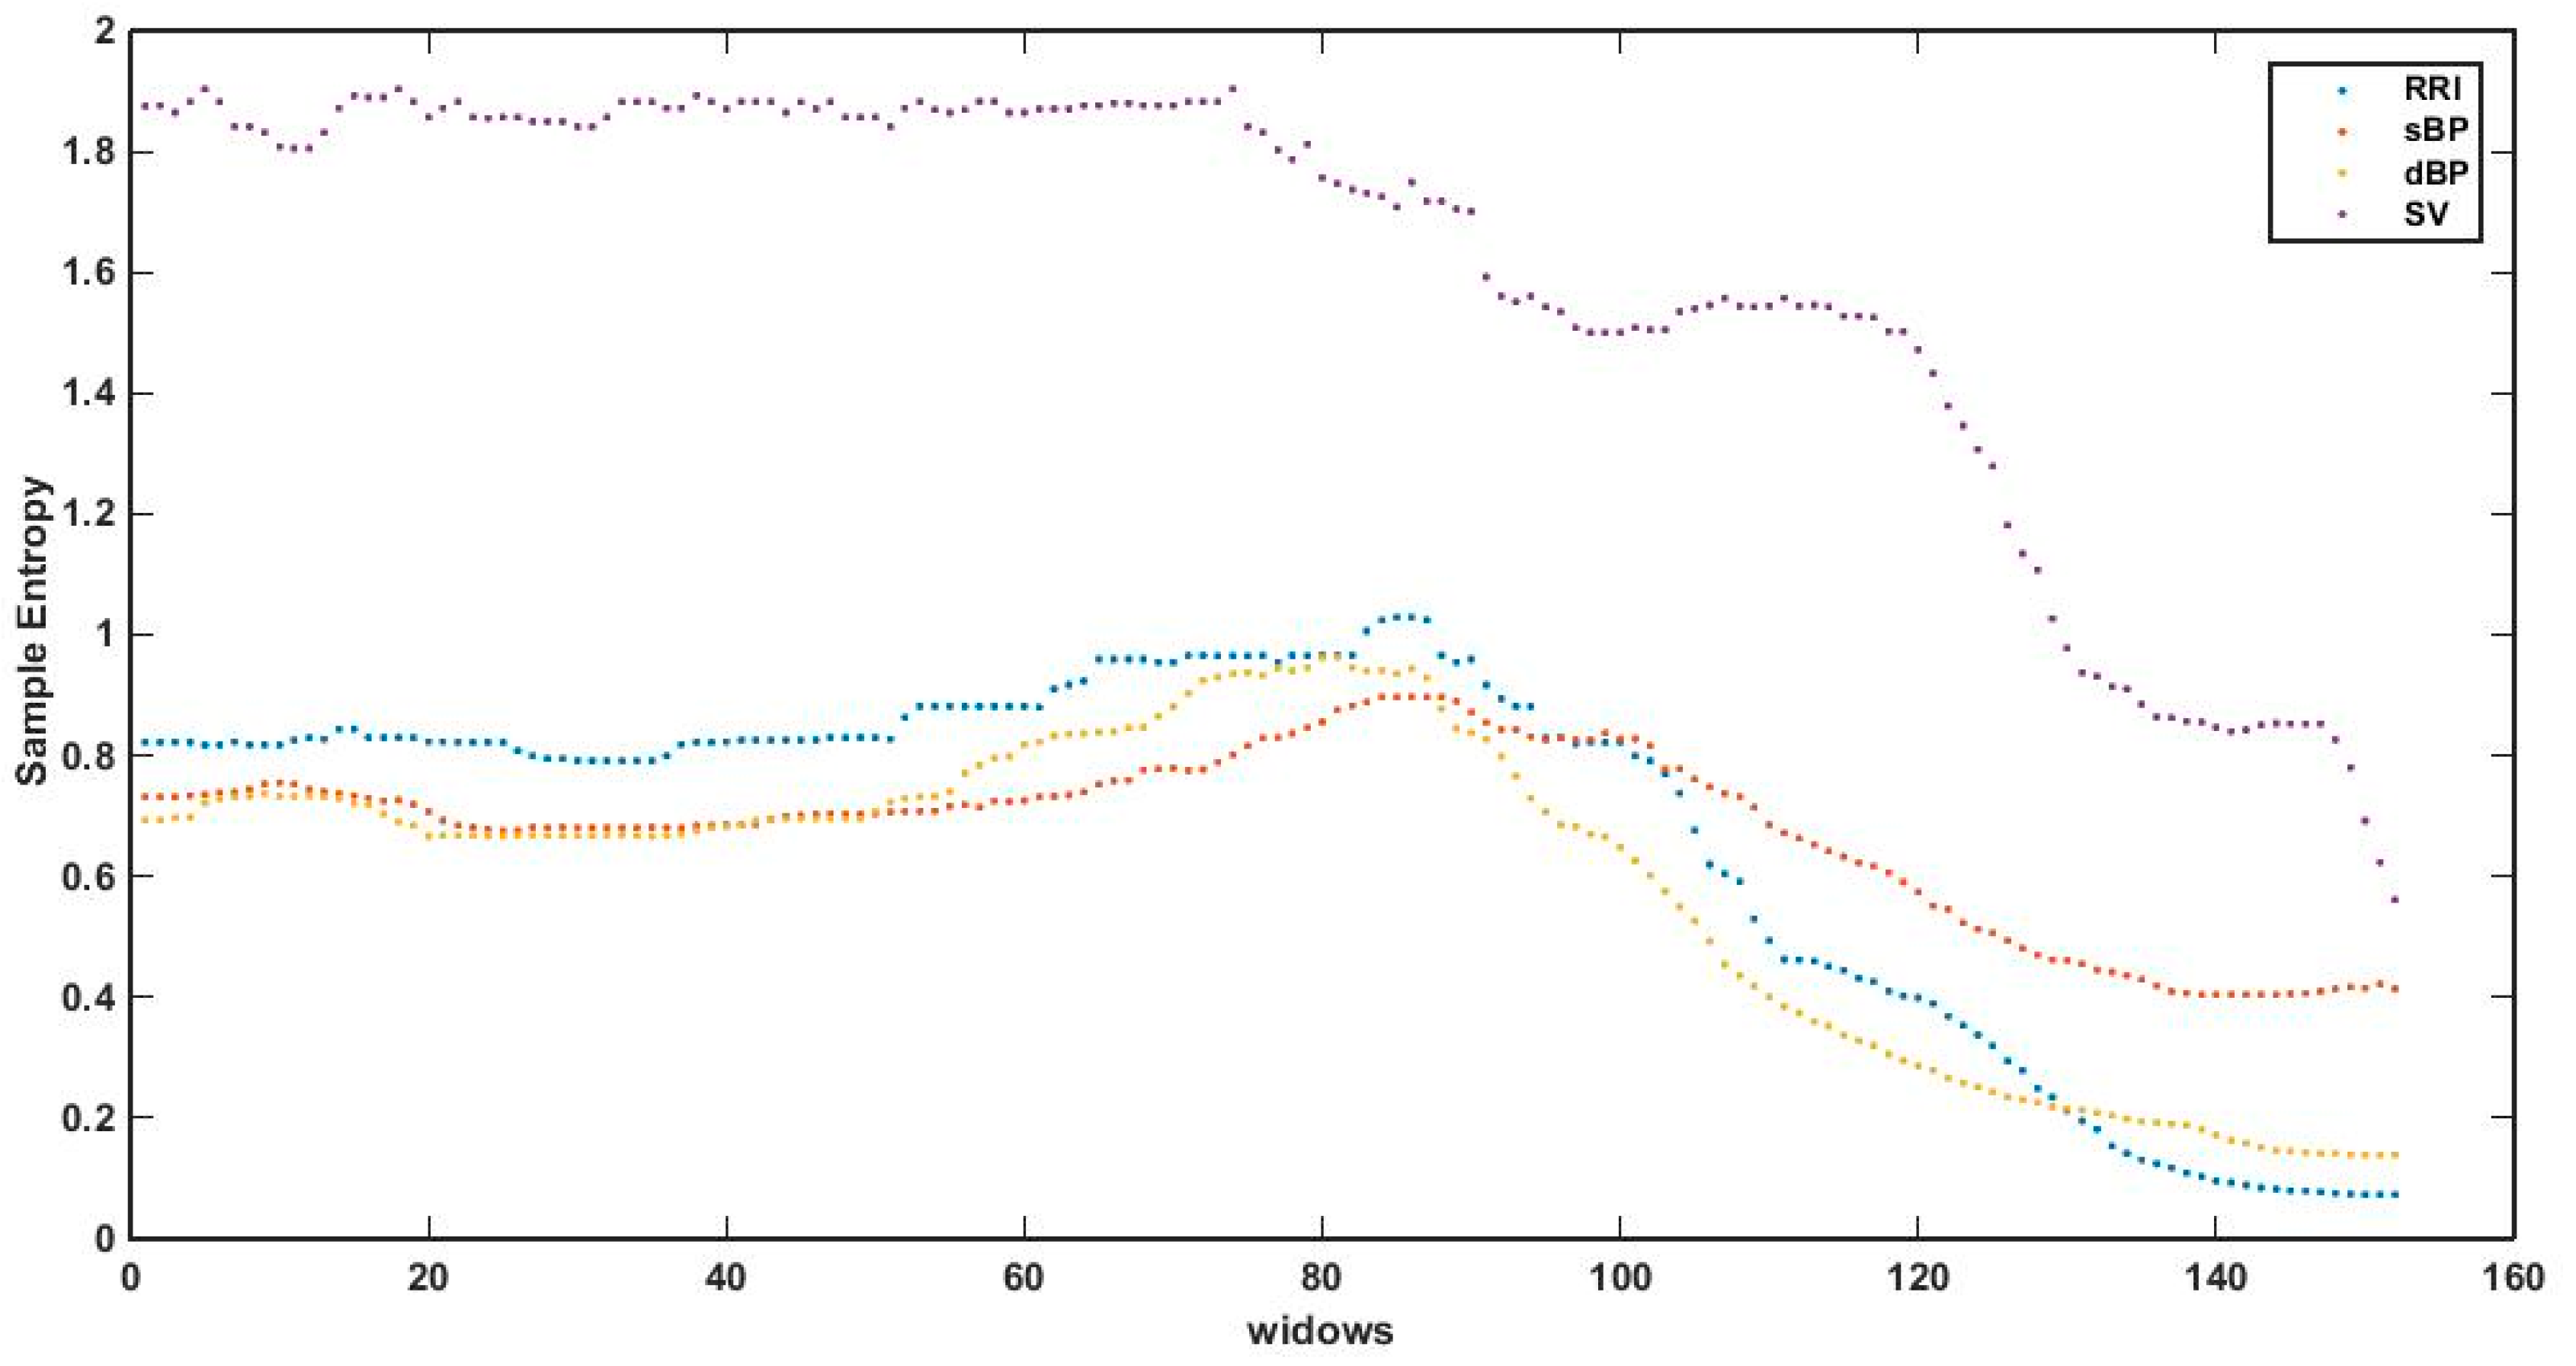
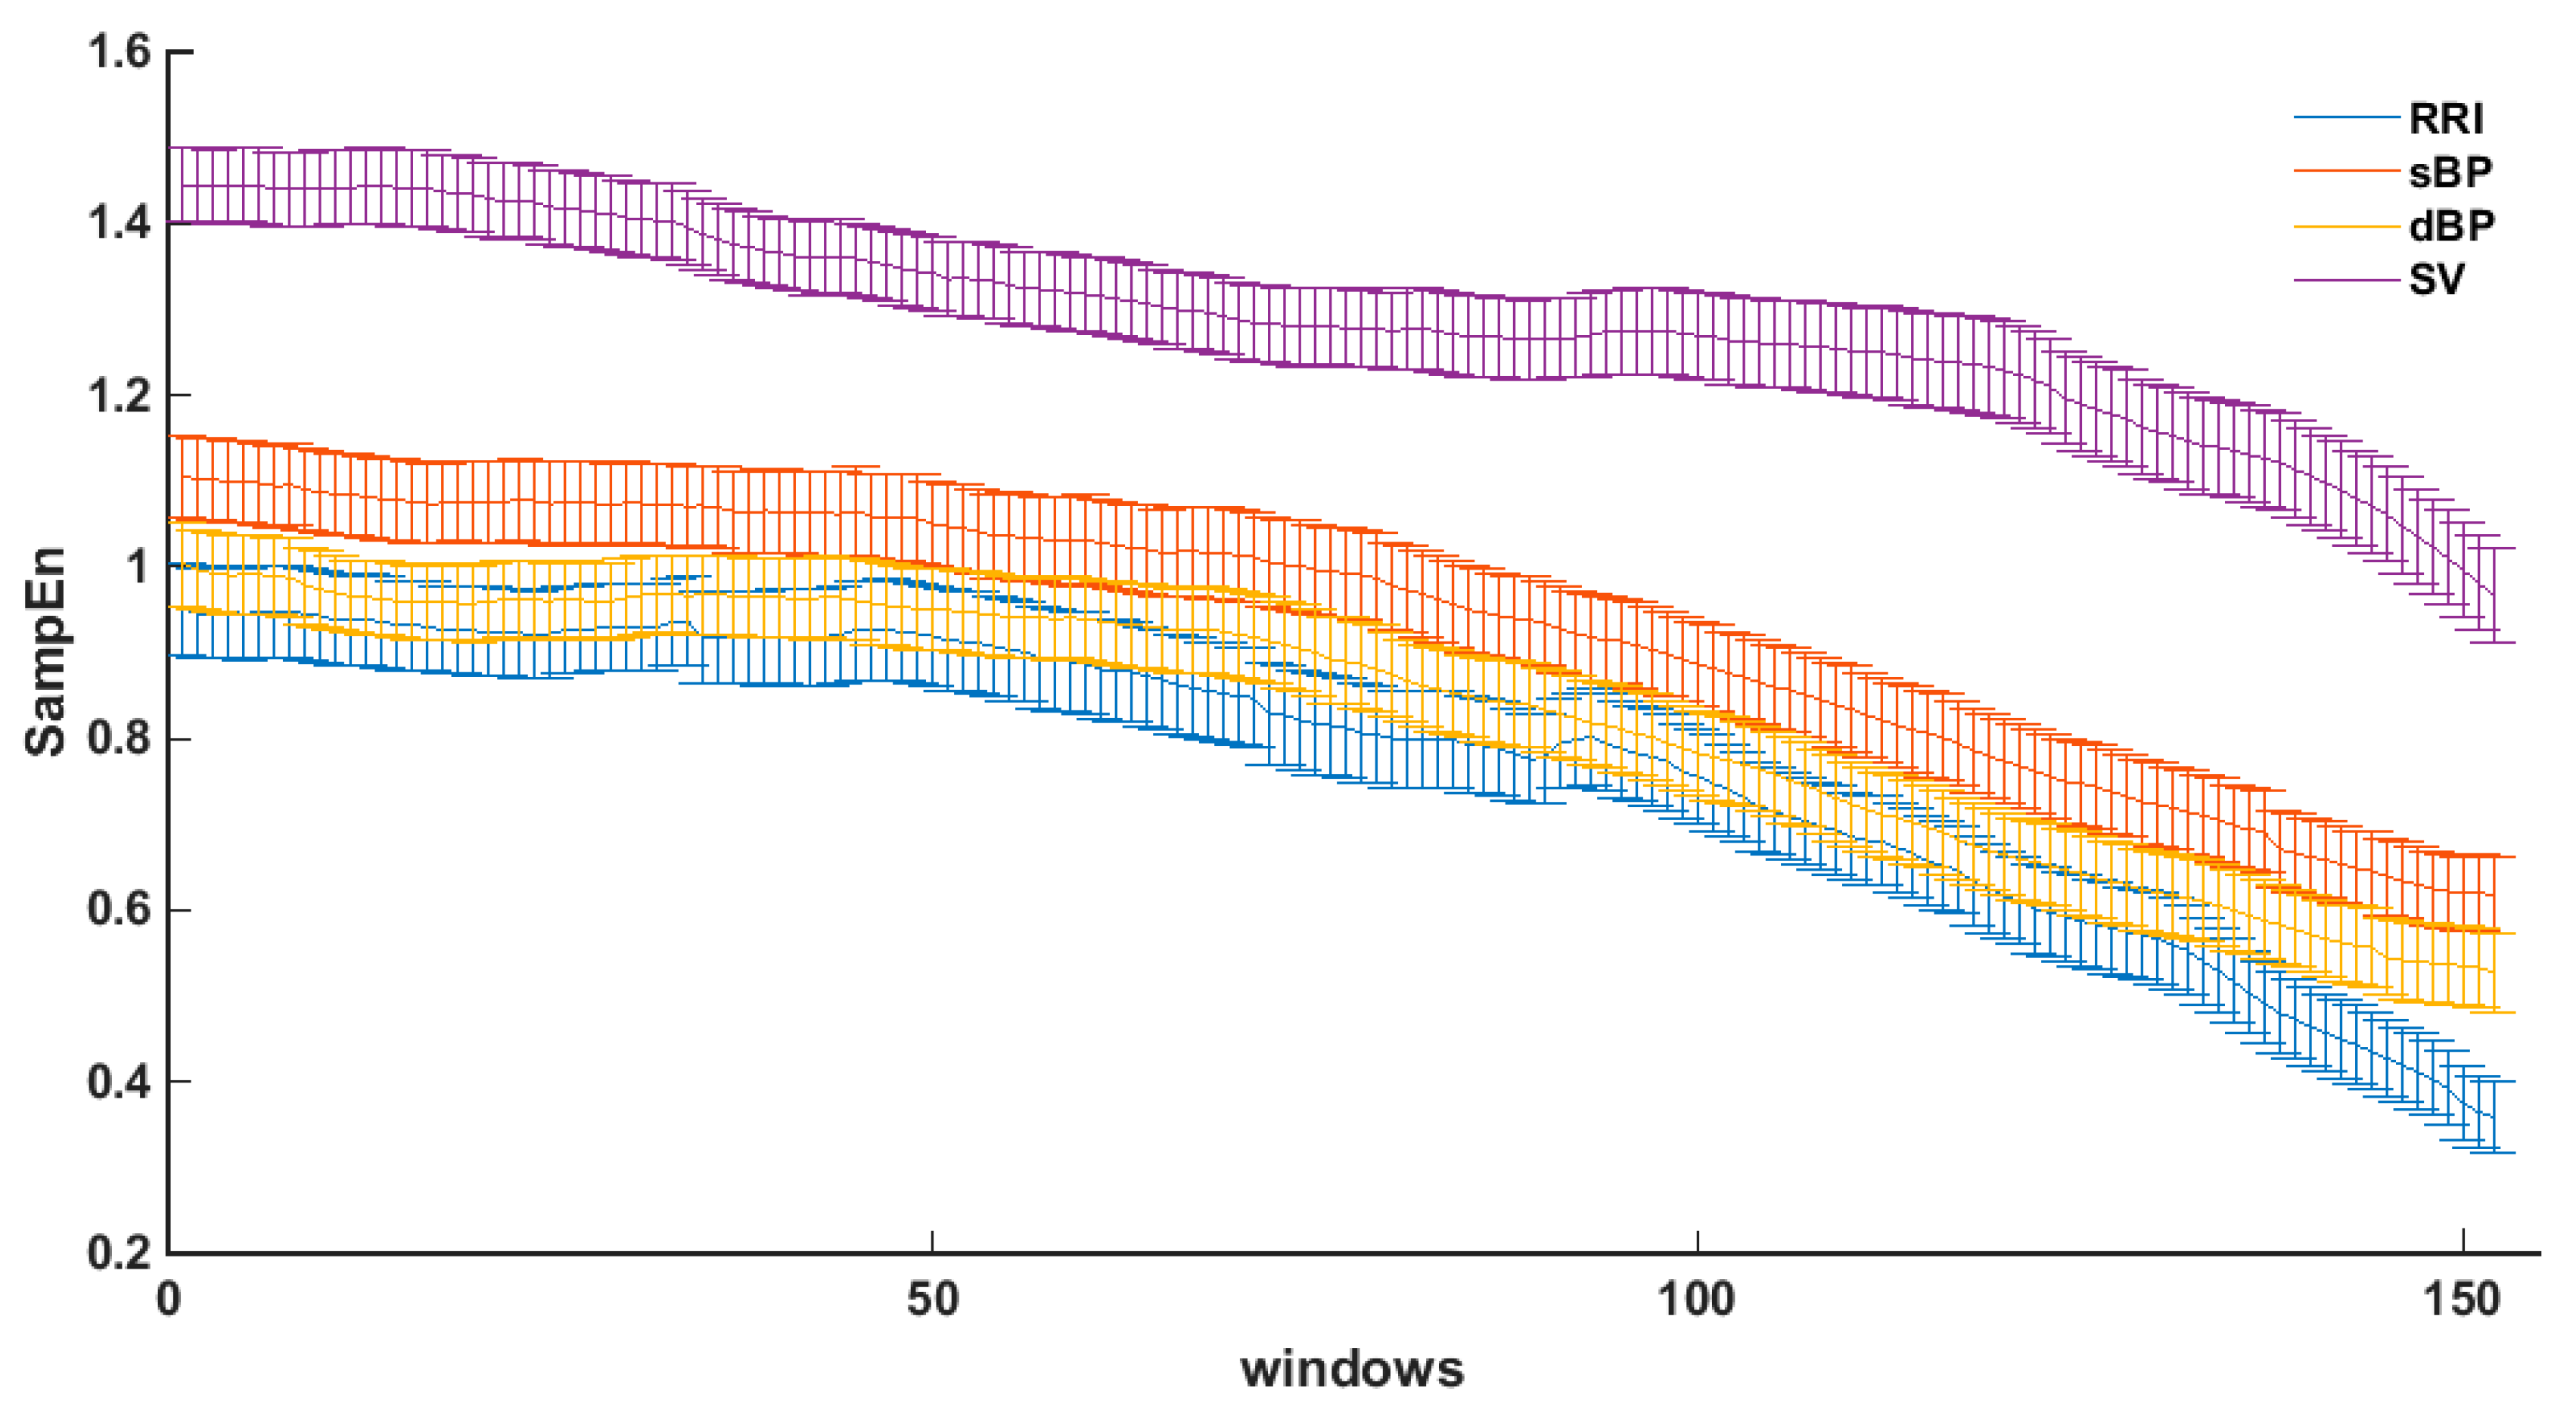
3.2. Sample Entropy in Sliding Windows
4. Discussion
5. Limitations
Acknowledgments
Author Contributions
Conflicts of Interest
References
- Moya, A.; Sutton, R.; Ammirati, F.; Blanc, J.-J.; Brignole, M.; Dahm, J.B.; Deharo, J.-C.; Gajek, J.; Gjesdal, K.; Krahn, A.; et al. Guidelines for the diagnosis and management of syncope. Eur. Heart J. 2009, 30, 1–41. [Google Scholar]
- Parry, S.W.; Reeve, P.; Lawson, J.; Shaw, F.E.; Davison, J.; Norton, M.; Frearson, R.; Kerr, S.; Newton, J.L. The Newcastle Protocols 2008: An update on head-up tilt table testing and the management of vasovagal syncope and related disorders. Heart 2009, 95, 416–420. [Google Scholar] [CrossRef] [PubMed]
- Mosqueda-Garcia, R.; Furlan, R.; Tank, J.; Fernandez-Violante, R. The elusive pathophysiology of neurally mediated syncope. Circulation 2000, 102, 2898–2906. [Google Scholar] [CrossRef] [PubMed]
- Abboud, F.M. Neurocardiogenic syncope. NEJM 1993, 328, 1117–1120. [Google Scholar] [CrossRef] [PubMed]
- Flevari, P.P.; Livanis, E.G.; Theodorakis, G.N.; Mesiskli, T.; Zarvalis, E.; Kremastinos, D.T. Baroreflexes in vasovagal syncope: Two types of abnormal response. Pacing Clin. Electrophysiol. 2002, 25, 1315–1323. [Google Scholar] [CrossRef] [PubMed]
- Alboni, P.; Alboni, M.; Bertorelle, G. The origin of vasovagal syncope: To protect the heart or to escape predation? Clin. Auton. Res. 2008, 18, 170–178. [Google Scholar] [CrossRef] [PubMed]
- Heart Rate Variability. Available online: https://doi.org/10.1161/01.CIR.93.5.1043 (accessed on 19 May 2017).
- Denton, T.A.; Diamond, G.A.; Helfant, R.H.; Khan, S.; Karagueuzian, H. Fascinating rhythm: A primer on chaos theory and its application to cardiology. Am. Heart J. 1990, 120, 1419–1440. [Google Scholar] [CrossRef]
- Goldberger, A.L. Non-linear dynamics for clinicians: Chaos theory, fractals, and complexity at the bedside. Lancet 1996, 347, 1312–1314. [Google Scholar] [CrossRef]
- Algra, A.; Tijssen, J.G.; Roelandt, J.R.; Pool, J.; Lubsen, J. Heart rate variability from 24-hour electrocardiography and the 2-year risk for sudden death. Circulation 1993, 88, 180–185. [Google Scholar] [CrossRef] [PubMed]
- Pagani, M.; Lombardi, F.; Guzzetti, S.; Rimoldi, O.; Furlan, R.; Pizzinelli, P.; Sandrone, G.; Malfatto, G.; Dell’Orto, S.; Piccaluga, E.; et al. Power spectral analysis of heart rate and arterial pressure variabilities as a marker of sympatho-vagal interaction in man and conscious dog. Circ. Res. 1986, 59, 178–193. [Google Scholar] [CrossRef] [PubMed]
- Malliani, A.; Pagani, M.; Lombardi, F.; Cerutti, S. Cardiovascular neural regulation explored in the frequency domain. Circulation 1991, 84, 482–492. [Google Scholar] [CrossRef] [PubMed]
- Lahiri, M.K.; Kannankeril, P.J.; Goldberger, J.J. Assessment of autonomic function in cardiovascular disease. Physiological basis and prognostic significance. J. Am. Coll. Cardiol. 2008, 51, 1725–1733. [Google Scholar] [CrossRef] [PubMed]
- Brignole, M.; Menozzi, C.; Del Rosso, A.; Costa, S.; Gaggioli, G.; Bottoni, N.; Bartoli, P.; Sutton, R. New classification of hemodynamics of vasovagal syncope: Beyond the VASIS classification. Analysis of the pre-syncopal phase of the tilt test without and with nitroglycerin challenge. Vasovagal Syncope International Study. Europace 2000, 2, 66–76. [Google Scholar] [CrossRef] [PubMed]
- Demarzo, A.P. Using impedance cardiography to detect asymptomatic cardiovascular disease in prehypertensive adults with risk factors. High Blood Press. Cardiovasc. Prev. 2013, 20, 61–67. [Google Scholar] [CrossRef] [PubMed]
- Cybulski, G. Ambulatory Impedance Cardiography. The Systems and Their Applications, 1st ed.; Lecture Notes in Electrical Engineering; Springer: Berlin, Germany, 2011; Volume 76, p. 150. [Google Scholar]
- Cybulski, G.; Strasz, A.; Niewiadomski, W.; Gąsiorowska, A. Impedance cardiography: Recent advancements. Cardiol. J. 2012, 19, 550–556. [Google Scholar] [CrossRef] [PubMed]
- Parry, S.W.; Norton, M.; Pairman, J.; Baptist, M.; Wilton, K.; Reeve, P.; Sutcliffe, K.; Newton, J.L. Impedance cardiography: A role in vasovagal syncope diagnosis? Age Ageing 2009, 38, 718–723. [Google Scholar] [CrossRef] [PubMed]
- Pincus, S.M. Approximate entropy as a measure of system complexity. Proc. Natl. Acad. Sci. USA 1991, 88, 2297–2301. [Google Scholar] [CrossRef] [PubMed]
- Richman, J.S.; Moorman, J.R. Physiological time-series analysis using approximate entropy and sample entropy. Am. J. Physiol. Heart Circ. Physiol. 2000, 278, 2039–2049. [Google Scholar]
- Vikman, S.; Mäkikallio, T.H.; Yli-Mäyry, S.; Pikkujämsä, S.; Koivisto, A.M.; Reinikainen, P.; Airaksinen, J.; Huikuri, H.V. Altered Complexity and Correlation Properties of R-R Interval Dynamics Before the Spontaneous Onset of Paroxysmal Atrial Fibrillation. Circulation 1999, 100, 2079–2084. [Google Scholar] [CrossRef] [PubMed]
- Tuzcu, V.; Nas, S.; Borklu, T.; Ugur, A. Decrease in the heart rate complexity prior to the onset of atrial fibrillation. Europace 2006, 8, 398–402. [Google Scholar] [CrossRef] [PubMed]
- Shin, D.G.; Yoo, C.S.; Yi, S.H.; Bae, J.H.; Kim, Y.J.; Park, J.S.; Hong, G.R. Prediction of Paroxysmal Atrial Fibrillation Using Nonlinear Analysis of the R-R Interval Dynamics Before the Spontaneous Onset of Atrial Fibrillation. Circ. J. 2006, 70, 94–99. [Google Scholar] [CrossRef] [PubMed]
- Graff, B.; Graff, G.; Makowiec, D.; Kaczkowska, A.; Wejer, D.; Budrejko, S.; Kozłowski, D.; Narkiewicz, K. Entropy Measures in the Assessment of Heart Rate Variability in Patients with Cardiodepressive Vasovagal Syncope. Entropy 2015, 17, 1007–1022. [Google Scholar] [CrossRef]
- Deffeyes, J.E.; Harbourne, R.T.; Stuberg, W.A.; Stergiou, N. Approxcimate entropy used to asses sitting postural sway of infants with developmental delay. Infant Behav. Dev. 2011, 34, 81–99. [Google Scholar] [CrossRef] [PubMed]
- Rhea, C.K.; Silver, T.A.; Hong, S.L.; Ryu, J.H.; Studenka, B.E.; Hughes, M.L.; Haddad, J.M. Noise and complexcity in human postural control: Interpreting the different estimations of entropy. PLoS ONE 2001, 6, e17696. [Google Scholar] [CrossRef]
- Cavanaugh, J.T.; Kochi, N.; Stergiou, N. Nonlinear analysis of ambulatory activity patterns in community-dwelling older adults. J. Gerontol. Ser. A Biol. Sci. Med. Sci. 2010, 65, 197–203. [Google Scholar] [CrossRef] [PubMed]
- Sosnoff, J.J.; Goldman, M.D.; Motl, R.W. Real life walking impairment in multiple sclerosis: Preliminary comparison of four methods for processing accelerometry data. Mult. Scler. 2010, 16, 868–877. [Google Scholar] [CrossRef] [PubMed]
- Pincus, S.; Huang, W. Approximate entropy-statistical properties and applications. Commun. Stat. Theory Methods 1992, 21, 3061–3077. [Google Scholar] [CrossRef]
- Pincus, S. Approximate entropy as a complexity measure. Chaos 1995, 5, 110–117. [Google Scholar] [CrossRef] [PubMed]
- Graff, B.; Graff, G.; Kolesiak, A. Entropia w badaniach zaburzeń rytmu serca. Mat. Stosow. 2008, 9, 46–52. [Google Scholar]
- PhysioToolkit. Available online: https://www.physionet.org/physiotools/ (accessed on 15 January 2017).
- Ferrario, M.; Signorini, M.G.; Magenes, G.; Cerutti, S. Comparison of Entropy-Based Regularity Estimators: Application to the Fetal Heart Rate Signal for the Identification of Fetal Distress. IEEE Trans. Biomed. Eng. 2006, 53, 119–125. [Google Scholar] [CrossRef] [PubMed]
- Graff, B.; Graff, G.; Kaczkowska, A. Entropy Measures of Heart Rate Variability for Short ECG Datasets in Patients with Congestive Heart Failure. Acta Phys. Pol. B Proc. Suppl. 2012, 5, 153–158. [Google Scholar] [CrossRef]
- Liu, C.; Liu, C.; Shao, P.; Li, L.; Sun, X.; Wang, X.; Liu, F. Comparison of different threshold values r for approximate entropy: Application to investigate the heart rate variability between heart failure and healthy control groups. Physiol. Meas. 2011, 32, 167–180. [Google Scholar] [CrossRef] [PubMed]
- Sarlabous, L.; Torres, A.; Fiz, J.A.; Gea, J.; Martinez-Llorens, J.; Morera, J.; Jane, R. Interpretation of the approximate entropy using fixed tolerance values as a measure of amplitude variations in biomedical signals. IEEE Conf. Proc. Eng. Med. Biol. Soc. 2010, 2010, 5967–5970. [Google Scholar]
- Yentes, J.M.; Hunt, N.; Schmid, K.K.; Kaipust, J.P.; McGrath, D.; Stergiou, N. The Appropriate Use of Approximate Entropy and Sample Entropy with Short Data Sets. Ann. Biomed. Eng. 2013, 41, 349–365. [Google Scholar] [CrossRef] [PubMed]
- Chon, K.; Scully, C.G.; Lu, S. Approximate entropy for all signals. IEEE Eng. Med. Biol. Mag. 2009, 28, 18–23. [Google Scholar] [CrossRef] [PubMed]
- Pincus, S.M.; Goldberger, A.L. Physiological time-series analysis: What does regularity quantify? Am. J. Physiol. Heart Circ. Physiol. 1994, 266, H1643–H1656. [Google Scholar]
- Dawes, G.S.; Moulden, M.; Sheil, O.; Redman, C.W. Approximate entropy, a statistic of regularity, applied to fetal heart rate data before and during labor. Obstet. Gynecol. 1992, 80, 763–768. [Google Scholar] [PubMed]
- Fleisher, L.A.; DiPietro, J.A.; Johnson, T.R.; Pincus, S. Complementary and noncoincident increases in heart rate variability and irregularity during fetal development. Clin. Sci. 1997, 92, 345–349. [Google Scholar] [CrossRef] [PubMed]
- Fleisher, L.A.; Pincus, S.M.; Rosenbaum, S.H. Approximate entropy of heart rate as a correlate of postoperative ventricular dysfunction. Anesthesiology 1993, 78, 683–692. [Google Scholar] [CrossRef] [PubMed]
- Koźluk, E.; Cybulski, G.; Piątkowska, A.; Zastawna, I.; Niewiadomski, W.; Strasz, A.; Gąsiorowska, A.; Kempa, M.; Kozłowski, D.; Opolski, G. Early hemodynamic response to the tilt test in patients with syncope. Clin. Res. 2014, 10, 1078–1085. [Google Scholar] [CrossRef] [PubMed]
- Zaidi, A.; Benitez, D.; Gaydecki, P.; Vohra, A.; Fitzpatrick, A. Haemodynamic effects of increasing angle of head up tilt. Heart 2000, 83, 181–184. [Google Scholar] [CrossRef] [PubMed]
- Shen, W.K.; Low, P.A.; Rea, R.F.; Lohse, C.M.; Hodge, D.O.; Hammill, S.C. Distinct hemodynamic profiles in patients with vasovagal syncope: A heterogeneous population. J. Am. Coll. Cardiol. 2000, 35, 1470–1477. [Google Scholar] [CrossRef]
- Bellard, E.; Fortrat, J.O.; Schang, D.; Dupuis, J.M.; Victor, J.; Leftheriotis, G. Changes in the transthoracic impedance signal predict the outcome of a 70 degrees head-up tilt test. Clin. Sci. (Lond.) 2003, 104, 119–126. [Google Scholar] [PubMed]
- Colman, N.; Nahm, K.; Ganzeboom, K.S.; Shen, W.K.; Reitsma, J.B.; Linzer, M.; Wieling, W.; Kaufmann, H. Epidemiology of reflex syncope. Clin. Auton. Res. 2004, 14, i/9–i/17. [Google Scholar] [CrossRef] [PubMed]
- Kenny, R.A.; Bhangu, J.; King-Kallimanis, B.L. Epidemiology of syncope/collapse in younger and older Western patient populations. Prog. Cardiovasc. Dis. 2013, 55, 357–363. [Google Scholar] [CrossRef] [PubMed]
- Ryan, S.M.; Goldberger, A.L.; Pincus, S.M.; Mietus, J.; Lipsitz, L.A. Gender- and age-related differences in heart rate dynamics: Are women more complex than men? J. Am. Coll. Cardiol. 1994, 24, 1700–1707. [Google Scholar] [CrossRef]
- Catai, A.M.; Takahashi, A.C.; Perseguini, N.M.; Milan, J.C.; Minatel, V.; Rehder-Santos, P.; Marchi, A.; Bari, V.; Porta, A. Effect of the Postural Challenge on the Dependence of the Cardiovascular Control Complexity on Age. Entropy 2014, 16, 6686–6704. [Google Scholar] [CrossRef]


| Parameter | I | II | III |
|---|---|---|---|
| RRI (ms) | 854.23 ± 111.75 | 694.72 ± 113.70 | 668.65 ± 143.26 |
| sBP (mmHg) | 118.61 ± 25.4 | 121.19 ± 16.79 | 101.60 ± 10.56 |
| dBP (mmHg) | 68.08 ± 19.75 | 85.94 ± 14.92 | 67.17 ± 11.21 |
| SV (mL) | 89.93 ± 18.73 | 66.60 ± 10.27 | 61.79 ± 9.11 |
| ApEn (RRI) | 0.98 ± 0.19 | 0.75 ± 0.26 | 0.32 ± 0.22 |
| ApEn (sBP) | 0.73 ± 0.31 | 0.70 ± 0.26 | 0.46 ± 0.23 |
| ApEn (dBP) | 0.75 ± 0.30 | 0.66 ± 0.24 | 0.38 ± 0.23 |
| ApEn (SV) | 0.93 ± 0.19 | 0.72 ± 0.21 | 0.79 ± 0.26 |
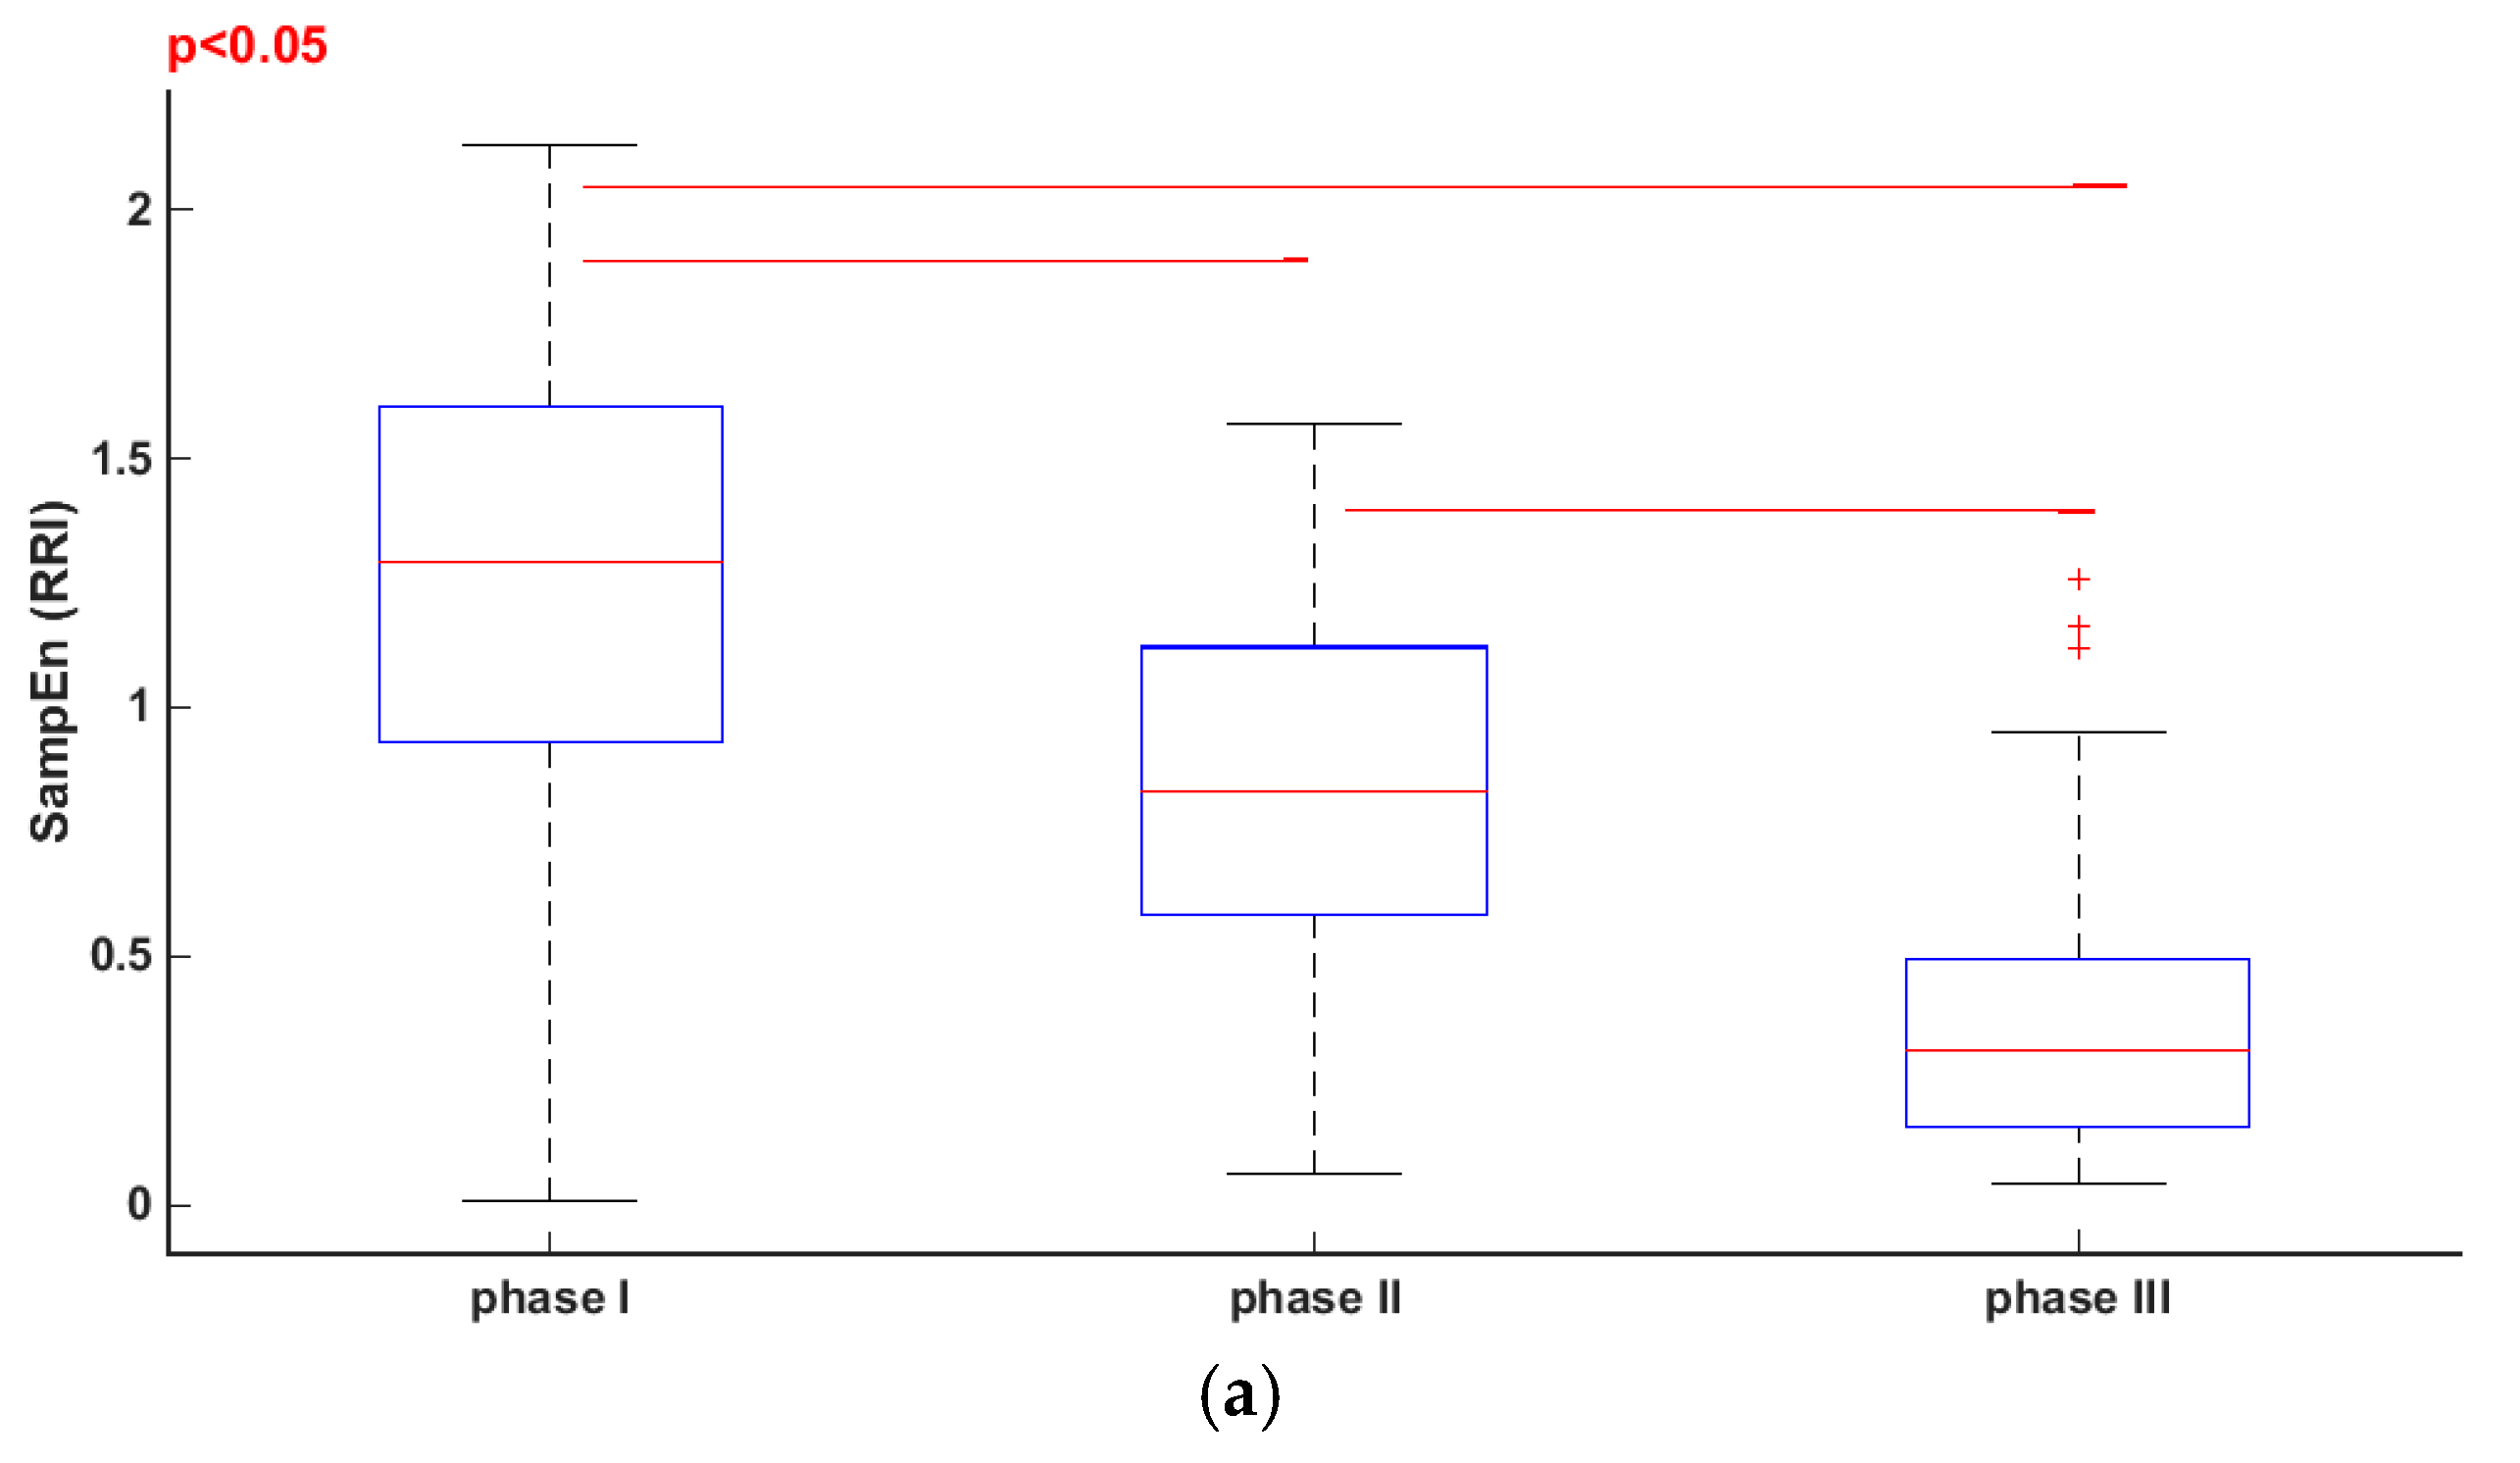
| SampEn (RRI) | 1.24 ± 0.46 | 0.86 ± 0.35 | 0.36 ± 0.26 |
| SampEn (sBP) | 0.88 ± 0.45 | 0.82 ± 0.36 | 0.51 ± 0.27 |
| SampEn (dBP) | 0.91 ± 0.41 | 0.76 ± 0.31 | 0.41 ± 0.27 |
| SampEn (SV) | 1.16 ± 0.32 | 0.80 ± 0.29 | 0.95 ± 0.38 |
| Parameter | |||||
|---|---|---|---|---|---|
| sBP (mmHg) | 133 ± 3.13 | 63 ± 19.72 | 69 ± 66 | 237 ± 25 | 160 ± 73 |
| dBP (mmHg) | 88 ± 21 | 36 ± 21 | 63 ± 59 | 236 ± 29 | 172 ± 66 |
| Parameter | |||
|---|---|---|---|
| RRI | 1.20 ± 0.41 | 0.34 ± 0.30 | 96 ± 40 |
| sBP | 1.29 ± 0.37 | 0.57 ± 0.34 | 82 ± 41 |
| dBP | 1.19 ± 0.36 | 0.48 ± 0.34 | 83 ± 44 |
| SV | 1.62 ± 0.33 | 0.91 ± 0.40 | 89 ± 45 |
© 2017 by the authors. Licensee MDPI, Basel, Switzerland. This article is an open access article distributed under the terms and conditions of the Creative Commons Attribution (CC BY) license (http://creativecommons.org/licenses/by/4.0/).
Share and Cite
Buszko, K.; Piątkowska, A.; Koźluk, E.; Opolski, G. Entropy in Investigation of Vasovagal Syndrome in Passive Head Up Tilt Test. Entropy 2017, 19, 236. https://doi.org/10.3390/e19050236
Buszko K, Piątkowska A, Koźluk E, Opolski G. Entropy in Investigation of Vasovagal Syndrome in Passive Head Up Tilt Test. Entropy. 2017; 19(5):236. https://doi.org/10.3390/e19050236
Chicago/Turabian StyleBuszko, Katarzyna, Agnieszka Piątkowska, Edward Koźluk, and Grzegorz Opolski. 2017. "Entropy in Investigation of Vasovagal Syndrome in Passive Head Up Tilt Test" Entropy 19, no. 5: 236. https://doi.org/10.3390/e19050236
APA StyleBuszko, K., Piątkowska, A., Koźluk, E., & Opolski, G. (2017). Entropy in Investigation of Vasovagal Syndrome in Passive Head Up Tilt Test. Entropy, 19(5), 236. https://doi.org/10.3390/e19050236