1. Introduction
In last few years, significant research efforts have devoted to improving the efficiency of Combined Cycle (CC) systems which have become the most common option for thermoelectric power plants. Different strategies have been implemented to this end. Among these, the possible coupling between CCs and renewable sources (especially the solar power) seems to be extremely promising. In many cases, solar energy is converted into high temperature thermal energy to drive a bottomed Rankine cycle, enhancing CCs power production. In this framework, the Integrated Solar Combined Cycle Power Plant (ISCC), proposed for the first time in the 1990 by Luz Solar International and integrating a parabolic trough solar field and a solar steam generator with modern CC power plants, is the most common technology in the power generation sector [
1]. This arrangement is very attractive since the highest power demand occurs when the incident solar radiation is also maximum. Several studies are available in literature regarding ISCCs [
2,
3]. As an example, Behar et al. [
4] presented and evaluated the performance of an ISCC system with a single pressure level. According to the simulation results, the output capacity and the efficiency of ISCCs will be above the combined cycle regime by 17% and 16.5%, respectively. An increase of steam turbine capacity by 50% at the design point is another advantage of the proposed design. On the other hand, in ISCC systems, fluctuant solar heat can be delivered only to the Rankine Cycle, determining an off-design operation of the steam turbine. In such case, turbine isentropic efficiency may dramatically decrease, significantly affecting the overall system efficiency. To avoid operating problems, the solar contribution in real ISCC plants is limited to 10% of Combined Cycle nominal capacity.
It is also well known that CCs are particularly sensitive to ambient temperature variations since the efficiency and the capacity of the gas cycle may decrease dramatically for higher ambient temperatures. As a consequence, CCs’ output power falls by 0.5% and 0.9% for every 1 °C ambient temperature rise [
5]. When the ambient temperatures reach 35 °C, outputs may have decreased by as much as 20% and heat rates increased by 5%. For this reason, for over twenty years, several inlet air cooling systems [
6,
7] have been developed to increase the power obtained by gas turbines or CC power plants, particularly in hot weather zones. The inlet air in a CC is typically cooled using the following techniques, analysed in several references:
Wetted media evaporative cooling [
8], suitable for hot dry areas as it uses the latent heat of vaporisation to cool the ambient temperature from the dry-bulb to the wet-bulb temperature;
High-pressure fogging [
9], consisting of cooling to wet-bulb temperature at 100% humidity by high-pressure spraying of water droplets into air-inlet ducts;
Refrigerative cooling using mechanical or electrical Vapour Compression Refrigeration (VCR) equipment [
10];
Absorption CHiller (ACH) cooling [
11], using heat to produce chilled water in a double stage LiBr-H
2O thermally-driven chiller for cooling the inlet air.
In ACH systems, the chiller may be supplied either by the heat of CC flue gases or by other sources (e.g., solar). In this case, the power plant obtained by coupling a solar cooling system (solar field & ACH) and a CC power plant is typically called Solar Assisted Combined Cycle (SACC), as the solar energy is indirectly involved in power generation [
12]. The appropriate selection of ACH and solar collectors operating temperatures is crucial in order to achieve high efficiency and good economic profitability [
13]. In particular, when non-concentrating solar thermal collectors (e.g., evacuated tubes) [
14] are used, single stage ACHs must be selected, because of their lower driving temperature (>80 °C) [
15]. However, in this case solar heat may be replaced by the more convenient heat provided by the gas flue gases, depending on the outlet flue gas temperature (which is function of the number of pressure levels of the CCs). Conversely, when high-temperature solar thermal collectors (>140 °C) [
16] are considered, double stage ACHs may be used. According to the findings available in literature, such result is generally achieved by concentrating solar thermal collectors [
17].
In the authors’ knowledge, whilst many papers in the literature investigate ISCC systems, only a few works have analysed the performance of SACC systems. In particular, a recent work was developed by Popov [
12]. Here two SACC plants were analysed and compared. The first one coupled an absorption chiller with linear Fresnel reflectors; the second one consists of a photovoltaic field producing the electricity required by a VCR chiller. The obtained numerical results showed that the second configuration exhibits lower specific incremental plant capital costs and requires a smaller land area than the other one. None of SACC systems investigated in the literature appropriately consider the variable weather conditions nor do they feature a high temperature solar cooling system coupled to non-concentrating stationary solar thermal collectors or thermal storage tanks. The innovative system presented in this paper includes a double stage absorption chiller, fed by a novel stationary vacuum non-concentrating flat-plate solar collector, the prototypal pre-commercial HT-Power collectors v4.3, optimized for the higher temperature applications, manufactured by TVP Solar [
18].
The SACC system was designed in order to cool the inlet air required by the compressor of a CC power plant, enhancing in this way system efficiency and electrical capacity. An initial analysis of this novel system layout has been recently presented by the authors showing the energetic model and energetic and economic performance of the system under investigation [
19]. In the present paper, the analysis of the system has been further improved, implementing a detailed exergy analysis aiming at detecting the sources and the magnitudes of the irreversibilities within the system in order to improve the efficiency of the overall system.
As just mentioned, the aim of this paper is to develop a comprehensive exergy analysis of the novel SACC system under investigation. In fact, the few works cited before regarding similar SACC system only address the energetic balances, neglecting to investigate the sources and the magnitude of the irreversibilities within the plant. Such analysis can be efficiently performed by implementing the well-known technique of the exergy analysis which combines the first and second laws of thermodynamics in order to better analyze irreversibilities [
20,
21,
22]. Exergy analysis was diffusely used in literature in order to investigate the sources and magnitudes of irreversibilities in both solar heating and cooling systems and combined cycle power plants. As for combined cycles, the exergy analysis is often used in order to analyze novel system configurations. As an example, Sharma et al. [
23] investigated a dual pressure heat recovery steam generator for a combined cycle. They applied an exergy analysis to the selected component and they found that the high pressure and low pressure superheaters are the major responsibles for exergy destruction. Boyaghichi et al. [
24] implemented an advanced exergy analysis and a multi-objective optimization for a real combined cycle power plant equipped with direct burners and located in Iran. They found that more than half of the total exergy destruction is due to the gas turbine combustion chamber, which destroys about 62% of the inlet exergy fuel. They also calculated the total avoidable exergy destruction which was about 27.16% and that the maximum exergy destruction rate which can be improved belongs to combustion chamber including 34.8% of total avoidable exergy destruction rate. Similar results were obtained by another study [
25] of the same authors who applied the endogenous/exogenous exergy theory to the same system layout. They found that the avoidable exergy destruction is greater than the unavoidable one and that the potential improvement of the exergy destruction is just 27.16% of the total exergy destruction. Several exergetic analyses were also presented by Dincer et al. [
26,
27,
28,
29,
30,
31,
32,
33,
34], investigating a number of possible configurations, including: fuel cells, coal gasification, Organic Rankine Cycles, geothermal energy, solar energy, etc. For example in reference [
27] they investigated a simple gas/steam combined cycles including energy, exergy, exergoeconomic and exergoenvironmental analyses. From the exergetic point of view, they found that more than 50% of the overall exergy destruction was due to the combustion chamber. They also found an overall exergy efficiency ranging from 51% to 53%, depending on the pressure ratio. Many other exergy analyses of different combined cycles are available in literature [
35]. Similarly, dozens of papers presenting different exergy analyses of solar heating and cooling systems are available in literature [
36,
37,
38,
39,
40,
41,
42]. In all those analyses, a key point is represented by the calculation of the exergy related to the solar radiation. According to the approach presented by Petela, the solar heat is available by a high temperature thermal reservoir. As a consequence, very high exergy destructions are expected by the solar collector due the huge temperature difference between collector temperature and equivalent sun temperature [
43]. In fact, Koronaki et al. [
40] found solar collector exergy efficiency ranging from 2% to 11%, depending on the type of solar collector. The overall exergetic efficiency of the solar cooling system ranged from 0.3% to 1.8% depending on the period of the year and on the weather conditions. A similar study was performed by Bellos et al. [
44]. By a simplified thermodynamic model of the absorption chiller considering generator, air water and absorber at constant temperature, they found that the exergy efficiency of the chiller varied from 26% to 36% depending on the boundary conditions (hot, cold and chilled streams temperatures). However, when fluid temperature variation is considered exergy efficiency dramatically decreases [
45]. In this study [
44] solar collector exergetic efficiency varies from 2% to 3% whereas the overall system exergetic efficiency ranged from 3% to 5.5%.
The exergetic performance of single and double effect absorption chillers was analyzed in detail by Kaushik et al. [
45]. They showed a non-monotonic trend of exergy efficiency for both single and double effect absorption chiller as a function of generator temperature. The optimal exergetic generator temperature depends on the environment temperature. Both single effect and double effect exergetic efficiencies ranged from 10% to 20% depending on both generator and environment temperatures. Bouazis et al. [
38] investigated a solar cooling system equipped with a novel absorption/compression hybrid system operating with water-ammonia. They found that their novel system presented a lower exergy destruction with respect to a conventional cycle. The exergetic efficiency of the novel absorption/compression system ranged about from 10% to 30%, depending on generator, evaporating and condensing temperatures. In another study [
41], it was found that solar collector exergetic efficiency was about 5%, whereas the exergetic efficiency of the overall solar cooling system was about 9.6%.
As a summary, several papers are available in the literature analyzing the energy performance of CC and solar heating and cooling systems. Similarly, a number of papers have analyzed separately the exergetic performance of CCs and solar cooling systems. However, to the authors’ best knowledge none of those papers have applied the exergy analysis to the system as whole, i.e., to the novel SACC system presented in this paper. Therefore, this work aims at improving the knowledge about this topic providing an in-depth analysis of SACC irreversibilities. On the basis of the energetic model recently presented by the authors [
19], detailed exergy balances are implemented for all the components and for the system as whole. Then, the most significant exergy performance parameters (exergy efficiency, exergy destruction, etc.) are calculated in order to assess the overall exergy performance of the system.
2. System Layout
As mentioned before, an initial study regarding the novel SACC proposed in this paper was recently presented by the authors in reference [
19]. Here, the system layout and the energetic model is presented. However, for sake of clarity a brief description of system layout is also reported in this section.
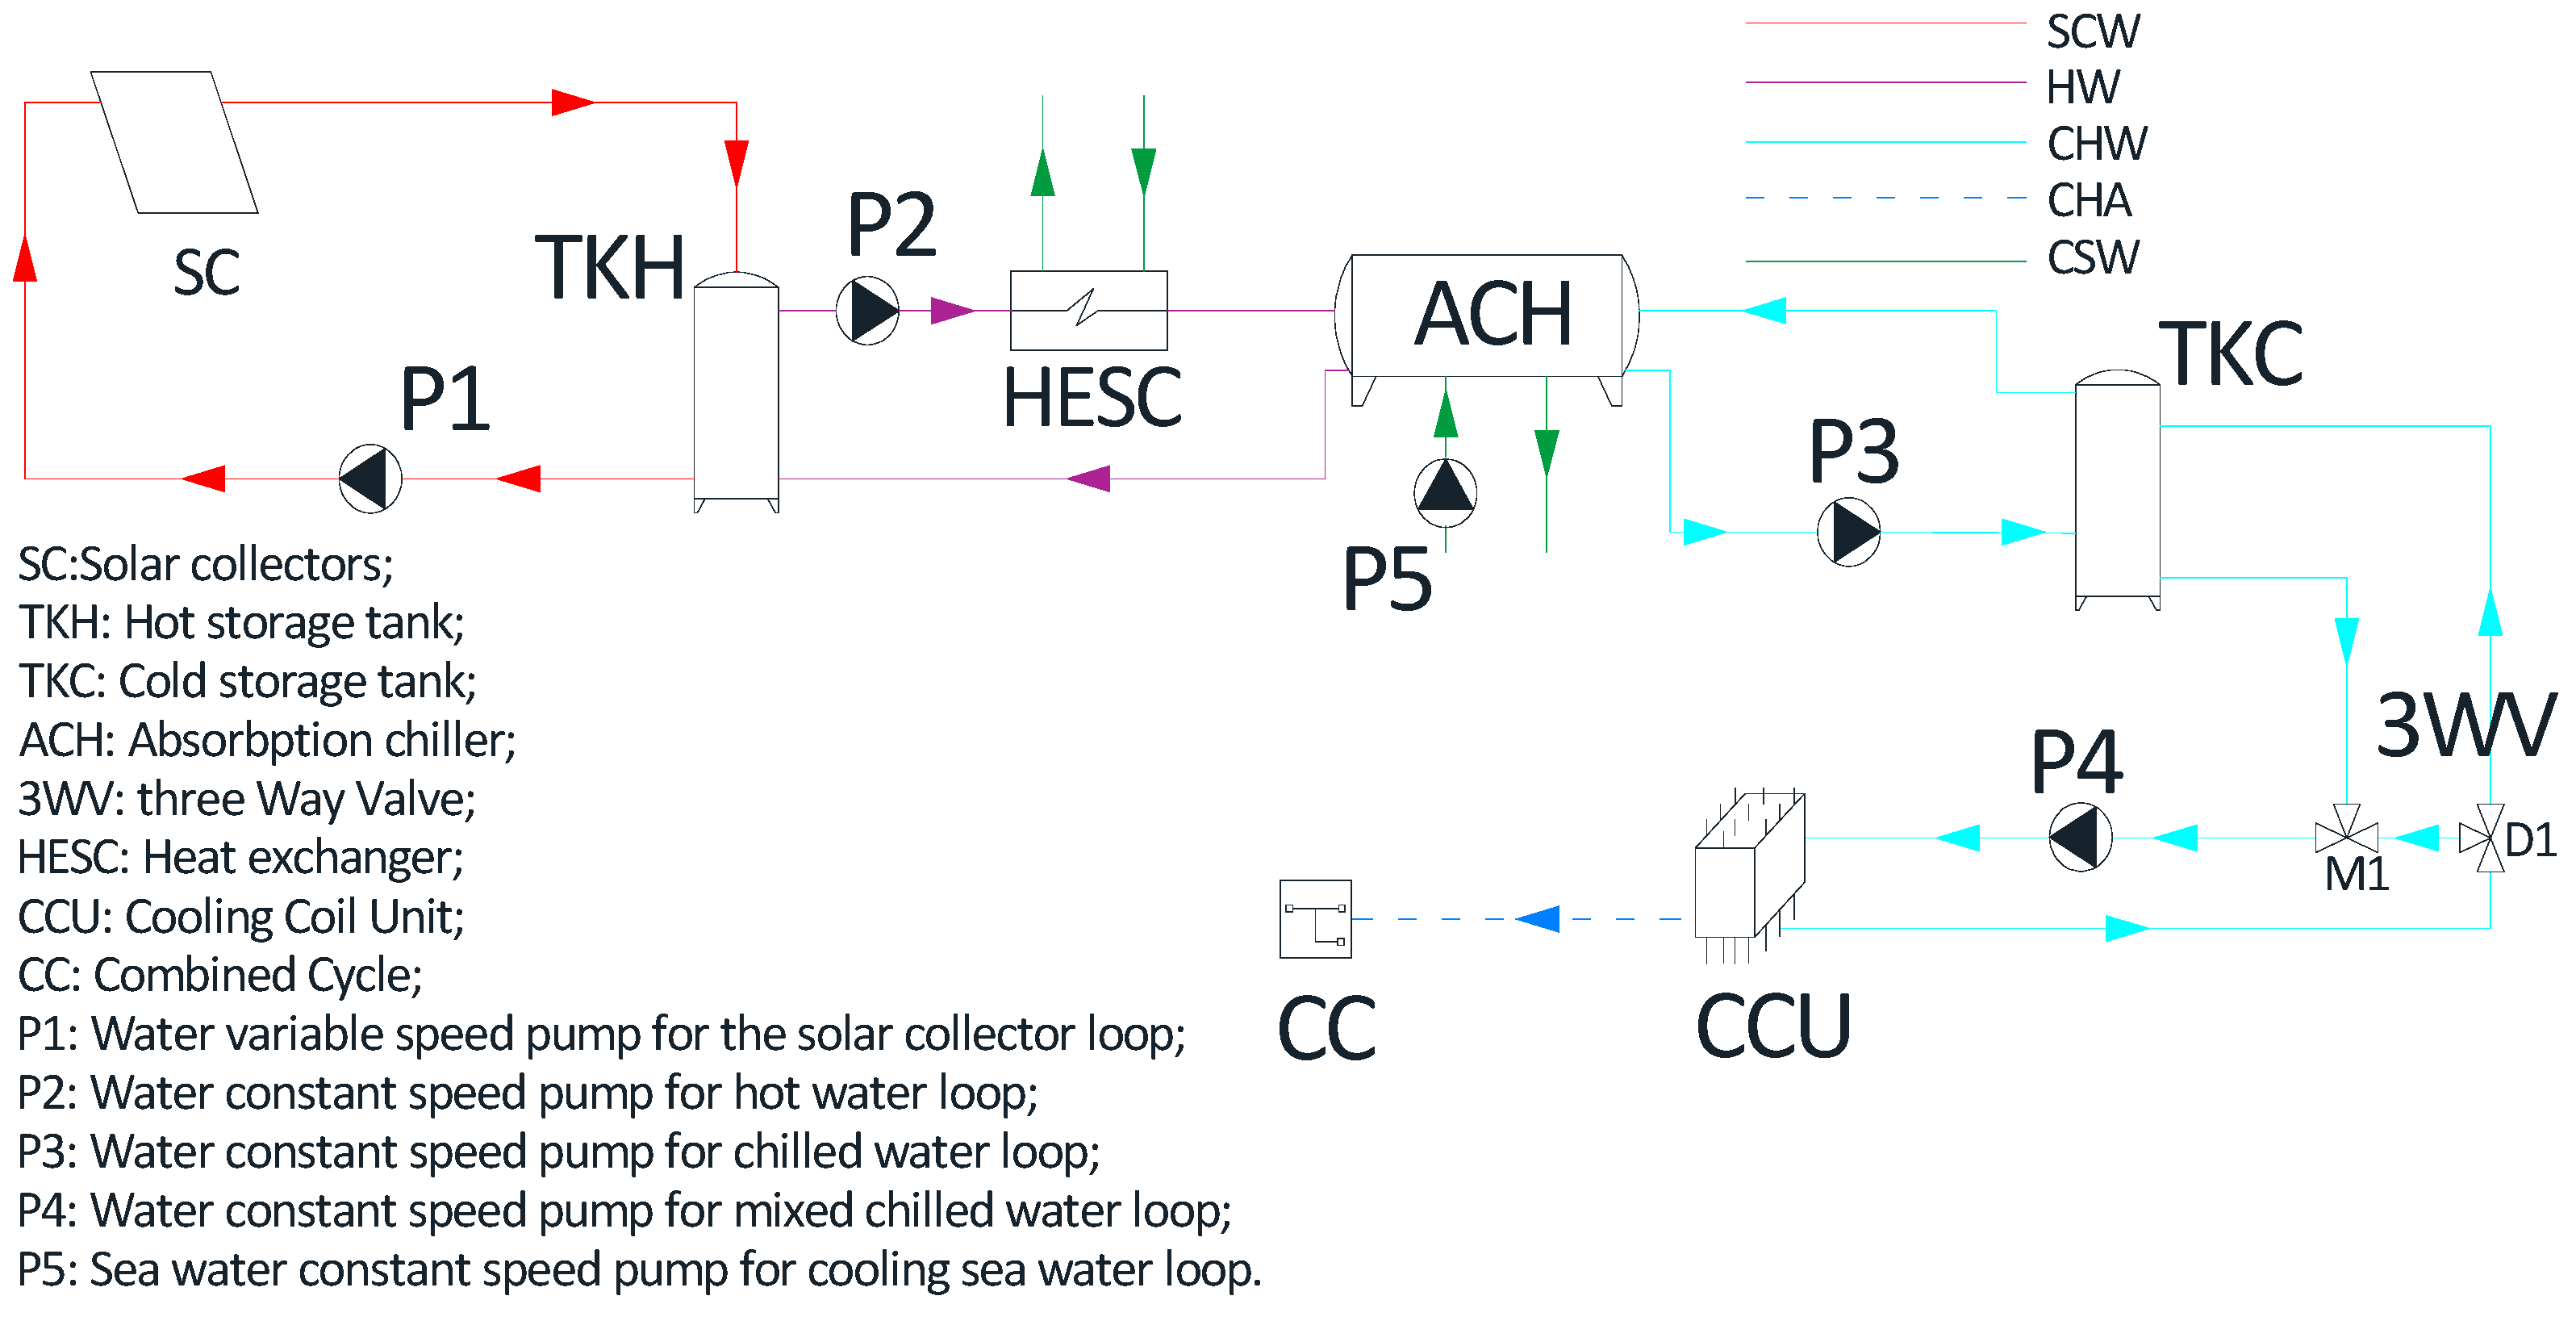
The solar cooling system is shown in
Figure 1 and it consists of five different system loops, solar collector water (SCW), hot water (HW), chilled water (CHW), cooling sea water (CSW) and chilled air (CHA), respectively. The system includes: a solar field with flat evacuated collectors (SC); a stratified hot water storage tank (TKH); a double stage LiBr-H
2O absorption chiller (ACH); a plate-fin heat exchanger dissipating excess of heat of solar collectors (HESC); a stratified cold water storage tank (TKC); a cooling coil unit (CCU) dehumidifying and cooling the outdoor air; a three way valve (3WV). ACH is activated by the thermal energy provided by the solar field and sea water is used in order to provide cooling water to the condensers of ACH.
Several circulation pumps are included: a variable speed pump (P1) for the SCW loop and four constant speed pump: (i) the pump P2 for the HW loop, pumping water from TKH to ACH; (ii) the pumps (P3 and P4) for the CHW loop, pumping water from ACH to TKC and from TKC to cooling coil unit; respectively; (iii) pump (P5) for the CSW loop. The solar cooling system and combined cycle (CC) are connected through the cooling coil unit.
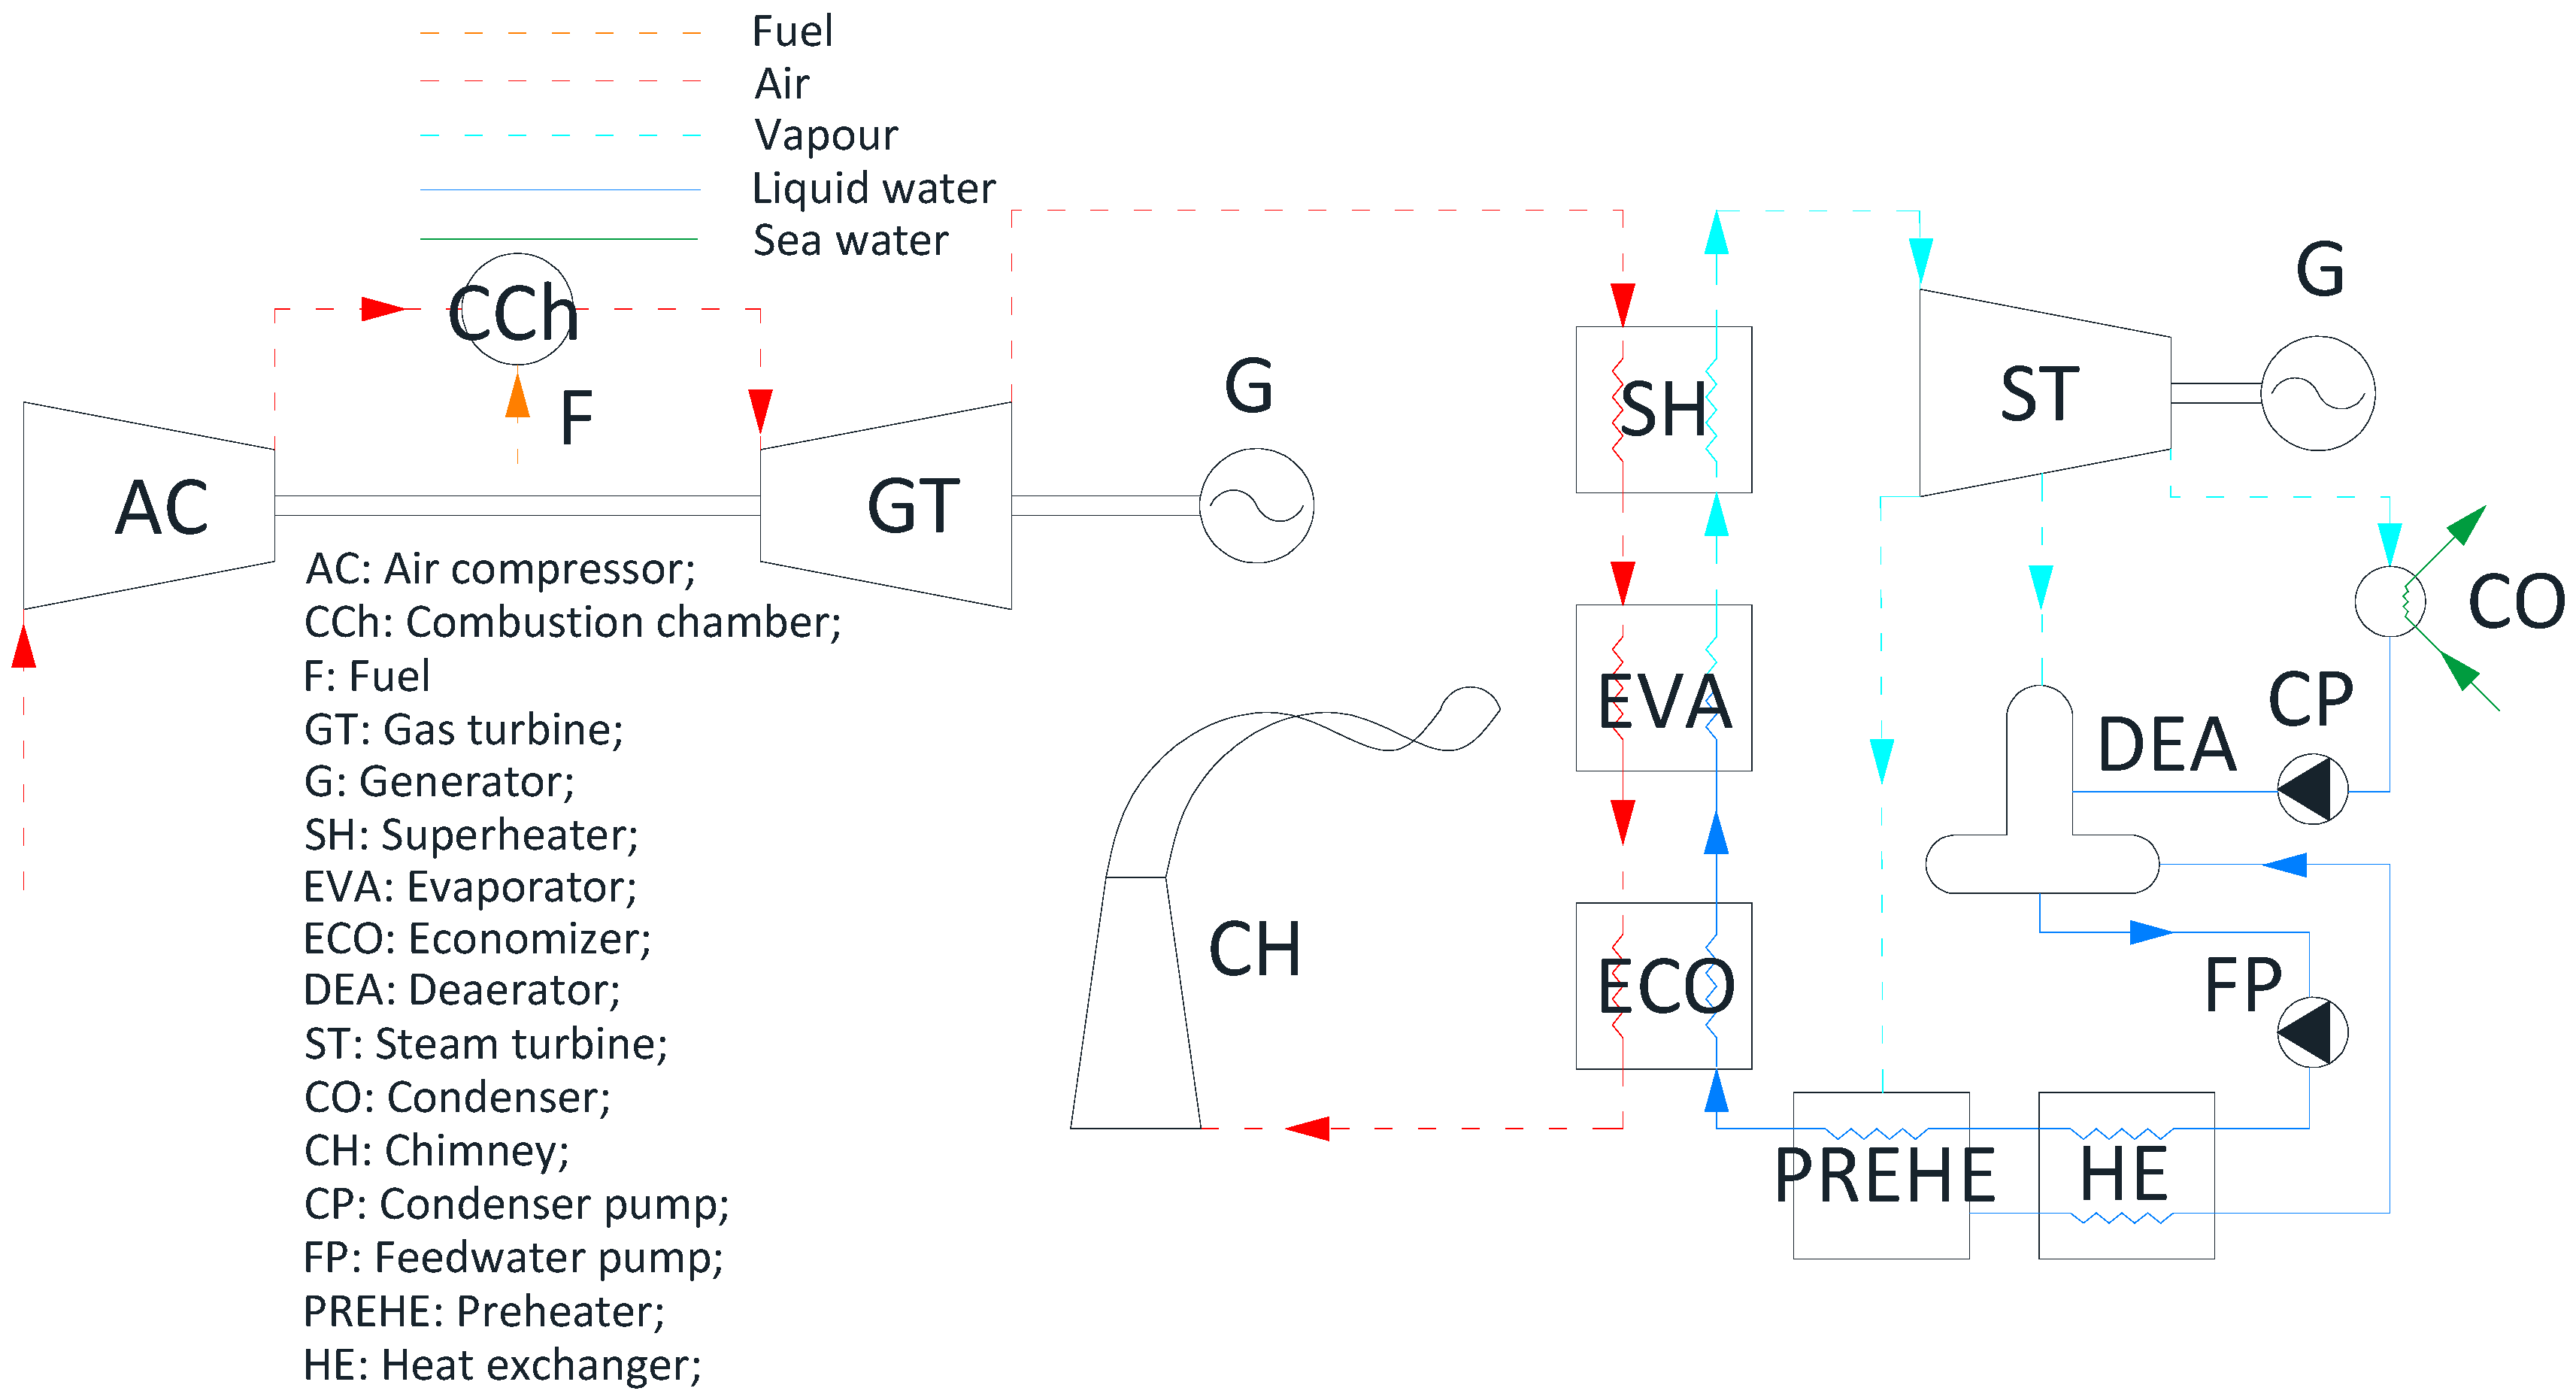
In fact, the cooling energy produced by the solar cooling system is used to pre-cool inlet air of gas cycle in order to enhance system efficiency and electrical capacity. In particular, the chilled air produced by cooling coil unit is sent to the compressor of CC, depicted in
Figure 2.
Here, a single-pressure plant is taken into account. In such a layout, the four system loops are: air loop of gas cycle, the vapor, liquid water and sea water loops of vapor cycle. The air, pressurized by the compressor (C) and heated by the combustion chamber (CCh), expanding in the gas turbine (GT), produces simultaneously power and supplies the vapor cycle, producing in turn power by the steam turbine (ST).
The operating principle of the investigated SACC system and the related control strategies can be summarized as follows.
The solar collectors are managed by a suitable controller, stopping pump P1 when the SC outlet temperature is lower than the inlet one and simultaneously the solar irradiation is lower than 10 W/m2 in order to prevent heat dissipation. Such controller varies the P1 pump speed in order to achieve the fixed set point temperature at the SC outlet equal to 180 °C, Tset,SC. The controller continuously varies the control signal ranging between the minimum and the maximum set values, respectively 0.2 and 1. This signal is processed by the pump, which correspondingly varies its flow rate. In case of scarce irradiation, the pump flow rate is reduced or even stopped; when solar irradiation increases, pump flow is also increased.
The hot water produced is stored in the hot storage tank TKH, by determining the consequent growth of top temperature,
Ttop,TKH. When
Ttop,TKH reaches the set point temperature for ACH activation T
on,ACH, equal to 165 °C, the ACH turns on and produces the chilled water which is stored in the cold storage tank TKC. The cooling sea water provides the water required to cool the absorption chiller. The ACH operation occurs until
Ttop,TKH falls down T
on,ACH − ΔT
TKH−. Conversely if
Ttop,TKH is higher than T
on,ACH + ΔT
TKH+ the excess of heat of solar collectors is dissipated by HESC. When the bottom temperature of cold storage tank is lower than the set point temperature for cooling coil activation T
on,CCU, the cooling coil unit is switched on, by cooling and dehumidifying the inlet outdoor air. This condition occurs when the chilled water set point temperature, T
SET,chw, is lower than the outdoor air one. Such set point temperature varies during year as shown in reference [
19]. In order to optimize the heat exchange of the cooling coil by reducing the latent energy removed from the wet air flow stream, and increasing the sensible one, a suitable control was developed. In particular, such controller mixes a fraction of cooling coil outlet flowrate and a fraction of TKC outlet flowrate in order to achieve a temperature in the mixer M1,
Tout,3VW, equal to the dew point temperature of outdoor air TDP, reduced by a fixed temperature difference, ΔT
DP. In this way, the dehumidifying effect and water condensation within the cooling coil is minimized whilst the removed sensible cooling energy increases. Since this strategy limits the thermal energy usage, it is suitable deactivated when there is a peak (
Ttop,TKH > 180 °C) of incoming thermal produced by the SC field. Thus, the energy dissipated through the HESC is conveniently reduced.
3. System Model
As mentioned before, the final goal of this paper is to present an in-depth exergy analysis of the novel SACC system descriped in the previous section. To this end, the system must be first modelled from the energetic point of view in order to calculate thermodynamic properties for all the considered state points and energy flows for all the time-steps of the simulations. Then, on the basis of the results (temperatures, pressures, heat, work, etc.) obtained by conventional energy balances, the exergy analysis can be also applied in order to calculate the related exergy performance parameters. The accuracy of the exergy analysis is strictly related to the reliability of the energetic model, which must dynamically simulate the performance of the components and of the system as a whole. Such performance must be related to the system design (geometry, materials, etc.) and operational (set point temperatures, operating flow rates, etc.) parameters. In particular, a special effort was performed in order to develop suitable dynamic simulation models and, to this scope, the system is modelled in the well-known TRNSYS environment [
46]. The software includes a large library of built-in components, often validated by experimental data [
46]. Such methodology was also used by some of the authors in several previous works (e.g., [
47,
48,
49]), where the model of both built-in and user-developed components are discussed. In particular, the models of the solar collectors was recently presented by some of the authors in reference [
50], where an experimental validation was also provided. For the analyzed power plant, a simple single-pressure Combined Cycle (CC) was modelled by the provided types of the STEC TRNSYS library [
51]. In particular, the models of heat exchangers, gas and steam turbines were included. For example, the steam turbine stage model calculates the inlet pressure of the turbine stage from the outlet pressure, the steam mass flow rate and reference values of inlet and outlet pressure and mass flow rate using the Stodola law of the ellipse.
Further details can be found in above cited reference [
51]. Finally, the remaining models (absorption chiller, controllers, psychometrics routine, pipes connecting, schedulers, weather database, etc.) are widely discussed in reference [
46] and in specific papers previously presented by some of the authors [
48,
52,
53,
54,
55,
56,
57]. Note also the energetic models of all the components are validated against experimental data. Thus, all the results returned by the simulations can be considered highly reliable. Then, for each component and for the system as a whole, dynamic exergy balances are also implemented, in order to dynamically calculate the exergy destroyed by each component of the system. All these balances are implemented developing specific subroutines in the above presented dynamic simulation model. In the following for sake of brevity, only a brief description of the main energetic models are presented, whereas a more detailed discussion of the exergy balances is presented.
3.1. Energy Models
3.1.1. Solar Collectors Model
The innovative flat plate evacuated solar collector included in this paper is produced by TVP Solar [
18]. The main feature of these collectors is their ultra-high vacuum (from 10
−4 to 10
−9 mbar, depending on the operating temperature), which allows one to achieve very high efficiencies up to 200 °C, even higher than the one shown by compound parabolic concentrating solar collectors [
18]. This is [
50] due to two simultaneous effects: (i) TVP collectors can convert both beam and diffuse radiation; (ii) TVP heat losses are extremely low (due to the ultra-high vacuum). It is also worth noting that such results are achieved without concentration, avoiding the need of any tracking mechanism as well as frequent cleanings. Therefore, a reduced system capital and operating costs is achieved [
18].
In order to model TVP panels, the TRNSYS Type 432 is adopted [
58]. It is a complete model of a flat plate solar collector, featuring the complex radiative dynamics, based on Hottel-Whillier equation integrated with the Incidence Angle Modifier (IAM) coefficient, in order to calculate the heat transferred from the Solar Thermal panel to SCW at each time-step. A set of correction terms is used in order to consider all collector designs and weather types. Those parameters are available for all collectors tested according to ASHRAE standards [
59] as well as for collectors tested according to European Standards on solar collectors [
60]. The equation coefficients and the IAM coefficients are determined by simulations and indoor-outdoor tests performed according to EN 12975 and EN 12976 (European Normalization) [
61].
This model also considered the effective thermal capacitance of the collector, wind dependencies on the zero loss efficiency and heat loss and the long-wave irradiance dependence of the heat loss. In this way, the full collector model is then written as:
All the constants from a
1 to a
6 can be derived by a standard collector test specified in the new European test standard ISO 9806-3 [
62]. In
Table 1, their values are reported.
3.1.2. Cooling Coil Model
The detailed coil, simulated through the Type 52, models the performance of a dehumidifying cooling coil using the effectiveness model outlined by Braun [
63]. Water will begin to condense on the surface of a cooling coil at the point where the surface temperature equals the dew point of the entering air and, in order to calculate the heat transfer through the cooling coil, the relative areas associated with the wet and dry portions of the coil must be determined. The dry fraction of the coil surface area is given by:
The exit water temperature is calculated as follows:
Since the dry fraction of the coil is dependent on the exit water temperature, an iterative method is required to find the exit water temperature. The outlet air state from the coil is determined by:
where
Ts,e is the effective surface temperature in the wet coil section and is determined from the saturation condition associated with:
The total energy transferred across the coil is:
The heat transfer attributed to condensing the moisture in the air is calculated as:
3.2. Exergy Models
As mentioned before, the exergy analysis implemented in this paper is based on the definition of unsteady exergy balances for all the components and for the system as a whole. As a consequence, for each time-step of the 1-year dynamic simulation, the conventional (energy-based) dynamic simulation model returns nodes state point properties (typically temperature and pressure) and mass flow rates along with components energy flows (heat and work). Then, for each single time-step such data are used as an input by the exergetic model which is able to calculate the corresponding exergy destructions for all the components. Additional algorithms are implemented in order to calculate the most common exergy performance parameters (exergetic efficiency, efficiency defect, etc.). This is a well-established and reliable approach, which was successfully used by the authors for several systems [
20,
21,
22,
64,
65,
66,
67]. It is worth noting that the majority of the components included in the system do not involve chemical reactions. Only the combustion chamber of the gas cycle and the absorption chiller include chemical processes. Therefore, for the other components, exergy balances can be written considering the sole physical exergy related to the material and energy streams entering and exiting each component. Moreover, in case of absorption chiller, if one is not interested in the calculation of the exergy destruction of its subcomponents (generator, absorber, evaporator, condenser, etc.), chemical exergy calculation is not required. In fact, using a control volume including the whole absorption chiller, no chemical reaction occurs among the inlet/outlet streams. Conversely, in case of gas cycle combustion chamber important chemical processes occur even when a larger control volume is considered. Therefore, in this case exergy balances must also consider the chemical exergy related to the streams involved in those components [
22]. Furthermore, it is worth noting that for all the liquid fluids included in the systems, physical exergy can be calculated as:
However, as usual in liquids, the term
is often negligible with respect to the remaining ones. For example, results presented in reference [
22] show that exergy related to pressure drops is absolutely negligible with respect to the one related to temperature differences. Therefore, the previous equation can be simplified as follows:
where T
a is the temperature of the considered dead state. In such equation, thermodynamic properties (enthalpy, entropy, etc.) of all the streams (air and water) are calculated in detail using the correlations included in TRNSYS environment. In particular, Type 58 is used to calculate water properties in all the states (liquid, saturated or superheated) whereas air properties are calculated in detail using the psychrometric calculator (Type 33). Fixed values of dead-state temperature and pressures are assumed, according to the approach reported in reference [
68]. In our case a conventional ambient temperature T
a = 20 °C was assumed, that is a value rather close to the annual average outdoor air temperature. Similarly, a constant dead state pressure, p
a = 101,325 Pa, was assumed. Equation (10) can be used in order to calculate exergy per unit mass for all the streams.
The exergetic flow due to electrical power produced is numerically equal to the electricity produced [
69]. The exergy flows due to the heat transfer with the environment can be evaluated correcting the heat flow by the corresponding Carnot factor [
69]:
However, considering that all these heat transfers are related to the losses toward the environment, temperature T is equal to the environmental temperature Ta and therefore the associated exergy flow is null.
On the basis of these assumptions, the exergy balances can be written taking into account that the capacitive terms are included only for those components, such as tanks, whose energetic model considers their thermal capacity. Thus, the exergy theory can be applied in order to calculate exergy destruction rates and exergy efficiencies for all components [
22,
69]. For the components that exhibit a well defined exergetic product (as turbines, heat exchangers, absorption chiller, etc.) exergy efficiencies were calculated as the ratio between exergetic product and fuel. On the other hand, for some other components (tanks, deaerator, etc.) a process exergy efficiency was defined as the ratio between outlet and inlet exergy flows. In the followings, these calculations are shown for the main components of the system, whereas they are omitted for simple components (pipes, valves, pumps and mixers) for sake of brevity.
3.2.1. Solar Collector
Some special calculations must be performed in order to evaluate the exergy stream due to renewable energy sources. In particular, the calculation of the exergy flow due to the solar radiation can be performed using different approaches (Jeter, Petela and others) [
70]. Such approaches (“technical boundary approaches”) differ for the selection of the temperature of the sun. A completely different approach (“physical boundary approach”) disregards the conversion of solar energy into heat in the solar collector. In this paper, according to the best practice available in literature for the “technical boundary approach” [
70], this calculation is performed by the Petela theorem, in which the sun temperature is set at 4077 °C (3/4 of the corresponding black body temperature) [
71]:
Therefore, the exergy destruction and the exergetic efficiency of the SC are respectively as follows:
3.2.2. Combustion Chamber
Similarly, the exergy flow related to the fuel entering the CCh can be calculated, considering its chemical exergy of reaction. Exergy flow related to the fuel used by the CCh is:
In the case of natural gas the specific chemical exergy, ε
NG, is estimated in 49,925 kJ/kg [
64,
72,
73]. Therefore, the exergy destruction and the exergetic efficiency are respectively as follows:
3.2.3. Heat Exchangers
The exergy balance of heat exchangers can be written simply considering, inlet and exiting streams. As an example, using HESC as reference, the exergy destruction is:
Similar balances can be used for calculating exergy destructions of CO, SH, EVA and ECO. Conversely, the exergetic efficiency depends on the scope of the heat exchanger (cooling or heating). Finally, it is worth noting that when the HESC heat is dissipated, its exergetic efficiency cannot be defined. In fact, from the exergetic point of view this is a dissipative component. Thus, no useful exergy product can be identified. Similarly, it not possible to define any exergetic efficiency for CO.
3.2.4. Tanks
The exergy balance of tank must also consider the exergy stored in the systems. As an example, using TKH as reference, the exergy destruction is:
It is worth noting that the previous equation considers the tank average temperature TKH. In fact, the tank under investigation is subject to thermal stratification, determining a significant vertical temperature gradient which is calculated by a detailed energetic model [
74] considering the vertical tank divided in n fully mixed nodes. Therefore, the above mentioned exergy balance should be written separately for each one of the n nodes. These long calculations will allow one to evaluate the local exergy destruction in each node of the tank. However, the overall exergy destruction in the tank can be more easily calculated with respect to the sole tank average temperature. The process exergetic efficiency can be calculated as follows:
3.2.5. ACH
As mentioned before, if one is not interested in the distribution of exergy destructions within the absorption chiller, exergy balances can be dramatically simplified by considering a control volume including the whole ACH. In this case, no chemical reaction occurs for all the fluids entering and exiting the device. Conversely, exergy balances regarding the separate components of the ACH would require complex calculations in terms of chemical exergy. However, this more complex approach may be useful when the goal is the optimization of the components itself. Nevertheless, in this case, such component is based on a commercially available model simulated by its performance map. Therefore, no optimization is possible since any variation of ACH internal design parameter would determine a consequent variation of such map. Thus, in this paper the exergy balance may be written considering a control volume including the whole ACH. In this case, the calculation of the exergy destruction rate is given by:
The exergy efficiency is given by:
3.2.6. Gas and Steam Turbines
Gas and steam turbines exergy balances are based on simple equations well established in literature:
3.2.7. Air Compressor
Similarly, to the turbine, air compressors exergy destruction and exergetic efficiency are calculated as:
3.2.8. Deaerator
From the exergetic point of view, the deaerator is a simple mixer having three inlets and one single outlet. A simple exergy balance allows one to calculate the corresponding exergy destruction and the process exergetic efficiency:
3.2.9. Cooling Coil
The exergy balance of the cooling coil is basically similar to the one of a conventional heat exchanger, which aims at cooling a certain stream. However, it must be considered that in the present cooling coil an additional outlet stream may be involved in the balance, namely the condensate water. Thus, the exergy balance can be written as follows:
The exergetic efficiency is:
It is worth noting that in some cases such exergetic efficiency cannot be calculated. This occurs when the air average temperature is higher than the considered dead state temperature. This circumstance is representative of an exergetic dissipative behavior of the CCU.
3.2.10. Balance of the System (Pumps, Valves, Mixers, Diverts, etc.)
A number of auxiliary components are included in the system. For those components, an overall exergy destruction is calculated considering the difference between the plant exergy destruction and the exergy destructions of the components cited before.
3.2.11. Overall Exergy Balances and Efficiencies
The exergy balance can be performed also for the system as a whole or for the 3 subsystems (solar cooling, Rankine, Joule). The related exergy destructions and exergetic efficiencies may be calculated as follows:
4. Discussion and Results
The energetic analysis is performed for the case study presented in reference [
19], where results in terms of temperatures, powers, energy and economic parameters are discussed in detail. Conversely, in this paper, special attention is paid to the discussion of the exergetic results, showing only some of the most significant energetic ones, required in order to justify the reported exergetic parameters.
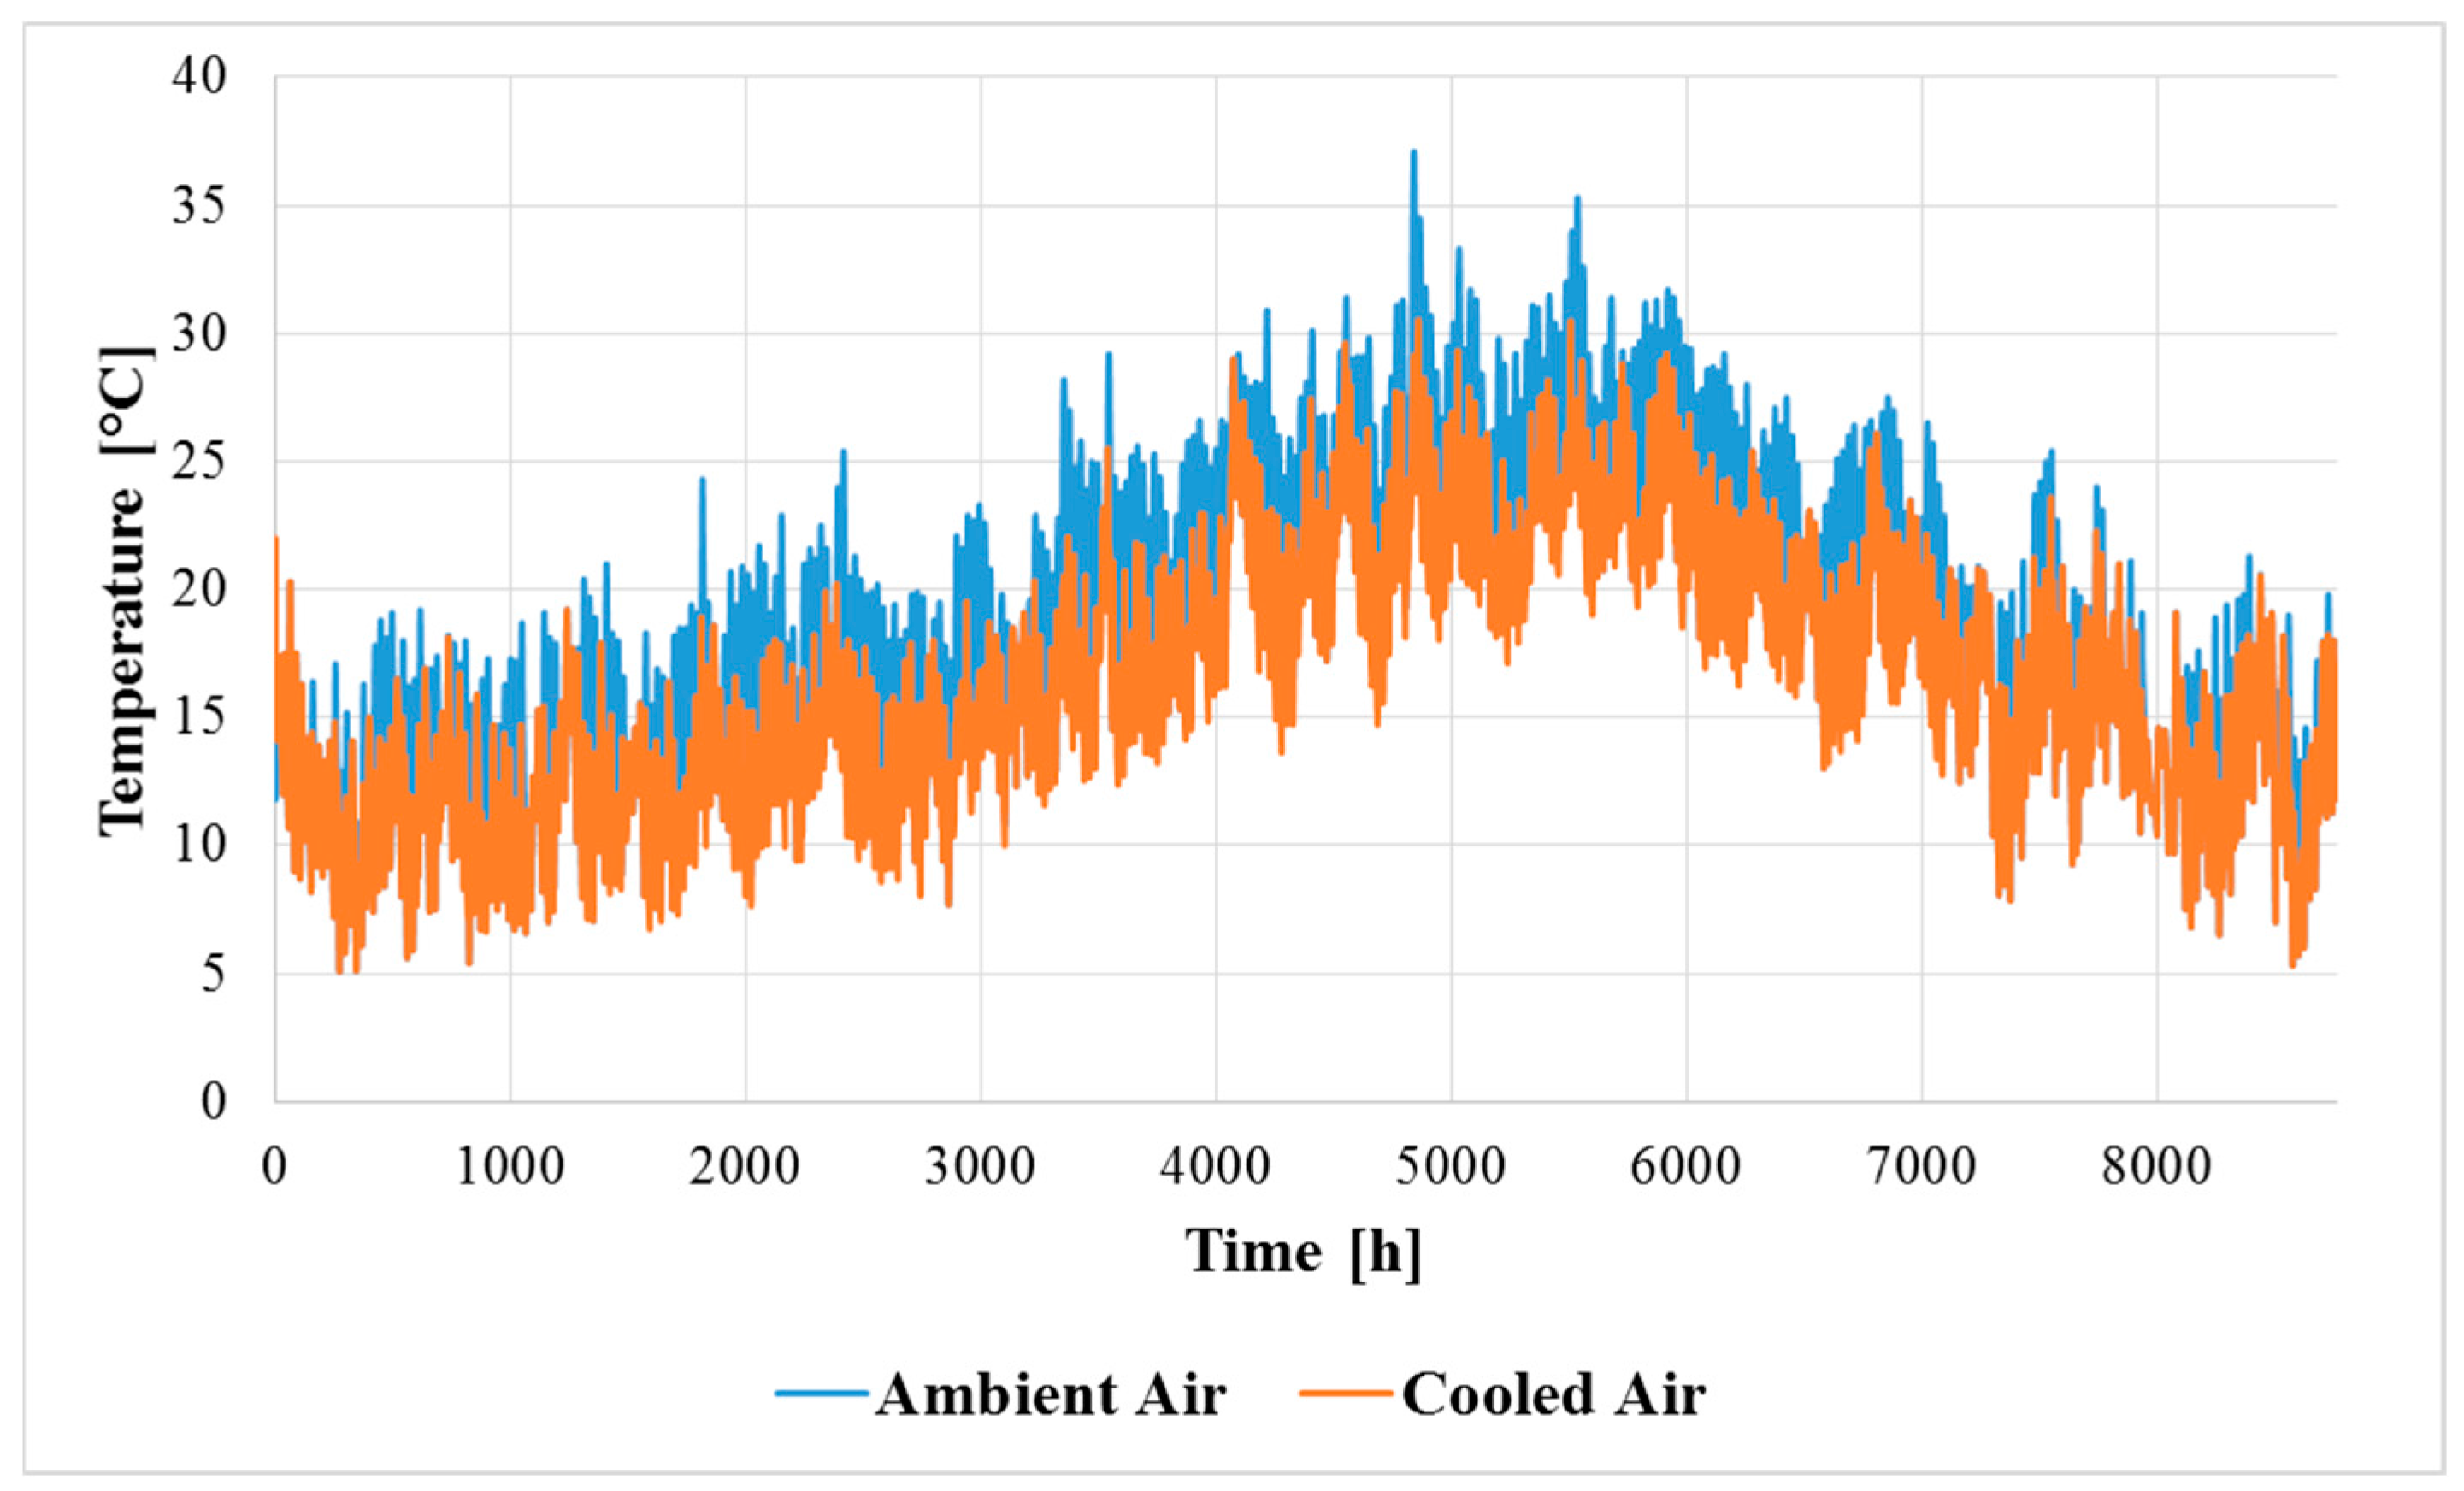
The SACC system is supposed to be located in Almeria (Spain), using Meteonorm data [
46], included in TRNSYS package. The carried out analysis is based on dynamic simulations and therefore the considered ambient temperature, all weather parameters and operating temperatures changes every time step. The selected time step for the carried out simulations is equal to 0.02 h. The selected value is obtained by a sensitivity analysis, carried out in order to select an optimal trade-off value between the computational time and the simulation accuracy. Note also that in dynamic simulations, the time step corresponds to the controller sampling time: large time steps would determine an unrealistic operation of the controllers.
The 990 m2 solar field consists of flat south facing evacuated collectors, tilted 30 degrees. The rated chilled capacity of double stage LiBr-H2O absorption chiller is 252 kW, the electrical rated power of the combined cycle is 18.18 MW, whilst the exchange area of the cooling coil is 188.5 m2. It is assumed that the whole system is always on without any downtime for maintenance.
The main system design parameters of the SACC system and of the combined cycle are listed in
Table 1 and
Table 2, respectively.
4.1. Daily Analysis
As mentioned before, the simulation tool developed in this paper allows one to dynamically evaluate the exergy balances for all the components, for its subsystems and for the system as whole.
Such dynamic exergetic analysis shows how irreversibilities vary within the components as a consequence of the fluctuations of environmental conditions (temperature, humidity, radiation, etc.).
Thus, in the following sections, dynamic plots of exergetic parameters are shown for a random weeks (168 h) of the summer season. The corresponding analysis for a winter week is here omitted for sake of brevity. Obviously, the tool allows one to predict energy and exergy performance of the system for all the 1-year operation of the system. Note also that a comprehensive justification of the exergy results can be performed only when the energetic one are available. Therefore, such energetic results are here briefly summarized considering that a complete discussion of such energetic results is provided in reference [
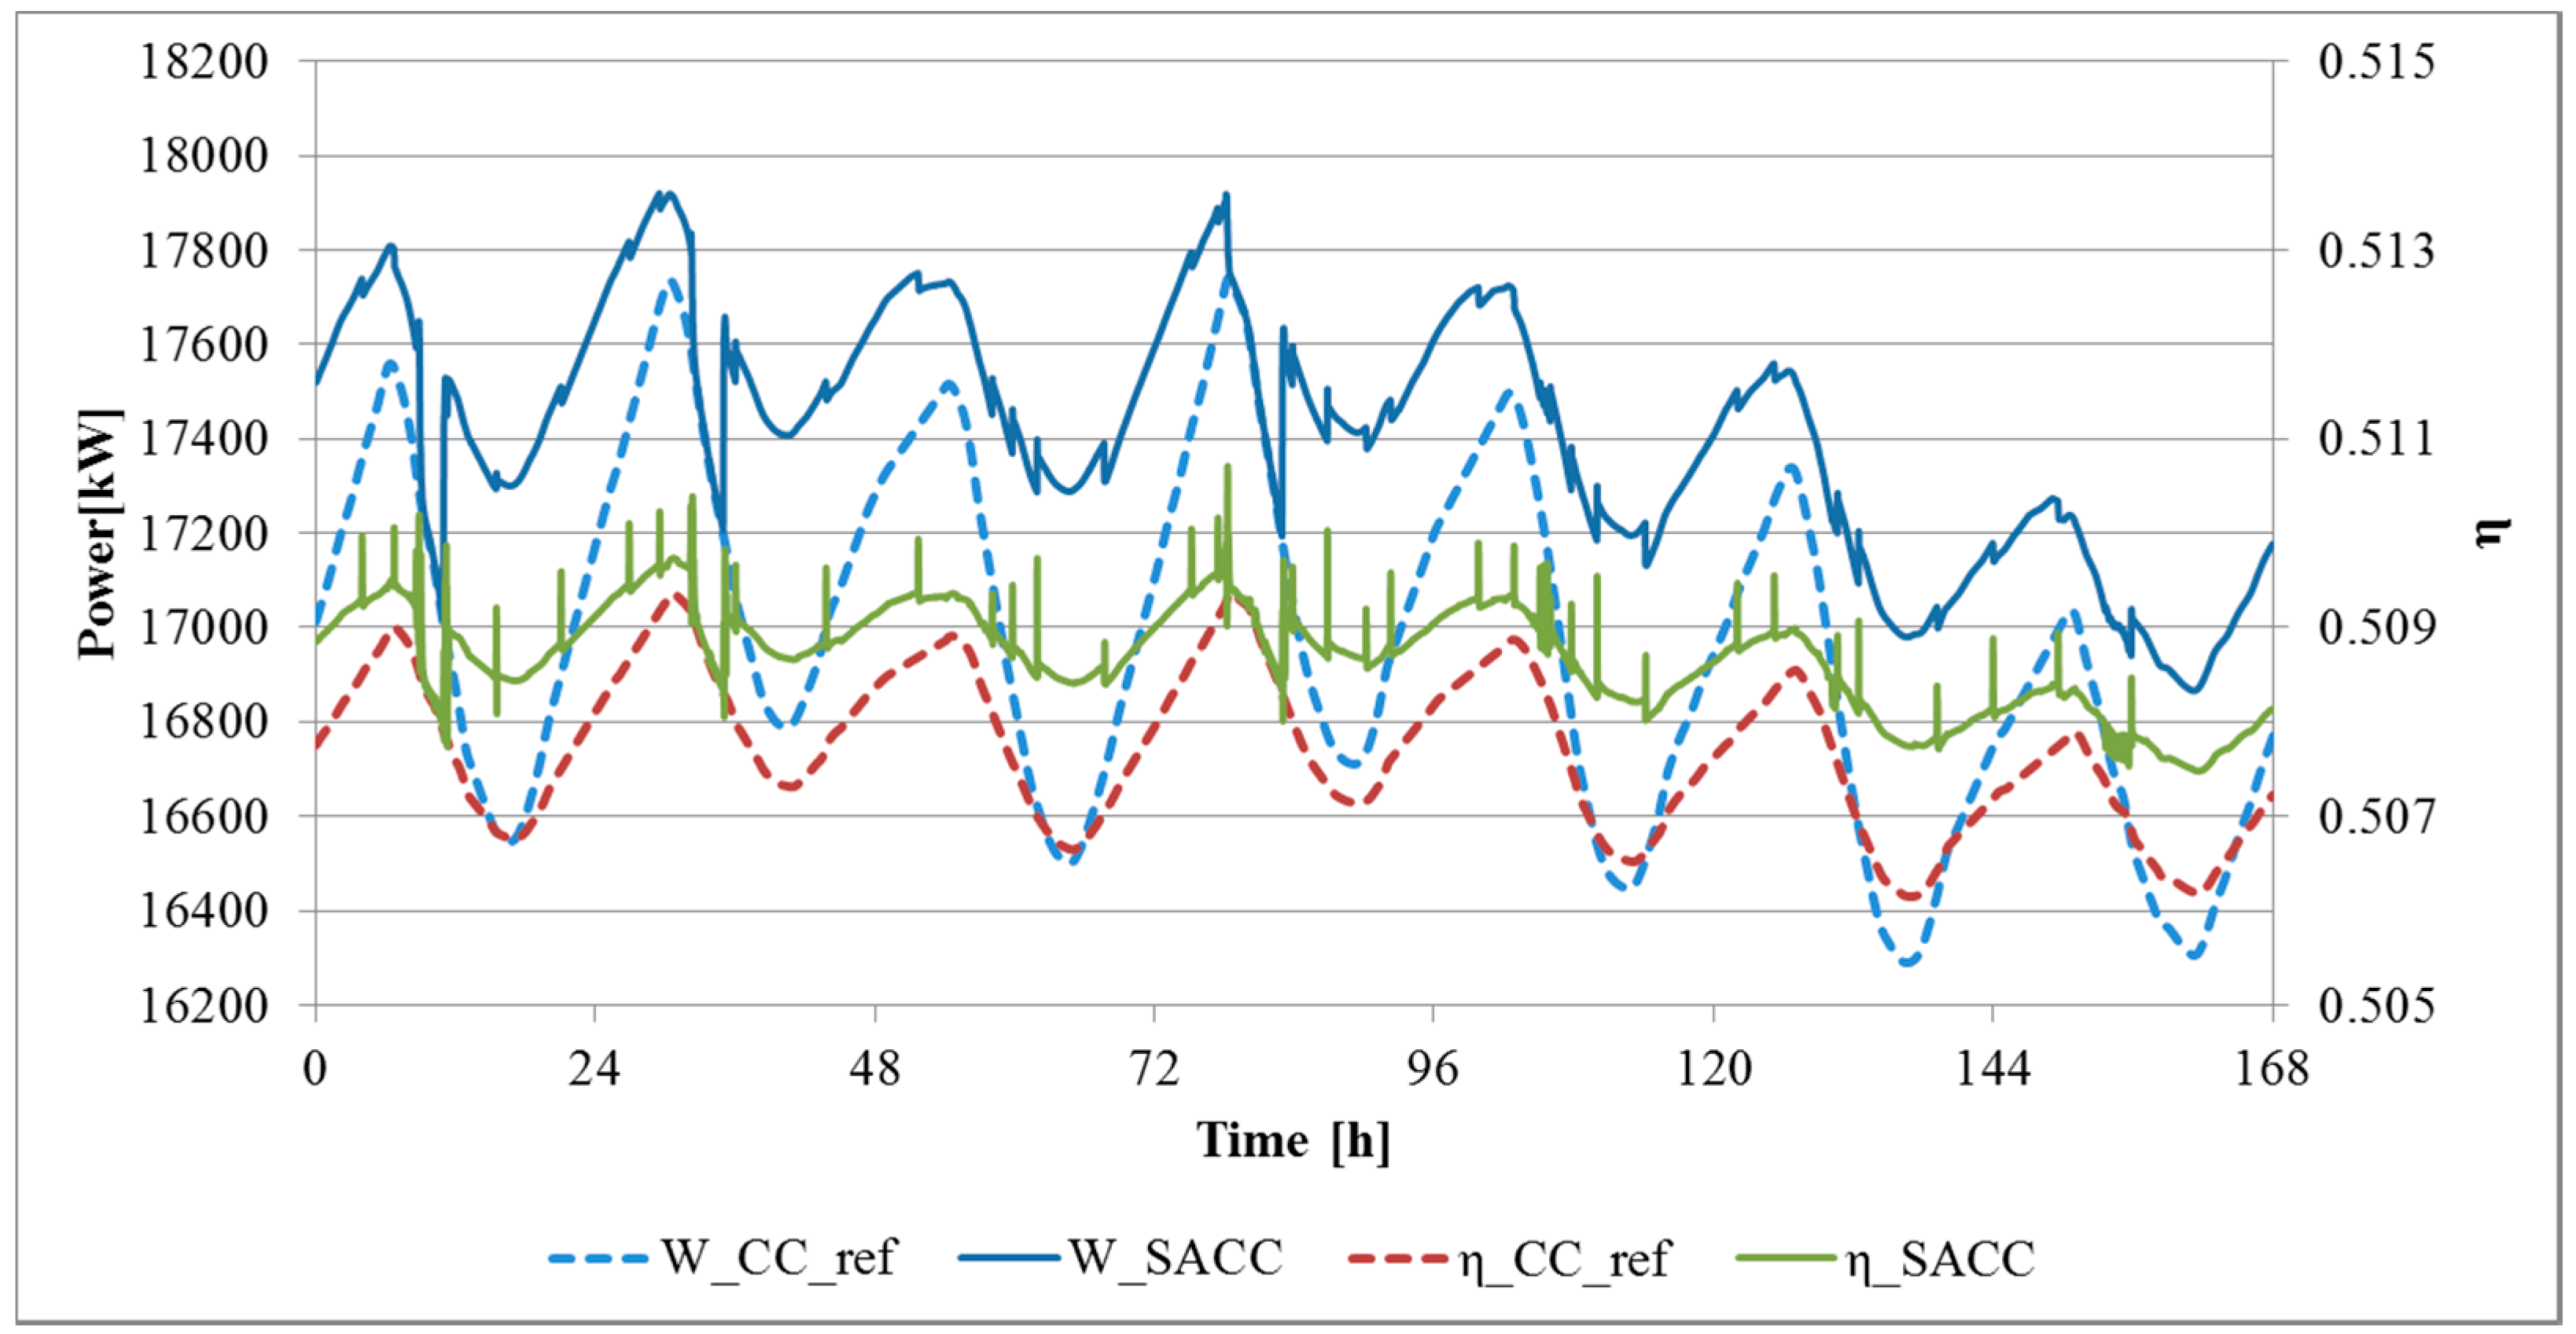
19]. In particular,
Figure 3 shows the overall power production (W) and the energy efficiency (η) of the proposed solar combined cycle (SACC) for the 32nd week of the year. The same parameters are also shown for the same combined cycle (CC) not equipped with the solar cooling subsystem in order to compare the proposed system with a reference one. Such plot clearly shows that the proposed system exhibits higher power production and energy efficiency mainly during the central hours of the day. In this period, radiation is high and ambient temperature is also very high. Therefore, the potential in improvement of Joule cycle efficiency becomes very significant.
As a consequence, SACC overall power production increases averagely from 2% to 5% during such central hours of the day. Conversely, during the night when the ambient temperature is significantly lower and solar cooling capacity decreases dramatically (no radiation and decrease of storage tank TKH temperature), no significant improvement of the SACC power production is achieved. As for the energy efficiency,
Figure 3 also shows that this parameter is enhanced, with respect to the one of a reference combined cycle, especially during the central hours of the day. However, no significant variation in the overall magnitude of the efficiency can be detected. In other words, the enhancement in terms of power production are much more significant than the ones related to the energetic efficiency. This is justified by the fact that during the central hours of the day a higher power production is also determined by a higher fuel consumption. In fact, in such hours, AC outlet temperature is lower in SACC with respect to the reference case. As a consequence, a higher amount of natural gas (NG) is needed in order to achieve the fixed GT inlet temperature.
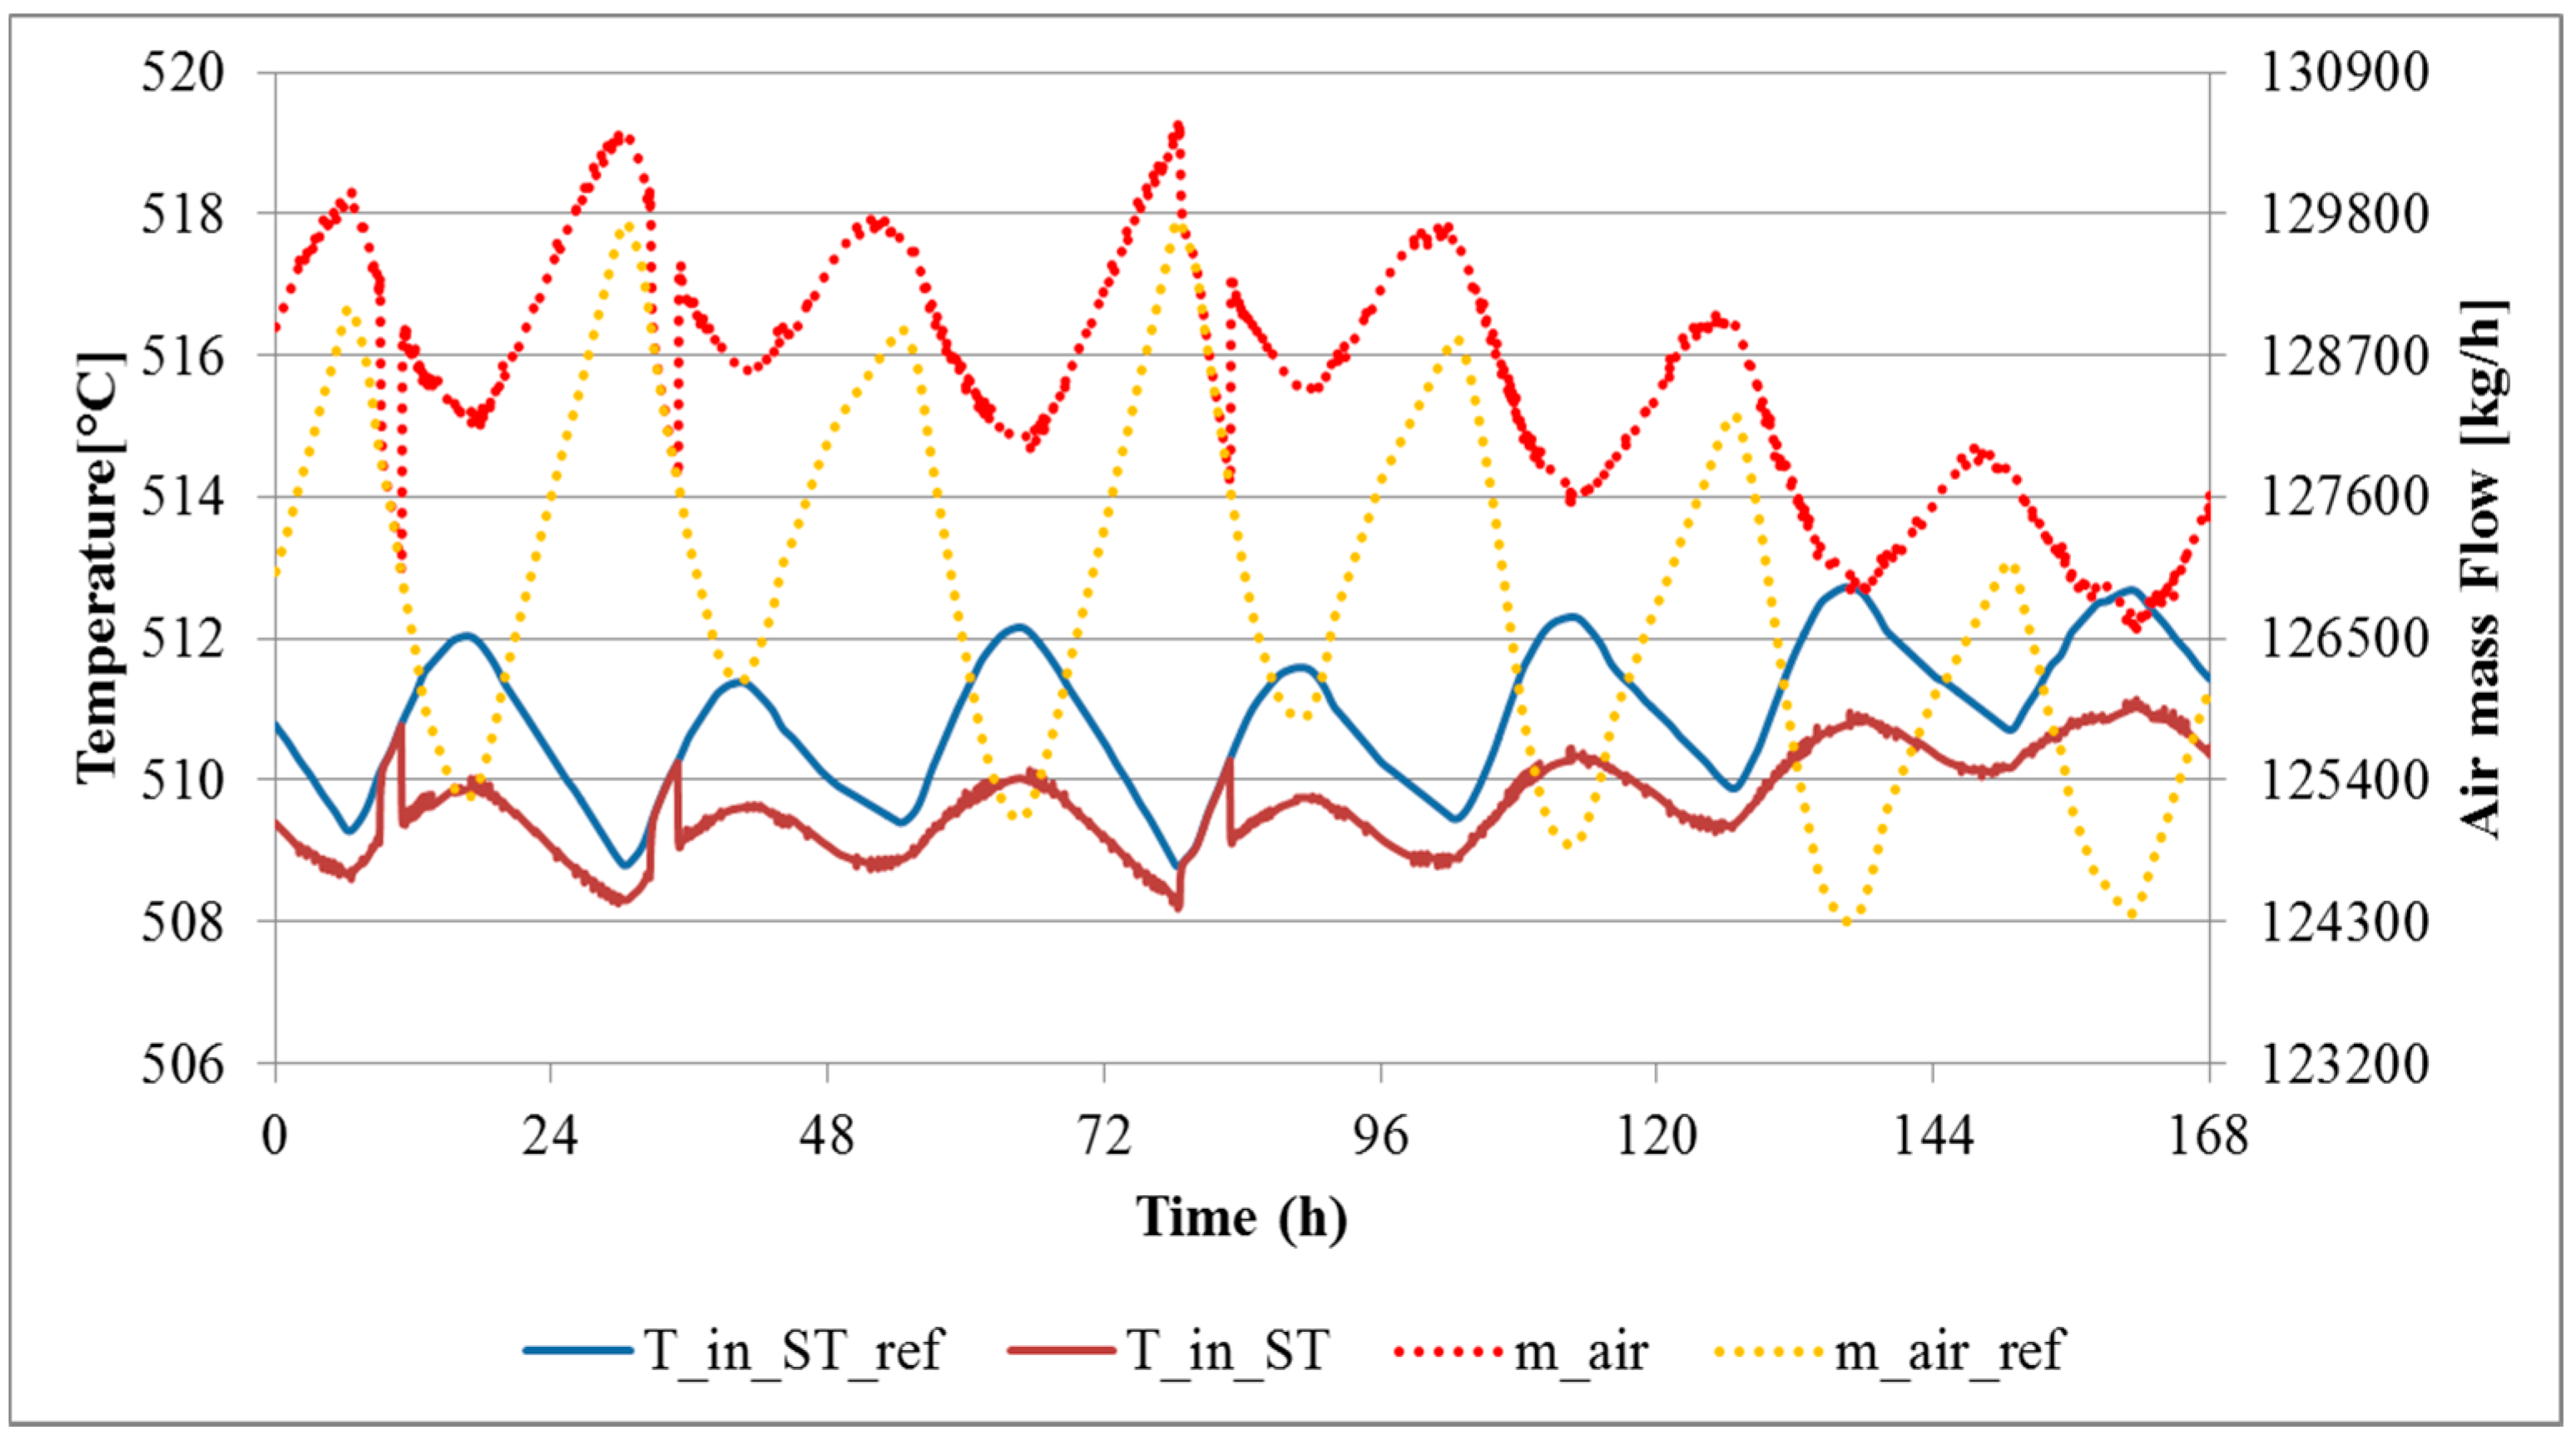
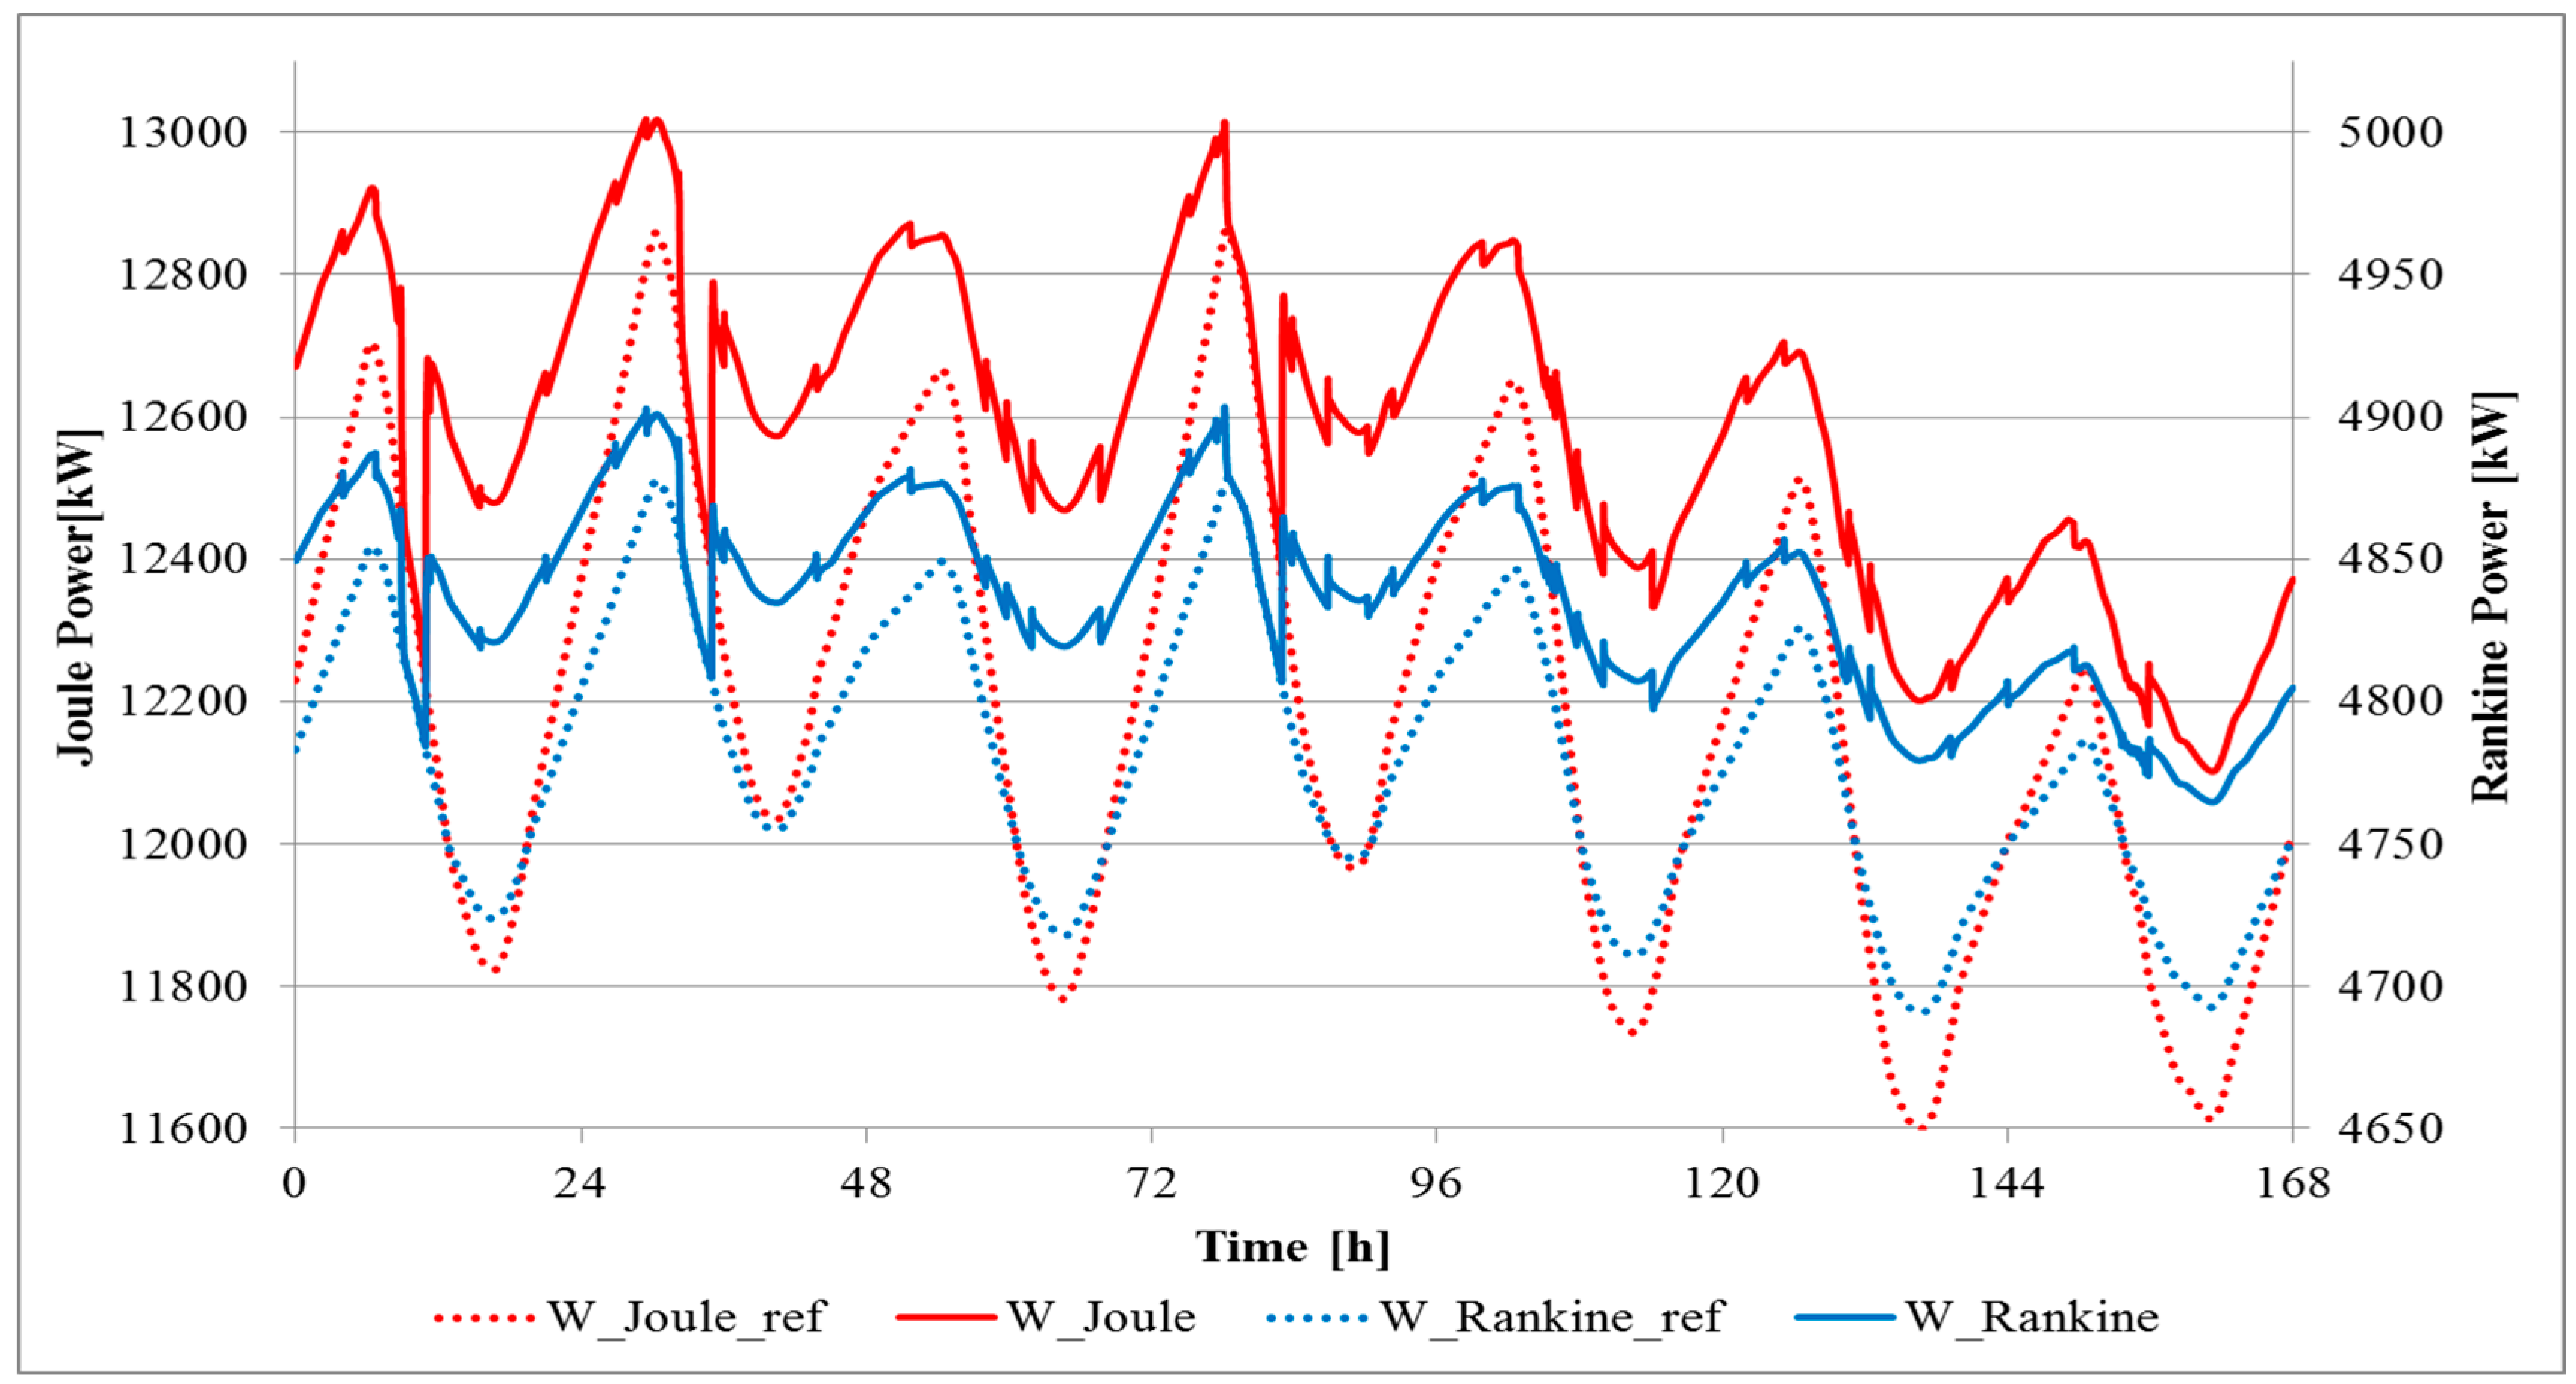
The higher power production is basically due to the higher Joule cycle power, caused by the lower AC inlet temperature. As shown in
Figure 4, a small variation in Rankine cycle power production is also achieved. This is due to the variation of air mass flow rate, caused by the solar cooling process, which determines an increase of the density of the air entering the air compressor.
This is more clearly shown in
Figure 5 and
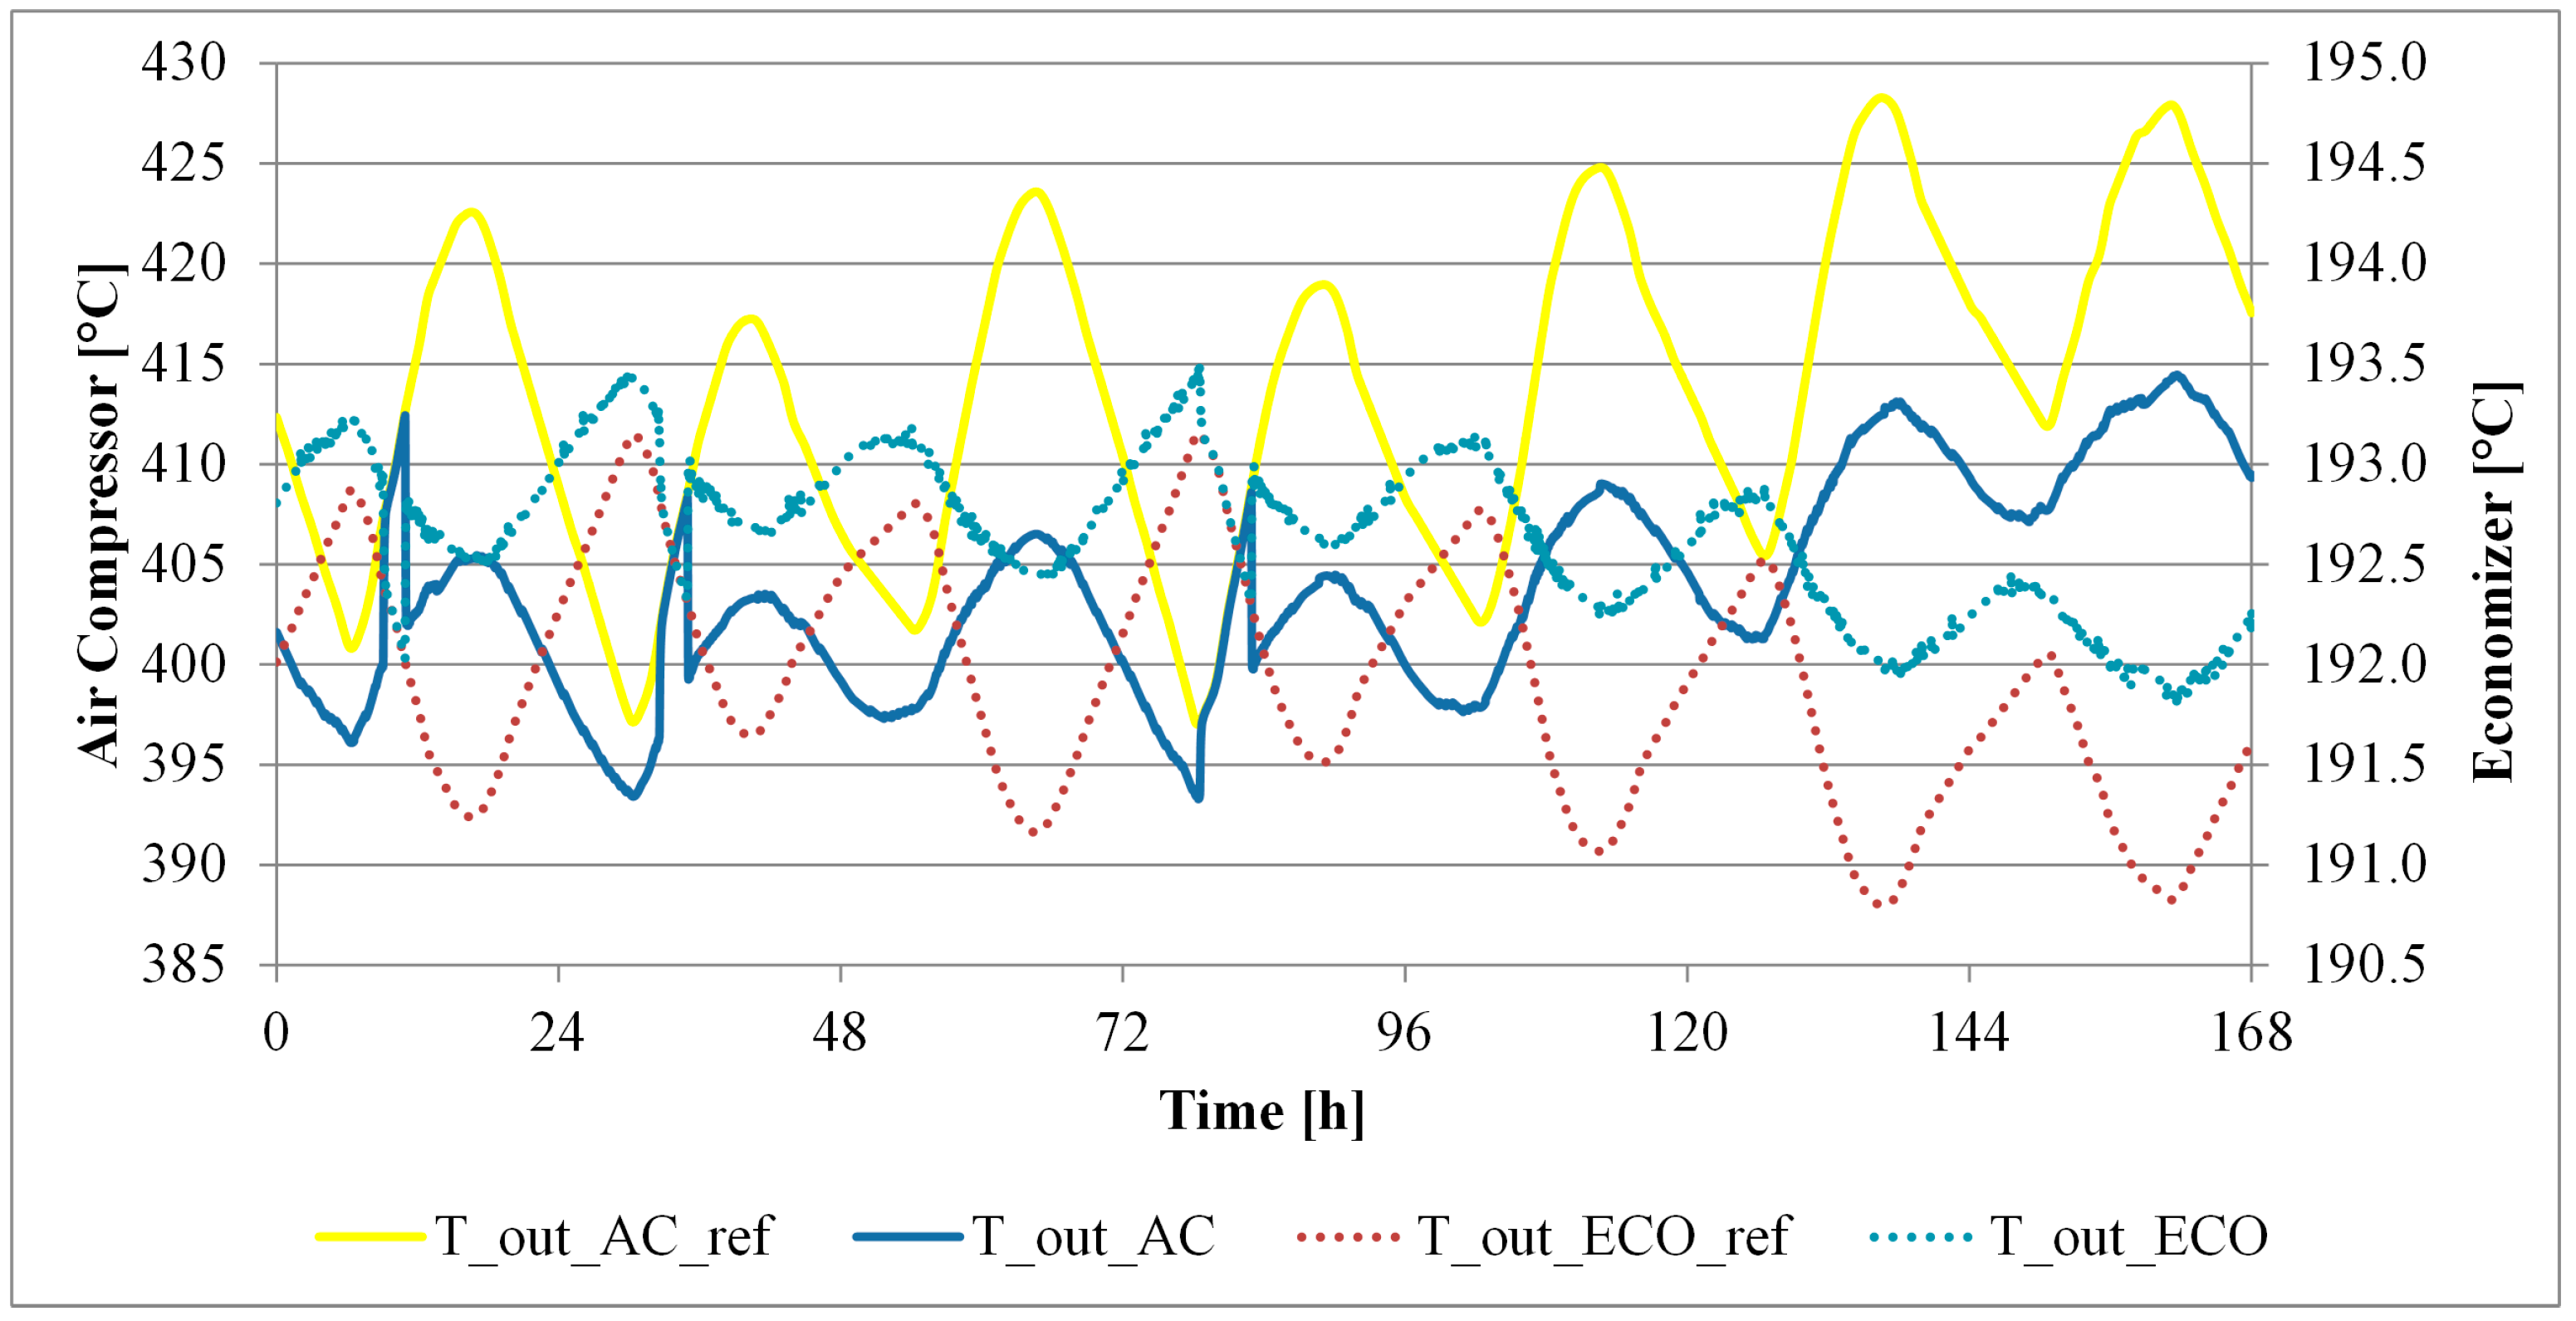
Figure 6. In fact, as expected,
Figure 5 clearly shows that the considered SACC system allows one to achieve lower AC outlet temperatures and an increase of ECO outlet temperatures mainly during the central hours of the day. In fact, this trend can be explained considering that when the compressor air inlet temperature increases, air density decreases determining corresponding reduction of the mass flow rate. Similarly, AC outlet temperature,
T_out_AC, increases as a consequence of the increase of the air inlet temperature. Since CCh outlet temperature is kept constant in order to fit gas turbine constraints, this results in a lower energy flow. Such variations also affect the heat exchange in the heat recovery steam generator, determining a marginal decrease of ST inlet temperature of the SACC compared with the CC reference case. In fact, in HRSG the heat exchangers have fixed characteristics and, in this way, a lower energy intake determines an increased efficiency of the components. Conversely, a decrease in AC outlet temperature leads to an increase in ECO outlet temperature. ECO outlet temperature is negligibly affected by the eventual AC inlet air cooling.
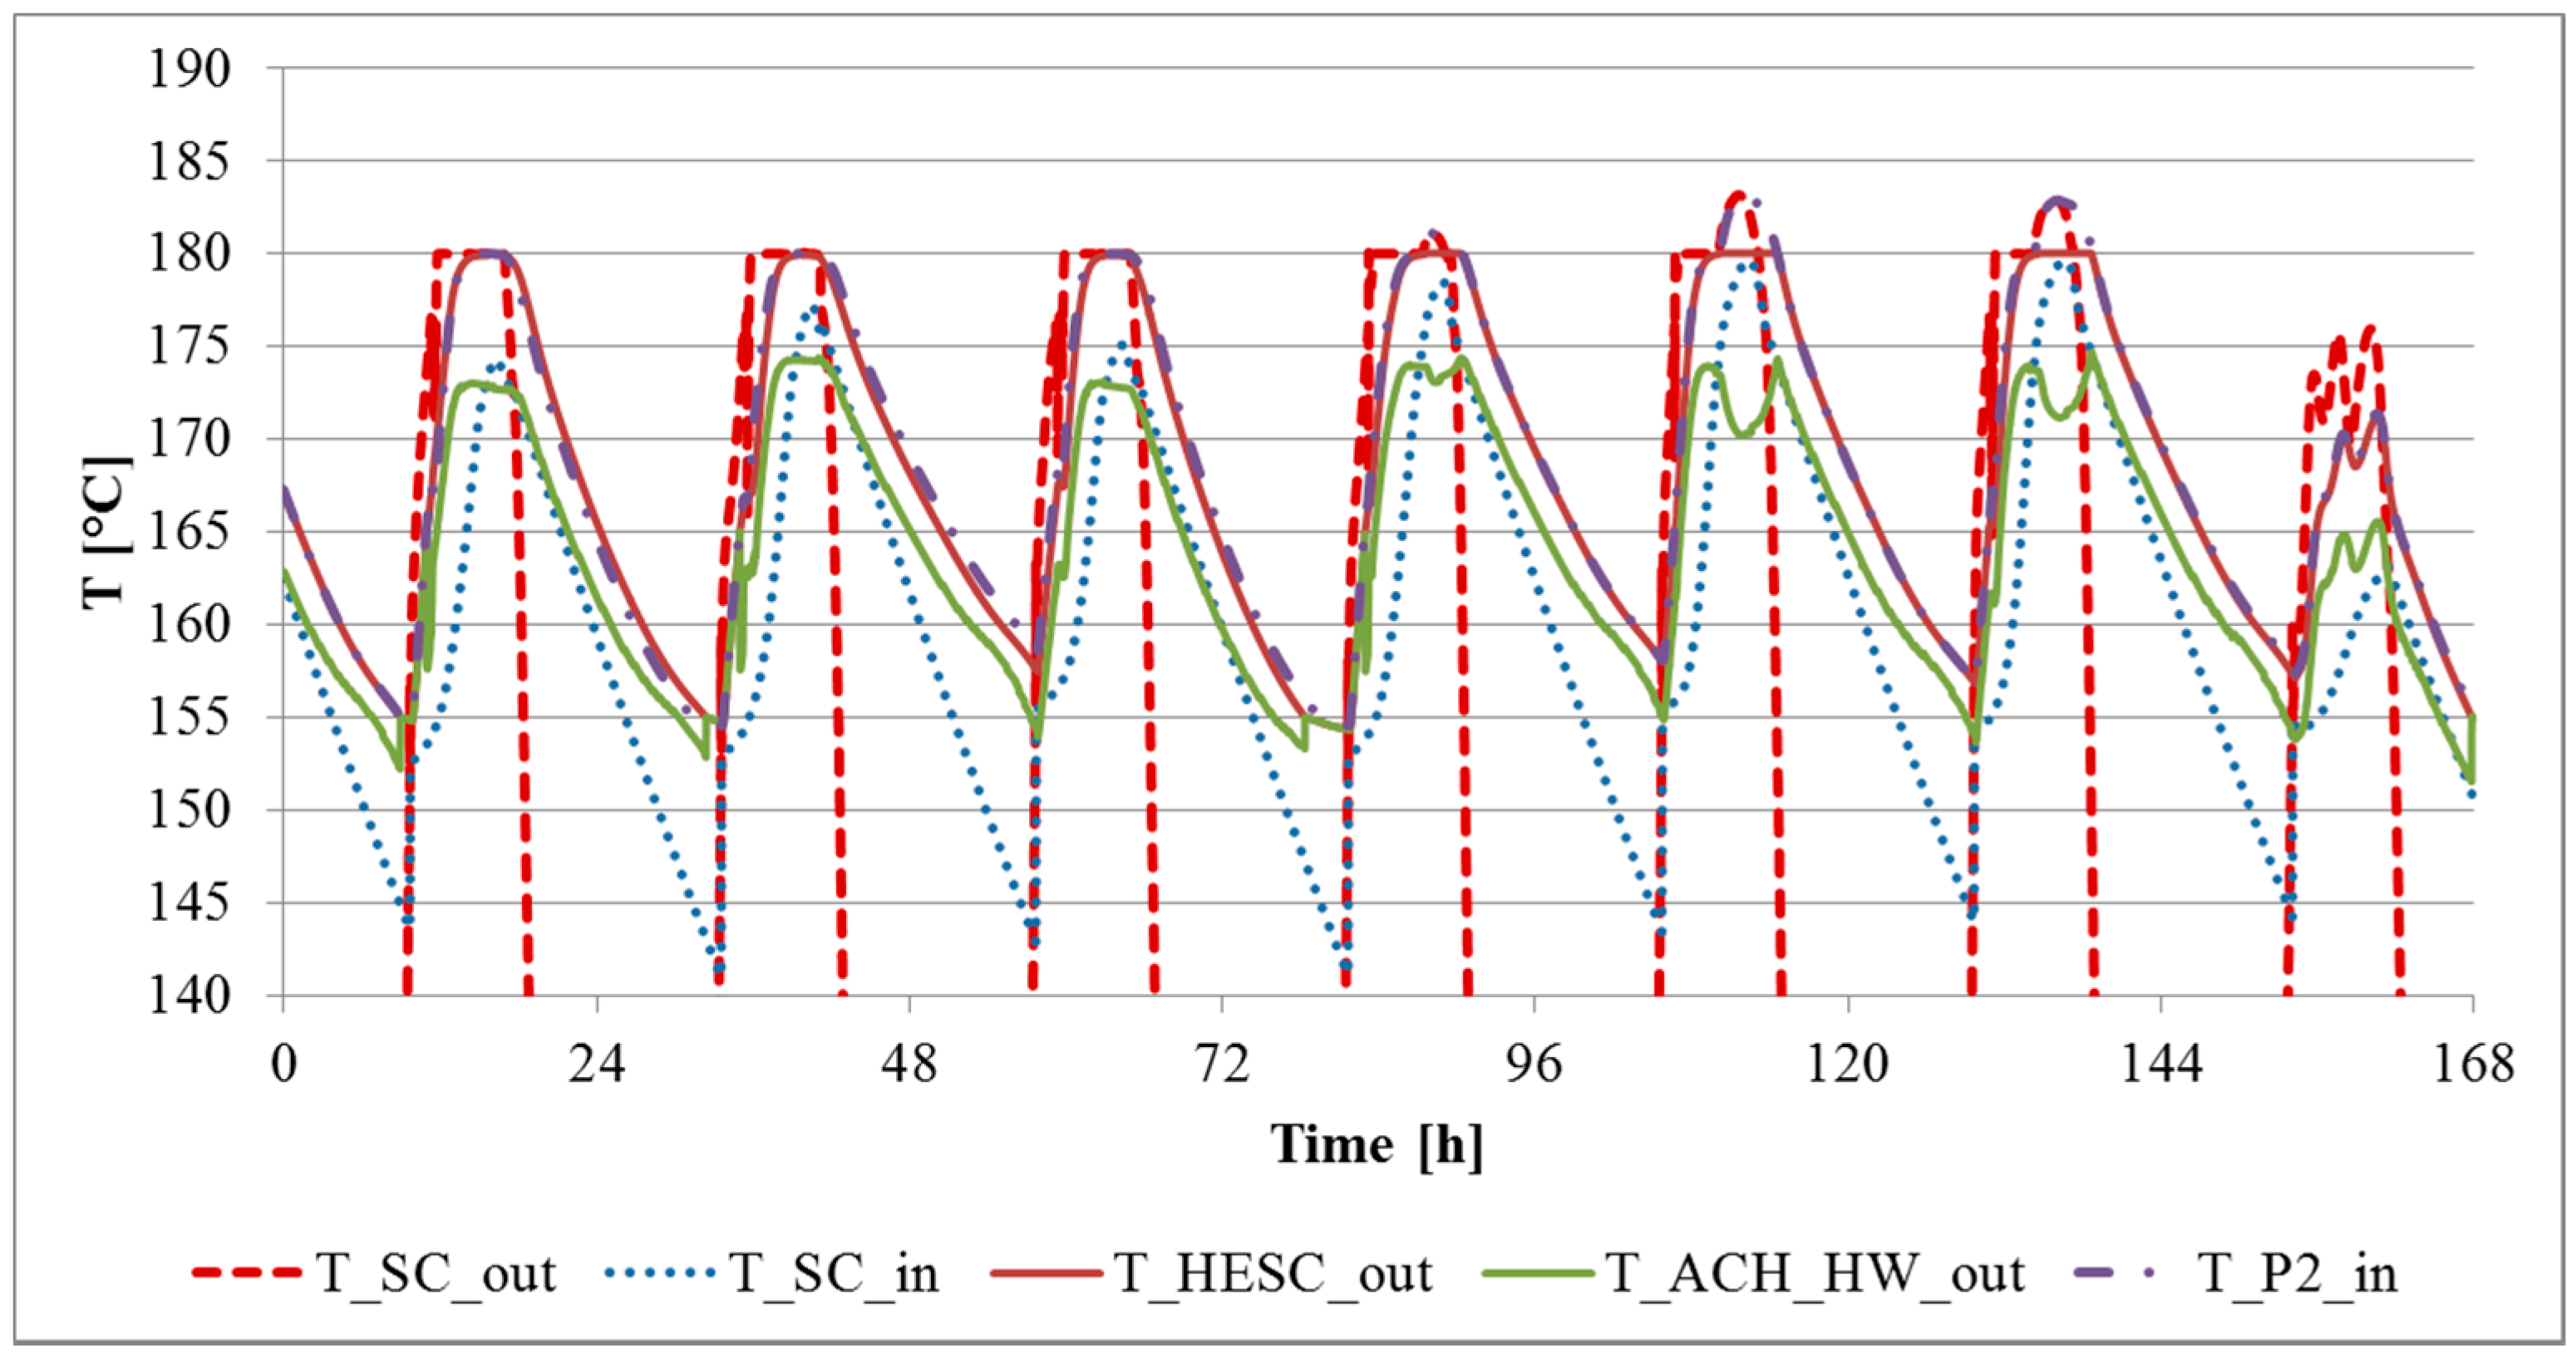
Figure 7 shows some of the main temperatures for the same period within the solar cooling subsystem. Here, it is clearly shown that SCs can achieve the set point temperature of 180 °C for the majority of the daylight time. As shown in
Figure 7, in some cases of high radiation and low load, the solar collector outlet temperature is higher than 180 °C, determining also a corresponding increase of the hot water supplying the ACH (
TP2,in). This occurs also when the control signal of controller operating on P1 pump is maximum and equal to 1. In this case, the HESC is activated in order to prevent system overheating and reduce ACH inlet temperature to 180 °C. Conversely, as shown in last day of this representative week, when solar radiation is low, the controller will minimize the control signal managing P1. However, even at the minimum flow rate, SC outlet temperature may not reach the set point of 180 °C.
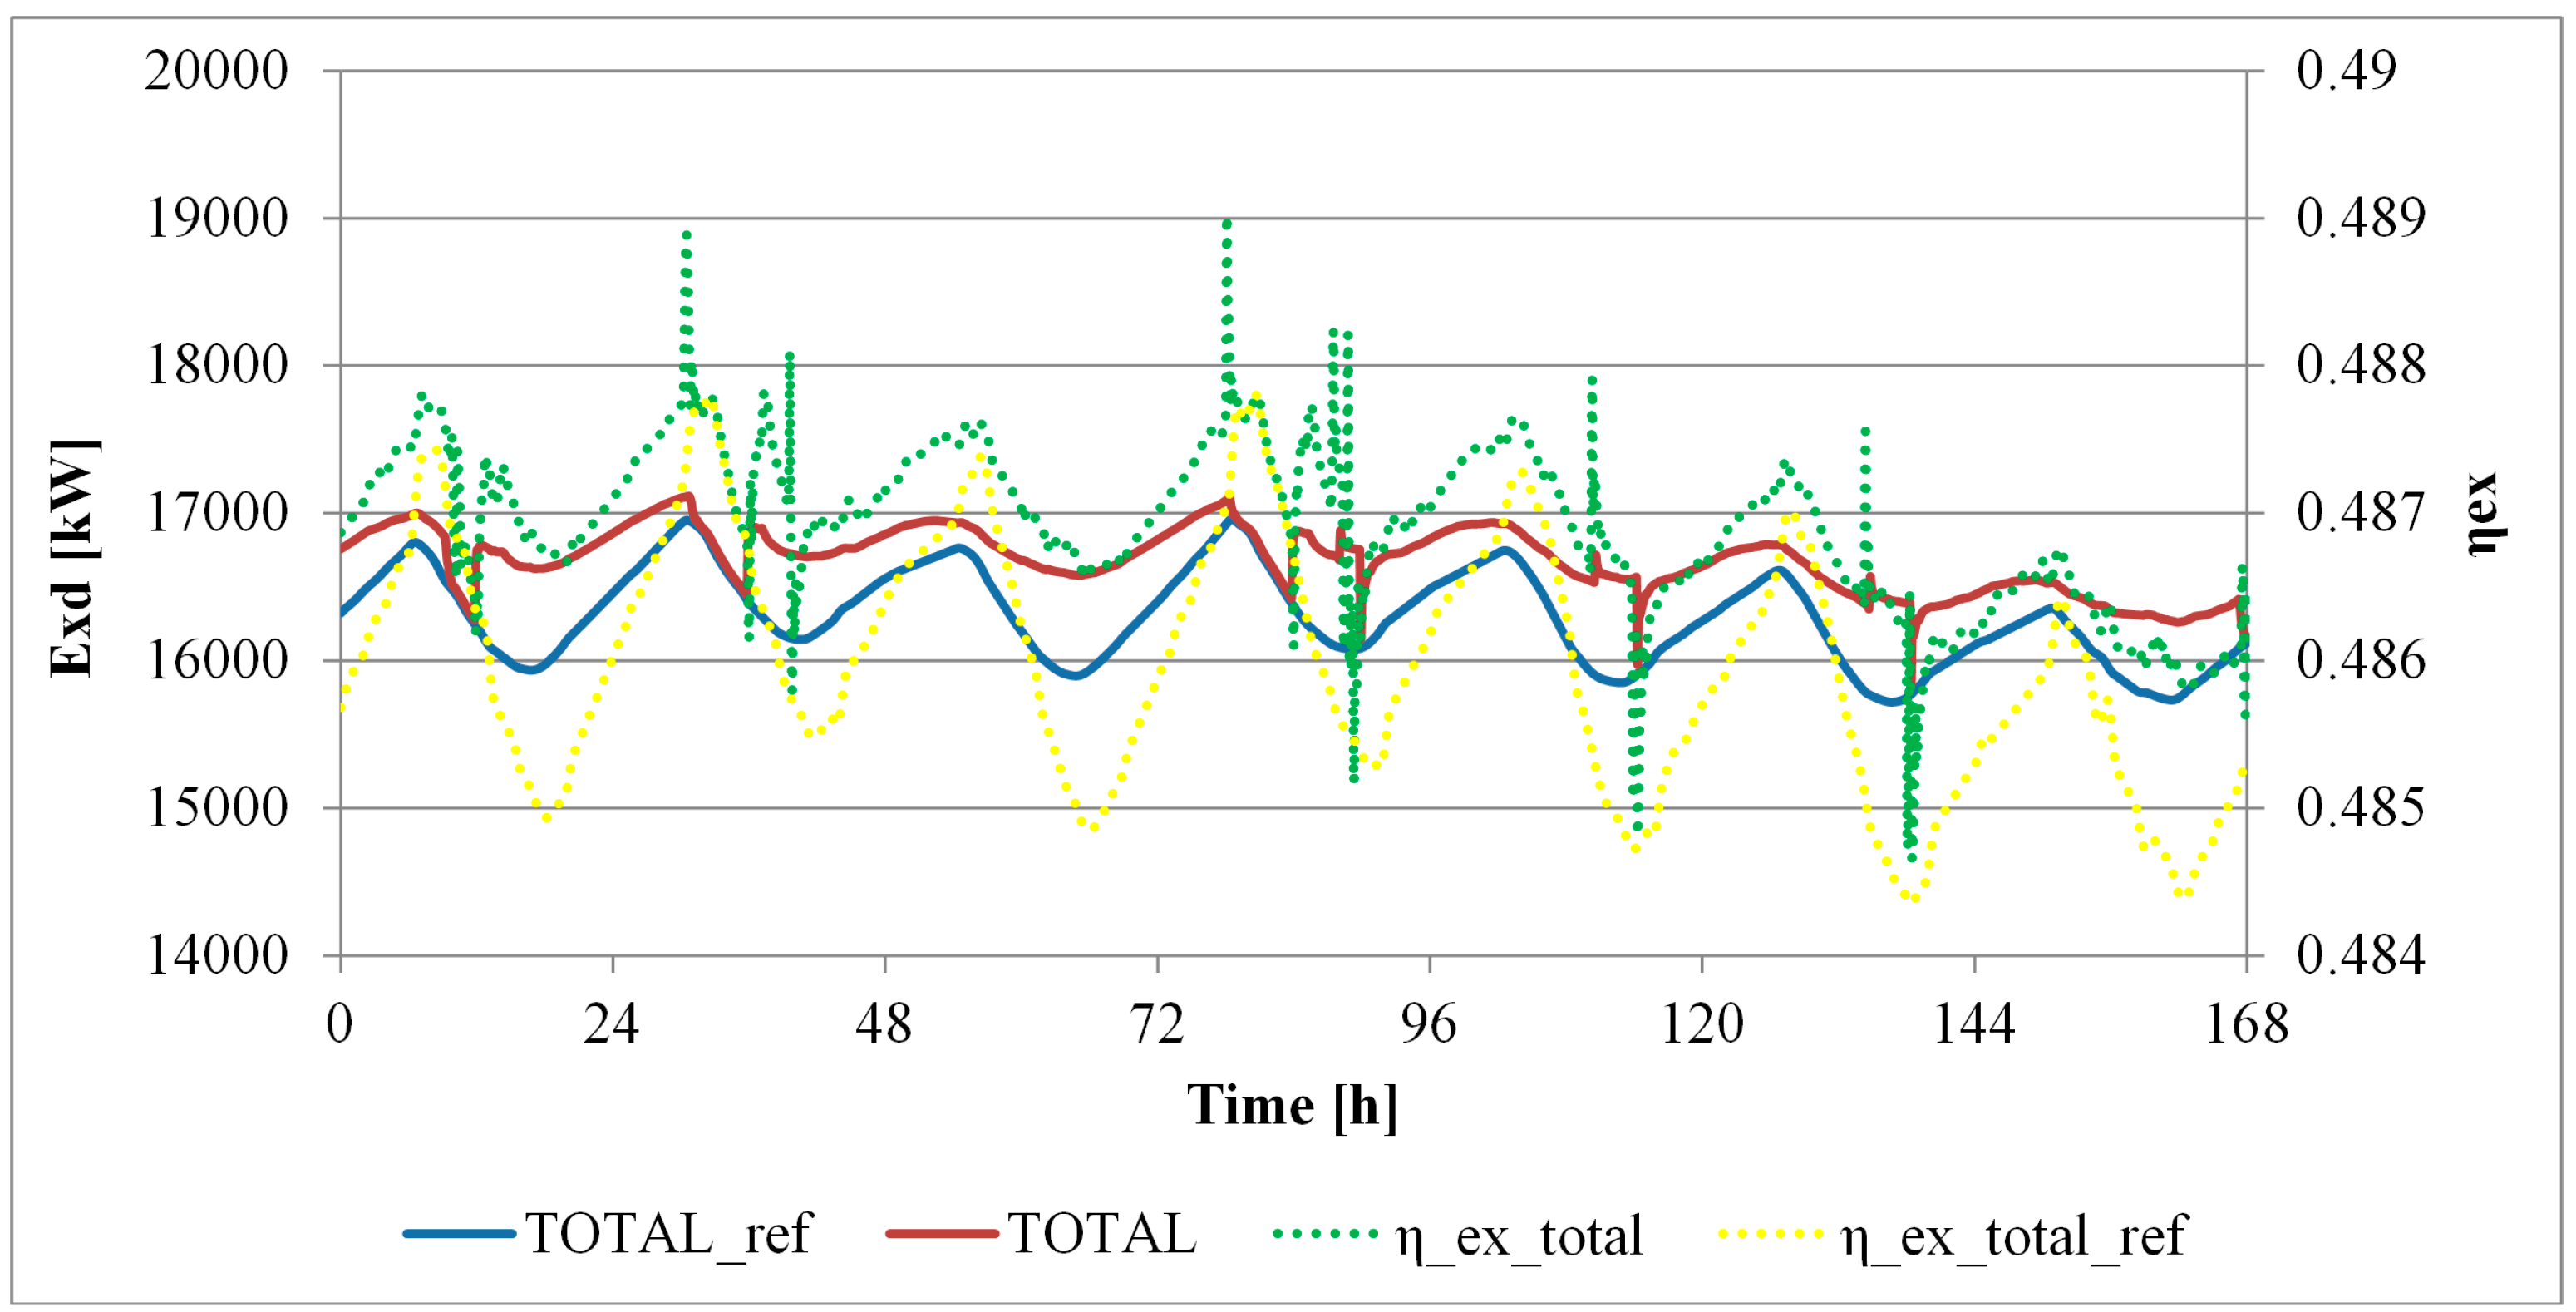
On the basis of such energetic results the subsequent exergetic results can be better interpreted. In fact,
Figure 8 shows exergy destructions and exergetic efficiency (for the same week 32) in case of the proposed SACC system vs. a conventional CC system. Note that exergy destructions and exergetic efficiencies are calculated considering a control volume including only the combined cycle (excluding the solar cooling subsystem in case of the proposed SACC system), in order to study exergy variations only related to the CC. Here, it is clearly shown that, during the central hours of the day, the operation of the solar cooling subsystem determines a noticeable increase of the exergy destruction of the SACC compared with the one of the reference CC. This is due to the simultaneous increase of electrical capacity of the proposed CC (higher exergetic product) and fuel (natural gas) discussed in the previous figures. In fact, the solar cooling subsystem forces the CC subsystem to increase its capacity also determining a corresponding increase (exogenous) of its irreversibilities. Conversely, the exergetic efficiency of the proposed CC is better than the conventional CC one, as a consequence of the lower air inlet temperature.
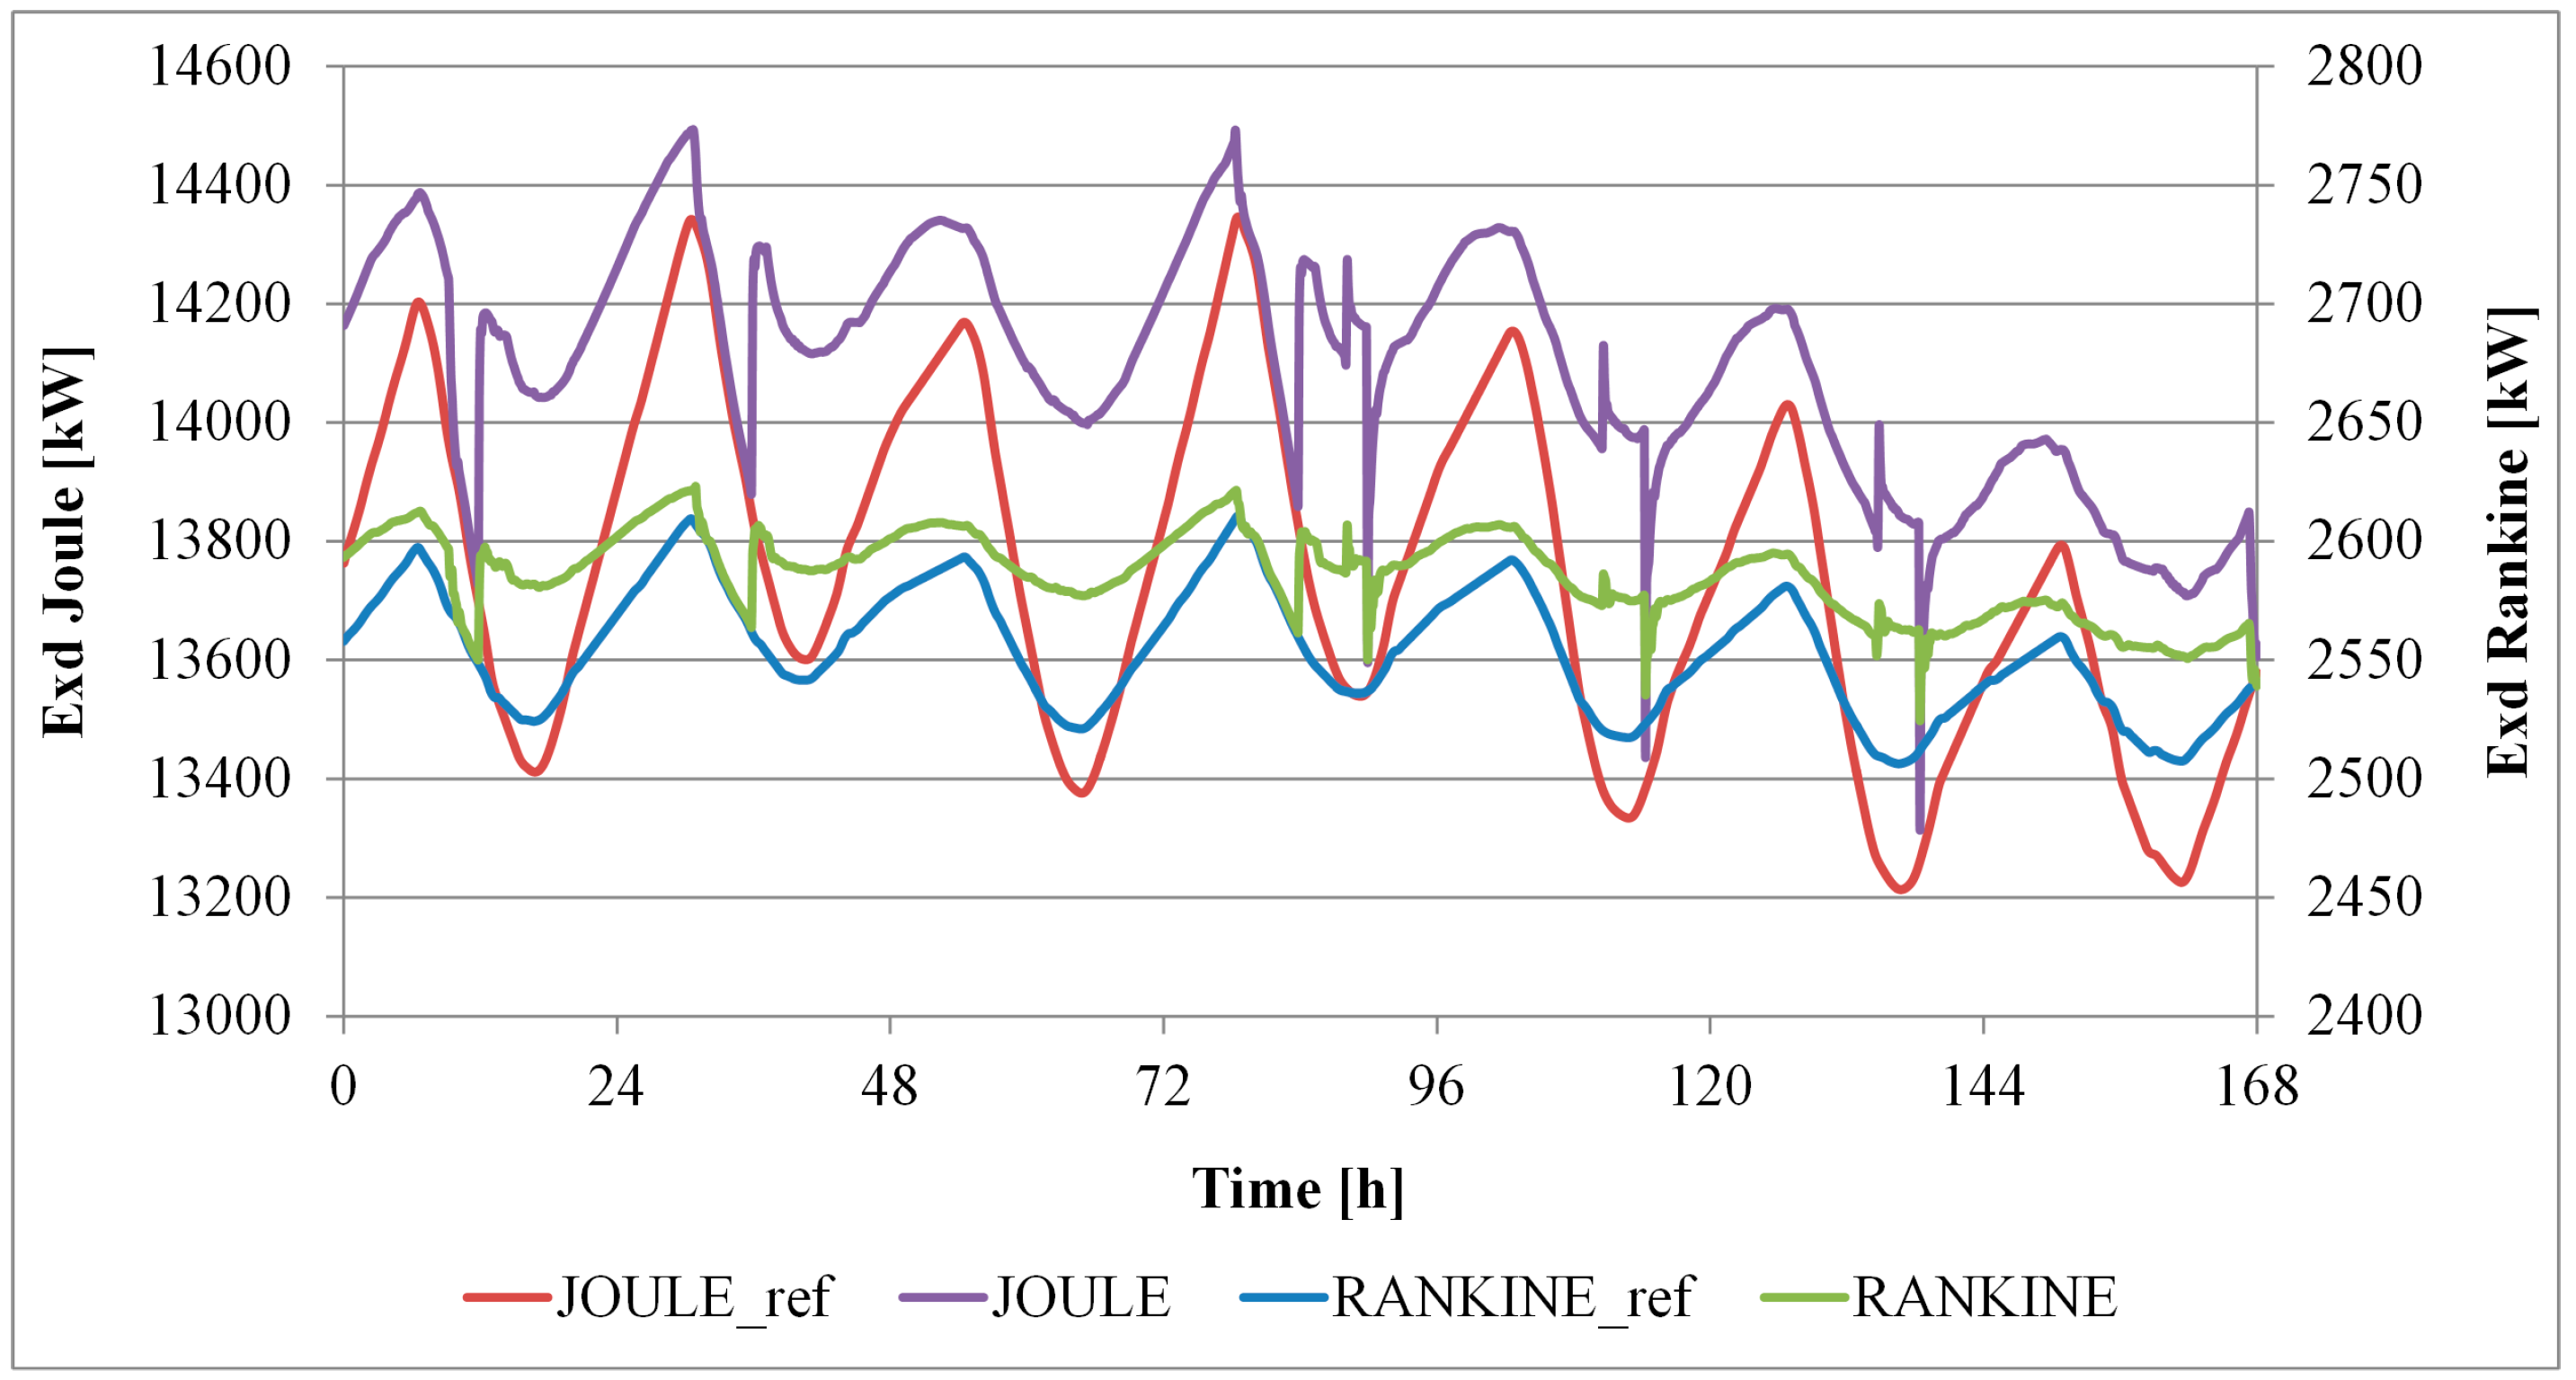
Figure 9 shows that the majority of the exergy destruction is due to the Joule subsystem. This is also much more sensitive to the possible utilization of the solar cooling technology. In fact, during the central hours of the day a noticeable increase of the exergy destruction is achieved as a consequence of the higher exergy product (
Figure 4). A similar trend, with a lower magnitude, is achieved by the Rankine subsystem. It is worth noting that such increases in exergy destructions do not correspond to a loss of efficiency. This is simply caused by the increase of the exergetic product.
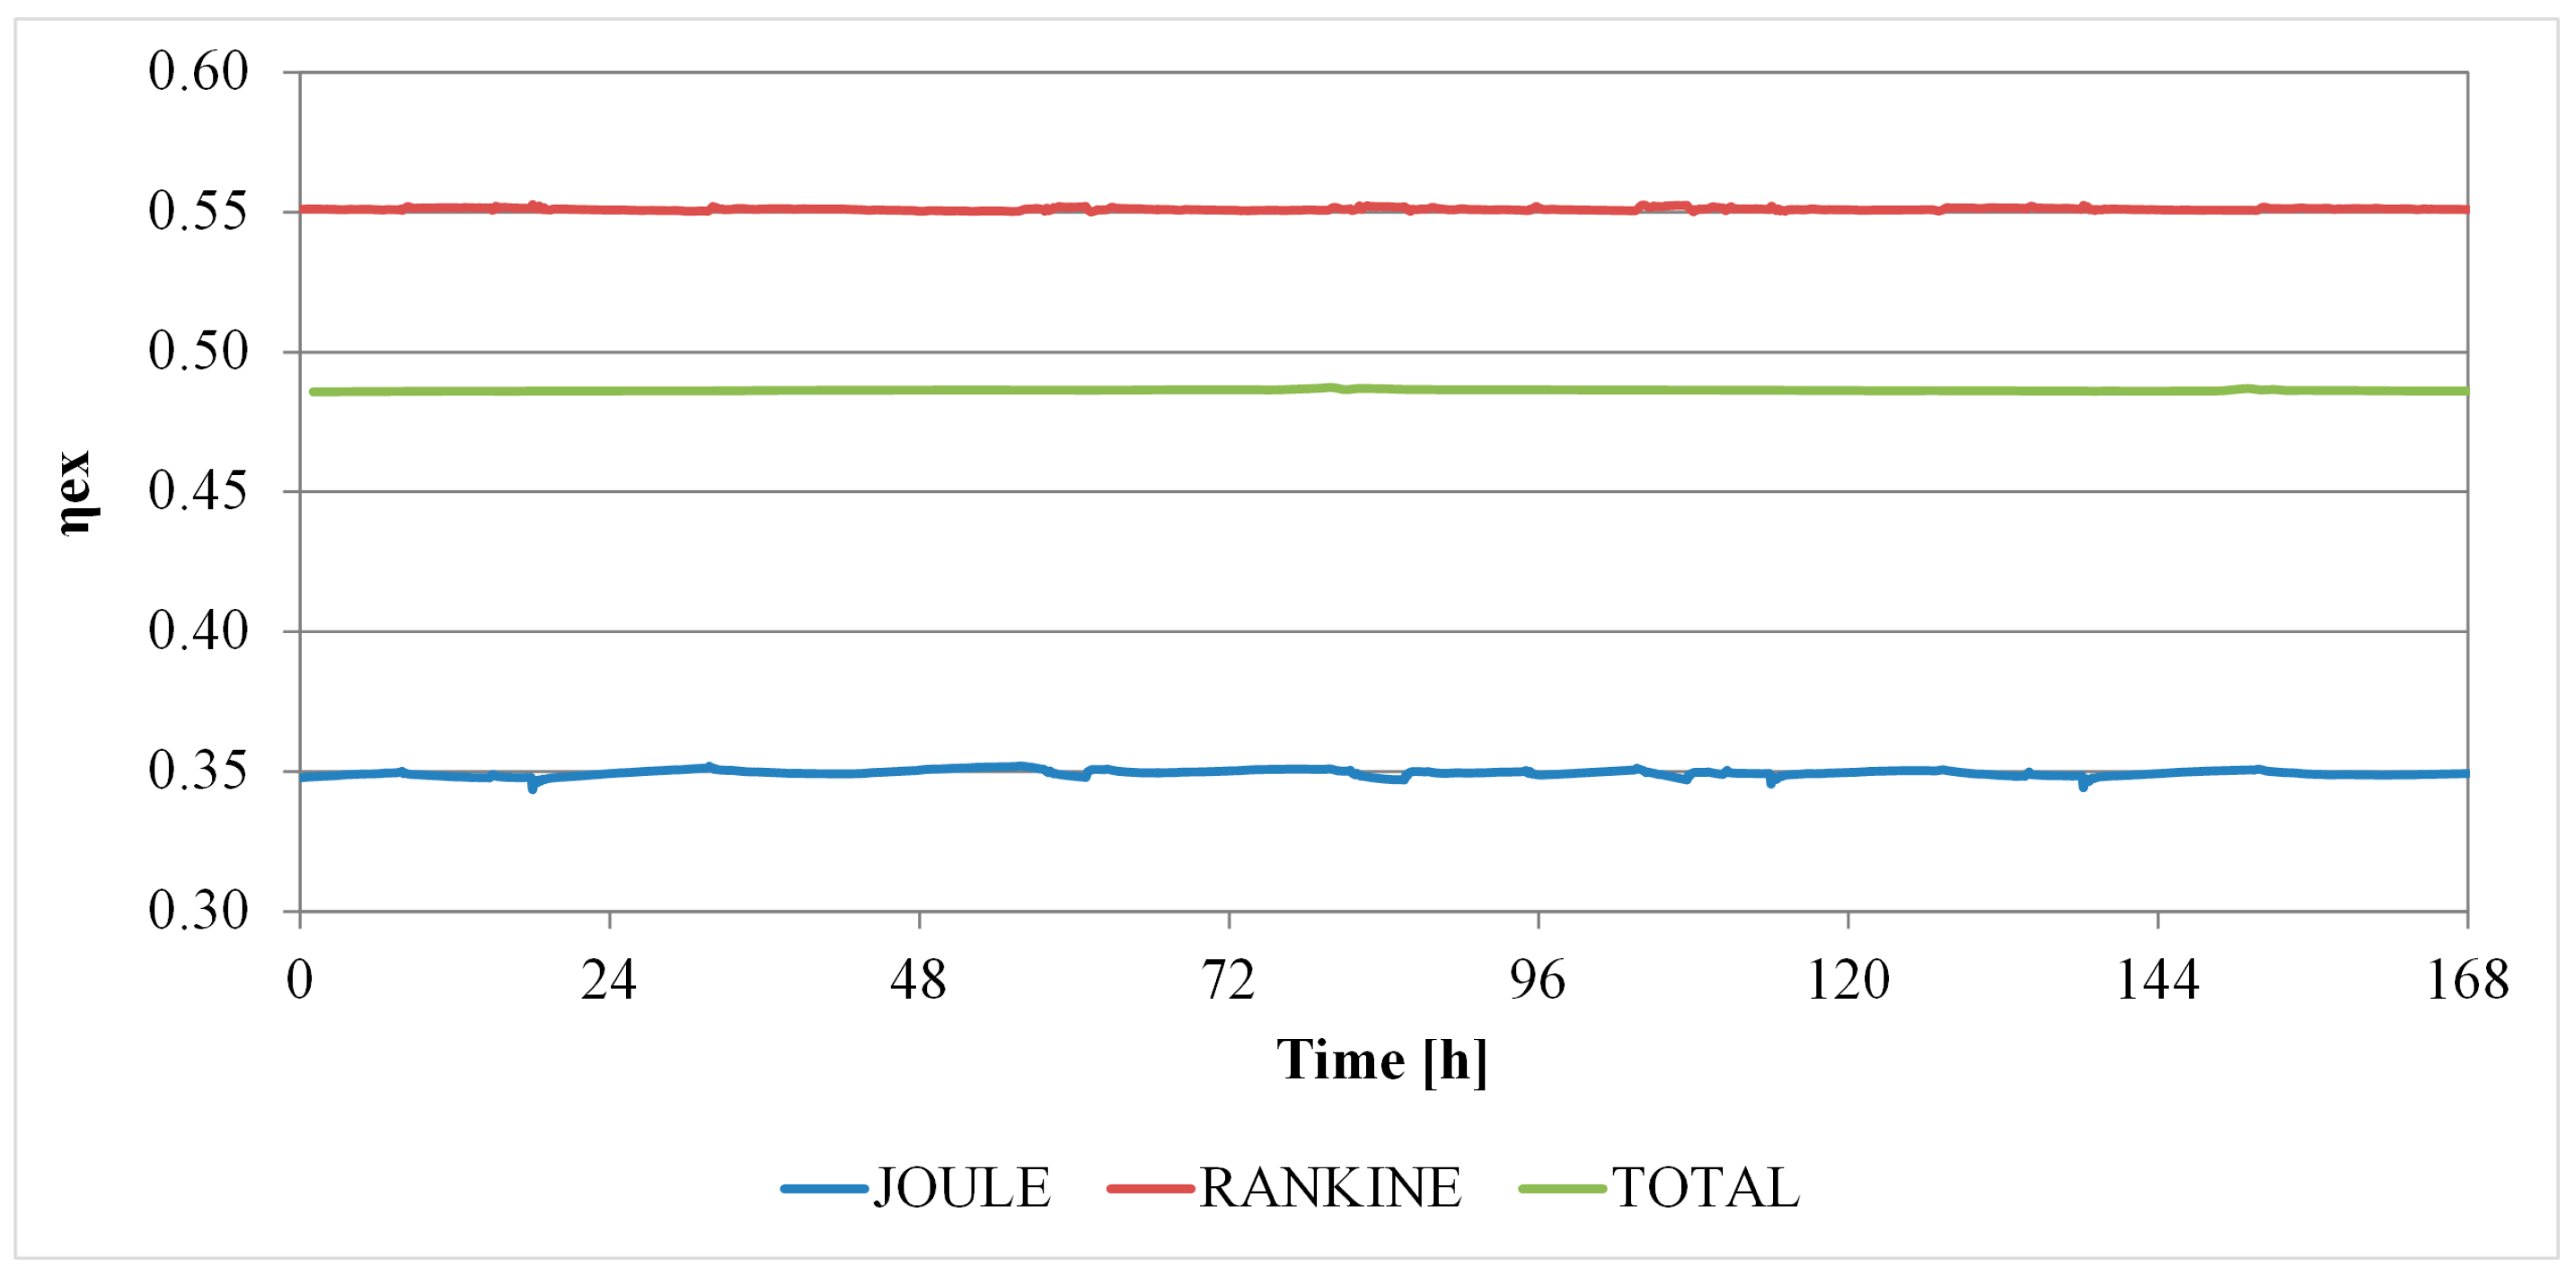
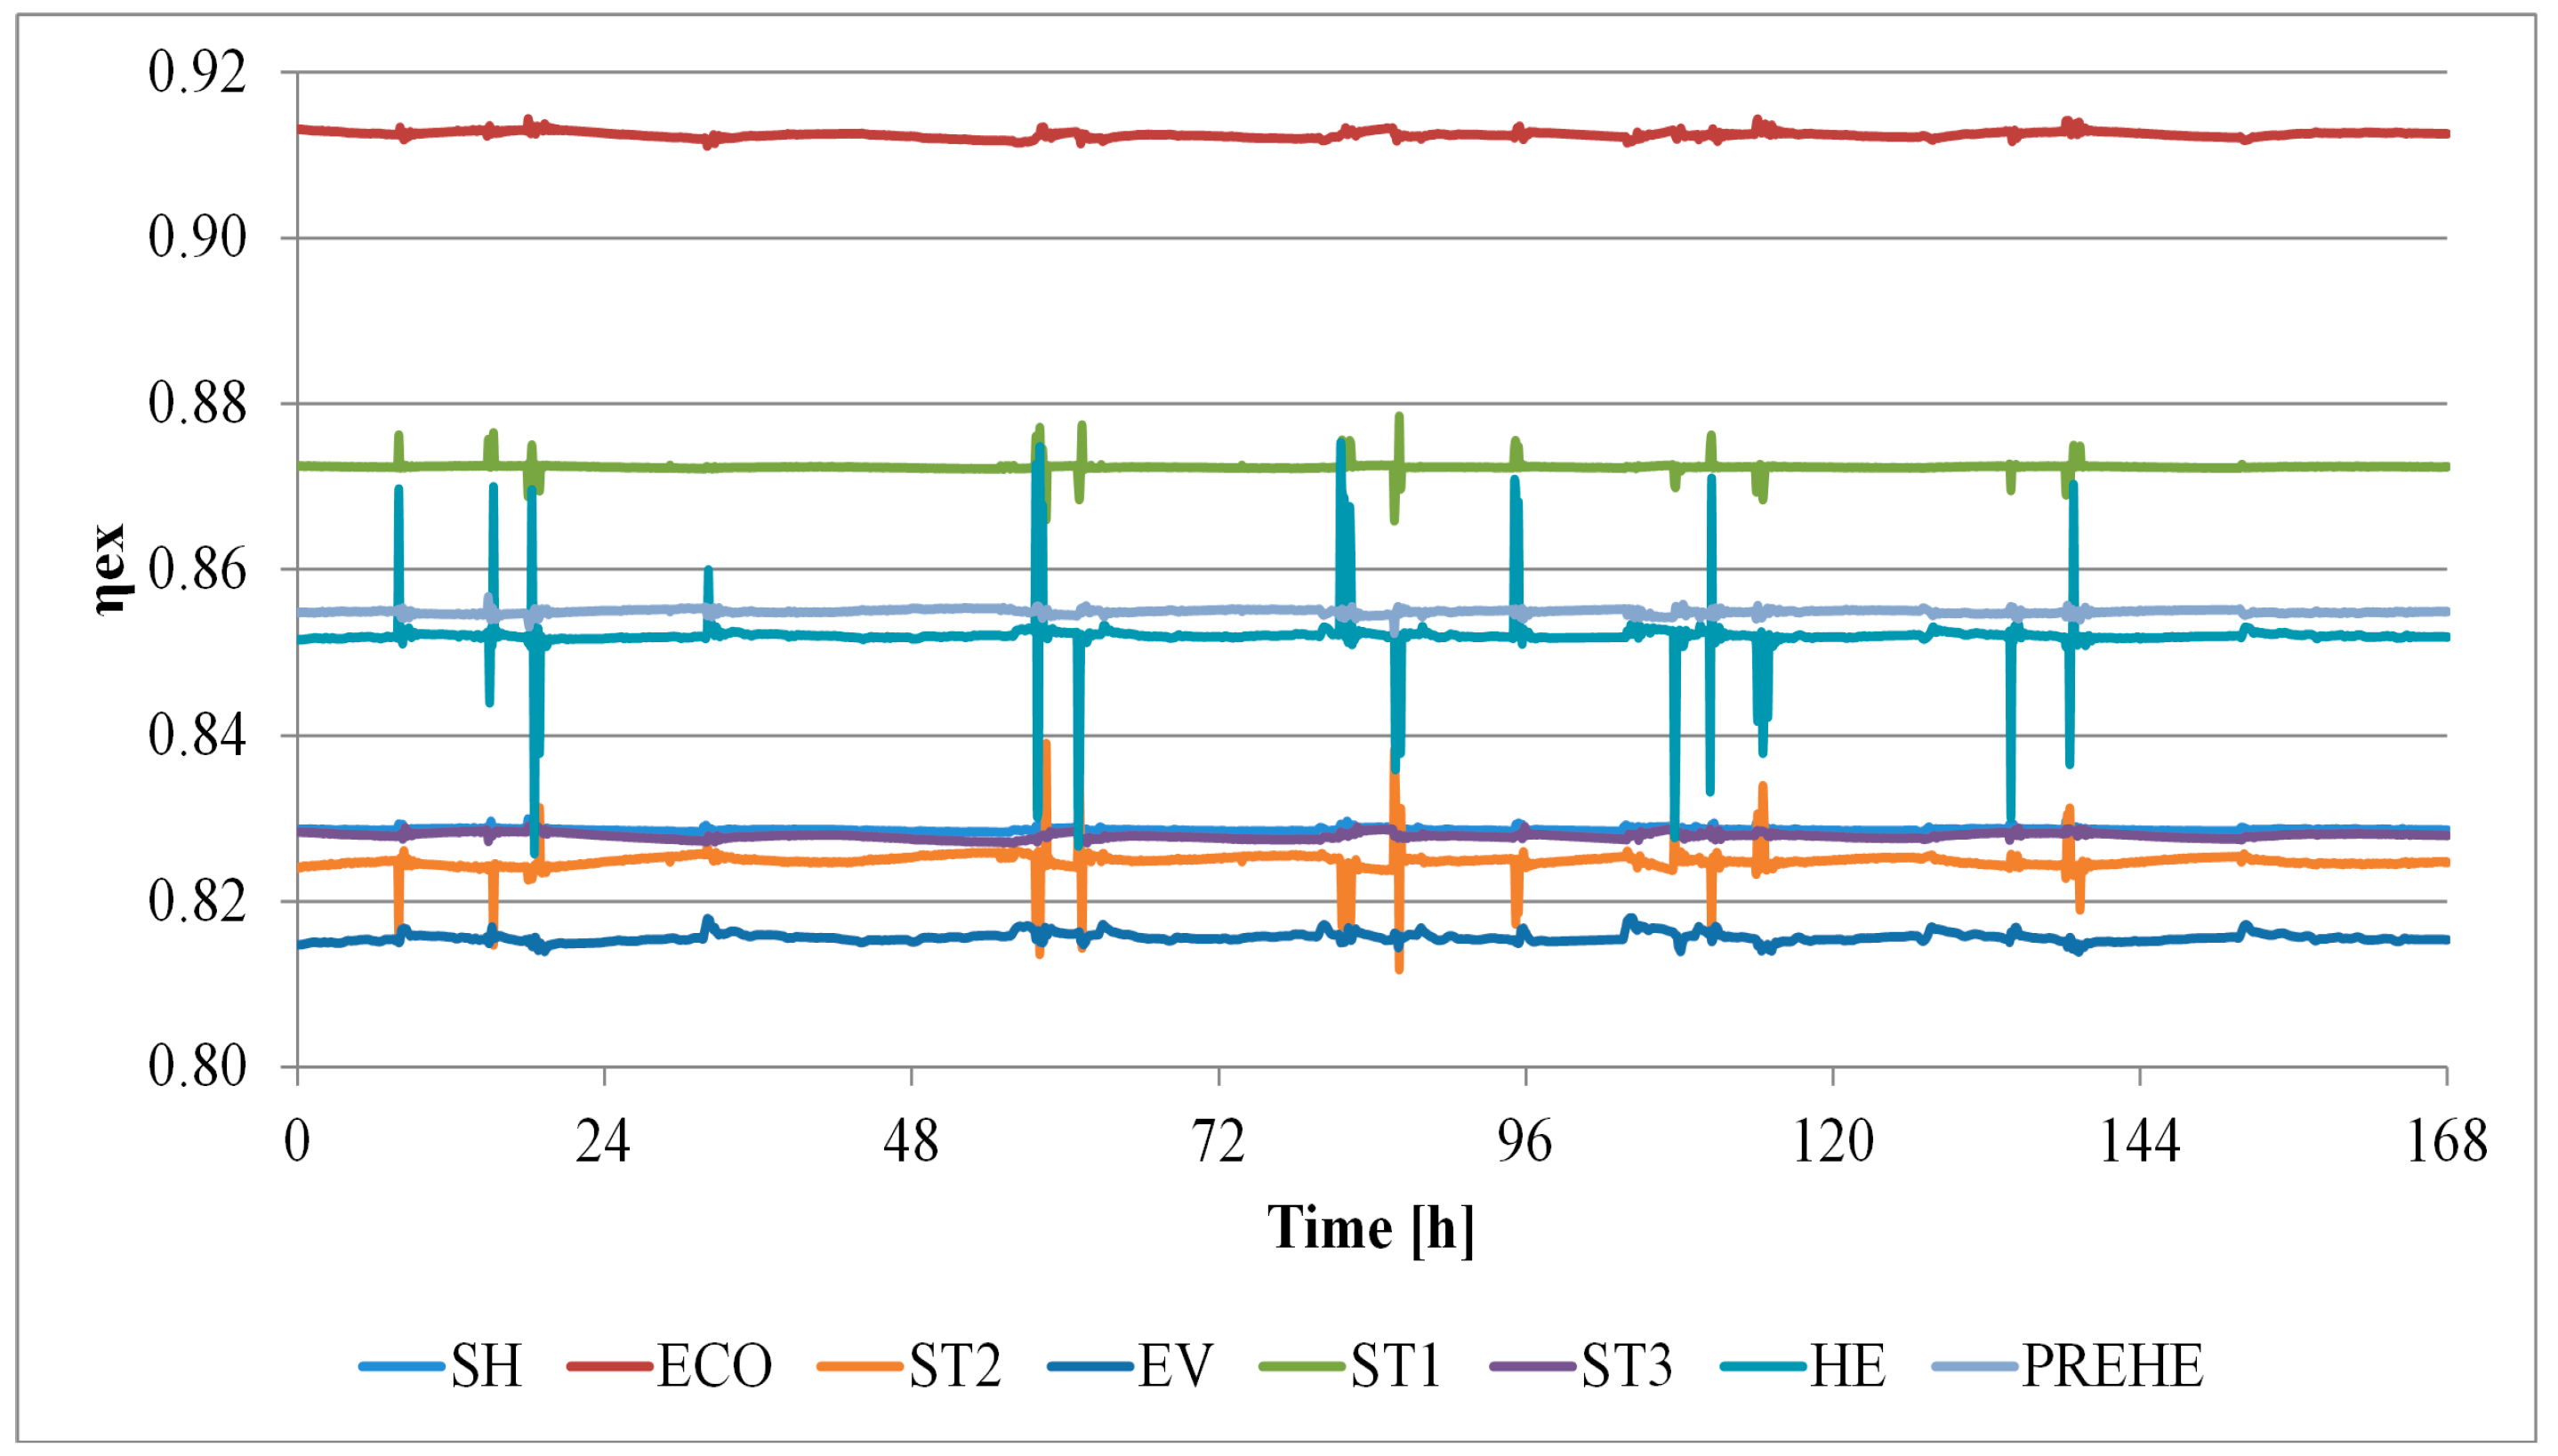
Figure 10 shows the exergy efficiencies during the considered week. Here, it is clearly shown that all those efficiencies are very stable during the dynamic operation of the system, only showing marginal fluctuations due the variation of environmental conditions. As expected, the Rankine exergetic efficiency is much higher than the Joule one. This is due to the high irreversibilities occurring in the Joule combustion chamber. This is better shown in
Figure 11 and
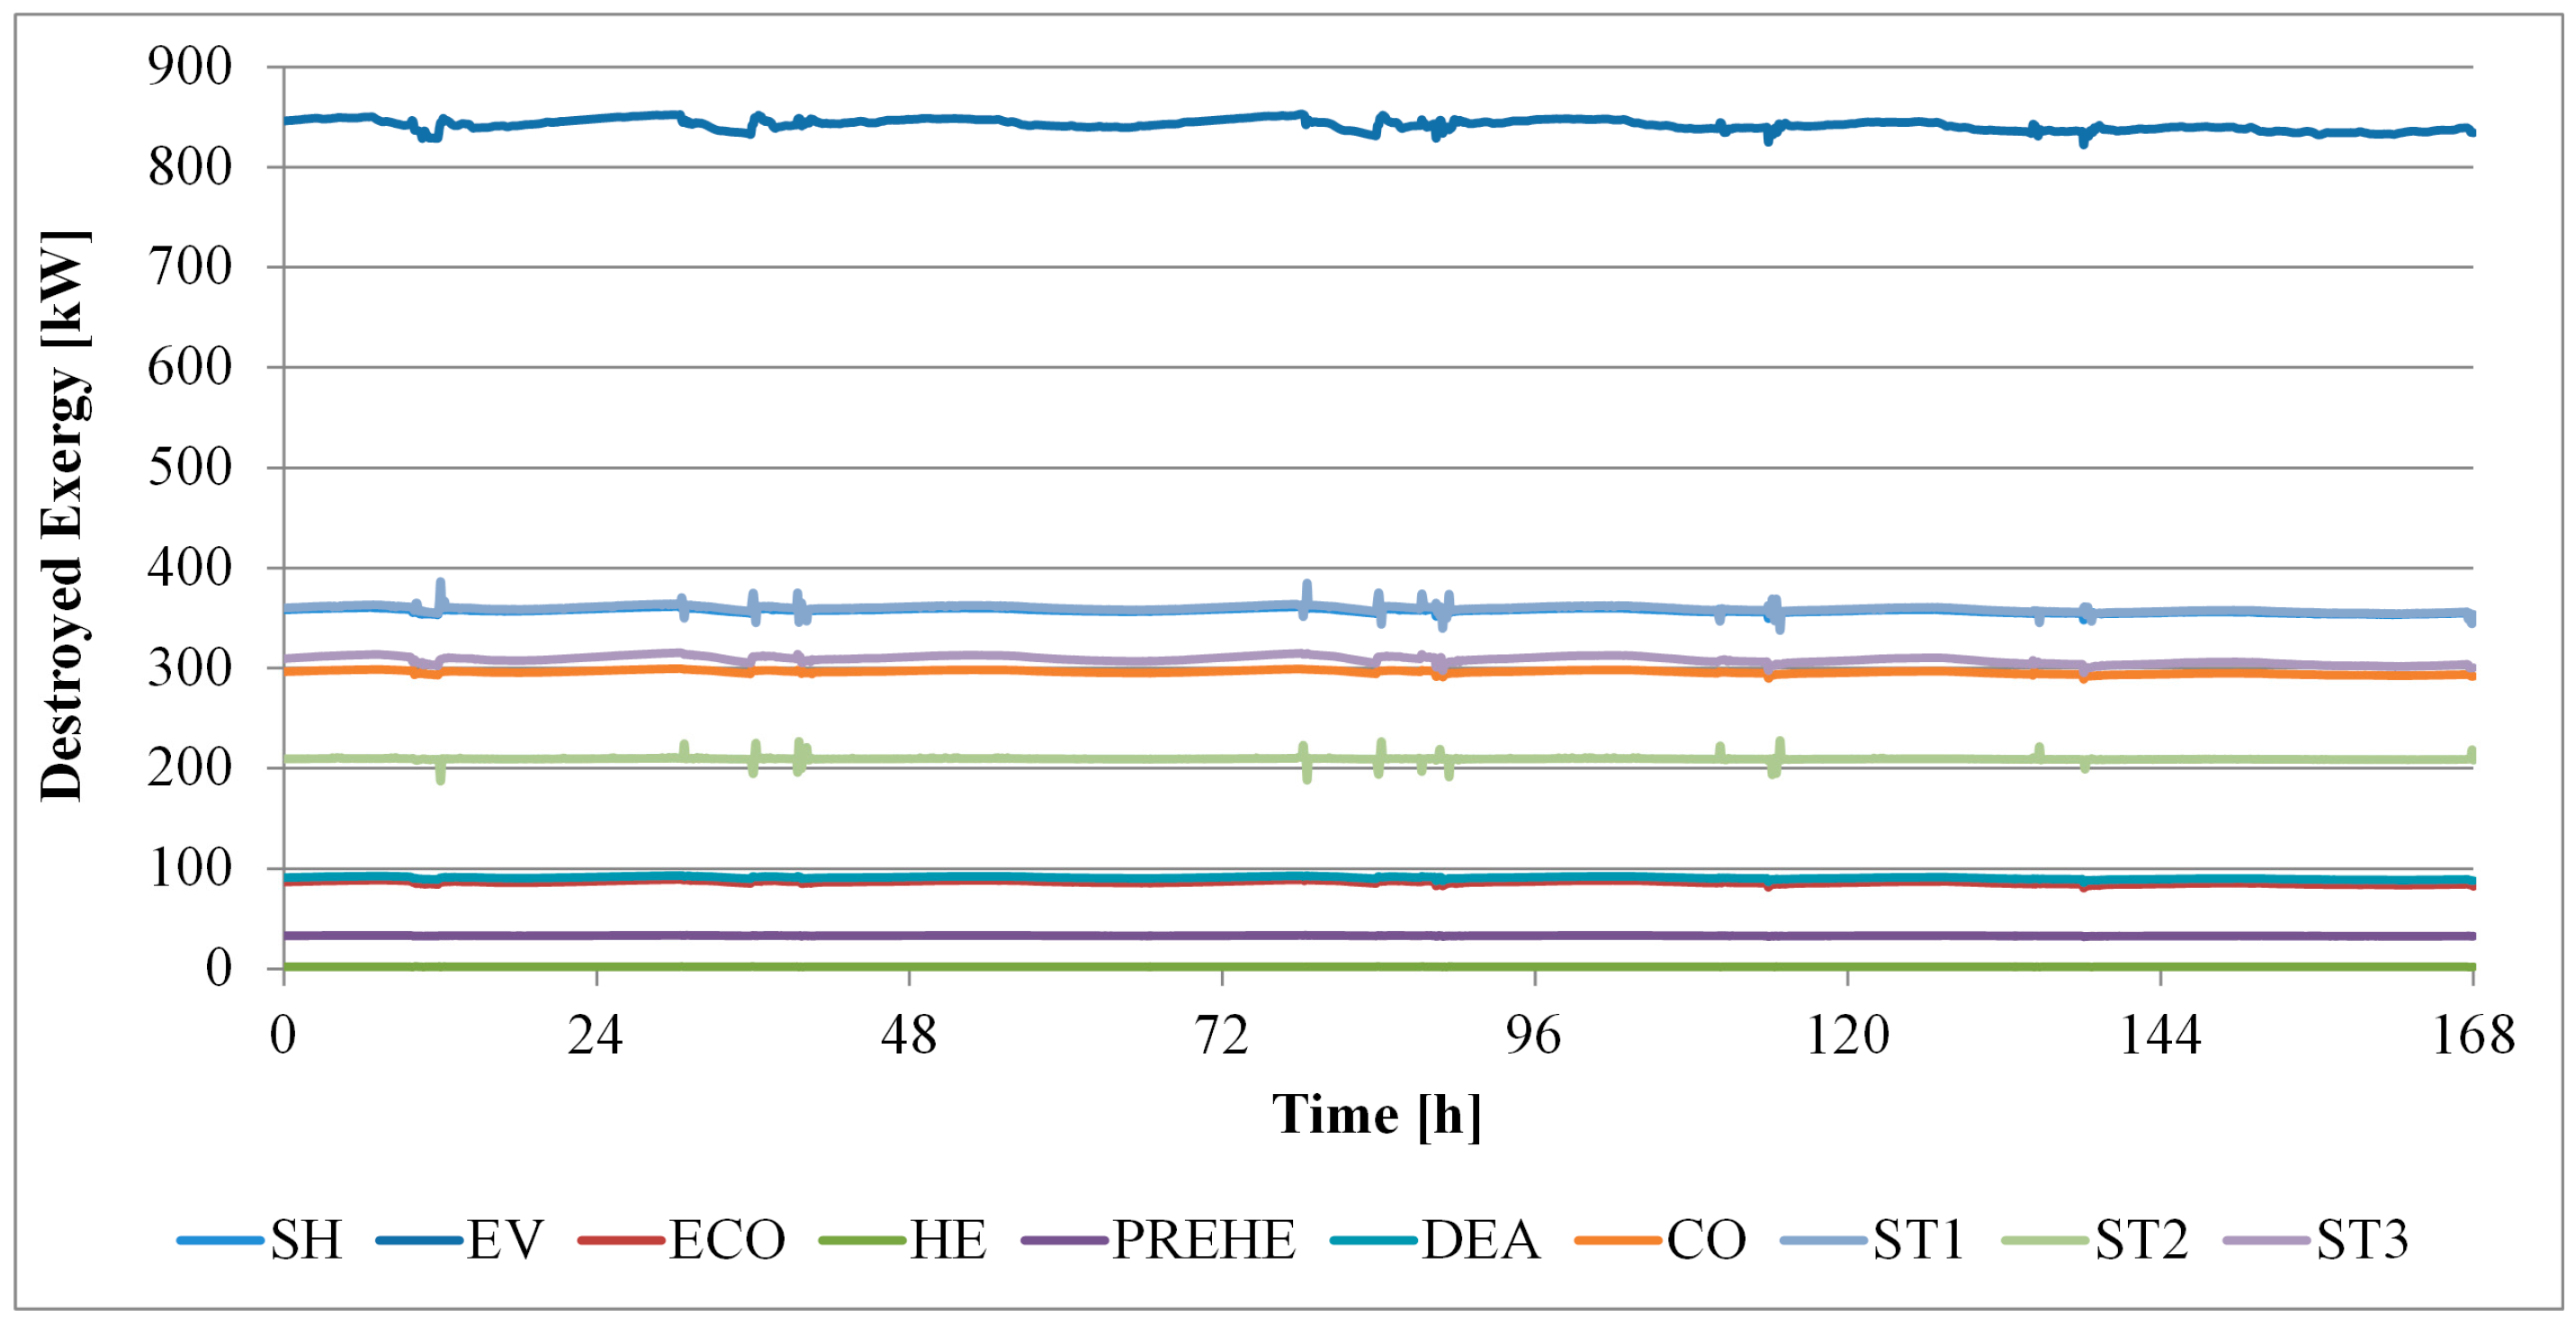
Figure 12 reporting exergy destructions and exergetic efficiencies for the components of the Rankine cycle. Here, it is shown that the highest exergy destruction is found in the evaporator. This is an expected result for a single pressure CC, exhibiting large temperature differences in the heat recovery steam generator. Such irreversibilities may be limited considering a more complex triple pressure levels CC. Significant irreversibilities are achieved by the ST, which is responsible of the majority of the exergetic product.
Finally, a noticeable exergetic destruction by the condenser is achieved. This device is a dissipating component (from the exergetic point of view). Therefore its exergetic efficiency cannot be defined. Conversely, the exergetic efficiencies of all the remaining components are very high, as shown in
Figure 12.
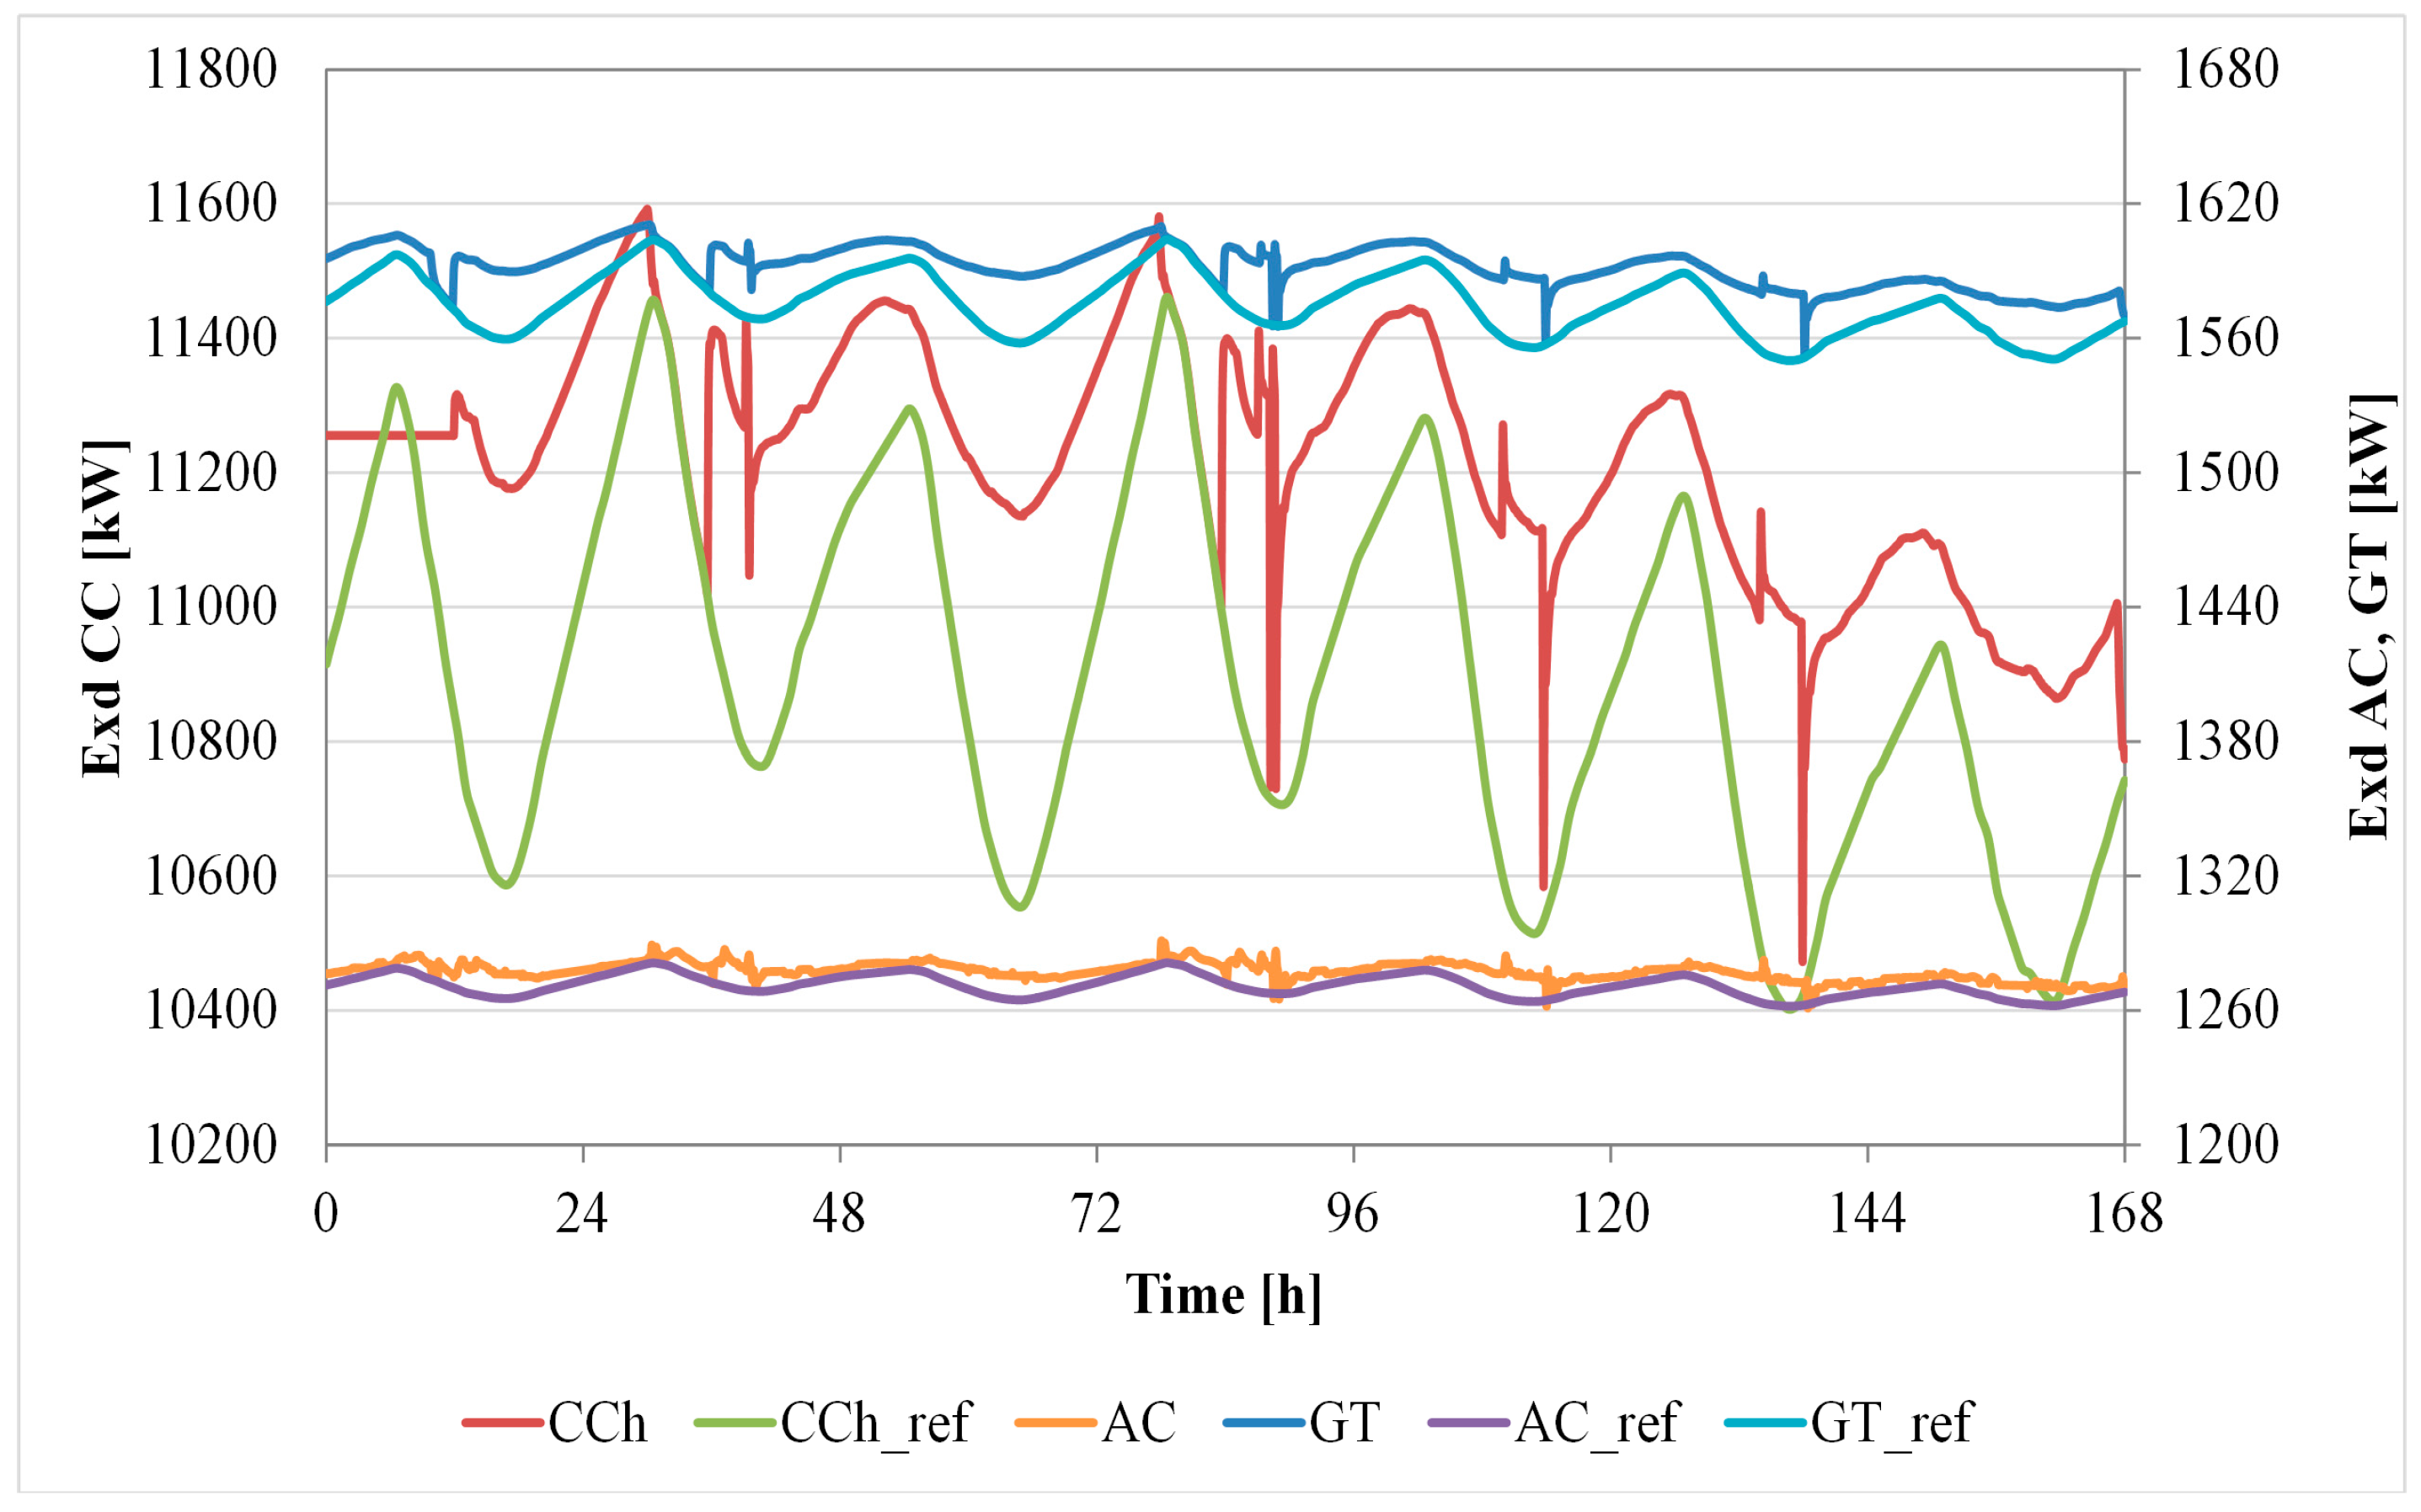
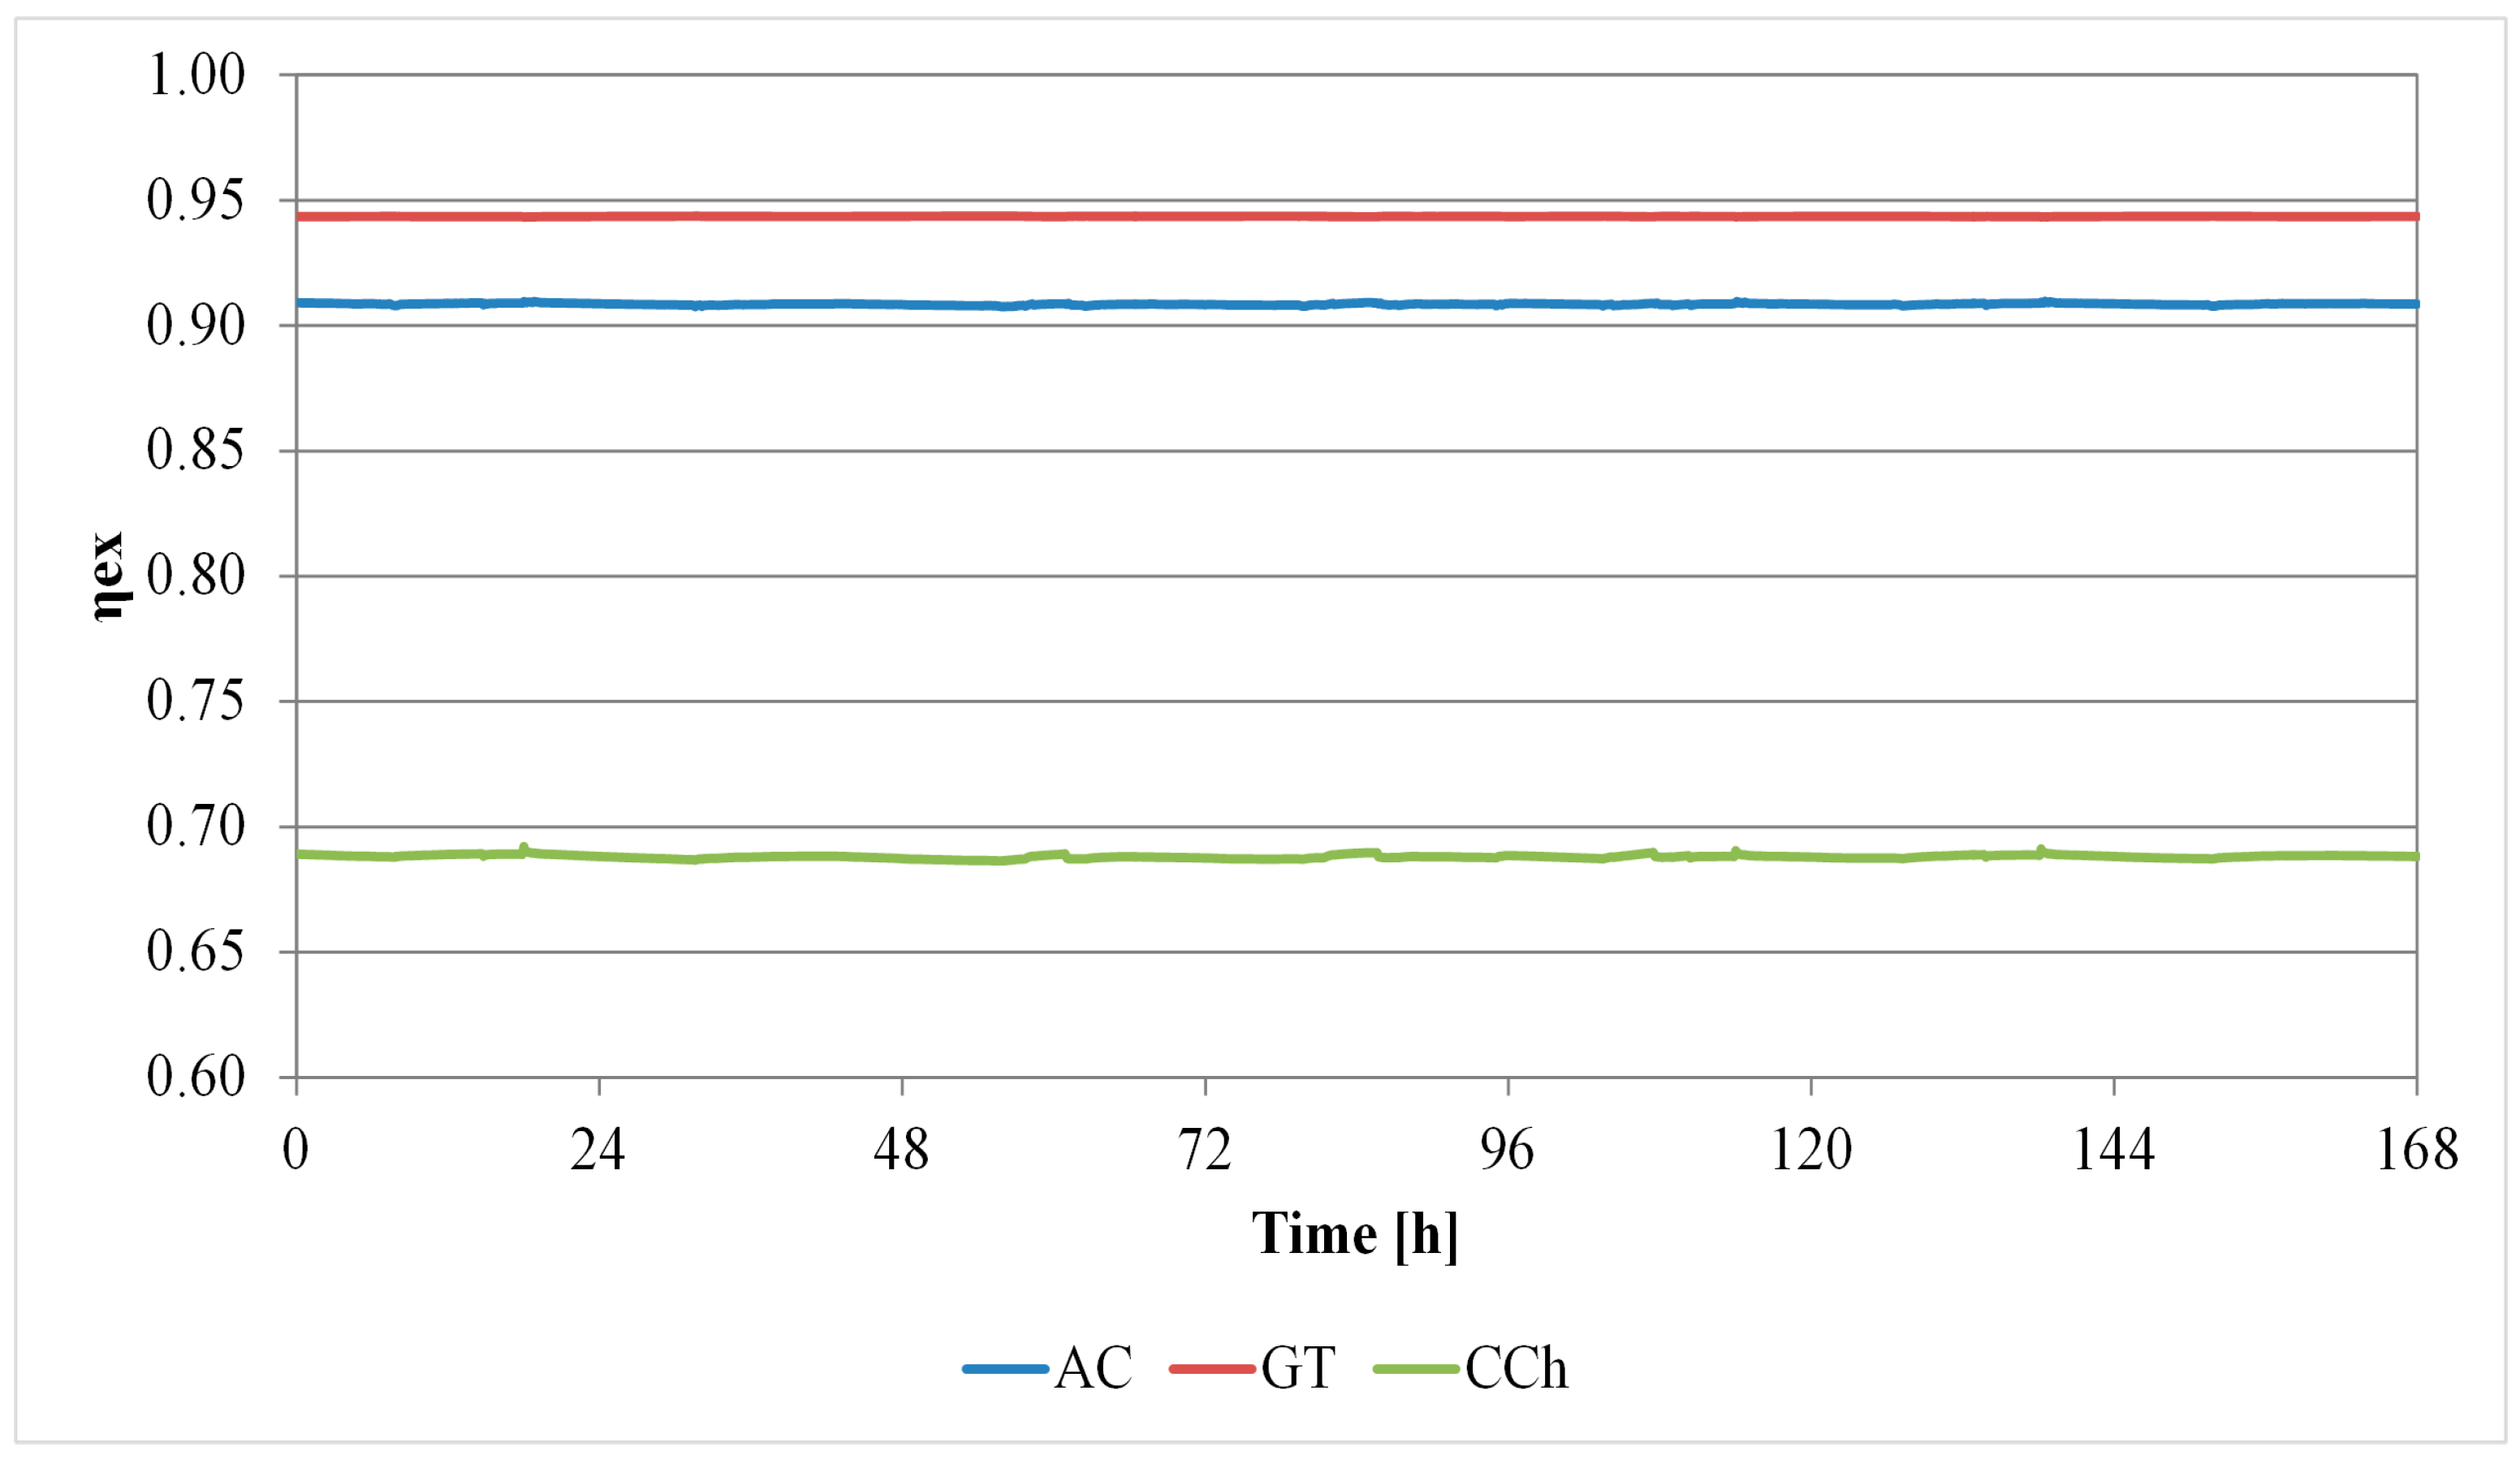
A similar analysis of the Joule subsystem is reported in
Figure 13 and
Figure 14. Here, it is clearly shown that the majority of the exergetic destruction is due to the combustion chamber. This is an unavoidable irreversibility, since all the chemical processes (especially combustion) involve large exergy destruction rates since they are typical irreversible processes. AC and GT exergetic destructions also increase in the SACC systems with respect to the reference CC case. This result is justified by the higher air flow rate due to the higher density caused by the cooling process (
Figure 6).
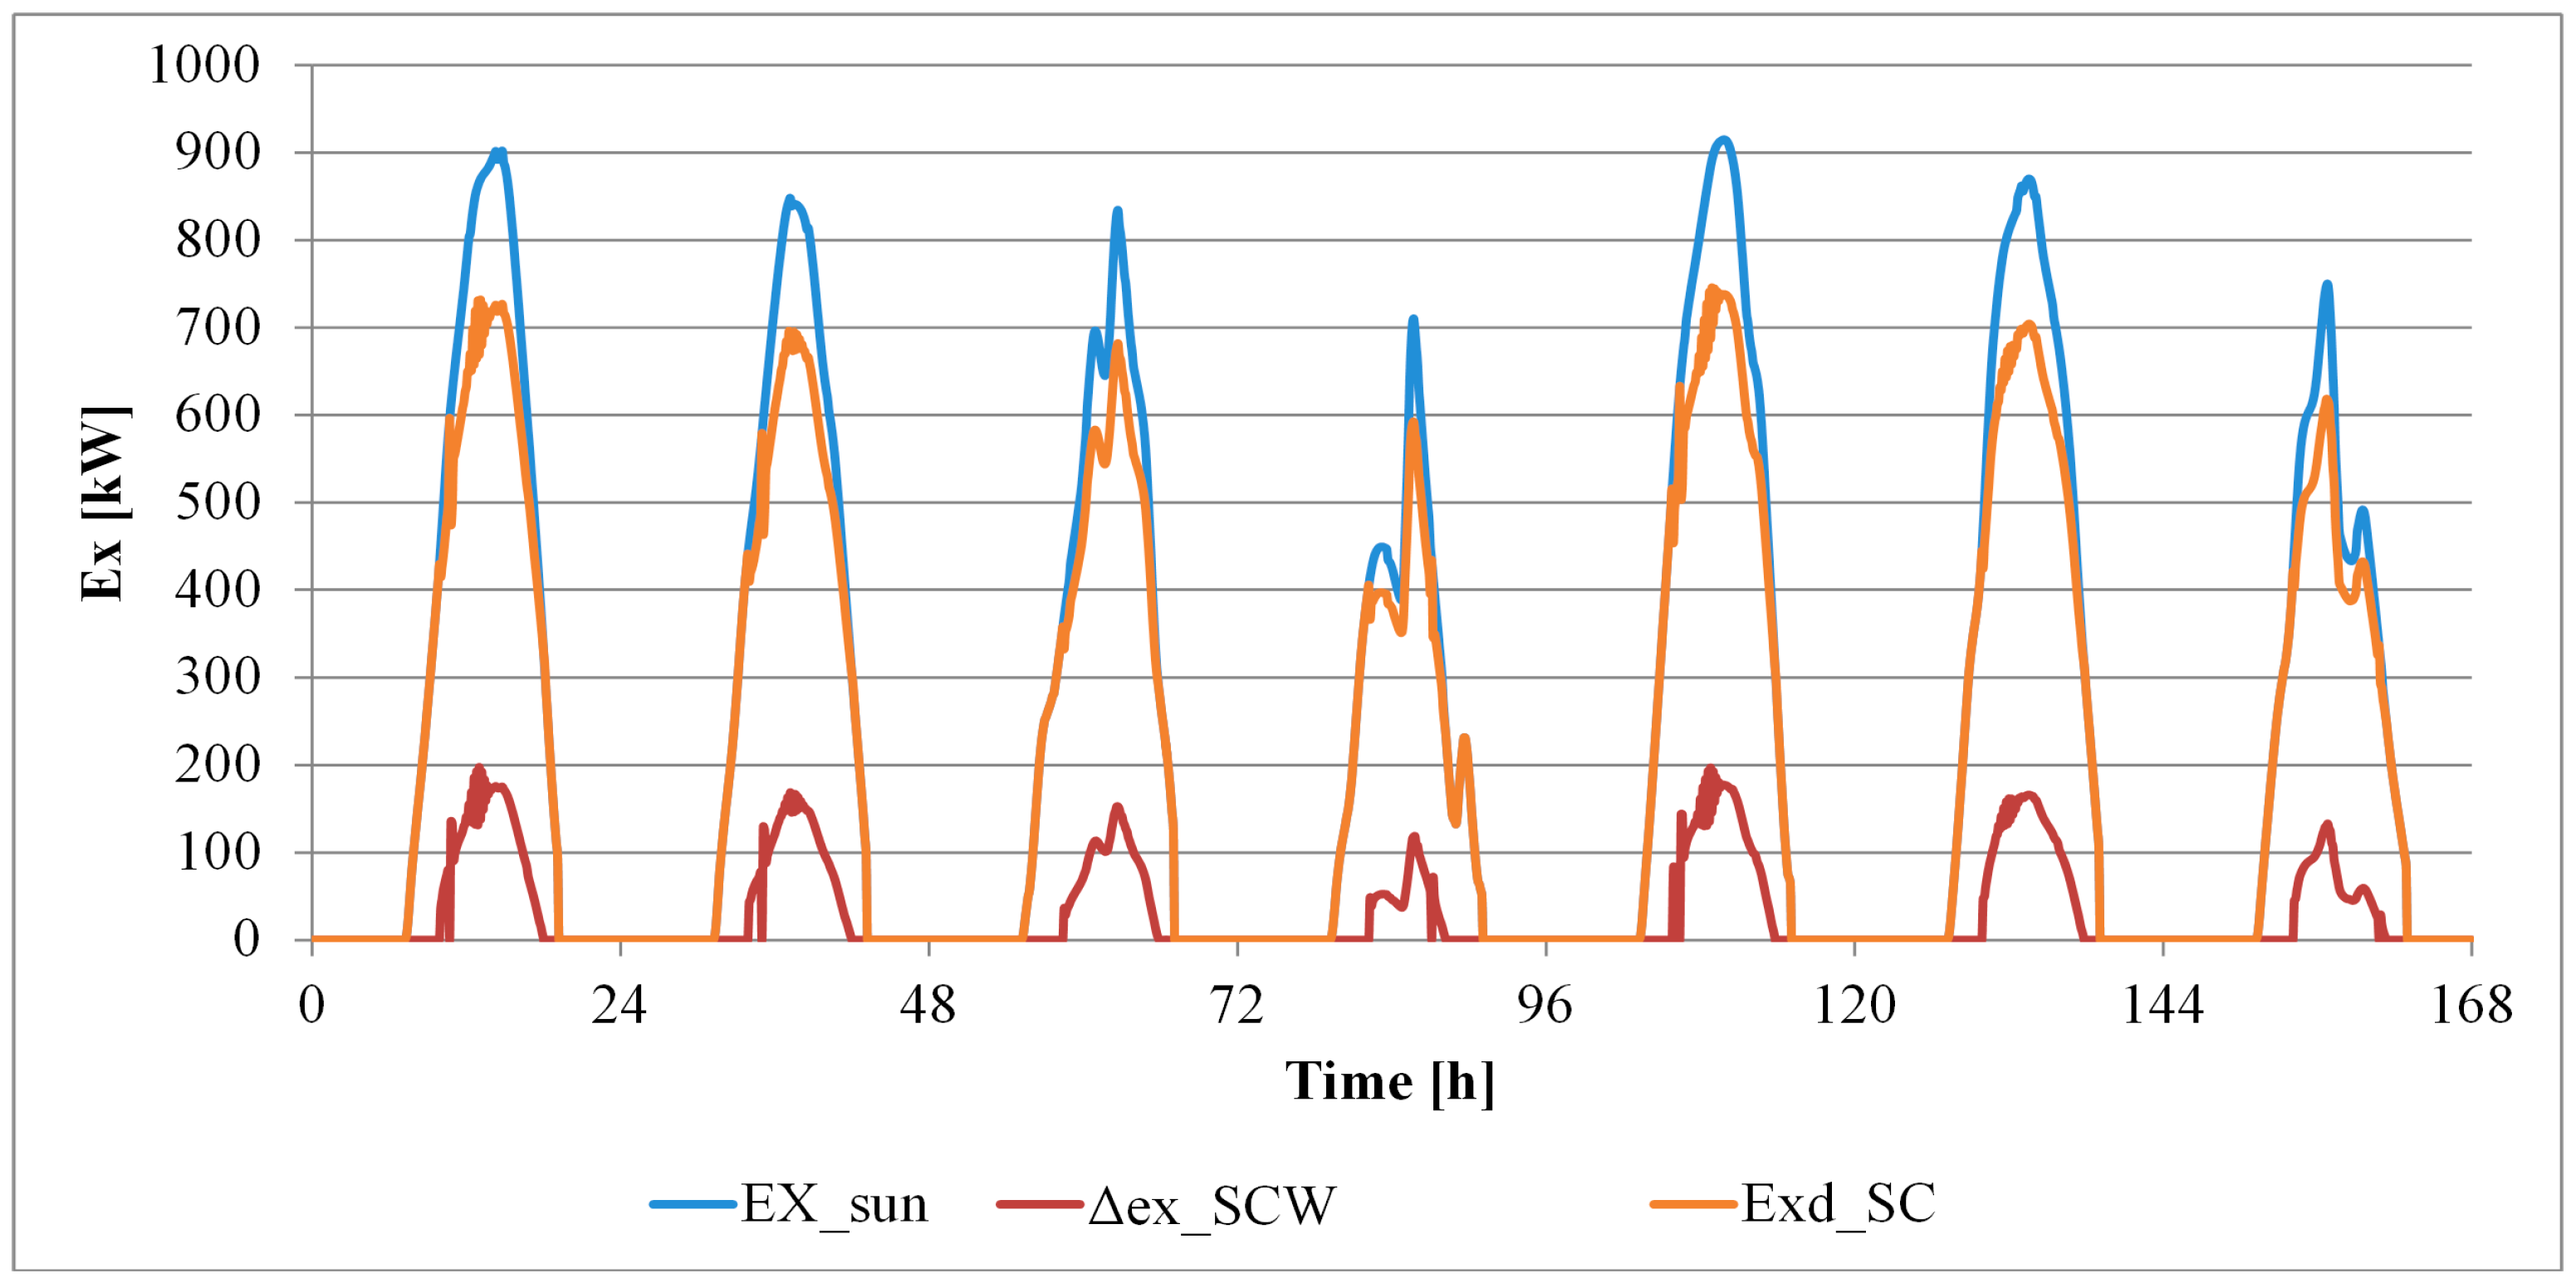
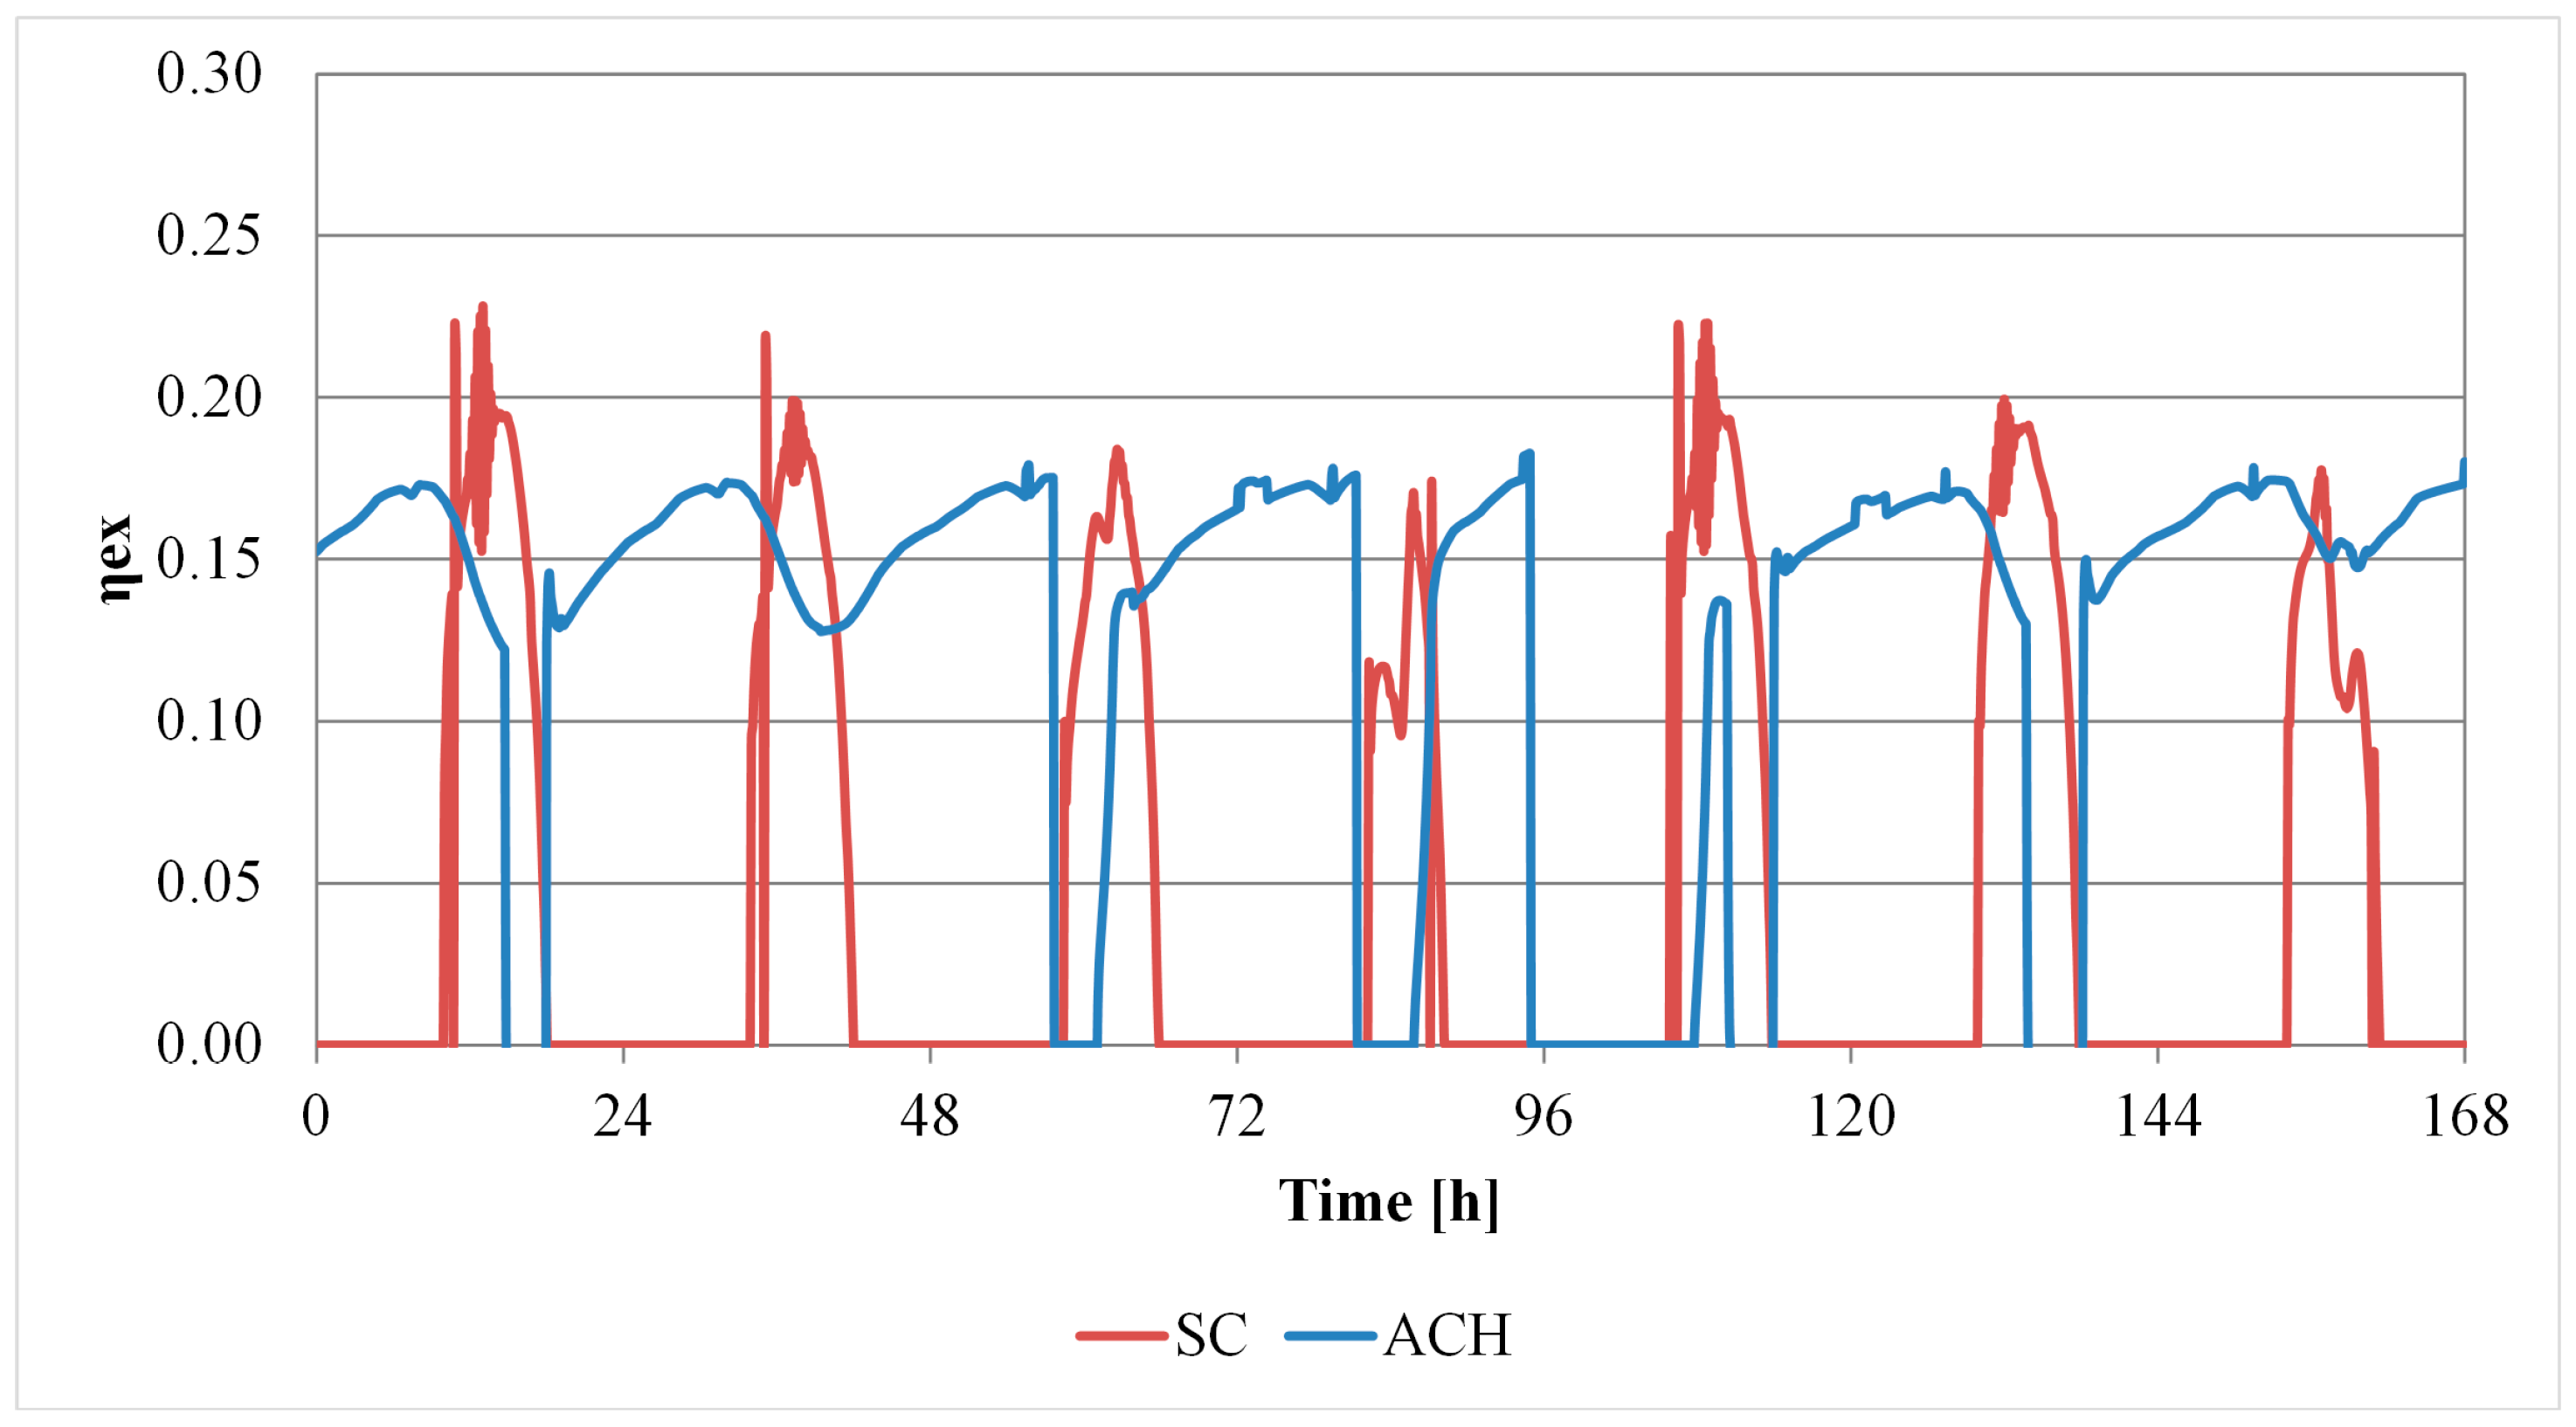
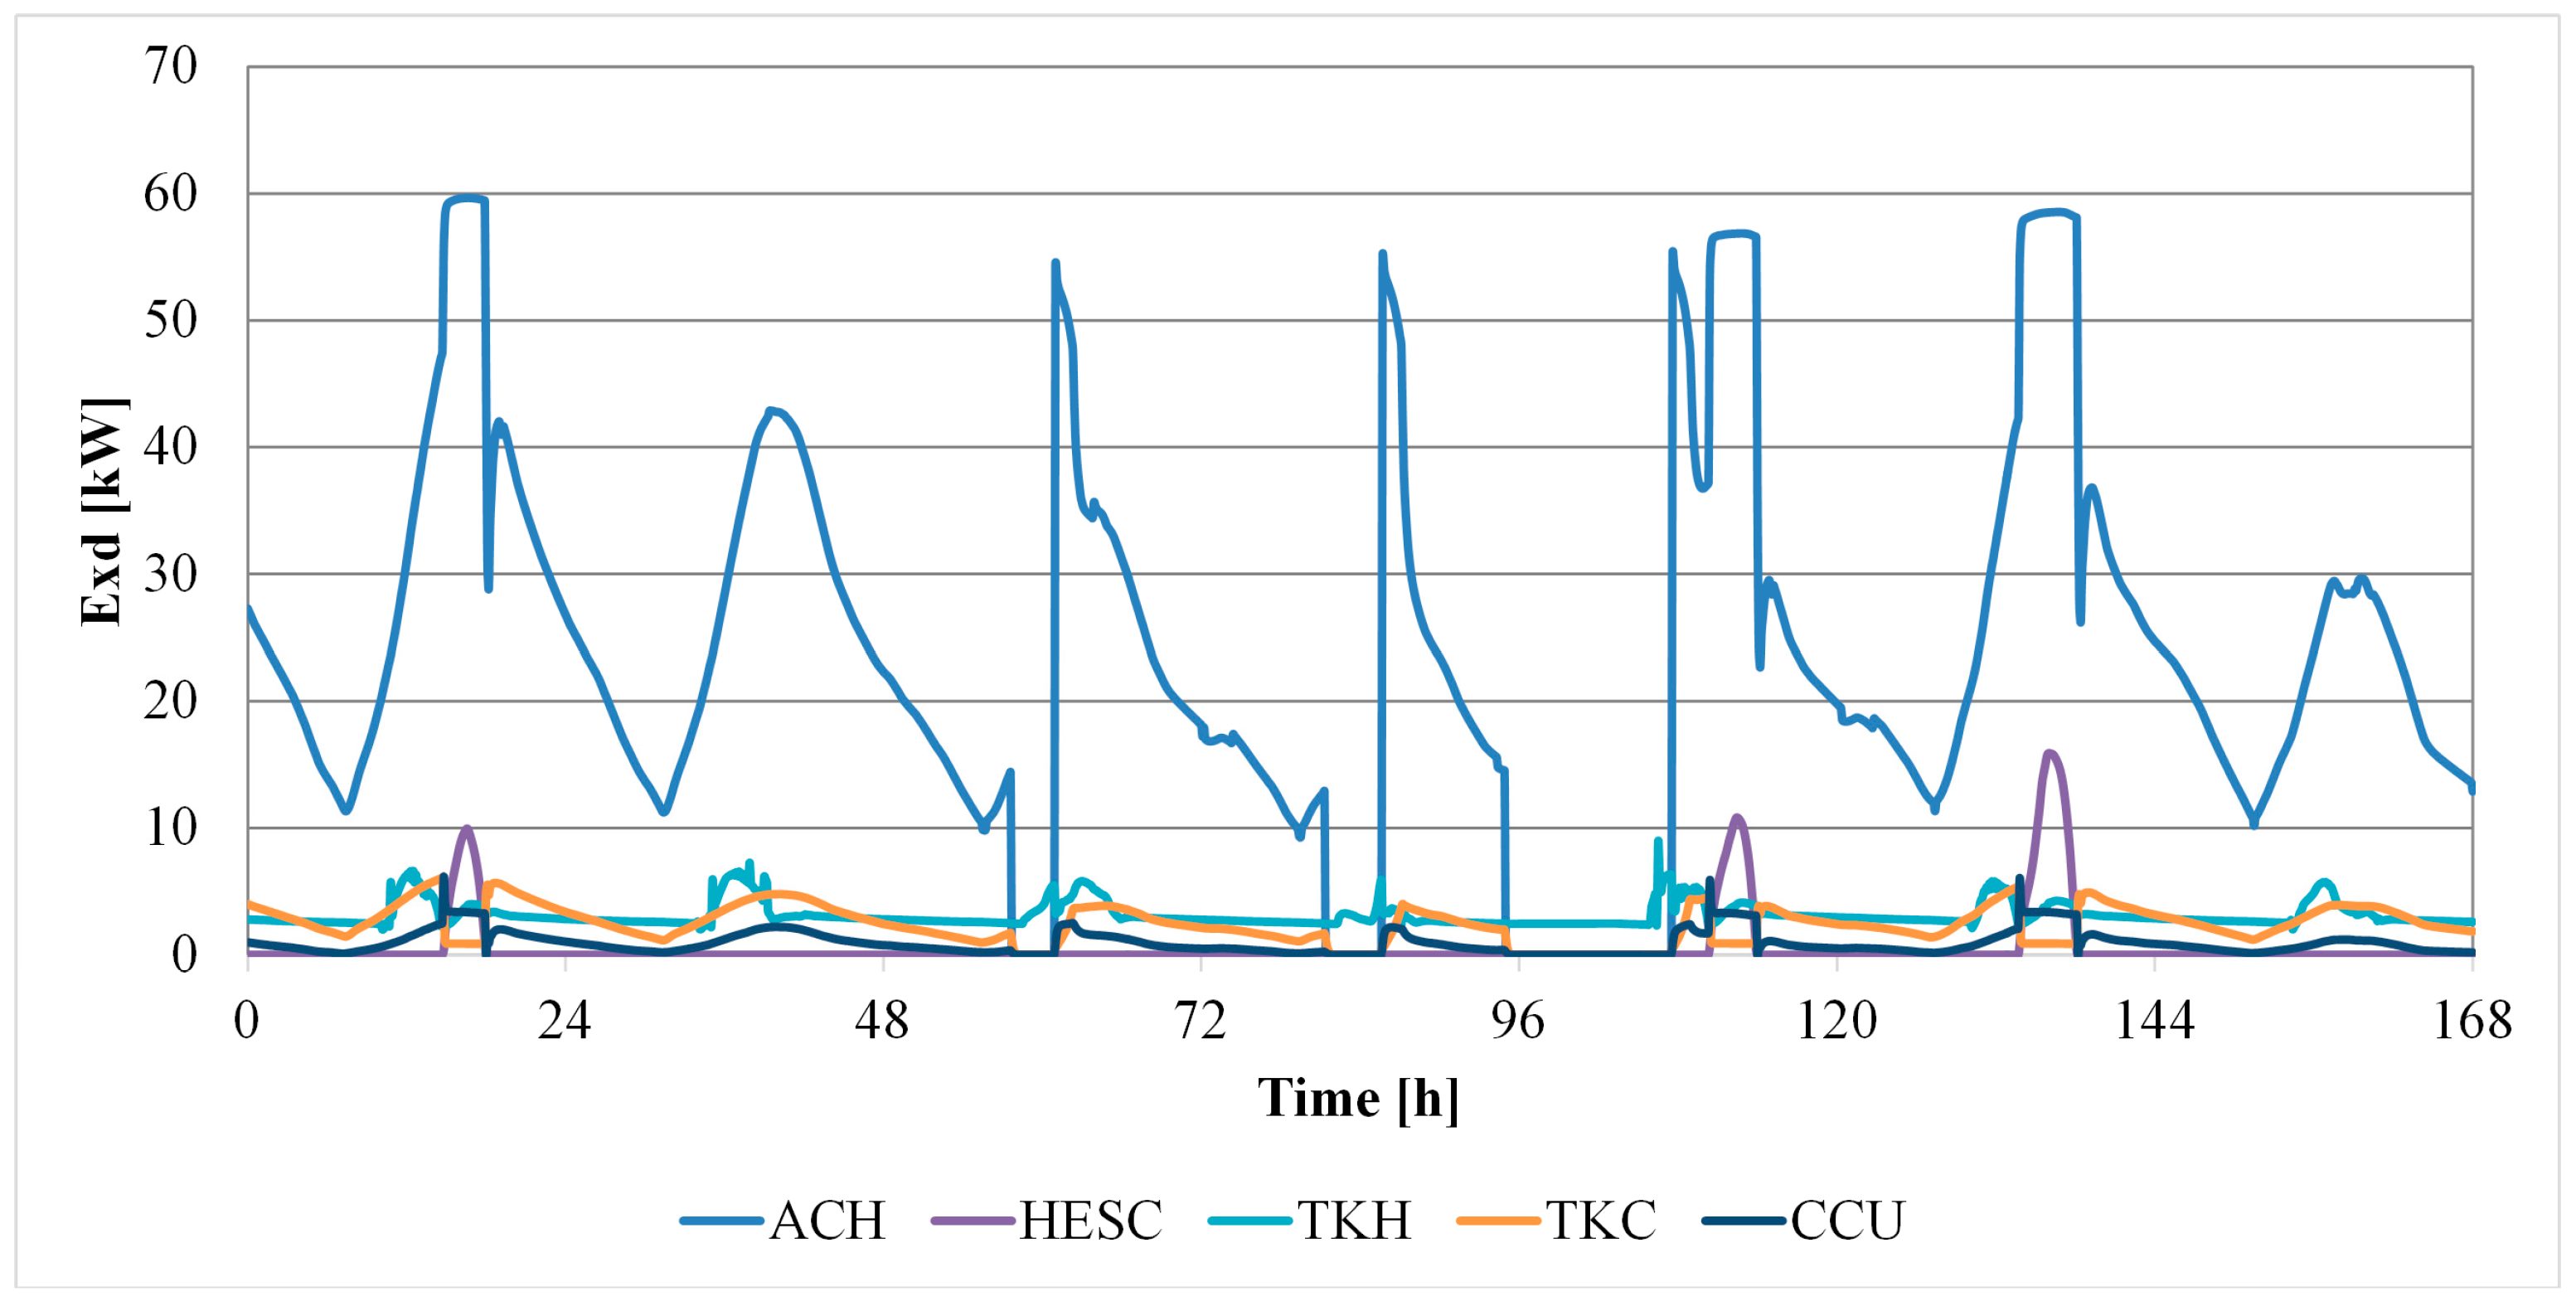
Finally, this analysis is reported for the solar cooling subsystem in
Figure 15,
Figure 16 and
Figure 17. In particular,
Figure 15 shows that the majority of the exergy flow due to the solar radiation is destructed by the solar collector. This result is in accordance with the theory by Petela, assuming the exergetic sun temperature at 3/4 black body temperature of the sun. Therefore, huge temperature differences between the sun and the collectors are achieved causing large exergy destruction rates and low exergetic efficiencies. The exergy balance of this subsystem is dominated by the solar collector. A marginal amount of exergy destruction is also detected by the absorption chiller, showing an exergetic efficiency varying from 12% to 18%. Such results are also in accordance with the data available in literature.
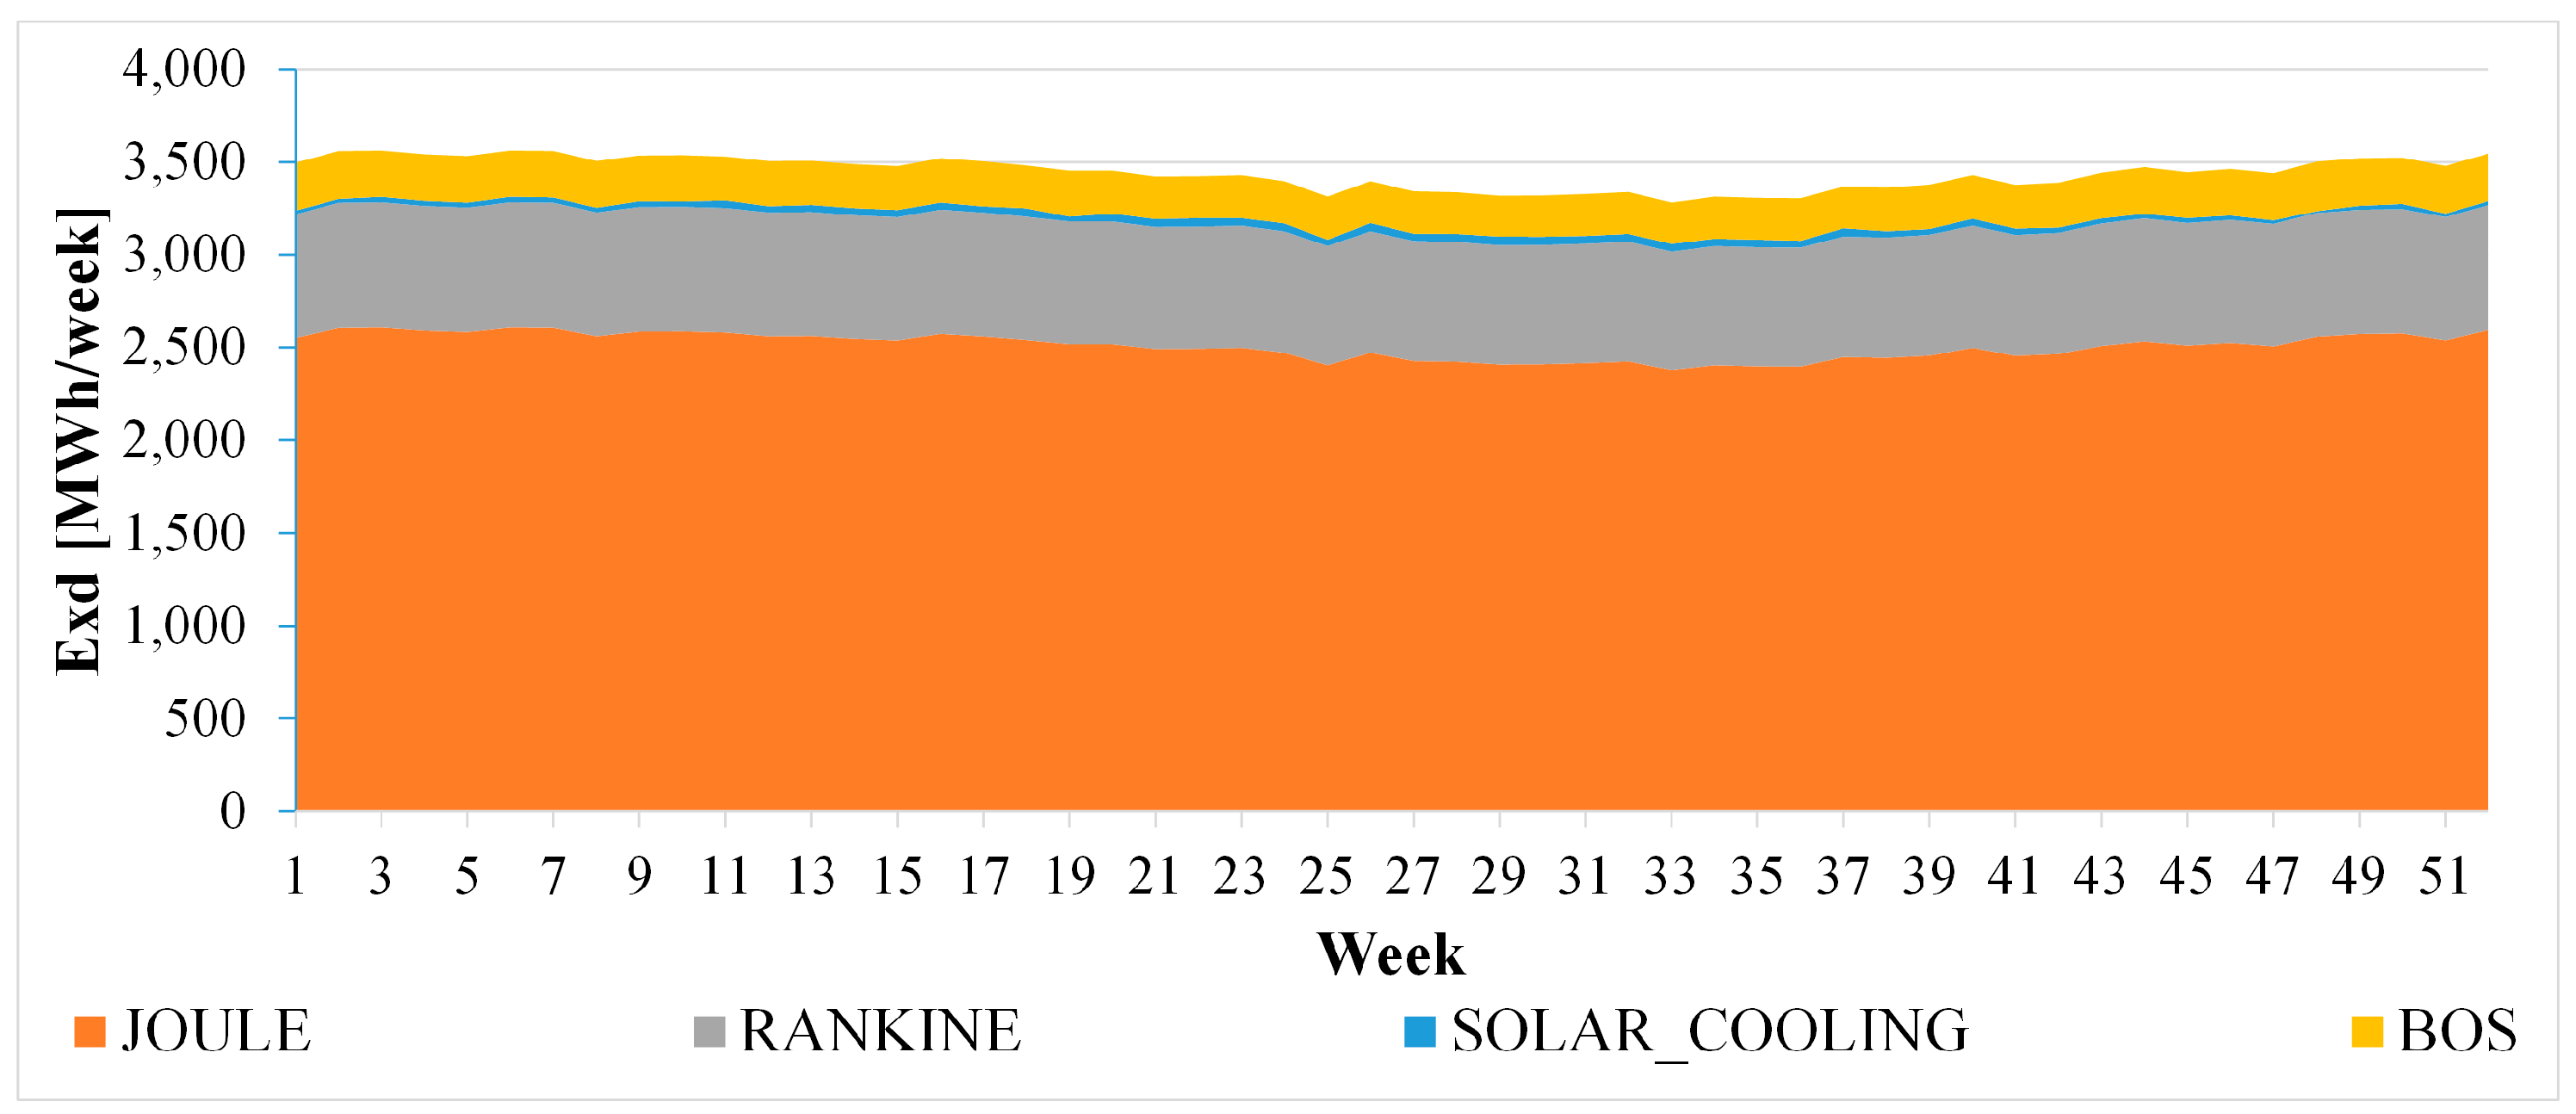
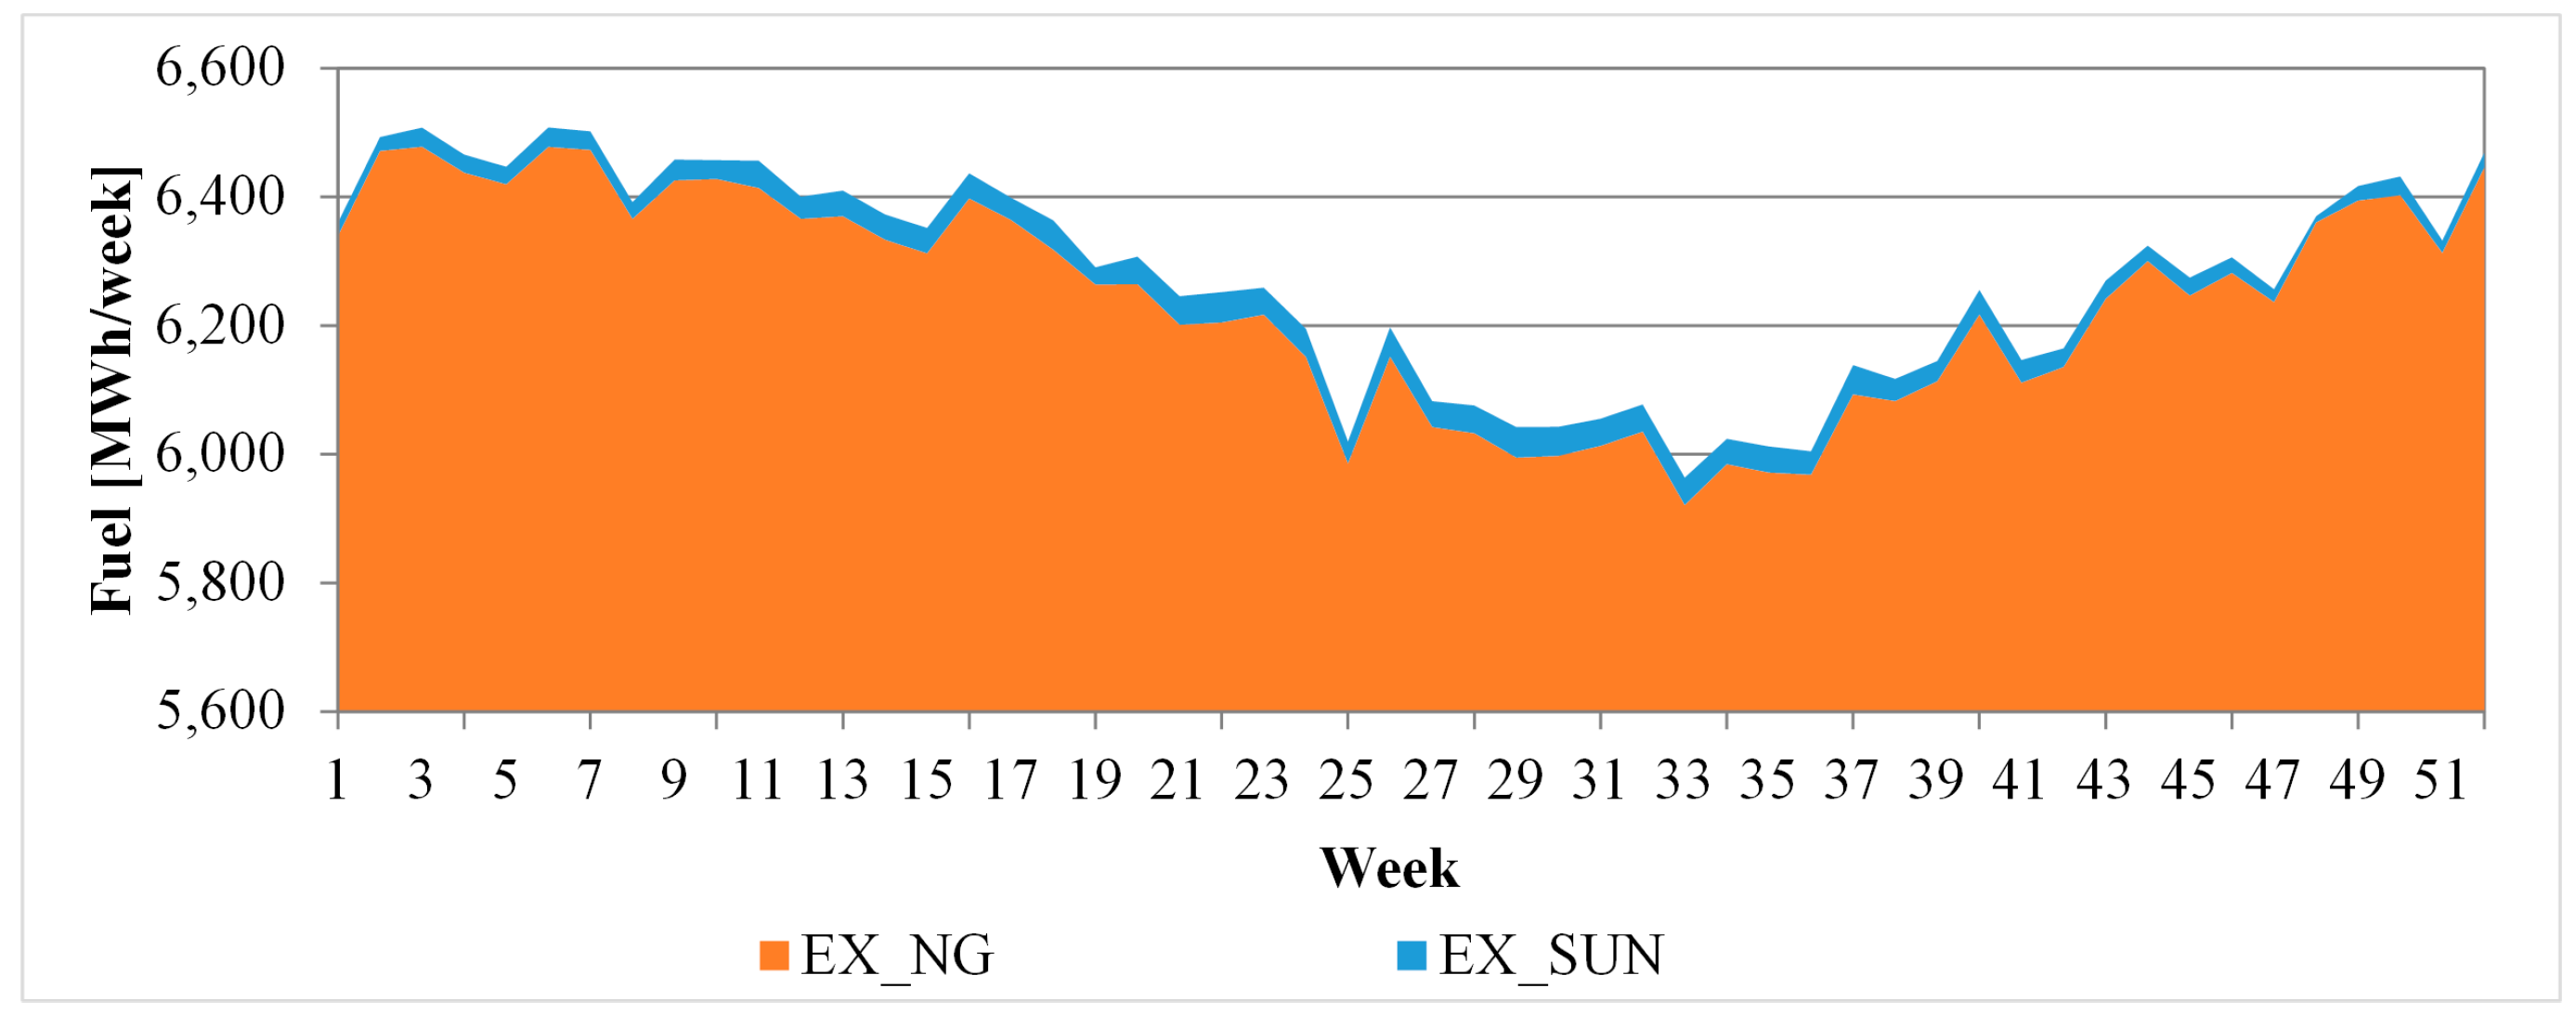
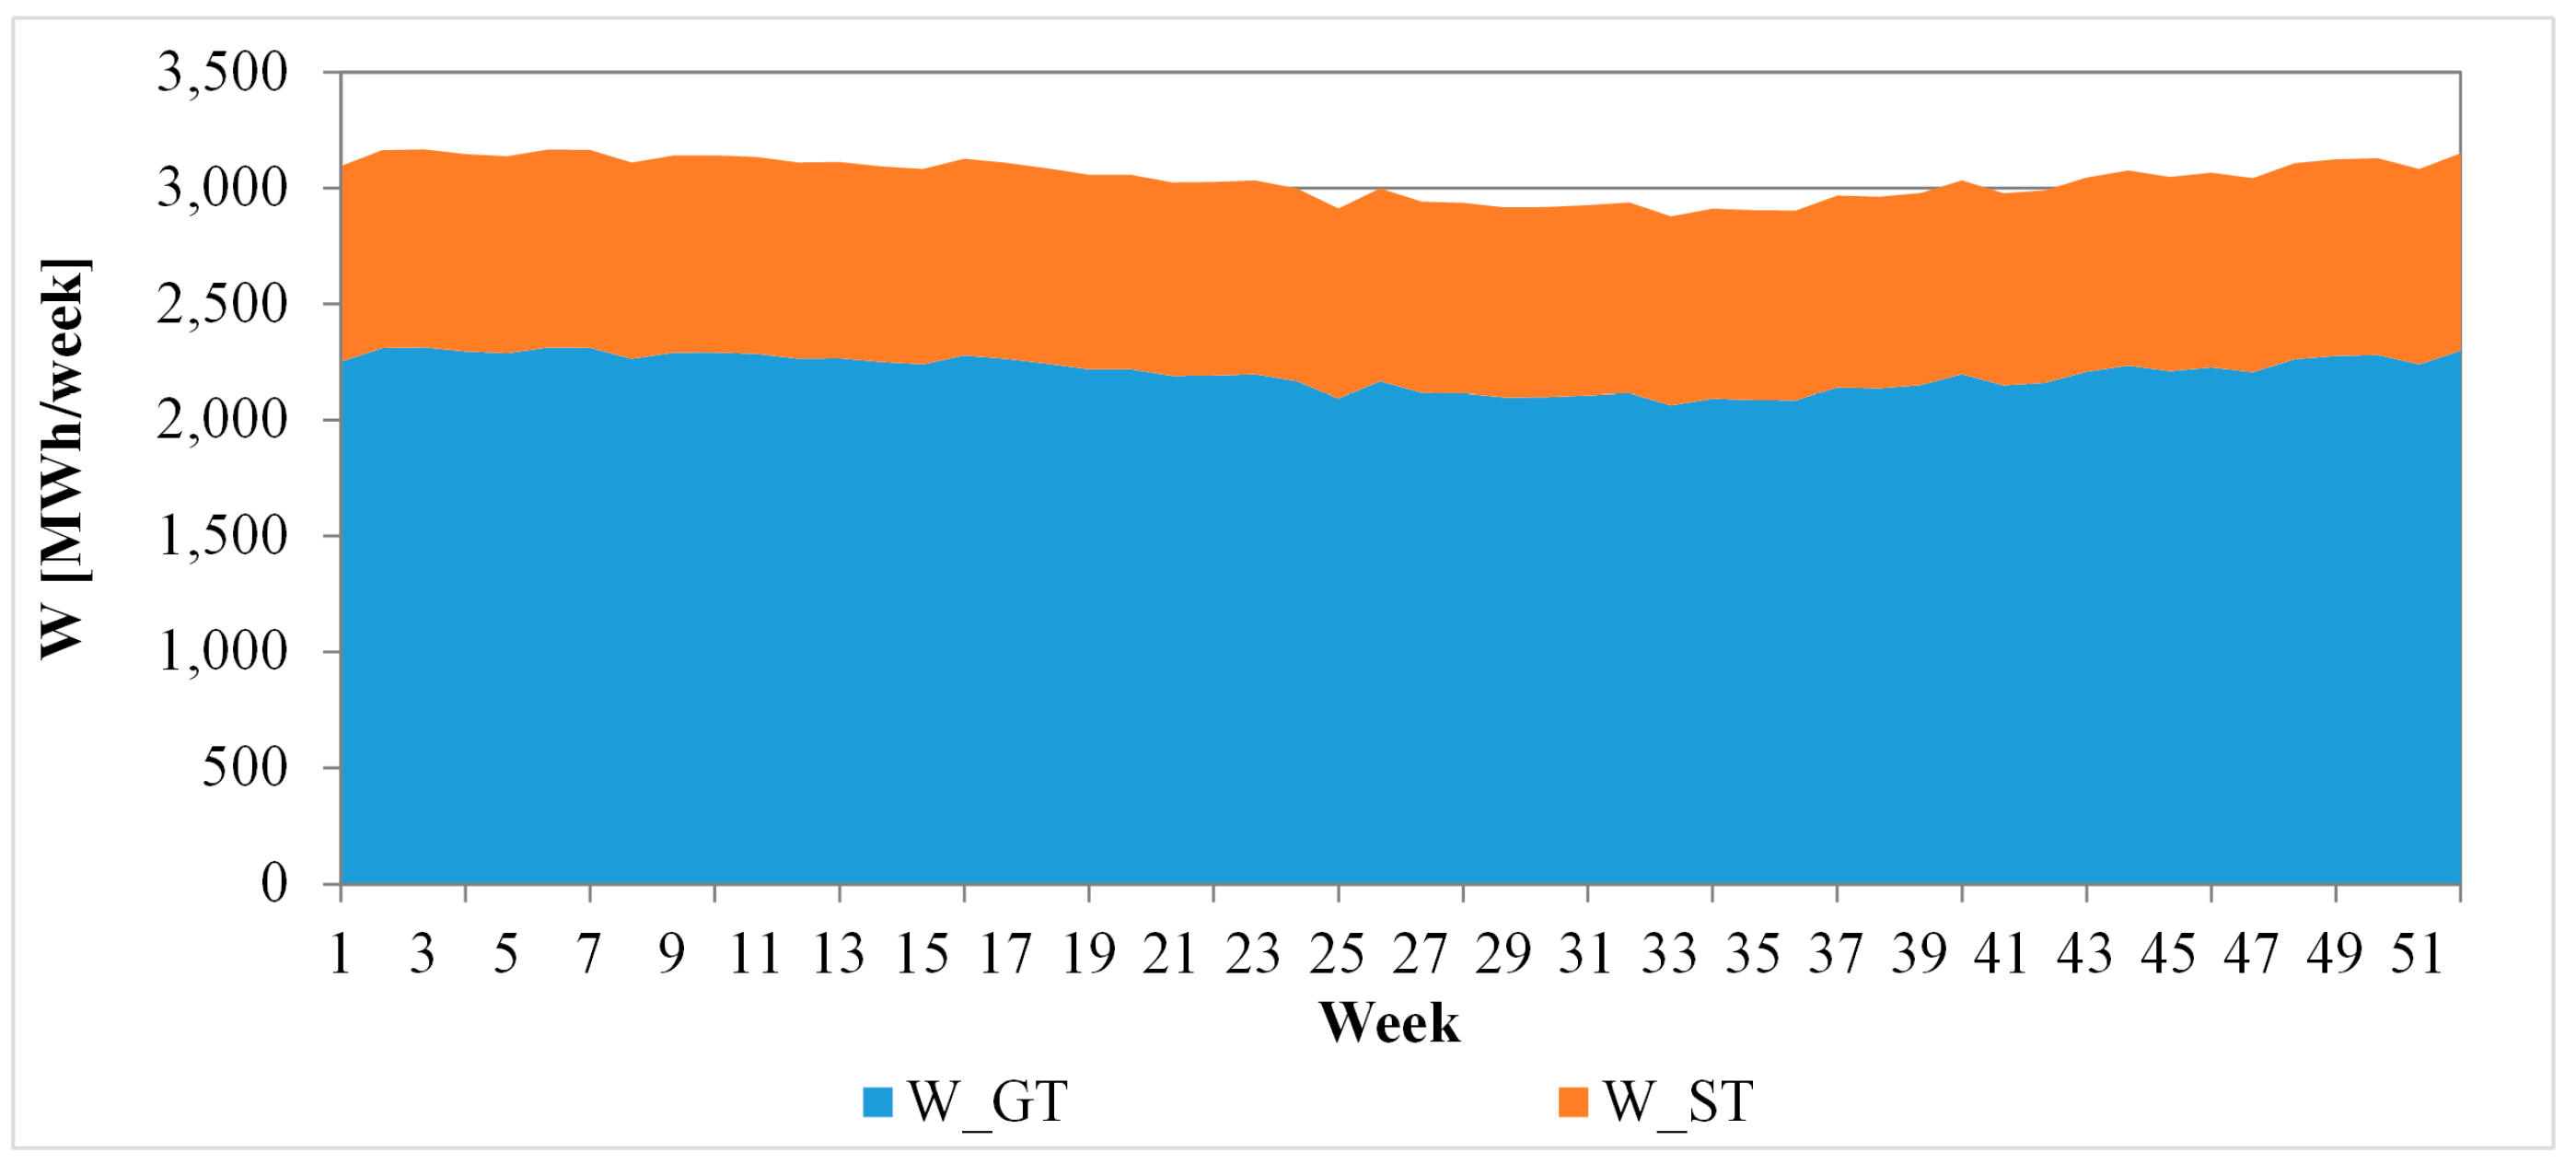
4.2. Weekly Analysis
This section presents the exergetic results aggregated on a weekly basis. Such analysis allows one to mitigate the typical fluctuations of the system dynamic operation for a better investigation of the variation of the exergetic parameters during the year. In particular,
Figure 18,
Figure 19 and
Figure 20 show weekly exergy destructions, fuel and products for the system under investigation.
Here, it is clearly shown that the overall exergy destruction rate is dominated by the Joule subsystem. A significant contribution is also given by the Rankine subsystem, whereas the exergy destruction in the solar cooling subsystem is negligible with respect to the previous one. This trend is consistent with the phenomena occurring within the system. In fact, Joule subsystem also shows the highest exergetic fuel and product. As a consequence, its exergetic destruction rate is not representative of lower efficiency since it is due to a higher energy conversion rate. In addition, it is also worth noting that the Joule subsystem includes the combustion chamber, which operates using irreversible chemical reaction, which is the major source of the overall exergy destruction rate. It is also worth noting that the overall exergy destruction decreases during the summer season, especially for the Joule subsystem. This is due to the lower exergetic fuel and products shown in summer. This reduction of the exergetic destruction, fuel and product, is mainly due to the average increase of the temperature of the air entering the air compressor, which in turn determines a general decrease of system capacity.
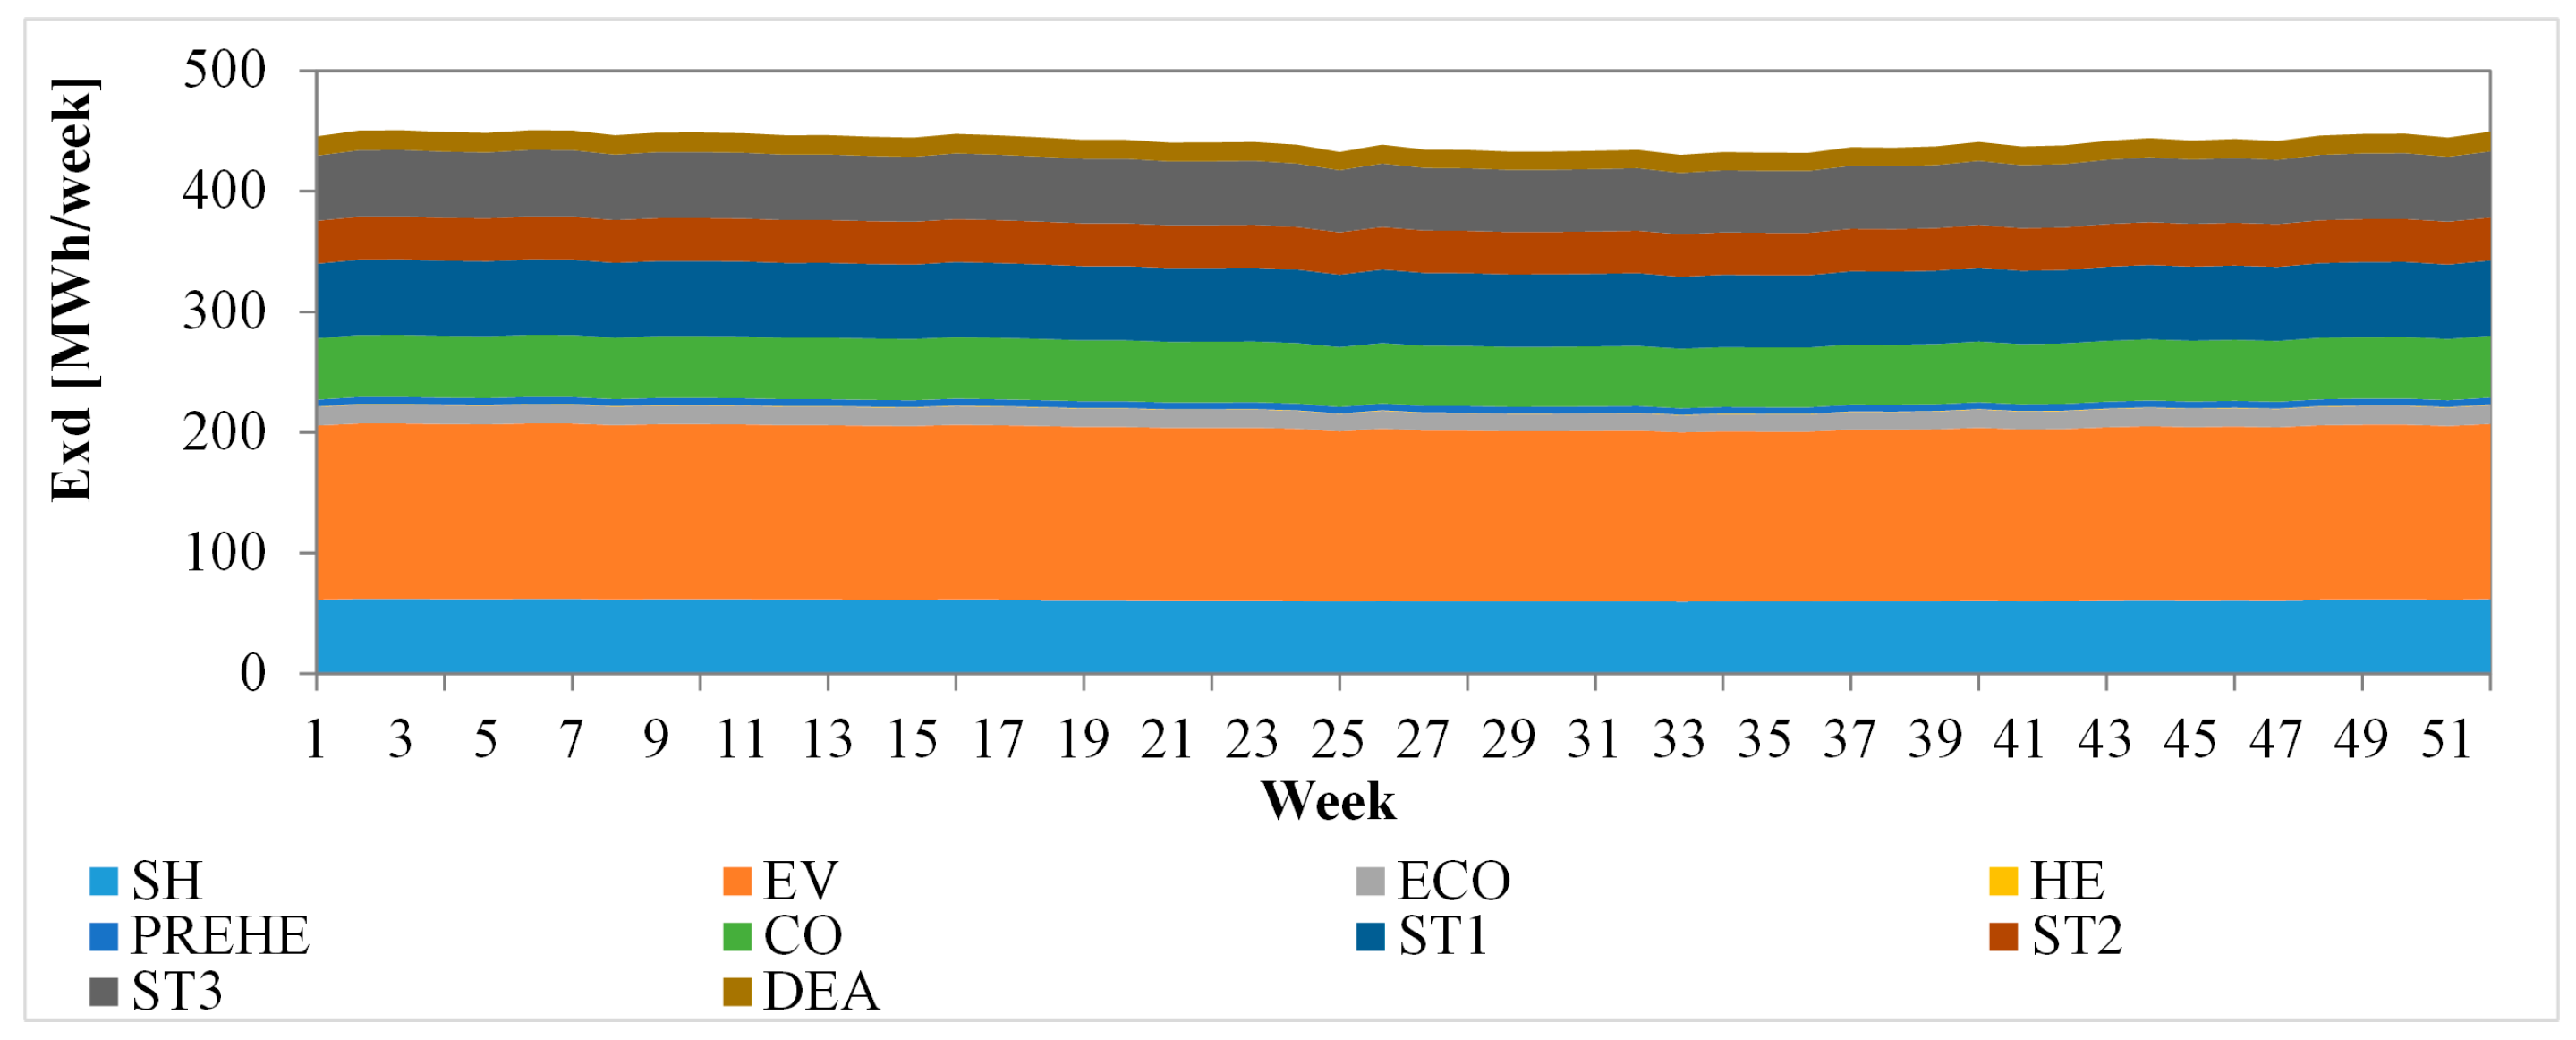
Figure 21 shows weekly exergy destruction rates of the Rankine subsystem and its components.
The overall exergy destruction of this subsystem is very stable during the year showing a minor decrease during the summer season caused by the slight decrease of GT flue gas mass flow rate, determined by the decrease of its density. The evaporator is the major source of the Rankine exergy destruction all year long. This is an expected result since the system includes a single pressure CC system, showing significant temperature differences between GT flue gases and water, occurring within the evaporator of the Rankine cycle. EV exergy destruction may be reduced using a more complex multiple-pressure Rankine cycle. Significant contributions to the overall exergy destruction rates are also given by CO, ST, SH and ECO. A possible reduction of these irreversibilities can be achieved increasing turbine isentropic efficiency and SH exchange area, also determining an increase of the overall capital costs. As mentioned before, CO dissipates exergy releasing heat to the environment.
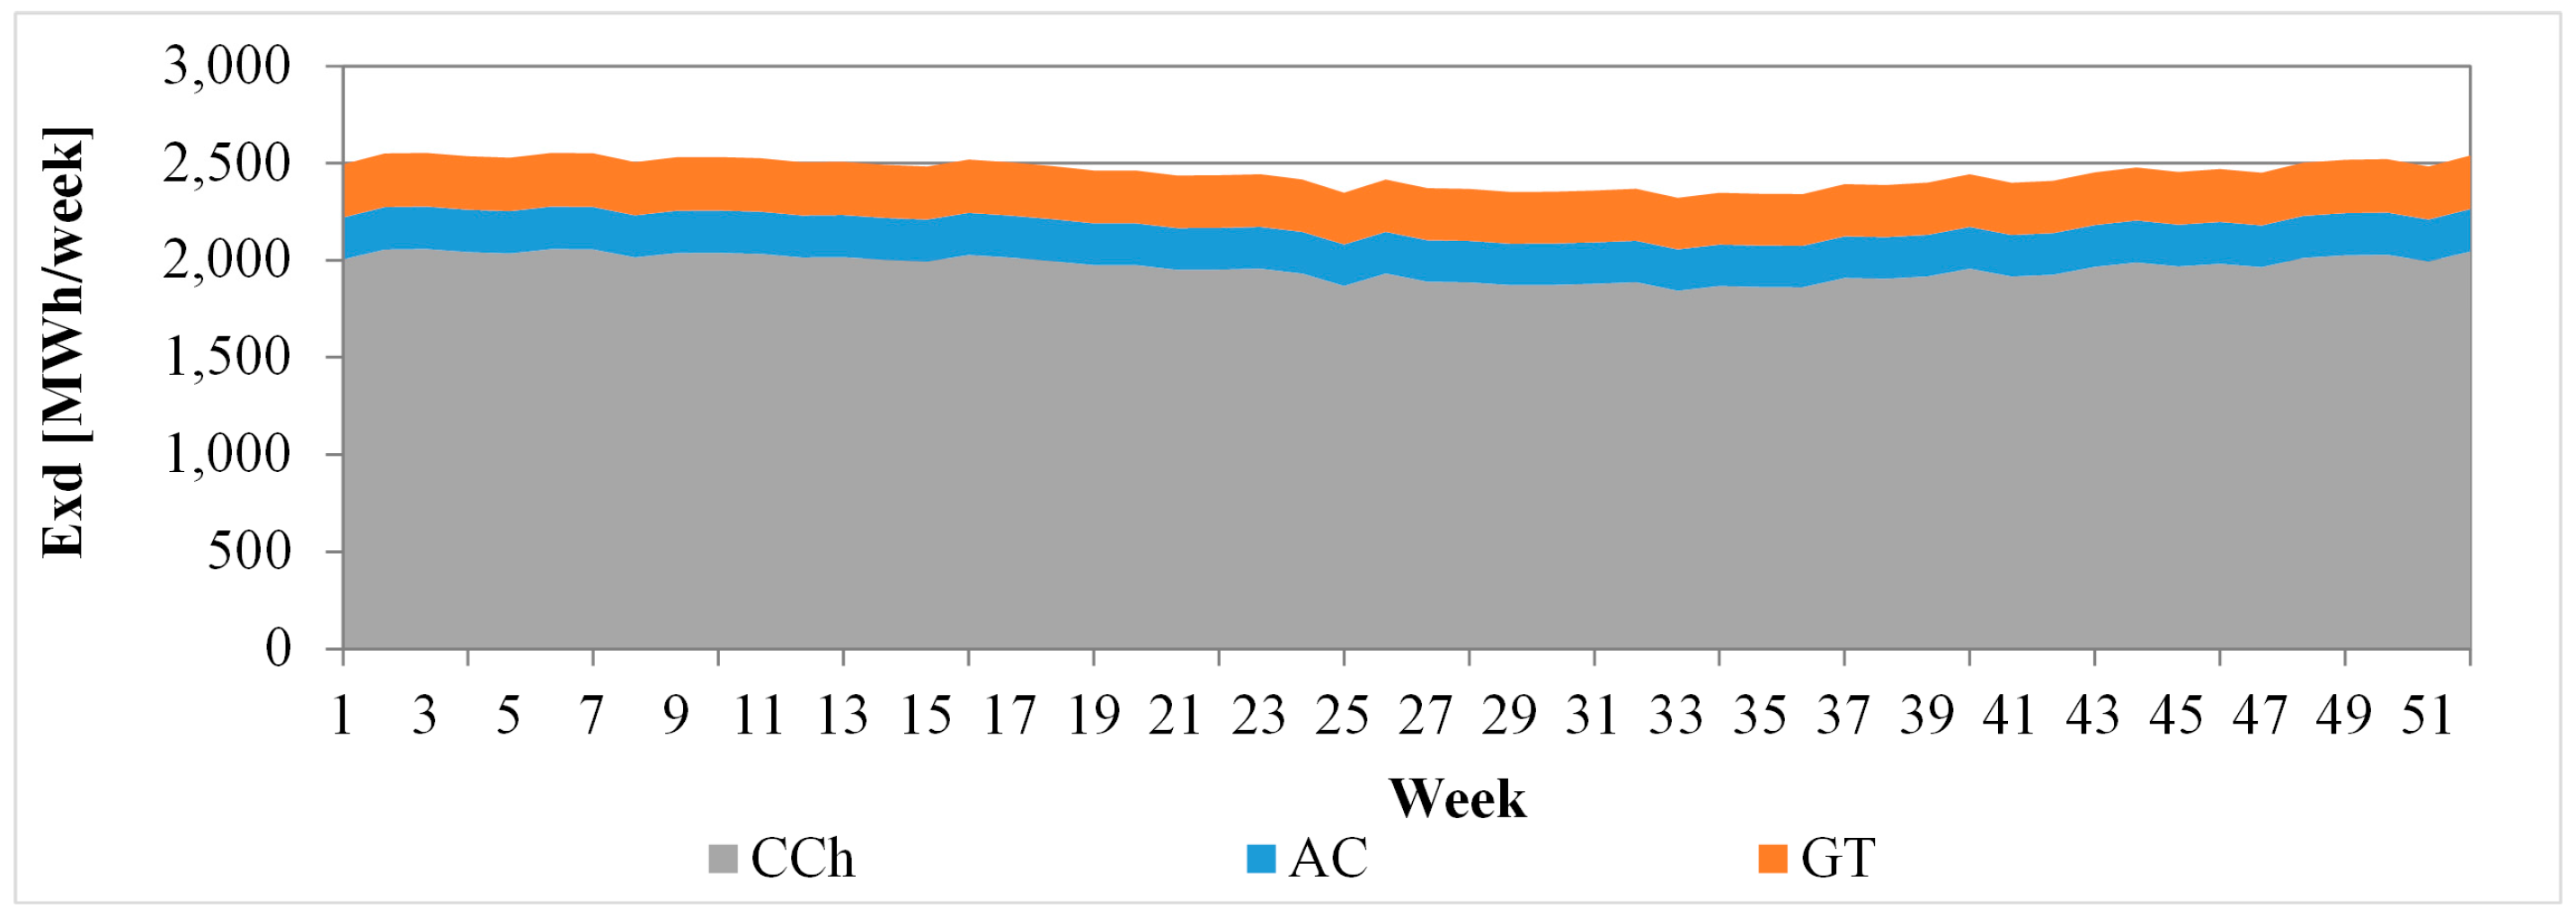
Figure 22 shows exergy destruction of the Joule subsystem and its components. This graph clearly shows that the combustion chamber is the main source of the irreversibilities for the Joule subsystem and for the system as whole. In fact, this component is used in order to convert chemical exergy of natural gas into heat supplied to the air entering the gas turbine. This is a highly irreversible process. Once again, such irreversibility cannot be reduced. It is also worth noting that the overall exergy destruction of the Joule subsystem decreases in summer as a consequence of the variation of air compressor inlet temperature. Obviously, a much more significant variation would be achieved by a conventional CC not equipped with the solar cooling subsystem.
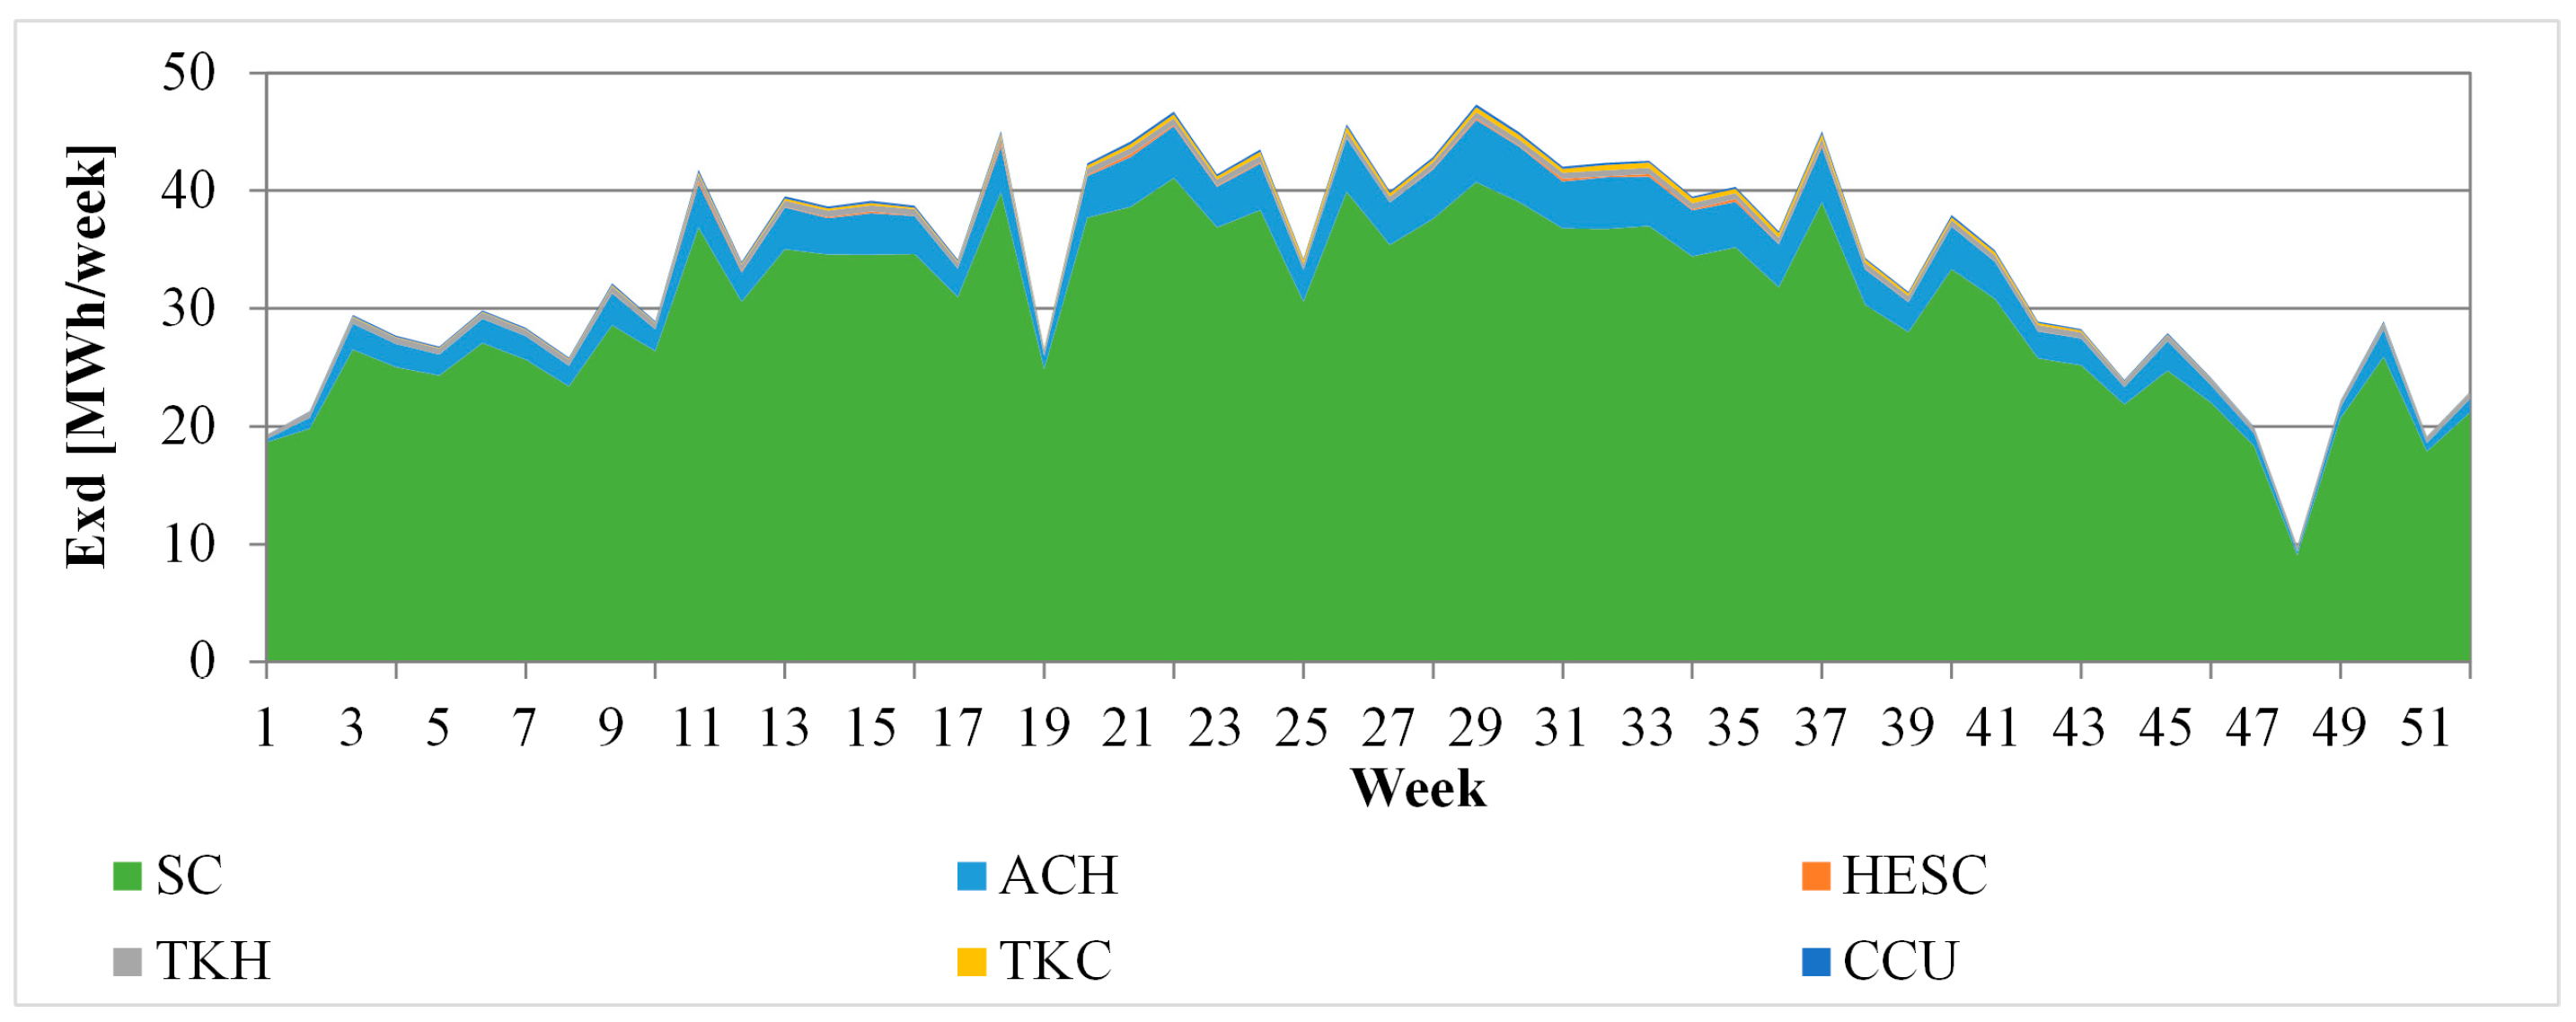
Conversely, in summer, exergy product of the solar cooling subsystem increases and, consequently, its exergy destruction increases as well (
Figure 23). In this subsystem, the solar field (SC) is the main source of irreversibilities, showing the highest exergy destruction rate all year long.
This result is consistent with the theories found available in literature regarding exergy analysis of solar system. In fact, heat transfer within the solar collector suffers from the huge temperature differences between the Sun and the collector itself. Therefore, the exergy analysis suggests that solar thermal collectors are affected by large unavoidable irreversibilities. On the other hand, it must be considered that such technology uses a renewable and free source energy and therefore such irreversibilities can be also considered acceptable. The exergy destruction in the absorption chiller is also noticeable with respect to the exergy destructions of other components (tanks, cooling coil, etc.) which are negligible in the overall subsystem exergy balance.
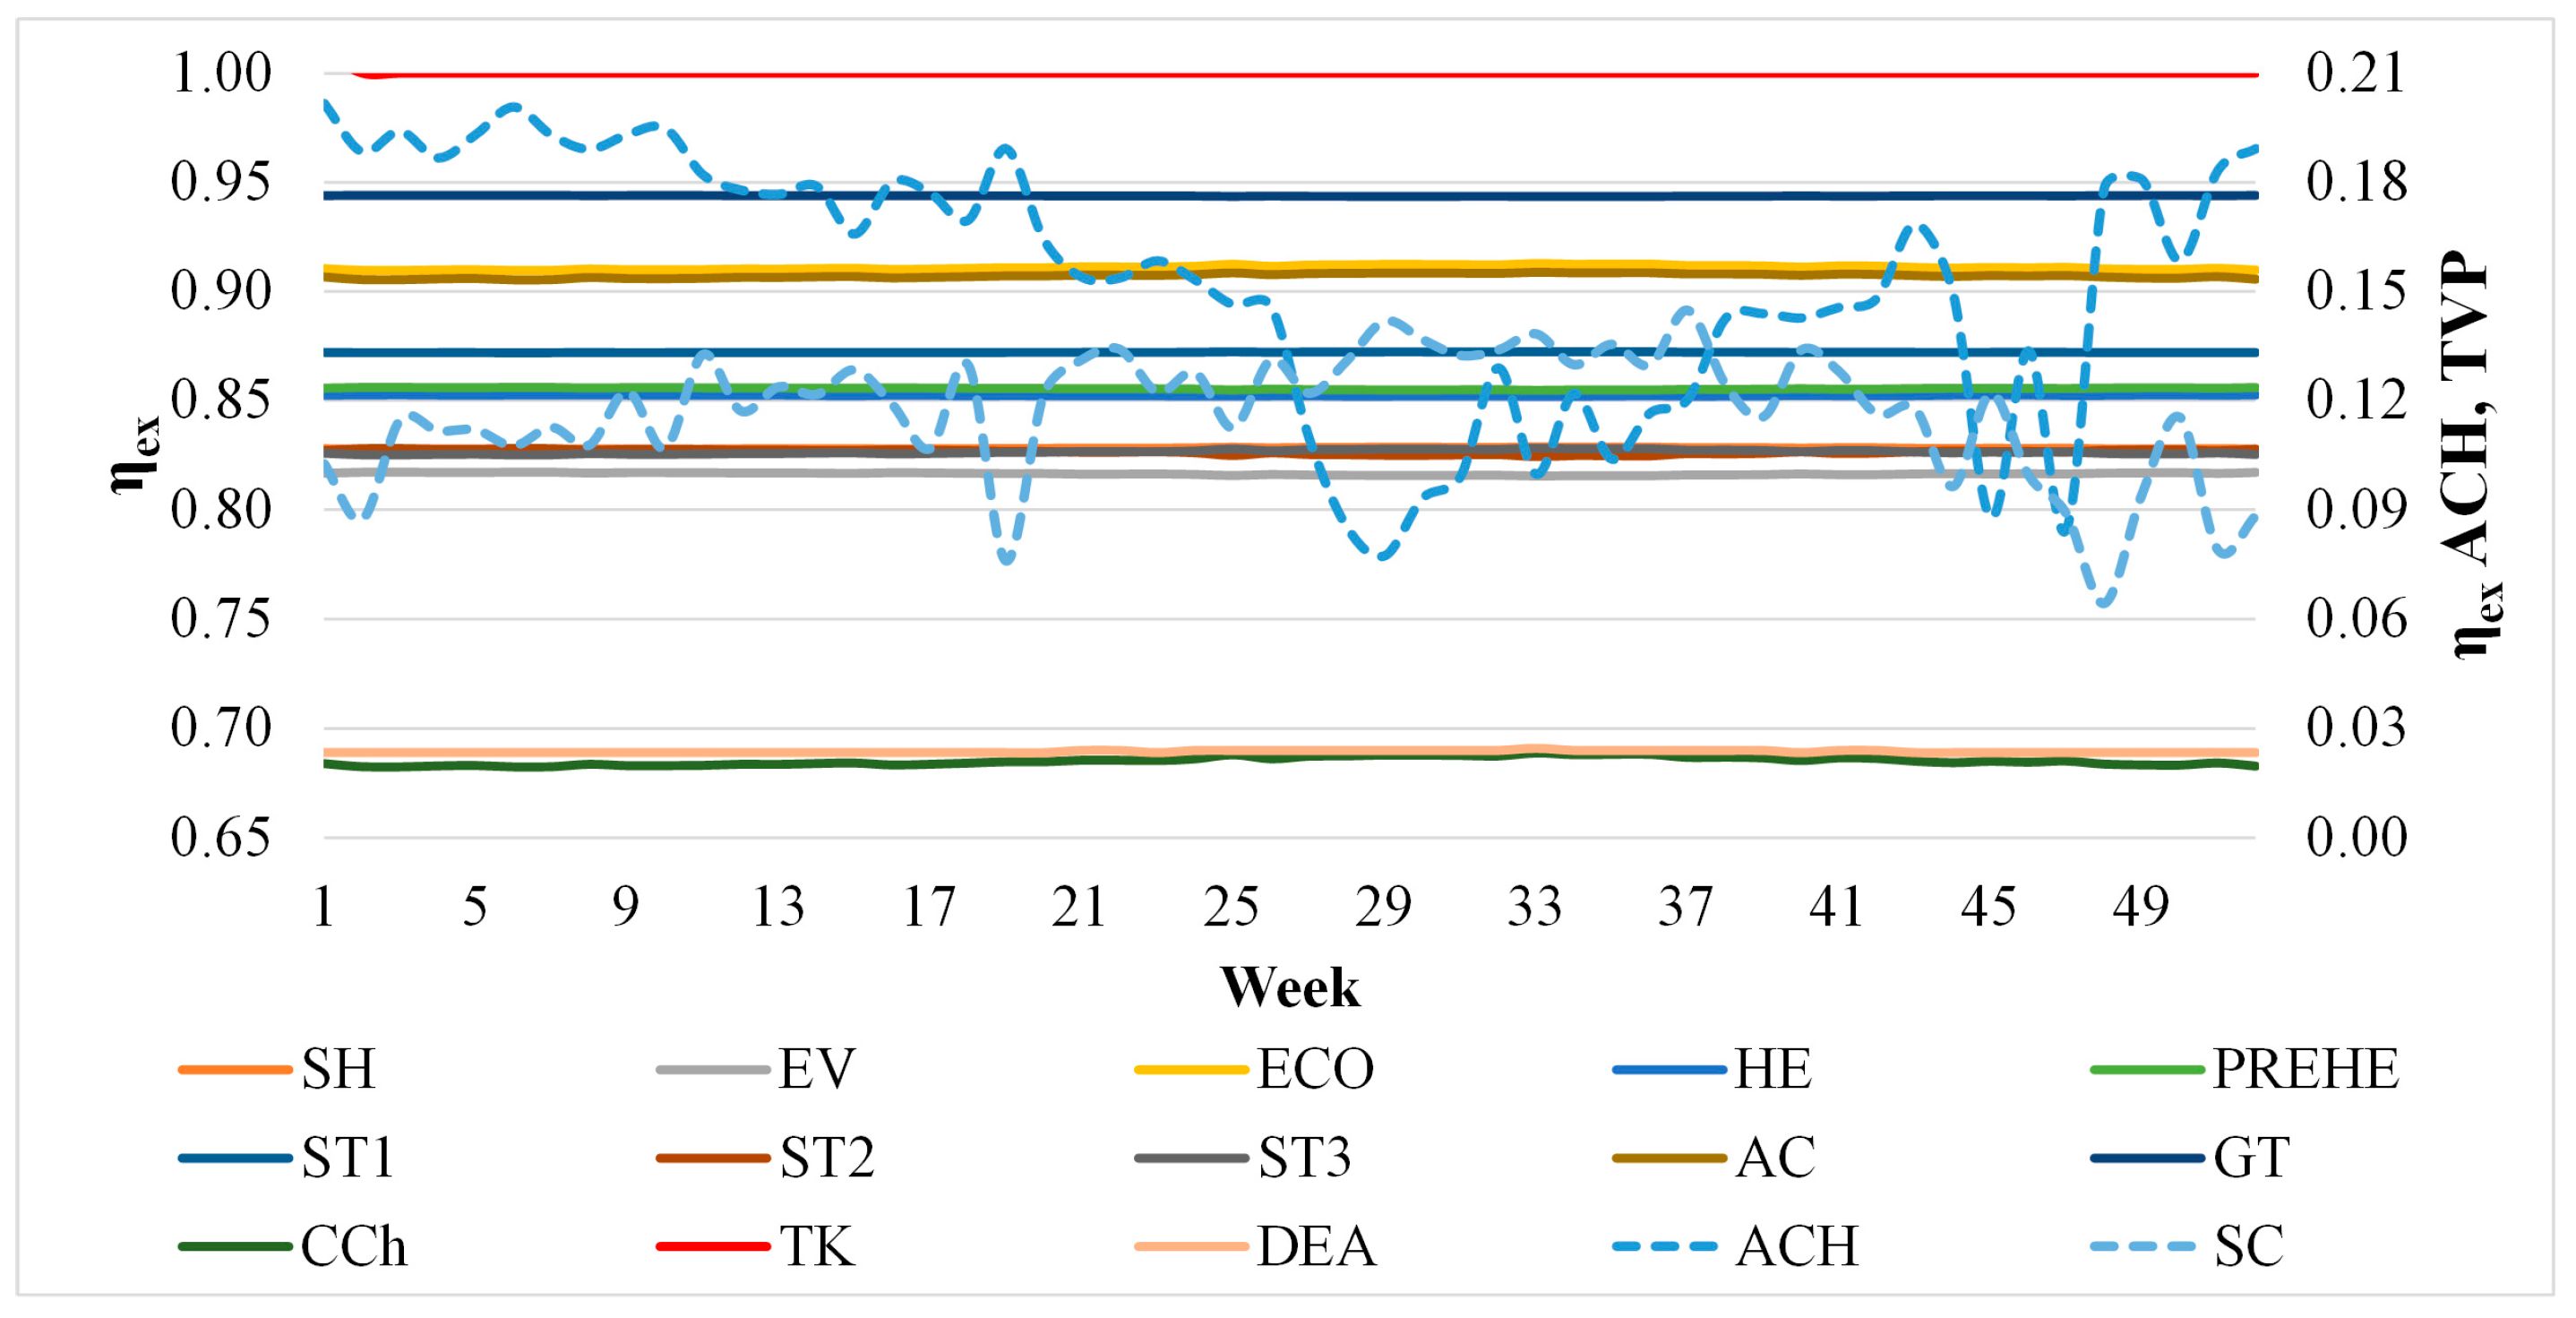
The previous figures show the magnitude of exergy destructions of all the weeks of the year for the components of the system. Such a parameter allows one to calculate the irreversibilities. However, in many cases an increase of the exergy destruction is not due to a reduction of component efficiency, but it is often caused by an increase of its exergy product. Therefore, for a better interpretation of the overall exergetic results, the exergetic efficiencies of the components must be also investigated (
Figure 24). Here, it is shown that the highest exergy destruction is not necessarily correlated with the lowest exergy efficiency. In fact, all the components of the system (excluding CC, ACH, SC and DEA) show exergy efficiencies higher than 80% and reaching, as expected for a process exergy efficiency, a maximum of almost 100% considering the TK. The exergy efficiency of the combustion chamber is close to 69% all year long. The lowest exergy efficiencies are obtained in case of SCs and ACH. Solar collectors efficiency ranges between 10% and 15%, showing a maximum during the summer season, due to the increase of its average operating temperature. Conversely, ACH exergy efficiency varies between 10% and 20%, showing a general increase during the winter season.
The exergetic efficiency of the system as whole is shown in
Figure 25, where a certain decrease during the summer season can be detected. Such decrease is associated to two main effects. First, during the summer the exergetic product and fuels simultaneously decrease. However, the first one decreases slightly faster than the second one, determining the trend of the exergetic efficiency shown in
Figure 25. It is also worth noting that, the proposed system (SACC) exhibits a lower exergetic efficiency with respect to the conventional Combined Cycle (not equipped with solar cooling subsystem). This is due to the fact that the novel system adds a subsystem (solar cooling) showing a very low exergy efficiency (lower than 10%). Once again, this is due to the large temperature differences between sun and collector. Finally, the proposed SACC system determines an increase of the CC exergetic efficiency when considering the last one stand alone since SACC may benefit of a lower inlet air temperature compared to the reference case,
Figure 26.
4.3. Yearly Analysis
In order to get a comprehensive overview, the results of the yearly dynamic simulations, referred to the climate zone of Almeria are summarized in
Table 3. It is noted that the highest value of exergy destruction is obtained by the combustion chamber, due to its irreversible chemical reactions. A remarkable exergy destruction is due to the gas turbine, 14,160 vs. 7833 MWh/year of steam turbine one. The amount of exergy destruction of the gas turbine is mainly due to the high values of exergy input and product. It is not specifically due to any inefficiency of this device. Moreover, it is shown that a significant amount of exergy destruction is due to the solar collectors as a consequence of the dramatic temperature difference between the sun and the solar collector. However, this large exergy destruction is common for whatever renewable energy. In case of renewable energy sources, exergy destruction is not the most significant parameter since solar collector are using an exergy input (solar exergy) which is a free renewable and environmental-friendly source. In addition, the solar exergy input converted by solar collectors would be intrinsically destroyed, when no solar collector is considered. Therefore, large exergy destructions obtained by renewable energy technologies absolutely do not suggest to limit the use of such systems. Very low values of exergy destruction for the ACH, hot tank, cooling coil unit and HESC are shown. Finally, in
Table 3 the efficiencies (η
el,SACC vs. η
el,RS) and electricity production differences (
Eel,SACC vs.
Eel,RS) obtained by the economic-energy analysis carried out in reference [
19] are also shown. Although the differences are very low, significant economic savings for the proposed system are achieved.
5. Conclusions
This paper presented an exergetic model of a novel high-temperature solar assisted combined cycle, developed using dynamic simulations.
The system consists of a single pressure combined cycle coupled to innovative flat plate evacuated solar thermal collectors and a double stage LiBr-H2O absorption chiller. The proposed SACC system is a very promising technology to be used in case of revamping and optimization of existing CC power plants located in weather zones featuring high outdoor air temperatures and low relative humidity. In fact, the proposed SACC does not require any modification of the existing combined cycle. A case study was performed for the SACC system assumed to be located in Almeria (Spain). For this system, detailed exergy analyses are performed in order to calculate the magnitude and to identify the sources of irreversibilities.
In the followings, the main findings of investigated SACC system can be resumed:
The overall exergy destruction is dominated by the combustion chamber of the Joule subsystem which is the major source of system irreversibilities;
In the Rankine subsystem, the highest exergy destruction rate is corresponds to the evaporator, affected by the significant temperature differences, caused by the single pressure level;
In the solar system, solar collector exergy destruction predominates over those of the other components, as a result of the poor collector exergetic efficiency;
The average weekly solar collector exergetic efficiency ranged from 6.5% to 14.5%, increasing significantly during the summer season;
Absorption chiller exergy efficiency varies from 7.7% to 20.2%, being higher during the winter season;
Combustor exergy efficiency is stable and close to 68%, whereas the exergy efficiencies of the remaining components are higher than 80%.
The system’s overall exergetic efficiency was around 48%, slightly lower than that of a conventional combined cycle not equipped with solar cooling technology.
As a consequence, the exergetic analysis indicates that the hybridization of a conventional combined cycle with a solar cooling subsystem determines an increase of the exergy destruction and a slight decrease of the overall exergetic efficiency. This is due mainly to the poor exergetic efficiency of the solar collectors. However, such result does not suggest that the hybrid system is not feasible. In fact, although the hybridization prodices an increase of the irreversibilities, this arrangement is based on the utilization of a free renewable energy source. In fact, if one considers a control volume including the sole CC, the proposed system determines an increase of CC exergetic efficiency. In addition, it must be also considered that in a system not equipped with solar cooling subsystem solar exergy is intrinsically destroyed since no device can convert it. This proves that the proposed system represents a remarkable improvement of the exergetic performance of the system. Finally, the results suggest that special attention must be paid to the reduction of the inefficiencies in solar cooling subsystems. Future planned improvements of this work include the development of exergetic optimizations and exergoeconomic analyses.


