

Application of Multivariate Empirical Mode Decomposition and Sample Entropy in EEG Signals via Artificial Neural Networks for Interpreting Depth of Anesthesia

 ,
,  ,
, 
Abstract
1. Introduction
2. Materials and Methods
2.1. Materials
2.2. Sample Entropy
2.3. Multivariate Empirical Mode Decomposition
2.4. Artificial Neural Networks
3. Analysis of Intrinsic Mode Functions
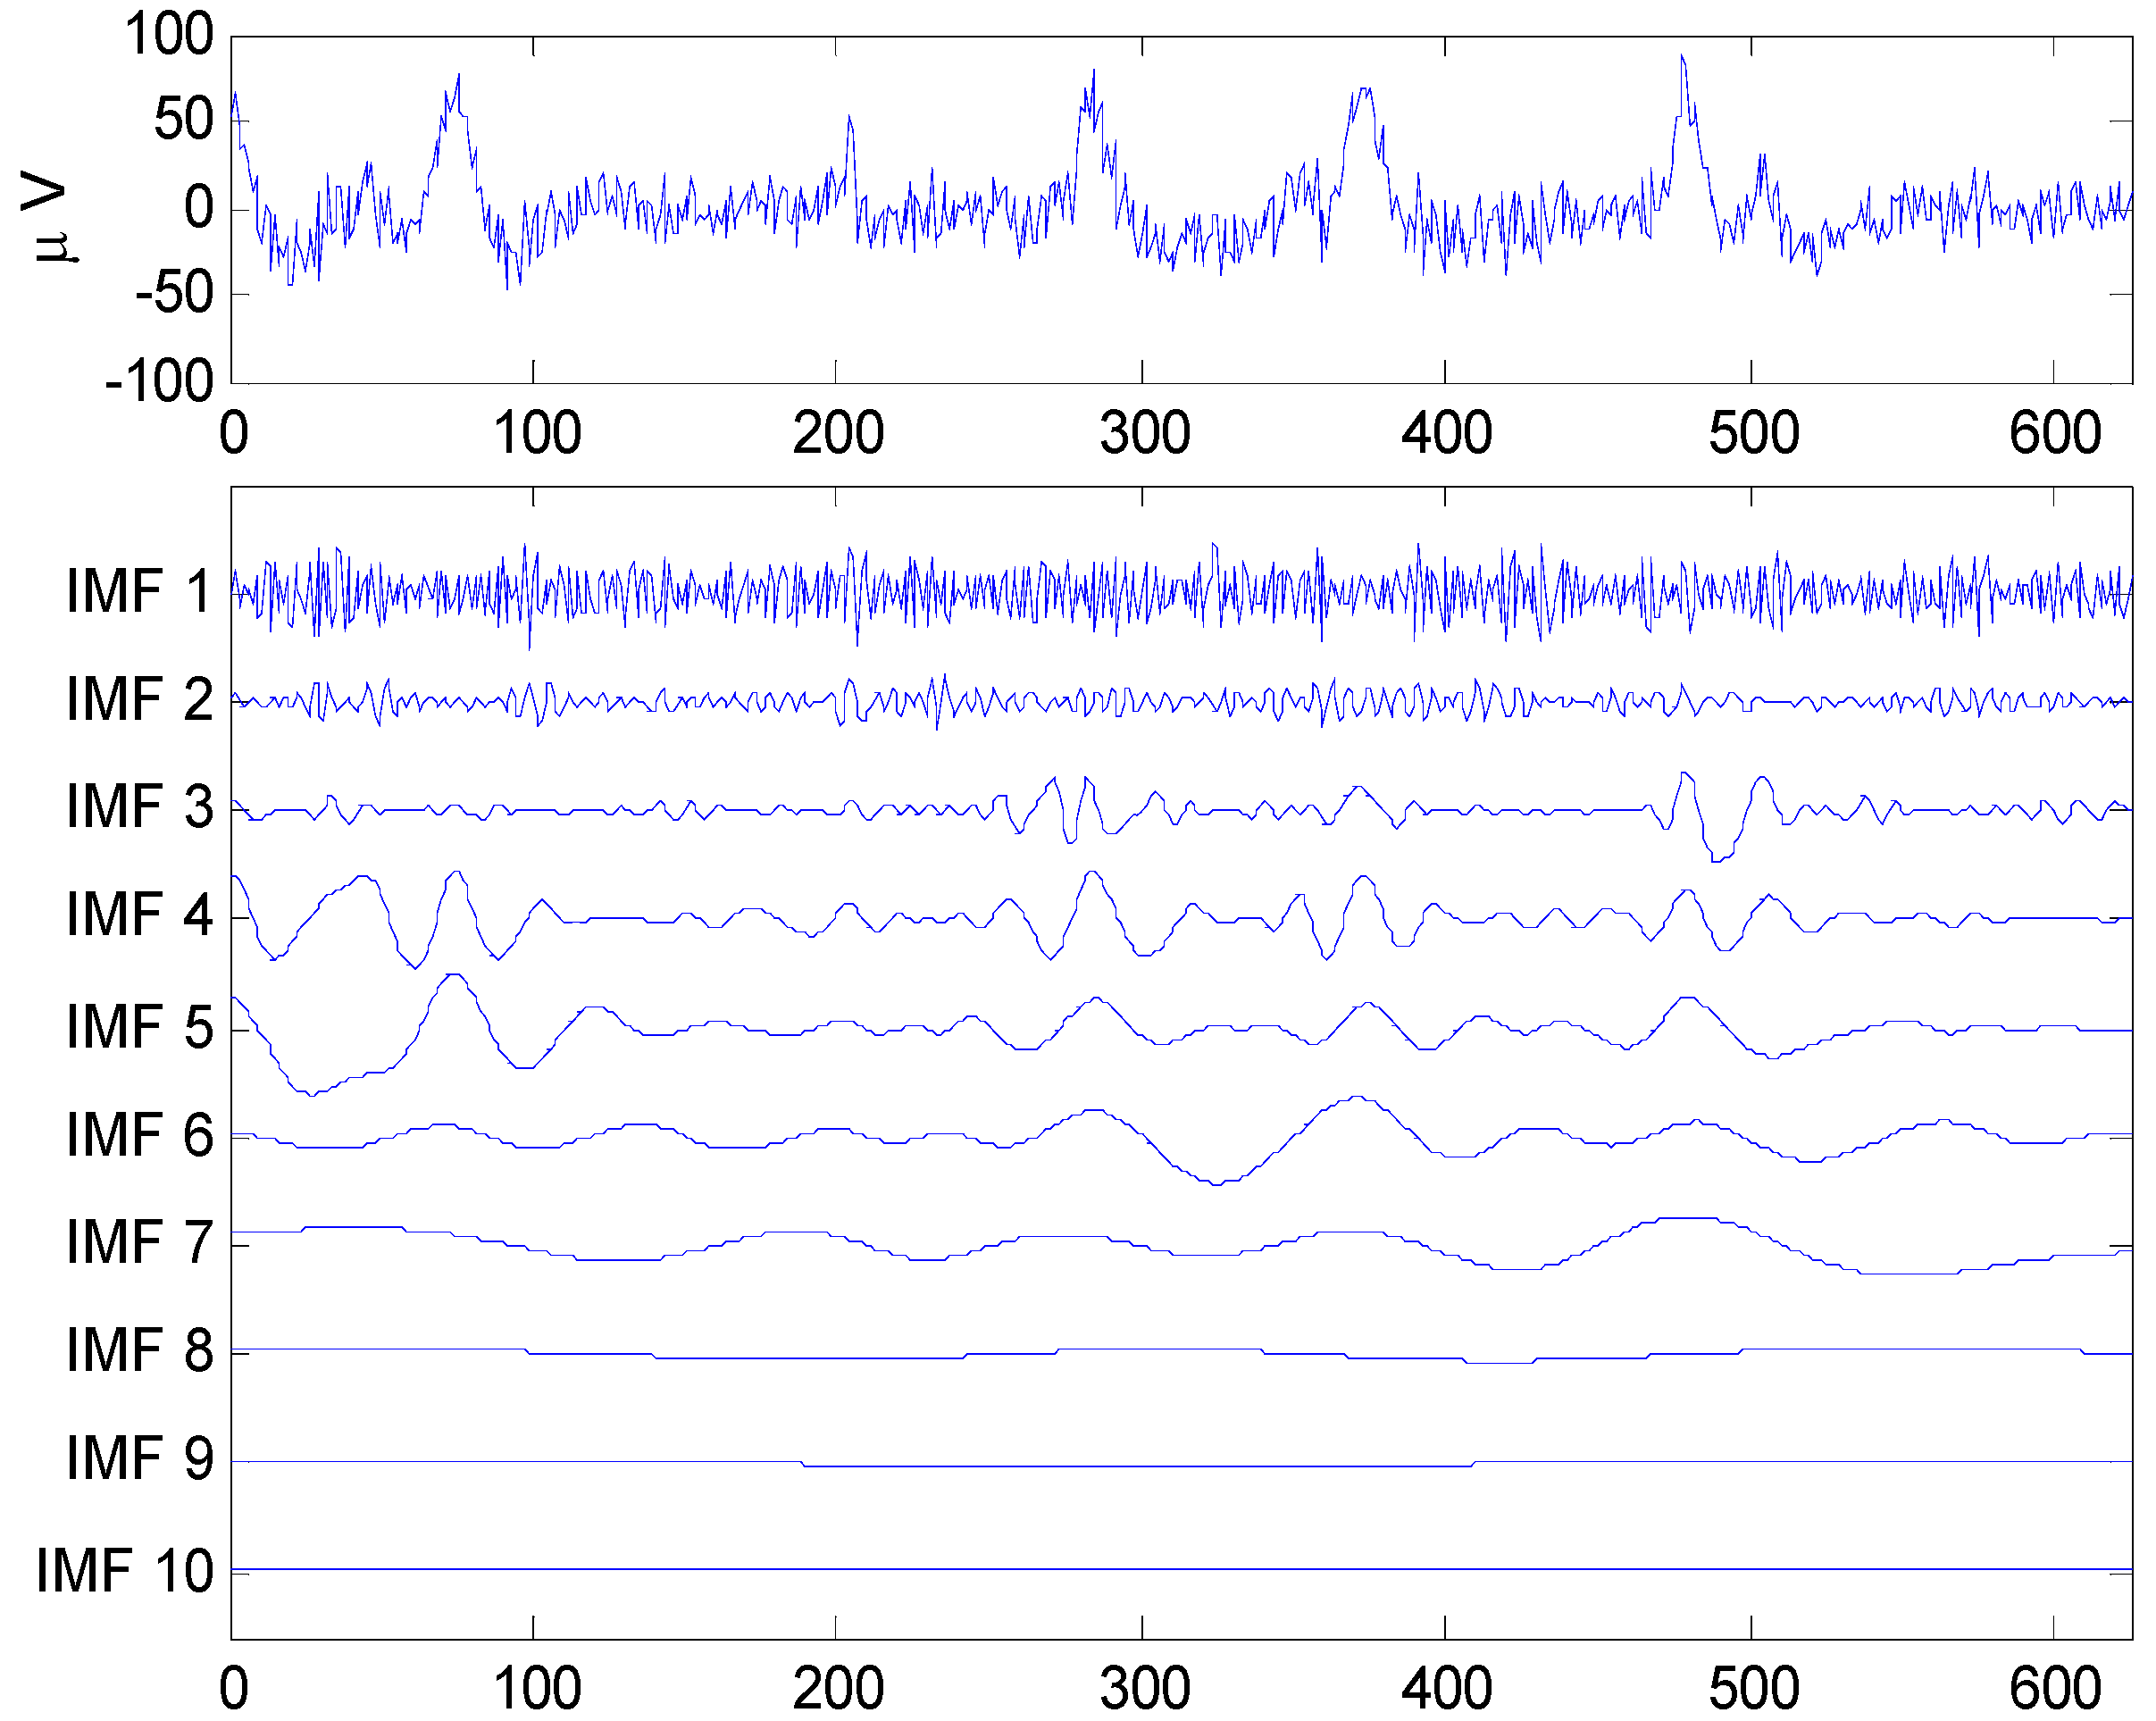
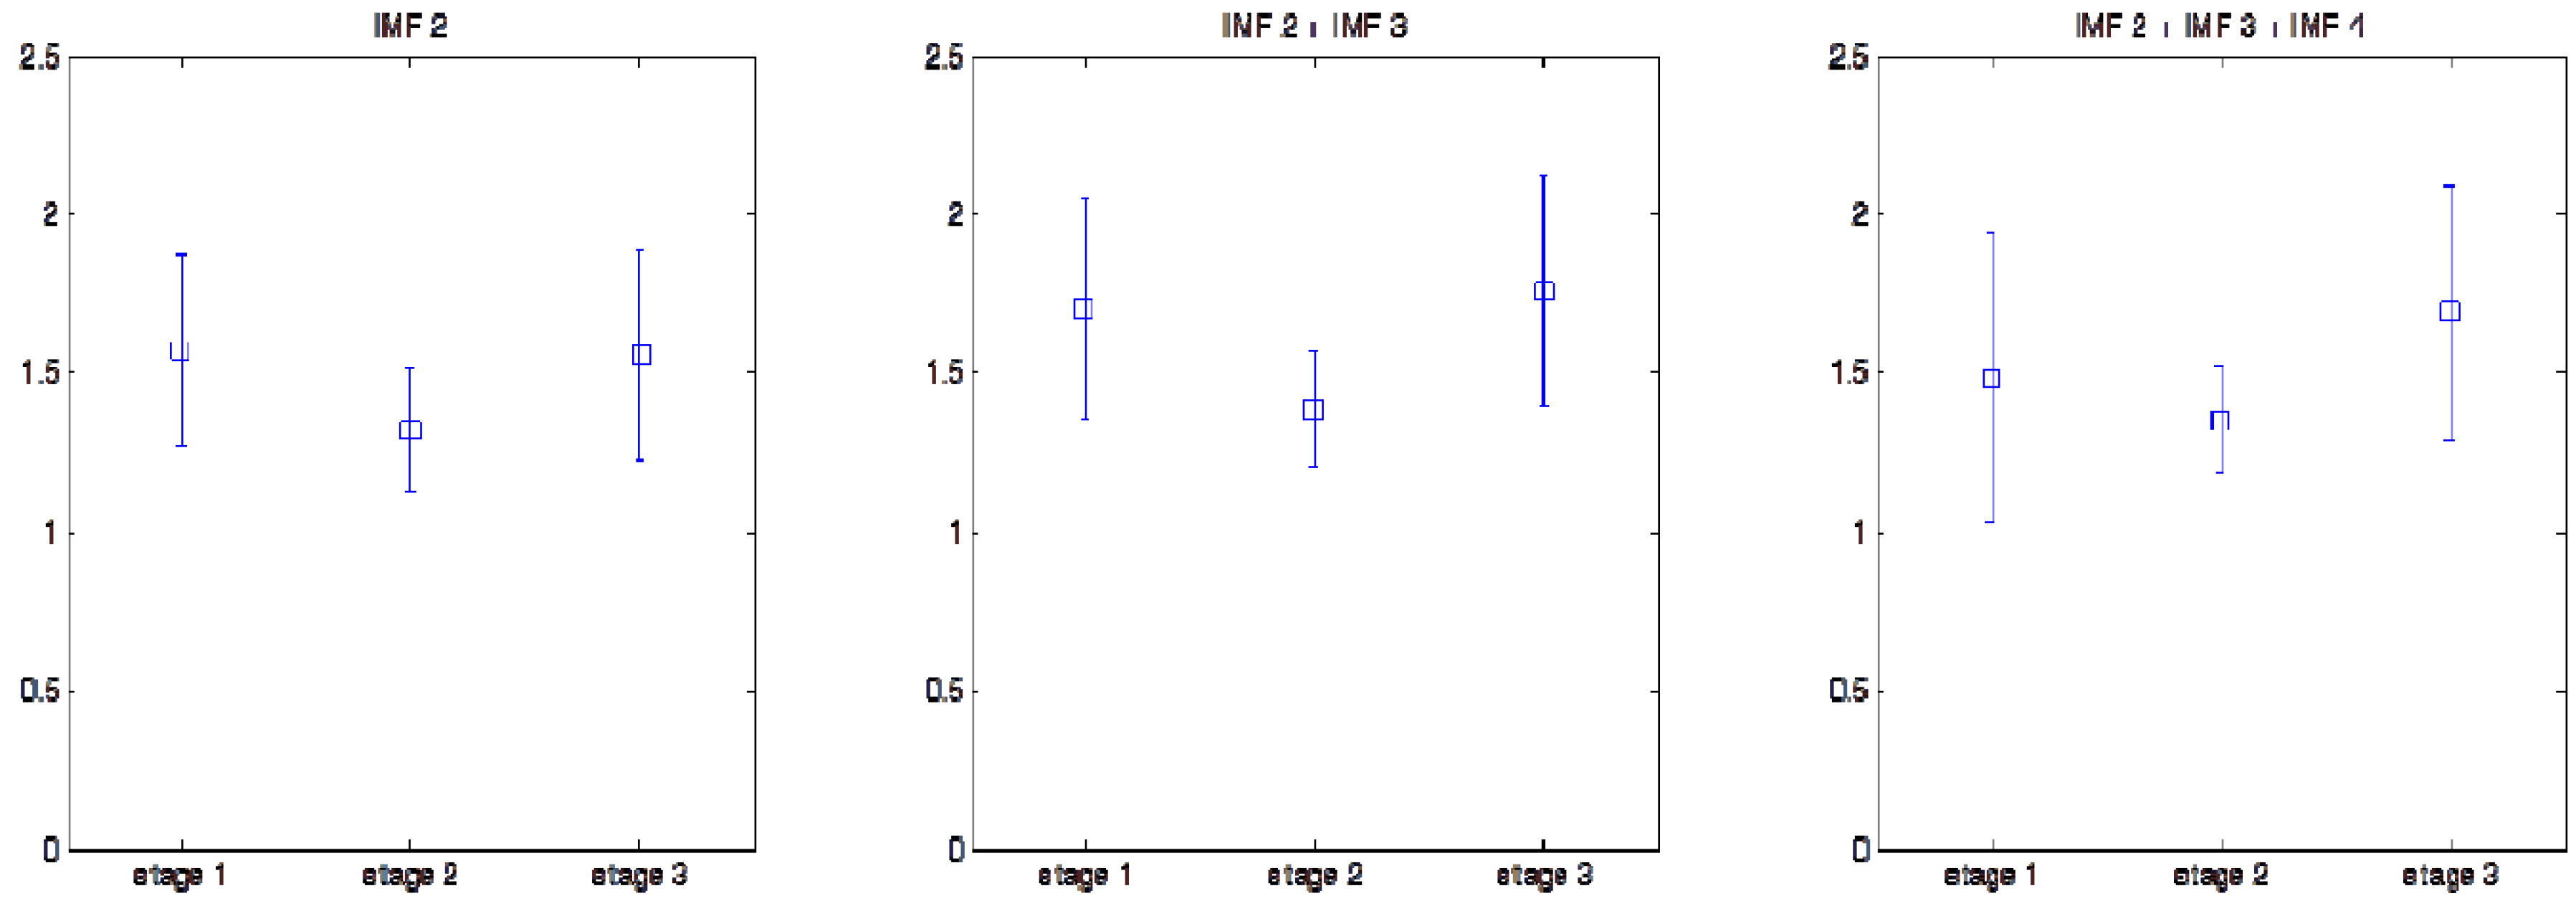

| Stage1 | Stage2 | Stage3 | |
|---|---|---|---|
| IMF1 | 47.254 ± 7.343 | 50.512 ± 5.345 | 45.529 ± 7.420 |
| IMF2 | 20.583 ± 2.892 | 18.552 ± 2.311 | 19.957 ± 3.429 |
| IMF3 | 9.650 ± 1.656 | 10.212 ± 1.373 | 10.234 ± 1.999 |
| IMF4 | 5.088 ± 1.106 | 5.558 ± 1.167 | 5.639 ± 1.438 |
| IMF5 | 2.707 ± 0.644 | 2.809 ± 0.638 | 2.783 ± 0.768 |
| IMF6 | 1.456 ± 0.378 | 1.427 ± 0.347 | 0.414 ± 0.396 |
| IMF7 | 0.779 ± 0.237 | 0.740 ± 0.214 | 0.770 ± 0.231 |
| IMF8 | 0.401 ± 0.143 | 0.376 ± 0.144 | 0.404 ± 0.151 |
| IMF9 | 0.157 ± 0.120 | 0.126 ± 0.113 | 0.153 ± 0.123 |
| IMF10 | 0.027 ± 0.060 | 0.017 ± 0.046 | 0.029 ± 0.060 |
| Stage1 | Stage2 | Stage 3 | |
|---|---|---|---|
| IMF2 | 1.576 ± 0.301 | 1.317 ± 0.198 | 1.557 ± 0.335 |
| IMF3 | 0.753 ± 0.162 | 0.813 ± 0.097 | 0.833 ± 0.167 |
| IMF4 | 0.557 ± 0.113 | 0.657 ± 0.039 | 0.605 ± 0.110 |
| IMF5 | 0.473 ± 0.123 | 0.567 ± 0.050 | 0.491 ± 0.129 |
| IMF6 | 0.386 ± 0.109 | 0.422 ± 0.076 | 0.373 ± 0.119 |
| IMF2 + IMF3 | 1.702 ± 0.349 | 1.387 ± 0.180 | 1.758 ± 0.367 |
| IMF2 + IMF4 | 1.571 ± 0.511 | 1.556 ± 0.237 | 1.796 ± 0.435 |
| IMF2 + IMF5 | 1.452 ± 0.559 | 1.586 ± 0.290 | 1.727 ± 0.515 |
| IMF2 + IMF6 | 1.426 ± 0.574 | 1.559 ± 0.326 | 1.694 ± 0.517 |
| IMF3 + IMF4 | 0.777 ± 0.199 | 0.950 ± 0.097 | 0.921 ± 0.214 |
| IMF3 + IMF5 | 0.797 ± 0.237 | 1.042 ± 0.112 | 0.966 ± 0.276 |
| IMF3 + IMF6 | 0.803 ± 0.256 | 1.047 ± 0.134 | 0.964 ± 0.288 |
| IMF4 + IMF5 | 0.526 ± 0.125 | 0.656 ± 0.046 | 0.591 ± 0.131 |
| IMF4 + IMF6 | 0.552 ± 0.121 | 0.682 ± 0.052 | 0.599 ± 0.138 |
| IMF5 + IMF6 | 0.409 ± 0.110 | 0.515 ± 0.055 | 0.432 ± 0.127 |
| IMF2 + IMF3 + IMF4 | 1.484 ± 0.455 | 1.356 ± 0.165 | 1.689 ± 0.406 |
| IMF2 + IMF3 + IMF5 | 1.428 ± 0.483 | 1.429 ± 0.162 | 1.657 ± 0.429 |
| IMF2 + IMF3 + IMF6 | 1.428 ± 0.490 | 1.424 ± 0.170 | 1.650 ± 0.430 |
| IMF2 + IMF4 + IMF5 | 1.302 ± 0.564 | 1.380 ± 0.269 | 1.623 ± 0.515 |
| IMF2 + IMF4 + IMF6 | 1.346 ± 0.551 | 1.424 ± 0.268 | 1.625 ± 0.486 |
| IMF2 + IMF5 + IMF6 | 1.218 ± 0.576 | 1.377 ± 0.325 | 1.558 ± 0.571 |
| IMF3 + IMF4 + IMF5 | 0.715 ± 0.220 | 0.964 ± 0.107 | 0.882 ± 0.242 |
| IMF3 + IMF4 + IMF6 | 0.751 ± 0.214 | 0.982 ± 0.108 | 0.896 ± 0.240 |
| IMF3 + IMF5 + IMF6 | 0.695 ± 0.249 | 1.010 ± 0.143 | 0.895 ± 0.308 |
| IMF4 + IMF5 + IMF6 | 0.475 ± 0.136 | 0.646 ± 0.049 | 0.557 ± 0.147 |
| IMF2 + IMF3 + IMF4 + IMF5 | 1.276 ± 0.500 | 1.304 ± 0.170 | 1.560 ± 0.453 |
| IMF2 + IMF3 + IMF4 + IMF6 | 1.316 ± 0.482 | 1.321 ± 0.165 | 1.570 ± 0.439 |
| IMF2 + IMF3 + IMF5 + IMF6 | 1.238 ± 0.520 | 1.355 ± 0.187 | 1.538 ± 0.493 |
| IMF2 + IMF4 + IMF5 + IMF6 | 1.144 ± 0.565 | 1.279 ± 0.273 | 1.492 ± 0.541 |
| IMF3 + IMF4 + IMF5 + IMF6 | 0.652 ± 0.236 | 0.952 ± 0.124 | 0.840 ± 0.258 |
| IMF2 + IMF3 + IMF4 + IMF5 + IMF6 | 1.143 ± 0.516 | 1.260 ± 0.177 | 1.458 ± 0.492 |
| Stage1 & Stage2 (P value) | Stage2 & Stage3 (P value) | |
|---|---|---|
| IMF2 | 1.15×10−38 | 1.08×10⁻²⁸ |
| IMF2 + IMF3 | 3.54×10−44 | 6.22×10−53 |
| IMF2 + IMF4 | 0.607112601 | 9.44×10⁻²¹ |
| IMF2 + IMF3 + IMF4 | 3.88×10⁻⁷ | 3.96×10−41 |
| IMF2 + IMF3 + IMF6 | 0.872162002 | 1.57×10⁻¹⁹ |
4. Application of Sample Entropy to Analysis of EEG for Monitoring DOA
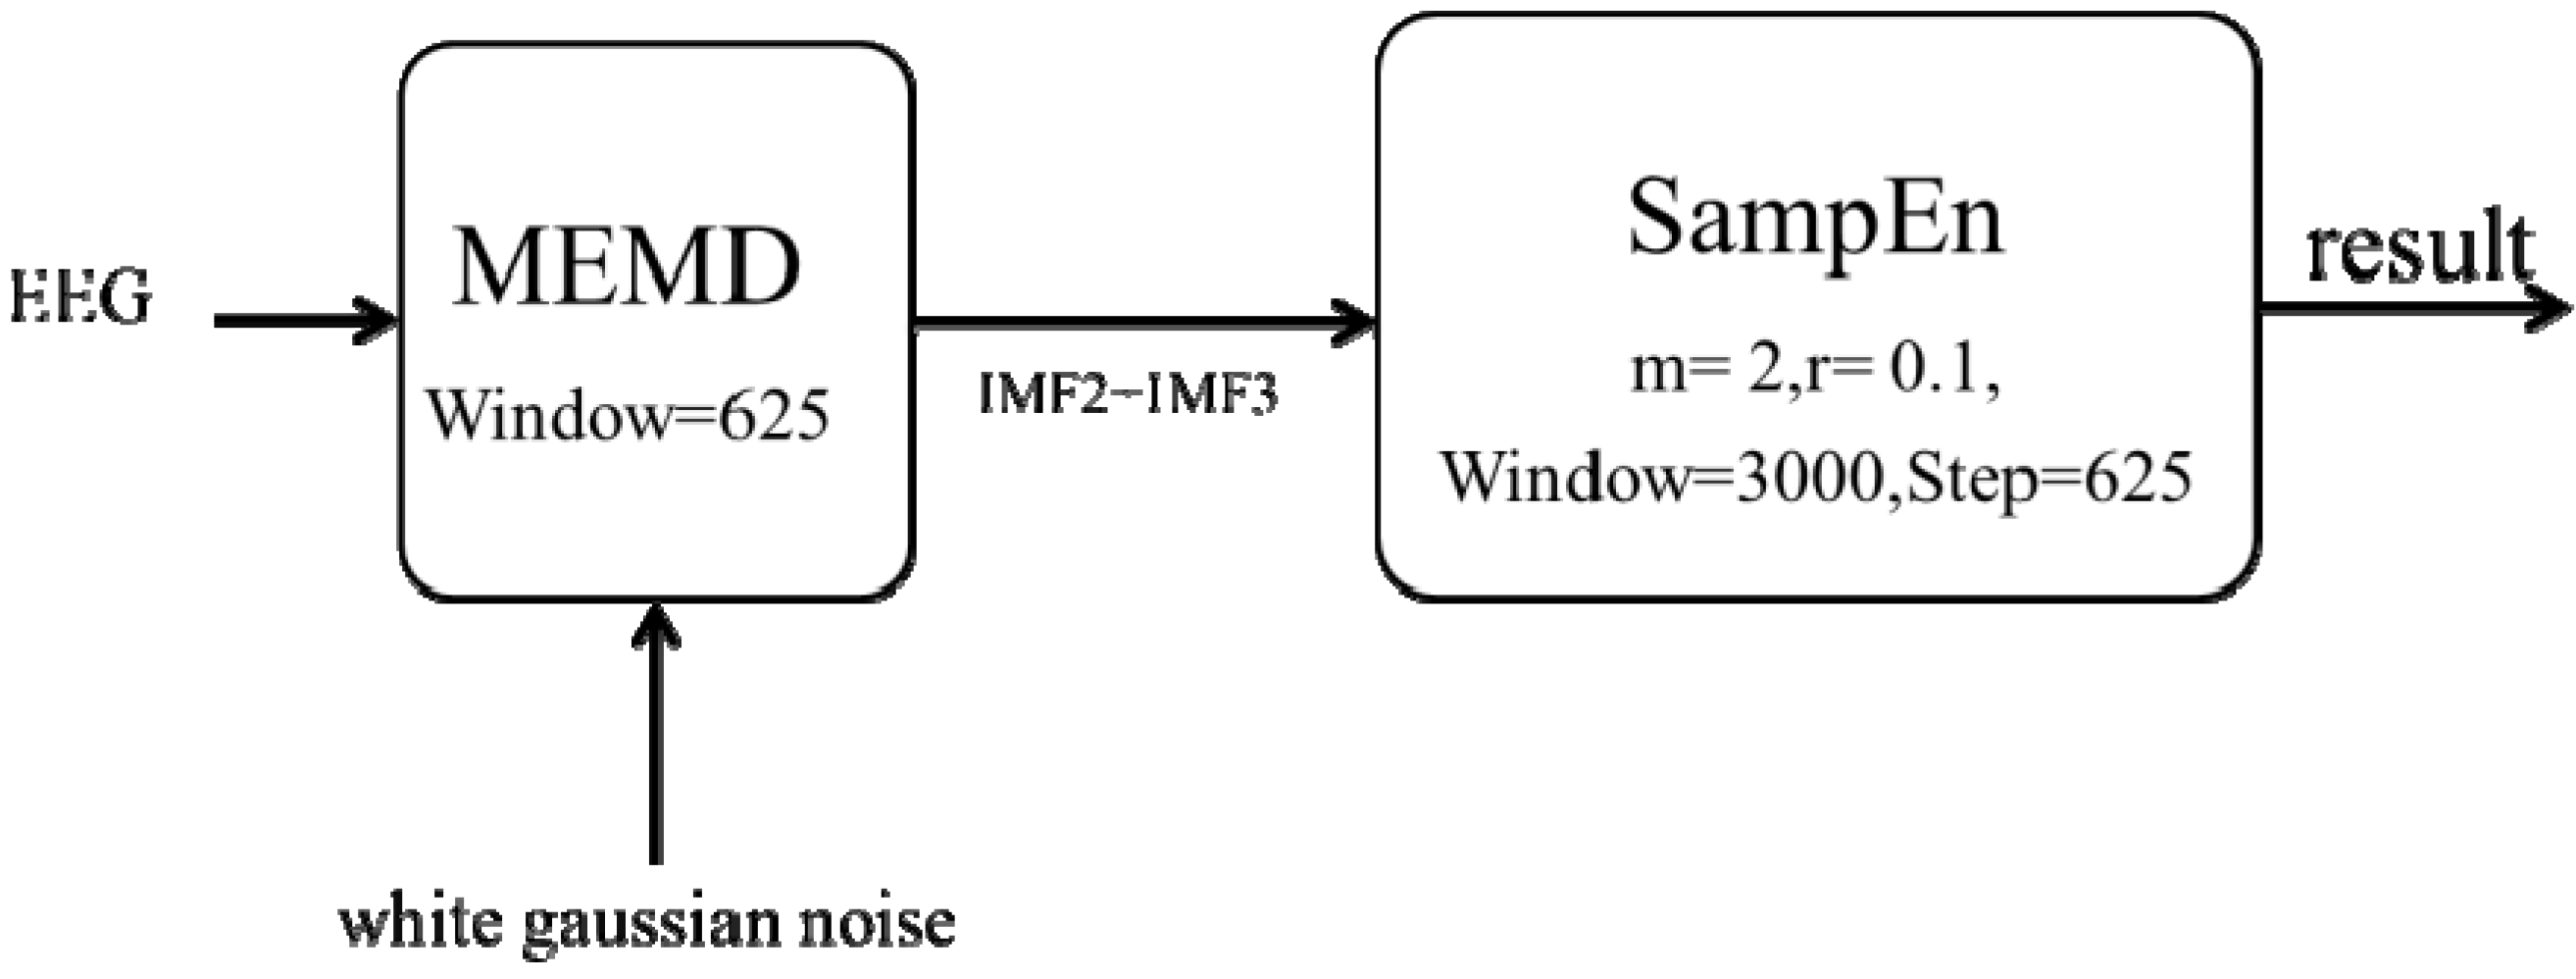
| Times | Model group | Testing group |
|---|---|---|
| 1 | 0.777 ± 0.074 | 0.742 ± 0.061 |
| 2 | 0.777 ± 0.075 | 0.743 ± 0.059 |
| 3 | 0.769 ± 0.062 | 0.759 ± 0.090 |
| 4 | 0.770 ± 0.072 | 0.758 ± 0.073 |
| 5 | 0.776 ± 0.067 | 0.746 ± 0.079 |
| 6 | 0.764 ± 0.070 | 0.769 ± 0.078 |
| 7 | 0.747 ± 0.074 | 0.802 ± 0.051 |
| 8 | 0.778 ± 0.073 | 0.740 ± 0.063 |
| 9 | 0.771 ± 0.071 | 0.755 ± 0.074 |
| 10 | 0.771 ± 0.080 | 0.755 ± 0.053 |
| mean ± SD | 0.770 ± 0.072 | 0.757 ± 0.068 |
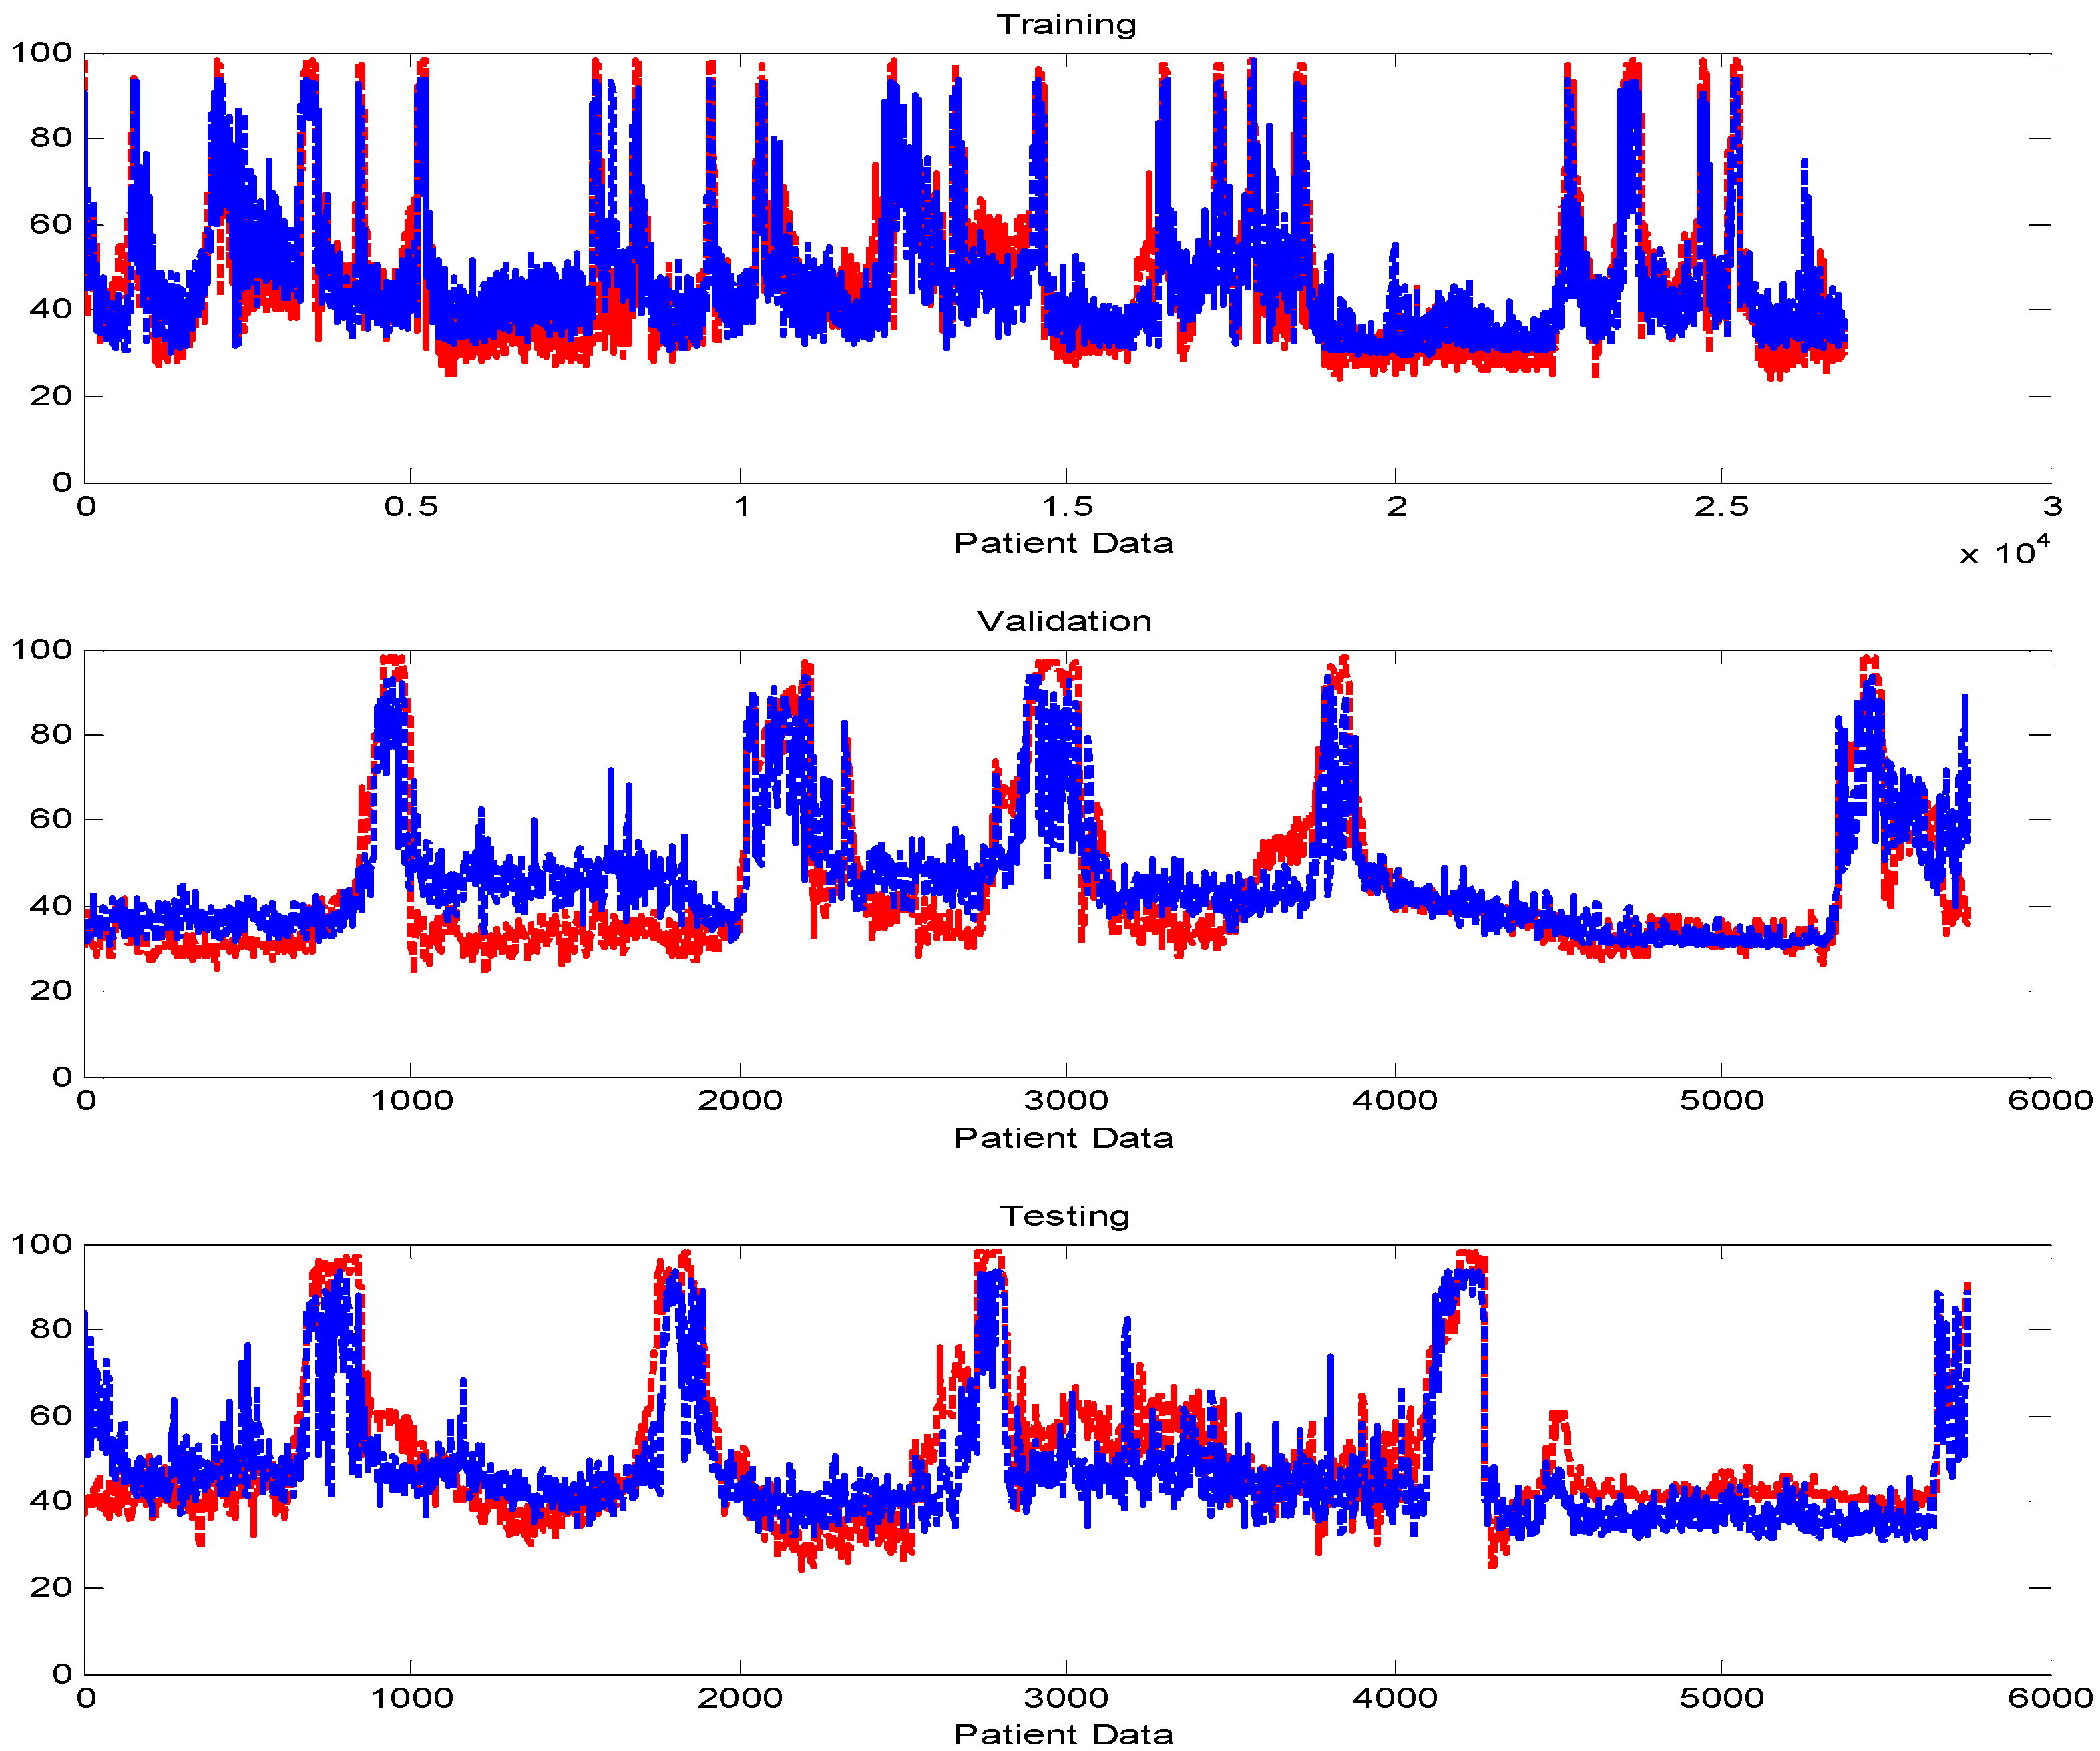
| Time(s) | BIS | Entropy | Total time (min) | ||||
|---|---|---|---|---|---|---|---|
| Patient 1 | 1 (185s) | 3726 | ~ | 3755 | 36.33 ± 2.34 | 34.75 ± 0.88 | 102.08 |
| 3756 | ~ | 3940 | −1 | 36.75 ± 3.98 | |||
| 3941 | ~ | 3970 | 39.50 ± 1.38 | 40.00 ± 2.82 | |||
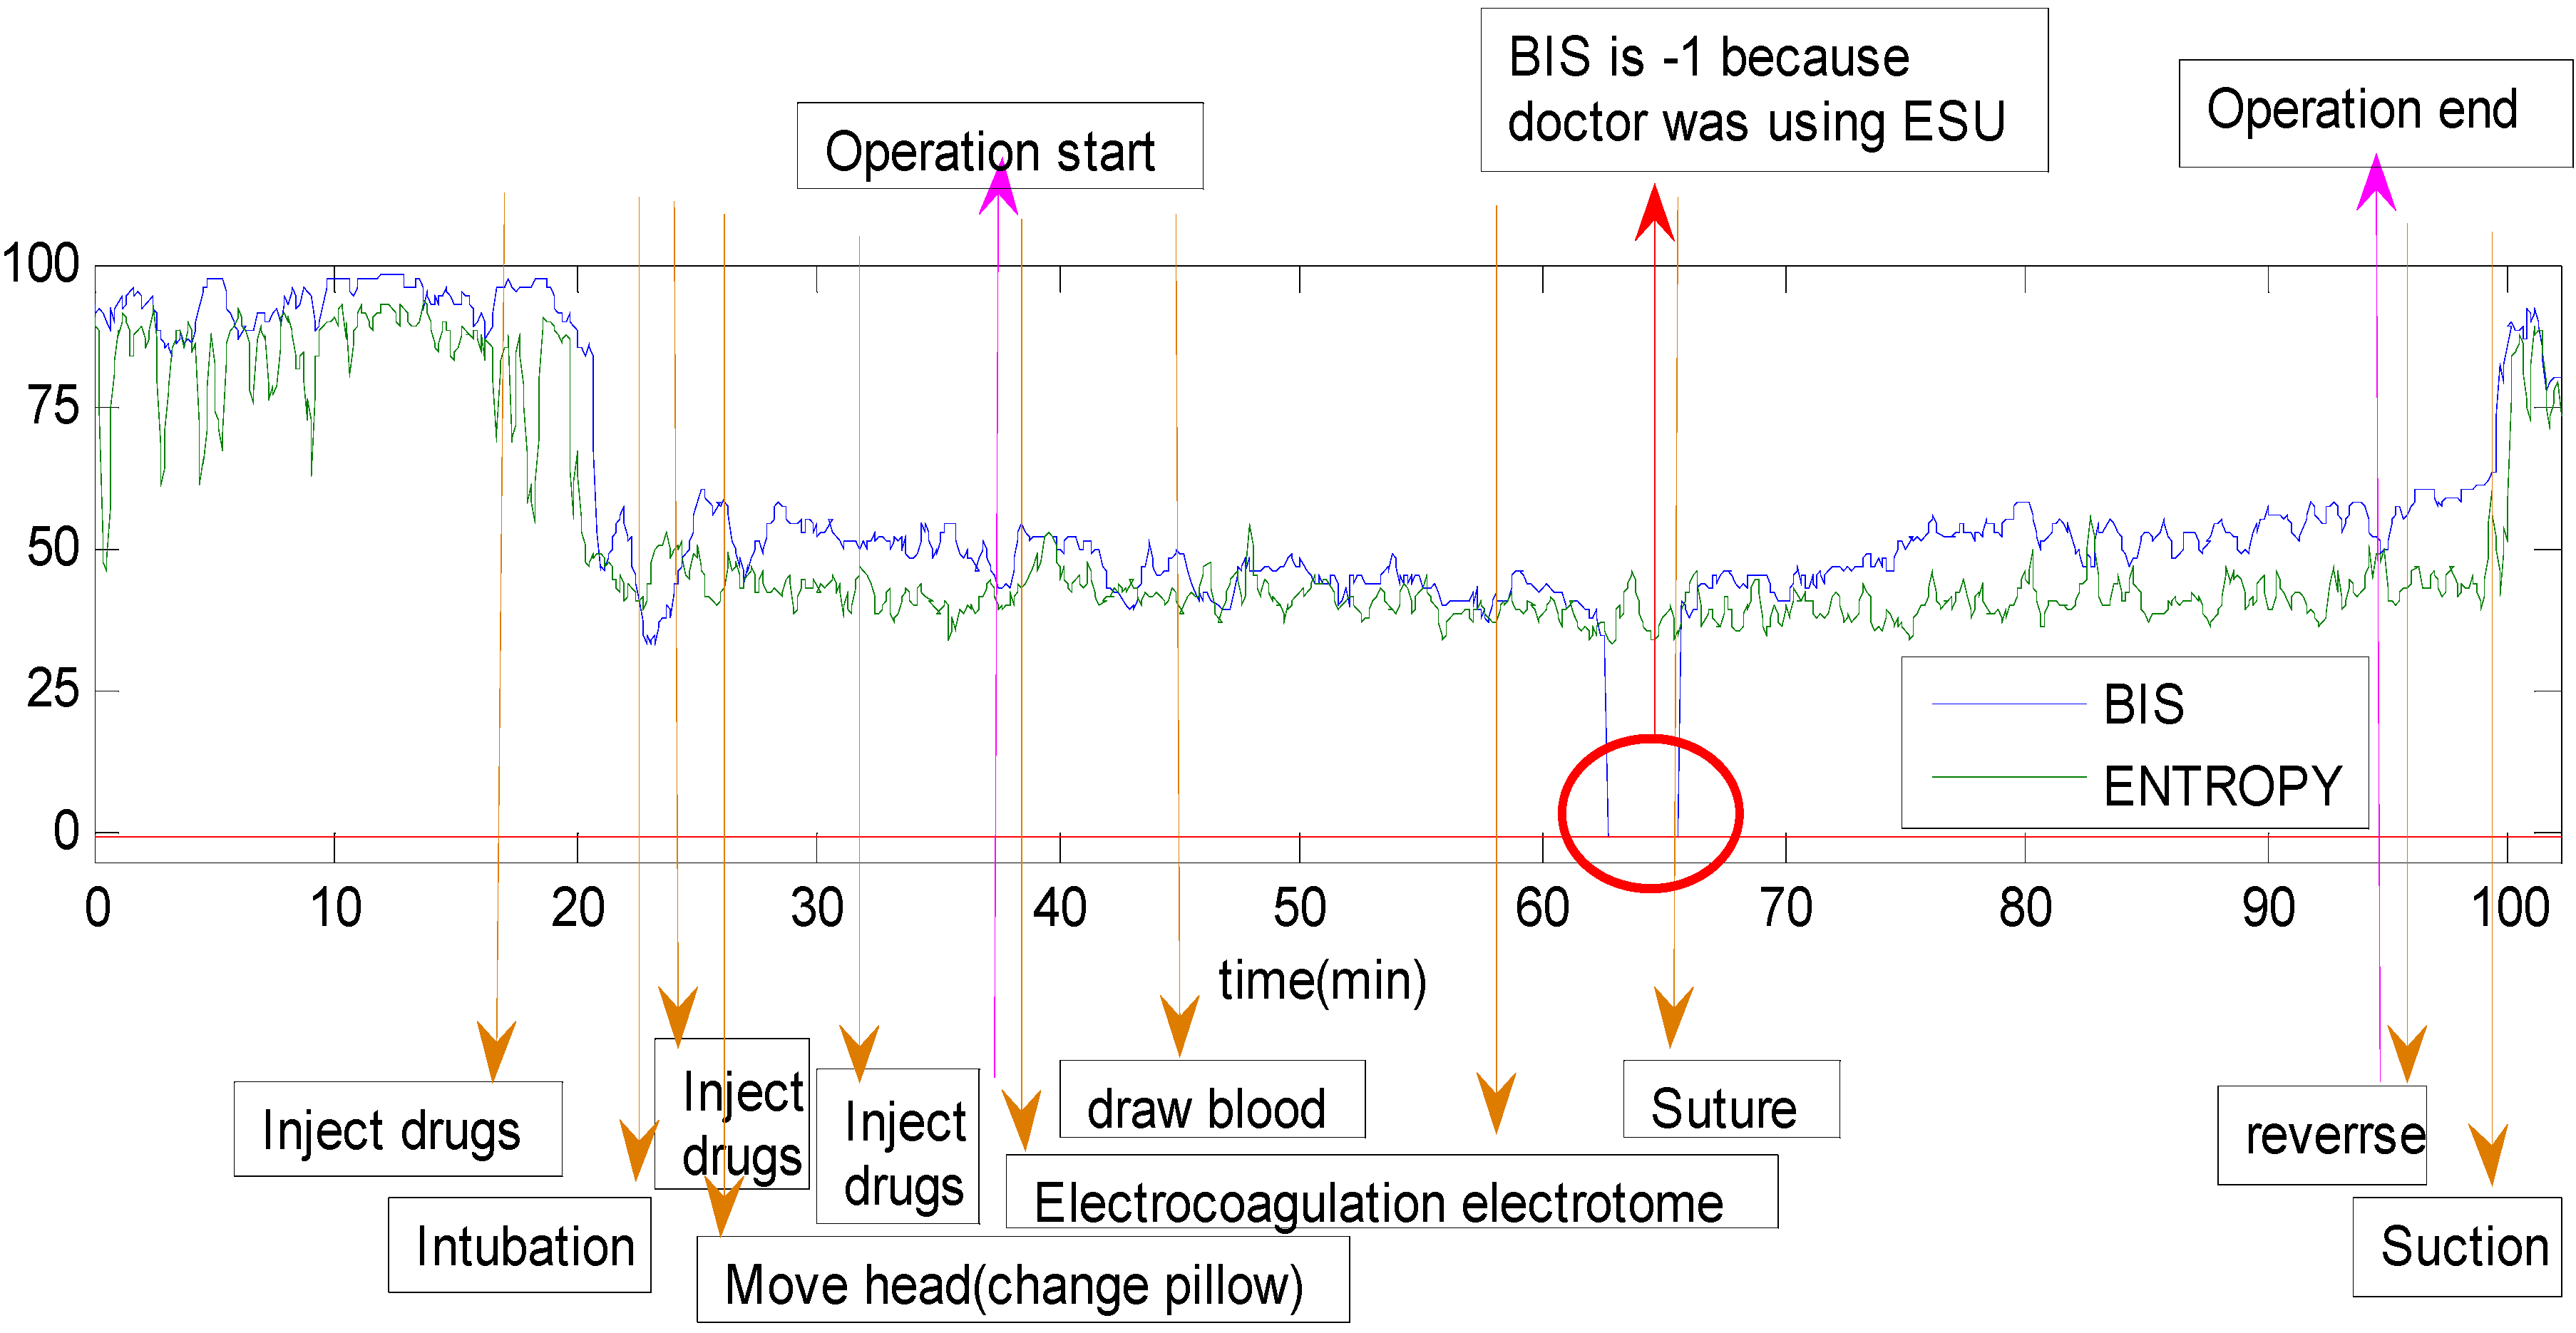
| Event & Time (s) | Event no. | Total event time (s) | Operation time (min) | |
|---|---|---|---|---|
| Patient 1 | 1(185s) | 1 | 185 | 102.08 |
| Patient 3 | 1(5s), 2(10s) | 2 | 15 | 74.42 |
| Patient 5 | 1(15s) | 1 | 15 | 110.75 |
| Patient 6 | 1(25s), 2(5s), 3(25s) | 3 | 55 | 41.50 |
| Patient 10 | 1(5s), 2(10s) | 2 | 15 | 94.58 |
| Patient 11 | 1(25s) | 1 | 25 | 69.92 |
| Patient 14 | 1(10s), 2(25s), 3(40s), 4(60s), 5(175s), 6(160s), 7(10s), 8(10s), 9(5s), 10(5s), 11(30s), 12(35s), 13(125s), 14(30s), 15(30s) | 15 | 750 | 229.17 |
| Patient 15 | 1(15s), 2(10s), 3(25s), 4(50s), 5(30s), 6(125s), 7(5s), 8(20s), 9(15s), 10(5s), 11(30s), 12(15s), 13(40s), 14(30s) | 14 | 415 | 347.75 |
| Patient 16 | 1(20s) | 1 | 20 | 69.50 |
| Patient 17 | 1(10s), 2(25s) | 2 | 35 | 53.42 |
| Patient 18 | 1(25s), 2(10s), 3(50s), 4(10s), 5(20s), 6(10s) | 6 | 125 | 225.08 |
| Patient 23 | 1(5s) | 1 | 5 | 69.92 |
| Patient 25 | 1(5s), 2(5s) | 2 | 10 | 160.17 |
| Patient 28 | 1(5s) | 1 | 5 | 99.67 |
5. Receiver Operating Characteristic (ROC) Curve
| AUC | |||
|---|---|---|---|
| ANN | Entropy via MEMD | Original entropy | |
| Patient 1 | 0.963 | 0.963 | 0.742 |
| Patient 2 | 0.895 | 0.895 | 0.785 |
| Patient 3 | 0.987 | 0.987 | 0.804 |
| Patient 4 | 0.966 | 0.966 | 0.690 |
| Patient 5 | 0.969 | 0.969 | 0.580 |
| Patient 6 | 0.965 | 0.965 | 0.780 |
| Patient 7 | 0.965 | 0.965 | 0.845 |
| Patient 8 | 0.977 | 0.977 | 0.575 |
| Patient 9 | 0.986 | 0.986 | 0.783 |
| Patient 10 | 0.984 | 0.984 | 0.558 |
| Patient 11 | 0.957 | 0.957 | 0.718 |
| Patient 12 | 0.996 | 0.996 | 0.562 |
| Patient 13 | 0.990 | 0.990 | 0.928 |
| Patient 14 | 0.997 | 0.997 | 0.911 |
| Patient 15 | 0.997 | 0.997 | 0.792 |
| Patient 16 | 0.995 | 0.995 | 0.877 |
| Patient 17 | 0.965 | 0.964 | 0.907 |
| Patient 18 | 0.992 | 0.992 | 0.889 |
| Patient 19 | 0.970 | 0.970 | 0.620 |
| Patient 20 | 0.993 | 0.993 | 0.824 |
| Patient 21 | 0.992 | 0.992 | 0.811 |
| Patient 22 | 0.907 | 0.907 | 0.763 |
| Patient 23 | 0.977 | 0.977 | 0.588 |
| Patient 24 | 0.960 | 0.960 | 0.585 |
| Patient 25 | 0.995 | 0.995 | 0.523 |
| Patient 26 | 0.899 | 0.899 | 0.861 |
| Patient 27 | 0.955 | 0.955 | 0.695 |
| Patient 28 | 0.975 | 0.975 | 0.736 |
| Patient 29 | 0.935 | 0.935 | 0.605 |
| Patient 30 | 0.981 | 0.981 | 0.638 |
| mean ± SD | 0.970 ± 0.028 | 0.969 ± 0.028 | 0.733 ± 0.123 |
6. Discussion and Conclusions
Acknowledgements
Conflicts of Interest
References
- Kent, C.D; Domino, K.B. Depth of anesthesia. Curr. Opin. Anaesthesiol. 2009, 22, 782–787. [Google Scholar] [CrossRef] [PubMed]
- Jeannea, M.; Logierb, R.; Jonckheereb, J.D.; Tavernier, B. Heart rate variability during total intravenous anesthesia: Effects of nociception and analgesia. Auton. Neurosci. 2009, 147, 91–96. [Google Scholar] [CrossRef] [PubMed]
- Pomfrett, C.J.D.; Dolling, S.; Anders, N.R.K.; Glover, D.G; Bryan, A.; Pollard, B.J. Delta sleep-inducing peptide alters bispectral index, the electroencephalogram and heart rate variability when used as an adjunct to isoflurane anaesthesia. Eur. J. Anaesthesiol. 2009, 26, 128–134. [Google Scholar] [CrossRef] [PubMed]
- Ottoa, K.A.; Cebotarib, S.; Höfflerb, H.K.; Tudoracheb, I. Electroencephalographic Narcotrend index, spectral edge frequency and median power frequency as guide to anaesthetic depth for cardiac surgery in laboratory sheep. Vet. J. 2012, 191, 354–359. [Google Scholar] [CrossRef] [PubMed]
- Niemarkt, H.; Jennekens, J.W.; Pasman, J.W.; Katgert, T.; Pul, C.V.; Gavilanes, A.W.D.; Kramer, B.W.; Zimmermann, L.J.; Oetomo, S.B.; Andriessen, P. Maturational changes in automated EEG spectral power analysis in preterm infants. Pediatr. Res. 2011, 70, 529–534. [Google Scholar] [CrossRef] [PubMed]
- Crüts, B.; van Etten, L.; Törnqvist, H.; Blomberg, A.; Sandström, T.; Mills, N.L.; Borm, P.J.A. Exposure to diesel exhaust induces changes in EEG in human volunteers. Part. Fibre Toxicol. 2008, 5, 1–6. [Google Scholar] [CrossRef] [PubMed]
- Schultz, A.; Siedenberg, M.; Grouven, U.; Kneif, T.; Schultz, B. Comparison of narcotrend index, bispectral index, spectral and entropy parameters during induction of propofol-remifentanil anaesthesia. J. Clin. Monit. Comput. 2008, 22, 103–111. [Google Scholar] [CrossRef] [PubMed]
- Stam, C.J. Nonlinear dynamical analysis of EEG and MEG: Review of an emerging field. Clin. Neurophysiol. 2005, 116, 2266–2301. [Google Scholar] [CrossRef] [PubMed]
- Aho1, A.J.; Yli-Hankala, A.; Lyytikäinen, L.-P.; Jäntti, V. Facial muscle activity, response entropy, and state entropy indices during noxious stimuli in propofol-nitrous oxide or propofol-nitrous oxide-Remifentanil anaesthesia without neuromuscular block. Br. J. Anaesth. 2009, 102, 227–233. [Google Scholar] [CrossRef] [PubMed]
- Clanet, M.; Bonhomme, V.; Lhoest, L.; Born, J.D.; Hans, P. Unexpected entropy response to saline spraying at the end of posterior fossa surgery: A few cases report. Acta Anaesthesiol. Belg. 2011, 62, 87–90. [Google Scholar] [PubMed]
- Höcker, J.; Raitschew, B.; Meybohm, P.; Broch, O.; Stapelfeldt, C.; Gruenewald, M.; Cavus, E.; Steinfath, M.; Bein, B. Differences between bispectral index and spectral entropy during xenon anaesthesia: A comparison with propofol anaesthesia. Anaesthesia 2010, 65, 595–600. [Google Scholar] [CrossRef] [PubMed]
- Jian, X.; Wei, R.; Zhan, T.; Gu, Q. Using the concept of chous pseudo amino acid composition to predict apoptosis proteins subcellular location: An approach by approximate entropy. Protein Pept. Lett. 2008, 15, 392–396. [Google Scholar] [CrossRef]
- Ocak, H. Automatic detection of epileptic seizures in EEG using discrete wavelet transform and approximate entropy. Expert Syst. Appl. 2009, 36, 2027–2036. [Google Scholar] [CrossRef]
- Ramdania, S.; Seiglea, B.; Lagardea, J.; Boucharab, F.; Bernarda, P.L. On the use of sample entropy to analyze human postural sway data. Med. Eng. Phys. 2009, 31, 1023–1031. [Google Scholar] [CrossRef] [PubMed]
- Alcaraza, R.; Rieta, J.J. Sample entropy of the main atrial wave predicts spontaneous termination of paroxysmal atrial fibrillation. Med. Eng. Phys. 2009, 31, 917–922. [Google Scholar] [CrossRef] [PubMed]
- Ramdani, S.; Bouchara, F.; Lagarde, J. Influence of noise on the sample entropy algorithm. Chaos 2009, 19, 013123. [Google Scholar] [CrossRef] [PubMed]
- Govindan, R.; Wilsona, J.; Eswaranb, H.; Loweryb, C.; Preialb, H. Revisiting sample entropy analysis. Phys. A: Stat. Mech. Appl. 2007, 376, 158–164. [Google Scholar] [CrossRef]
- Wang, H.; Zheng, W. Local temporal common spatial patterns for robust single-trial EEG classification. IEEE Trans. Neural Syst. Rehabil. Eng. 2008, 16, 131–139. [Google Scholar] [CrossRef] [PubMed]
- Huang, N.E.; Shen, Z.; Long, S.R.; Wu, M.C.; Shih, H.H.; Zheng, Q.; Yen, N.C.; Tung, C.C.; Liu, H.H. The empirical mode decomposition and Hilbert spectrum for nonlinear and nonstationary time series analysis. Proc. R. Soc. Lond. 1998, 454, 903–995. [Google Scholar] [CrossRef]
- Wu, Z.; Huang, N.E. On the filtering properties of the empirical mode decomposition. Adv. Adap. Data Anal. 2010, 2, 397–414. [Google Scholar] [CrossRef]
- Wu, Z.; Huang, N.E. Ensemble empirical mode decomposition: A noise-assisted data analysis method. Adv. Adap. Data Anal. 2009, 1, 1–41. [Google Scholar] [CrossRef]
- Rehman, N.; Mandic, D.P. Multivariate empirical mode decomposition. Proc. R. Soc. A: Math. Phys. Eng. Sci. 2010, 466, 1291–1302. [Google Scholar] [CrossRef]
- Rehman, N.; Mandic, D.P. Filter bank property of multivariate empirical mode decomposition. IEEE Trans. Signal Process. 2011, 59, 2421–2426. [Google Scholar] [CrossRef]
- Lin, C.T.; Lee, C.S.G. Neural Fuzzy Systems: A Neuro-Fuzzy Synergism to Intelligent Systems; Prentice Hall: Upper Saddle River, NJ, USA, 1996; Chapter 9; pp. 205–223. [Google Scholar]
- Barrya, R.J.; Clarkea, A.R.; Johnstonea, S.J.; McCarthyb, R.; Selikowitzb, M. Electroencephalogram θ/β ratio and arousal in attention-deficit/hyperactivity disorder: Evidence of independent processes. Biol. Psychiatry 2009, 31, 398–401. [Google Scholar] [CrossRef] [PubMed]
- Cook, N.R. Statistical evaluation of prognostic versus diagnostic models: beyond the roc curve. Clin. Chem. 2008, 54, 17–23. [Google Scholar] [CrossRef] [PubMed]
- Pencina, M.J.; D’Agostino, R.B.; Vasan, R.S. Evaluating the added predictive ability of a new marker: From area under the ROC curve to reclassification and beyond. Stat. Med. 2008, 27, 157–172. [Google Scholar] [CrossRef] [PubMed]
- Yeh, J.R.; Shieh, J.S.; Huang, N.E. Complementary ensemble empirical mode decomposition: A novel noise enhanced data analysis method. Adv. Adapt. Data Anal. 2010, 2, 135–156. [Google Scholar] [CrossRef]
- Fleureau, J.; Kachenoura, A.; Nunes, J.C.; Albera, L.; Senhadji, L. Multivariate empirical mode decomposition and application to multichannel filtering. Signal Process. 2011, 91, 2783–2792. [Google Scholar] [CrossRef]
- Fleureau, J.; Nunes, J.C.; Kachenoura, A.; Albera, L.; Senhadji, L. Turning tangent empirical mode decomposition: A framework for mono and multivariate signals. IEEE Trans. Signal Process. 2011, 59, 1309–1316. [Google Scholar] [CrossRef] [PubMed]
- Lee, P.L.; Hsieh, J.C.; Wu, C.H.; Shyu, K.K.; Chen, S.S.; Yeh, T.C.; Wu, Y.T. The brain computer interface using flash visual evoked potential and independent component analysis. Ann. Biomed. Eng. 2006, 34, 1641–1654. [Google Scholar] [CrossRef] [PubMed]
- Li, L.; Chen, J.-H. Emotion Recognition Using Physiological Signals from Multiple Subjects. In Proceedings of International Conference on Intelligent Information Hiding and Multimedia Signal Processing (IIH-MSP’06), Pasadena, CA, USA, 18–20 December 2006; pp. 355–358.
- Barr, G.; Anderson, R.E.; Öwall, A.; Jakobsson, J.G. Being awake intermittently during propofol-induced hypnosis: A study of BIS, explicit and implicit memory. Acta Anaesthesiol. Scand. 2001, 45, 834–838. [Google Scholar] [CrossRef] [PubMed]
© 2013 by the authors; licensee MDPI, Basel, Switzerland. This article is an open access article distributed under the terms and conditions of the Creative Commons Attribution license (http://creativecommons.org/licenses/by/3.0/).
Share and Cite
Huang, J.-R.; Fan, S.-Z.; Abbod, M.F.; Jen, K.-K.; Wu, J.-F.; Shieh, J.-S. Application of Multivariate Empirical Mode Decomposition and Sample Entropy in EEG Signals via Artificial Neural Networks for Interpreting Depth of Anesthesia. Entropy 2013, 15, 3325-3339. https://doi.org/10.3390/e15093325
Huang J-R, Fan S-Z, Abbod MF, Jen K-K, Wu J-F, Shieh J-S. Application of Multivariate Empirical Mode Decomposition and Sample Entropy in EEG Signals via Artificial Neural Networks for Interpreting Depth of Anesthesia. Entropy. 2013; 15(9):3325-3339. https://doi.org/10.3390/e15093325
Chicago/Turabian StyleHuang, Jeng-Rung, Shou-Zen Fan, Maysam F. Abbod, Kuo-Kuang Jen, Jeng-Fu Wu, and Jiann-Shing Shieh. 2013. "Application of Multivariate Empirical Mode Decomposition and Sample Entropy in EEG Signals via Artificial Neural Networks for Interpreting Depth of Anesthesia" Entropy 15, no. 9: 3325-3339. https://doi.org/10.3390/e15093325
APA StyleHuang, J.-R., Fan, S.-Z., Abbod, M. F., Jen, K.-K., Wu, J.-F., & Shieh, J.-S. (2013). Application of Multivariate Empirical Mode Decomposition and Sample Entropy in EEG Signals via Artificial Neural Networks for Interpreting Depth of Anesthesia. Entropy, 15(9), 3325-3339. https://doi.org/10.3390/e15093325


