Abstract
One of the most important factors determining a significant reduction in optical devices’ efficiency is the accumulation of soiling substances such as dust, which, especially in solar power plants, implies higher costs and materials ageing. The use of superhydrophobic (SH) coatings, water contact angle (CA) greater than 150°, represents a suitable solution to improve the self-cleaning action while at the same time providing high transmittance for energy conversion. A mixed organic–inorganic SH coating with surface roughness below 100 nm was prepared by an easily scalable spray method and employed, allowing us to modulate the covered area and transparency. The coating has been also investigated while simulating pollution agents like acid rain, harsh environments, and the impact of continuous water droplets and dust particles with different physicochemical properties. The spray coating method allows us to obtain a modulated SH and self-cleaning surface showing CA > 170°, high transmittance in UV-Vis range and the ability to completely restore its initial properties in terms of wettability and transmittance after durability and soiling tests.
1. Introduction
Among those devices requiring a stable and linear response to light absorption over time, optical sensors, solar modules and greenhouse panes, to name but a few, are subject to numerous factors reducing their performance. In the photovoltaic field this problem is particularly relevant due to its increasing role as an energy source: in addition to the endogenous phenomena of the module (i.e., decrease in cell efficiency, electrical contacts oxidation, reflectance increase in the receiving surfaces), other phenomena can affect the front layer of the glass, e.g.,: (a) progressive dirtying of the glass by the deposition of fine particles [,]; (b) deposition of liquid or solid organic components []; (c) dew formation [,].
Despite the fact that solar power currently represents the foremost important renewable energy source, because of its ecocompatibility and industrial growth [], its technology design and time performance still need to be improved to achieve comparable conversion efficiency to standard energy sources [].
In more detail, one of the key features affecting the lifetime of a solar module is the ageing of glass cover transparency, with a decrease in its transmittance especially considering its exposure and the action of environmental agents determining a significant decrease in electrical production [,].
More specifically, pollution (e.g., dust in urban spaces and sands in the desert or marine environments) accumulate on the module’s surface with consequent and consistent loss of the incident light by reflection, but also by dispersion or absorption []. Up to now, the strategies for particulate removal have required active intervention such as simple washing or rinsing, resulting in high management costs and long operational times [,,]. Furthermore, acid rain represents a pollution agent degrading materials exposed in the environment [,] which could be a contributing factor in the partial loss of the mechanical and structural properties [] of the modules.
Due to the established relationship between the pollution/environmental soiling of a solar module and the decrease in its efficiency, thereby lowering the electrical output and incurring significant increase of maintenance costs, the application of coatings with highly water repellent and self-cleaning properties is increasingly required by solar energy companies.
Self-cleaning ability can be found in coatings with superhydrophobic (SH) behaviour according to the Cassie–Baxter wettability model. This model well interpreted the high water repellence of a surface by considering it as being composed of small pillars and air pockets [] such as a “fakir carpet” []. Due to its micro-nano-roughness and low surface energy, a superhydrophobic surface (SHS) has the intrinsic feature of exhibiting a contact angle (CA) with water higher than 150° and a hysteresis (CAH) lower than 5° []. In this case, the water droplets are not able to wet the surface but can bounce and move on it, removing dust and dirt particles and showing the self-cleaning effect [].
While superhydrophobicity could be an interesting new feature, transparency, measured by the transmittance (T), is instead a fundamental feature for solar panels and, in the literature, most of the works report about the preparation of opaque SHS, with only a few of them being transparent []. In fact, the main issue is the light scattering increasing with the surface roughness that, for a good transparency, needs to be preferably smaller than 100 nm, otherwise the surface becomes translucent and the coexistence of these two features is then challenging because they are based on competitive properties [,,].
Glasses coated with hydrophobic and hydrophilic nanostructures have been prepared in [] on larger surfaces for solar modules by using soft and colloidal lithography. In this easy and low-cost method, the authors investigate nanopatterns (wires and cones) at different degrees of order, observing higher transmittance (wavelength range of 400–800 nm T about 91%) and hydrorepellence (CA = 91.3°) in more ordered structures while, by increasing disorder, hydrophilicity was improved with superior antifog potential.
To overcome maintenance requirements and costs due to soiling by dust and pollution, Polizos et al. in [] were able to obtain (by spray coating a transparent and SH coating) CA = 163° and transmittance in the range 400 nm–800 nm between 90% and 80%, using fluorinated hydrophobic silica nanoparticles and Cerakote as a binder. The surface energy and adhesion decreased the wettability, increasing the removability of the soil, while the dispersion composition (polymer and silica) seemed to play a role in influencing the water contact angle.
Gao et al. in [] reported a method where SHS was prepared by the spray coating of stearic acid (STA) and silica nanoparticles modified by fluorosilane. Superhydrophobicity, CA = 160 ± 1° was obtained after thermal treatment at 150 °C for 5 h of the hydrophobic sprayed coating. The SH coating presented in the UV–Vis range (350–750 nm) T = 60% at 500 nm and less than 80% at 750 nm. The authors also performed tests against solutions with different pH and water droplet impact tests (1200 drops). Additionally, in [] the authors prepared SH transparent coating by spraying Polydimethylsiloxane (PDMS) oil on a hot glass substrate heated at 550 °C. The prepared surface showed CA of about 159° and, at the λ = 400 nm, transmittance of 84.9%. The surface’s mechanical durability was tested by drop impact, but the SH coatings were not able to withstand 10,000 water droplet impacts with velocity = 0.44 ms−1.
Suitable for flexible displays and solar cells, silica coated zinc oxide nanorods were prepared by magnetron sputtering and hydrothermal grow in [], both on glass and thin PET (polyethylene terephthalate) sheets showing high transparency (93%–95% across the visible region) and SH properties (CA = 157°).
In ref. [], Gwon et al. deposited fluorite nanograss layers by vapour deposition on glass surfaces, producing a coating with SH and self-cleaning properties with antireflective potential.
A porous amorphous network composed of nanoflakes of transparent SH alumina was also employed in [] for applications to module cover glass. The SHS was prepared by spin coating followed by different thermal treatments and, to reach high CA, the substrate was modified with fluorosilane and further heat treated. The prepared coatings had a recovery capability of up to 91%, showing self-cleaning potential, anti-reflective and high transmittance properties.
Spin coating of a mixture of dual-sized silica particles and epoxy resin was used by Zhao et al. [] to obtain a superhydrophobic coating with CA of 162° after vapor deposition of 1H,1H,2H,2H-perfluorooctyl-trichlorosilane (PFTS). SH film shows a hierarchical uniform distributed structure, resistance at 30 min of droplets’ impact and tape peeling test and transmittance of about 80% at 550 nm.
The layer-by-layer (LbL) assembly technique was used to prepare poly(diallyldimethylammonium chloride) (PDDA)/20 nm SiO2 nanoparticles (S-20) multilayer coating with anti-reflective (AR) properties [], resulting in a porous highly AR and hydrorepellent coating, CA = 135°, deposited on glass followed by calcination and hydrophobic modification, with a high transmittance compared with the glass itself and an improvement of the short-circuit current of the solar cells by as much as 6.6% in comparison with glass substrates without coatings. A two week outdoor test was performed on the SH coating, after which it was found that the coating lost its superhydrophobicity and transparency.
In ref. [], Vüllers et al. worked on the fabrication of a polymeric film with a particular surface morphology obtained by the hot embossing of fluorinated ethylene propylene (FEP) film with a disordered micro cavity array able to show self-cleaning behaviour.
In addition, the study investigated the influence of module inclination angle and soiling dust size distribution during the impact of water droplets with a small but significant increase of electrical output as compared with the uncoated panels.
The effect of inclination on dust accumulation and transmittance was investigated in [] where glass plates were exposed for quite a long time (1 year) in a desert environment. The work put in evidence the environmental role in setting the cleaning maintenance routines from moderately dusty places (weekly) to a timely, quick intervention in case of desert storms to regain the nominal operating efficiency.
Despite the key role of these properties, matching transparency and self-cleaning is still a challenging task.
In the present work, superhydrophobic mixed organic–inorganic coatings with high transmittance by spray technique were prepared on glass surfaces. The procedure design allows the possibility to control the surface properties, starting from the dispersion formulation defining the necessary conditions (particle concentration and size distribution, numbers of layers) to provide the required surface properties. The self-cleaning action allows the pollutants’ removal and quantitatively recovering the optical properties also after durability test with simulated acid rain (SAR), concentrated strong acid and base as harsh environments and after continuous water droplet impact. High water repellence and light transmittances have been also investigated as a function of specific surface parameters coming from surface analysis and related to the percentage of covered area.
2. Materials and Methods
2.1. Materials and Surface Preparation
The SH surfaces were prepared starting from a dispersion of fumed silica nanoparticles (EVONIK HDK H15) in a commercially available fluoropolymer blend, solution of a fluorosilane polymer (0.1 wt.%) carried in a hydrofluoroether solvent, methoxy-nonafluorobutane. To study the stability and the polydispersity of the silica/fluoropolymer dispersion, before its use for the coating preparation, Dynamic Light Scattering (DLS), (Malvern Zetasizer Nano ZS, Malvern, UK) measurements were performed. In this study, the coating was applied directly on a soda-lime glass substrate (size 25 mm × 40 mm), by spraying dispersion of silica particles/fluorinated polymer in different concentrations (0.5, 1, 2 g/L) using a commercial airbrush. Similar techniques and application mechanism have been used by some authors in application to cultural heritage [,] and technological fields [,]. The glass was previously cleaned with sulfuric acid and degreased with isopropanol under sonication (10 min) to remove organic residuals. The coating was prepared using a constant distance between surface and airbrush, a pressure of 3 bar and different layer cycles (1–10) were performed. The coatings show a material quantity ranging from 0.002–0.011 mg/cm2 for samples with 22% and 84% covered area, respectively. The glass coated samples were dried at room temperature and no thermal treatments were necessary to obtain the SH coating. The evaporation of the solvent and the film formation develop in a short enough time scale to not allow the particles to undergo further aggregation process, keeping the size distribution as detected from DLS measurements in the dispersion phase.
2.2. Characterisation
2.2.1. Contact Angle Measurements
To evaluate the wetting properties of the prepared surfaces, contact angle (CA) measurements were carried out by the ASTRA view tensiometer (developed at CNR-ICMATE []) at room temperature using high purity grade water, produced by a MilliQ (Milli-Pore, Burlington, MA, USA) ion-exchange purifier with a microfiltration stage.
2.2.2. Surface Characterization
In order to check the homogeneous deposition of the film, CA data were collected in at least 3 different positions of the surface. The samples’ surface structures were investigated by 3D Confocal and Interferometric Profilometry (Sensofar S-NEOX, Barcelona, Spain), in order to evaluate the roughness and to acquire confocal images. This kind of profilometry technique allows large surfaces to be scanned, with respect to AFM, and for its easy, fast and non-destructive use. The surface characterization was performed according to the standard ISO 25178 []. In particular, surface roughness (Sa), an amplitude parameter, and Summit density (Sds), were investigated and evaluated. Sa is one of the most widely used parameters; it is defined as the mean of the average height difference for the average plane, , and it is given in nm or μm. Despite the fact that Sds is not a very used parameter, it is suitable for studying the contact between two objects and it represents the number of peaks per unit area, . Only peaks that exceed a fixed size are counted; generally it is determined to be 5% of the maximum height of the surface (Sz).
2.2.3. Self-Cleaning and Durability Test
Self-cleaning ability on clean and dirt SH samples was studied by observing the impact of water droplets bouncing using a high-speed camera at 3500 fps (Sprinter HD, Optronis, Kehl, Germany). To produce water droplets of about 5 mm3 a stainless-steel capillary, with a diameter of 0.21 mm, was connected to a syringe from a height of 20 mm (tip to the surface). Two powders with a different dimensions, carbon black (CB) (100 nm) and alumina (10 µm) powders were used to simulate environmental pollution: they were firstly gently dispersed on the sample and then the powder excess was removed by shaking, leaving a thin layer up to a constant weight.
Raining test was performed to study the resistance under continuous water droplet impact, as may occur during rain. Few data in the literature [,,,] report similar approaches without following a specific standard; therefore, we have adopted a simple and effective method to study the resistance in quasi-real conditions. The resistance of the SHS was tested by dripping water down onto the sample tilted by 5° to allow the water to roll off. The distance between the tap and the surface was 10 cm, the volume of each water droplet was about 60 μL and the dripping rate was kept at 1 droplet per second []. In this test, each drop had a low impact velocity of 1.4 ms−1. The test was 14 h long, corresponding to 50,400 drops, corresponding to about 3 L of water.
To investigate the behaviour of the coatings in real applications where the pH conditions may not be stable or may be voluntarily distant from neutrality, tests under different pH conditions were performed on the samples to simulate acid rain and harsh environments’ effects on the materials’ durability. The samples were investigated at different pH. In the literature, it was found [] that the fluoropolymer blend is stable between pH 2–12 and Si–O–Si bonds and can be hydrolysed in basic solution []; for this reason, we have investigated the range of pH 1–13. The liquids used were both pure and concentrated solutions prepared using H2SO4, HNO3, dominant contributors to the precipitation acidity [,,], and NaOH, one of the strongest bases. In particular, SAR at pH = 2, representing the highest acidity reported in the literature [,], was prepared with 1:4 ratio HNO3: H2SO4 [] considering an average acid rain pH of 4.5 [,]. Two different kinds of tests were carried out: the first was the measurements of the static contact angle of a drop of the acidic or basic solutions; the second test consisted instead in the immersion of the samples in solutions at different pH for up to 24 h [,]. For this experiment, the sample was only half immersed to maintain intact a part of the sample as a reference. The solutions’ pH values were determined by a pH metre sensION + PH31 (HACH, Loveland, CO, USA).
2.2.4. Optical Transmittance Measurements
To assess the transparency of the coated glass, optical transmittance (T) was measured using UV-VIS spectrometer (Ocean Optics Flame Spectrometer, Halma Company, Amersham, UK) at room temperature using an uncoated glass as a reference. For each sample, the transmittance data reported are the measurement’s average at 3 different points. Since our aim was to evaluate the intrinsic SHS coating transmittance behaviour, the glass substrate signal was subtracted and then the uncoated glass with T = 100% was used as reference.
2.2.5. Percentage of Covered Area Measurements
The percentage of covered area (% Cov. Area) on each SH sample, was evaluated on confocal images of the sample collected with the 3D interferometer confocal profilometer. The analysis was performed by working on the image contrast between the zones with polymer/nanoparticles aggregates and the zones with polymer only (non-detectable nanoparticles) assuming the latter as the zone at higher transmittance. Working on the greyscale a threshold (<5% for every set of measurements, 3 for each sample) was fixed and a binary image was obtained, the related histogram was calculated, and from it, based on the number of white and black pixels, the percentage of the total area covered by the nanoparticles was acquired. The analysis was performed using the ImageJ software (Version 1.53e, National Institute of Health, Bethesda, MD, USA).
3. Results and Discussion
3.1. Surface and Dispersion Characterization
To characterize the prepared samples, optical images and surface parameters such as surface roughness (Sa) are important for evaluating surface homogeneity and morphology. By the spray coating technique, SH samples with different roughness were prepared, and from the surface analysis the SH behaviour was found across a range of roughness, always under 100 nm: the increase in nanoparticle concentration results in an increased density of protrusions, leading to higher surface roughness []. Furthermore, from 3D confocal and interferometric profilometry, optical images of each sample, hydrophobic and superhydrophobic, were acquired and used for the evaluation of the percentage of the area covered by the material.
Representative 3D images and profiles of the samples with different surface roughness (Sa) and behaviour at 100× are shown in Figure 1. Sample 1a is hydrophobic (110 ± 2°) with Sa = 28 ± 2 nm, while 1b and 1c are superhydrophobic, with Sa = 52 ± 4 nm and Sa = 70 ± 2 nm, respectively. Indeed, the roughness range is quite narrow and can be regarded as a requirement to ensure high hydrophobic properties.
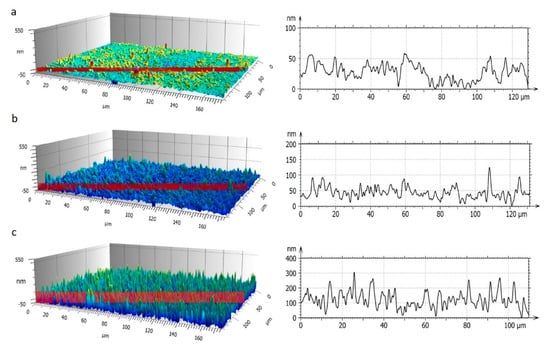
Figure 1.
3D images of samples and correlated roughness profiles acquired by 3D interferometric and confocal profilometer Sensofar S-Neox: (a) Sa = 28 ± 3 nm (1 g/L 1 layer); (b) Sa = 52 ± 4 nm (2 g/L 2 layers); (c) Sa = 70 ± 2 nm (0.5 g/L 10 layers).
In Figure 2 are reported the optical images at 100× and the corresponding binary images (details in Section 2.2.5) used to calculate the percentage of the surface area covered by nanoparticles (black), of the samples observed in Figure 1. The white areas correspond to the glass substrate covered by polymer only.
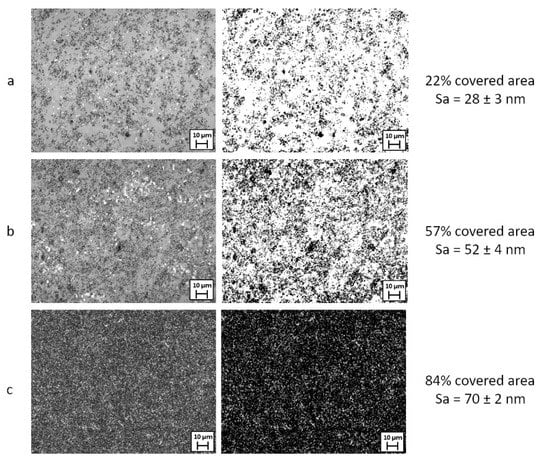
Figure 2.
Optical and corresponding binary images of hydrophobic and superhydrophobic samples acquired by 3D interferometric and confocal profilometer Sensofar S-Neox: (a) Sa = 28 ± 3 nm (1 g/L 1 layer); (b) Sa = 52 ± 4 nm (2 g/L 2 layers); (c) Sa = 70 ± 2 nm (0.5 g/L 10 layers). Reference marker 10 µm.
From the surface characterization, mainly based on profilometry data and image analysis, it is possible to observe that the prepared SH coatings have a multiscale surface roughness, Sa under 100 nm, and different percentages of area covered by silica particles.
By the same techniques, it was found that the surface roughness is correlated to the amount of covered area: samples with low Sa show the presence of an underlying glass substrate not homogeneously covered by the silica particles’ aggregates but only by the polymer matrix. The samples at higher Sa appear homogenously covered without visible substrate uncoated (polymer only) zones (Figure 2). Nevertheless, despite the presence of uncoated or partially coated zones, all samples with Sa > 50 nm show SH behaviour (see Wettability section). This fact can be explained considering that the inhomogeneously coated zones are homogeneously present and distributed on the surface of the sample (Figure 2) without affecting the coating’s hydrophobicity.
The data regarding surface roughness (Sa) as a function of the percentage of covered area were obtained from the binary images elaborated with ImageJ software (Figure 2) and are reported in Figure 3 together with the wettability data. Considering the narrow range of observed roughness data, the graph represents an almost linear trend of the sample Sa with respect to the percentage of covered area.
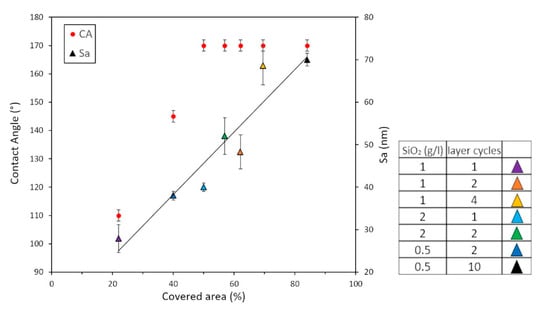
Figure 3.
CA values and surface roughness (Sa) versus the percentage of covered area. (The black line is the trend line). The legend reports the operational conditions for each sample.
From DLS measurements (see Figures S1 and S2 in Supporting Information), it was observed that the stability range of the dispersion is well below the concentration range useful to provide both a superhydrophobic effect and a high transmittance. The presence of aggregates (from a few hundreds of nanometres to about 1 µm) determines an unstable dispersion with higher polydispersity in comparison to the typical monodispersed and stable dispersion but, at the same time, this evidence could be a necessary condition to create a hierarchical roughness and the optimal surface properties required for a similar performance.
In this way, the DLS measurement supports the definition of the necessary conditions (particle concentration, size distribution) to provide required surface properties in the final sample.
3.2. Wettability
Wettability is an important surface feature for a solar panel, influencing its maintenance and efficiency. High values of the contact angle improve the surface self-cleaning ability and for assessing the hydrophobic behaviour of the prepared coating, contact angle measurements were carried out by drop shape tensiometry. The matching correlation among coverage percentage, roughness and wettability plays a key role in determining the combination of the nanostructure and low energy chemical components such as low surface energy material. Moreover, the spray application can modulate these parameters within a certain range in terms of precision and reliability. The SH behaviour was found in a range of the percentage of the covered surfaces, with the samples showing a CA ≥ 150° and CAH < 5° at percentage of covered area ≥50%. Below this value, the samples did not show SH, but only hydrophobic behaviour, as shown in Figure 3.
In the natural environment, the self-cleaning effect on the solar panel is due, to a greater extent, to rain. A high-speed camera was used to capture water impact and bouncing on a clean and dirty SH surface, percentage of covered area ≥50%, at room temperature in order to observe in detail the impact dynamics of a water droplet on a SH surface.
To appreciate the drop bouncing and its volume evolution, the drop was released from the height of 20 mm onto surfaces with different tilt angles: 180°, flat surface, and for the cleaning test the tilt angle was 30°. The choice of 30° is due to that it is one of the optimal tilt angles for solar panels in central Europe []. On a SH surface at 180°, water can bounce 12–17 times before rolling off the surface. To evaluate the self-cleaning coating behaviour, the samples were homogeneously covered with carbon and alumina powders due to their different particle dimensions and properties (Al2O3 hydrophilic, CB hydrophobic). In Figure 4 we report the slow-motion time-lapse frame sequence of a water droplet during impact with a clean surface at 180° (Figure 4a) and at 30° (Figure 4b). In Figure 5 it is possible to observe the impact of water droplets on surfaces covered by carbon and alumina powders: the dust was removed and kept by the drop (Figure 5b) leaving the surface clean without residue.
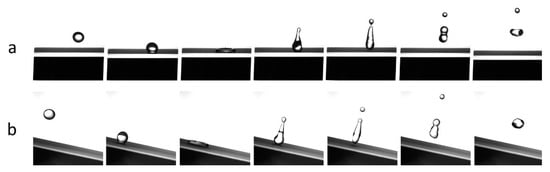
Figure 4.
Slow motion sequence acquired by the high-speed camera at 3500 fps (Sprinter HD, Optronis) of water droplet impact with clean SH coating. (a) Flat plane (180°), (b) 30° tilted surface. Spherical drop diameter about 2 mm.
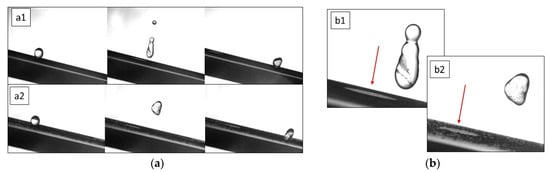
Figure 5.
Snapshot acquired by the high-speed camera at 3500 fps (Sprinter HD, Optronis). (a) Drop impact on SHS tilted surface covered by CB (a1) and Al2O3 powders (a2), (b) detail from the second frame of a1 and a2 in which is possible to observe (red arrow) the dust’s removal by the water droplet after impact on SH sample covered with CB (b1) and Al2O3 powder (b2). Collected dust particles are visible in the droplet volume.
Measuring the average contact time during the first bounce on tilted surfaces, a slight decrease was observed (clean 82.5 ms, CB 81.9 ms, Al2O3 77.9 ms), which could be associated with the different mechanical response induced by the presence of the powders in terms of stiffness and granulometry and not dependent on the coating roughness, Sa, in the range 60 nm–100 nm. This point represents only a preliminary result and it is still under investigation.
To assess the role and effect of the underlying coating, bouncing and self-cleaning experiments, at 30° and 180° tilt, on uncoated glass substrates were also performed. On the flat and tilted surface, the water droplets impact and stick to the glass, proving its wettability and lack of self-cleaning effect.
The observed trend in the roughness range of the samples shows the relationship between the Sds and the high hydrophobicity considering the “fakir carpet” structure. Figure 6 reports the number of times the water droplet bounces on the flat SH surface versus Sds. Moreover, the narrow range limitation is due to the high sensitivity of transmittance to the surface coverage. The system shows a linear trend in the number of bounces as a function of Sds, in particular, at lower Sds values, this number is greater than at higher values.
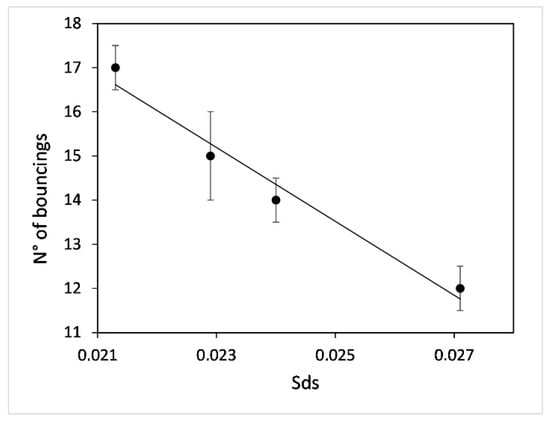
Figure 6.
Number of bounces on SH surfaces as a function of the surface parameter, Sds. (The black line is a trend line).
At higher Sds values, the considered area shows more peaks with respect to samples with lower Sds and this information could be assimilated with the pitch between peaks. When Sds increases, the peaks become closer to each other resulting, in a smoother surface with a decrease in its superhydrophobic properties (lower number of bounces). This behaviour is consistent with the data present in the literature [,] regarding pitch between pillars and wettability where both superhydrophobicity and bouncing are observed only in a range of pitches. Smaller or larger pitch values between the pillars lead to the non-rebound condition, while an intermediate pitch leads to the rebound condition.
In general, the Sds parameter is relative to the system and not absolute: Sds could not give an absolute value that can describe all kinds of SHS but can describe the trend for a particular system.
3.3. Transmittance
The transparency of the spray-coated coating was evaluated measuring the transmittance in the range UV-Vis between 350 nm and 750 nm in transmission mode.
Figure 7 shows the UV-Vis transmittance on some SH samples with different surface coverage, on bare glass (used as a reference) and on a glass sample coated with fluoropolymer only. Specifically, as an example, the data of the samples with the highest and the lowest percentage of surface area covered are reported.
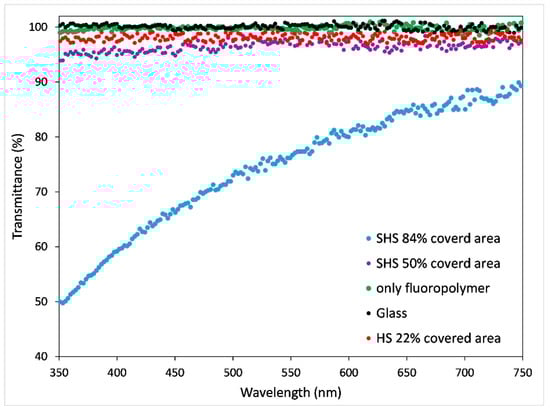
Figure 7.
Optical transmittance as a function of wavelength (nm) for bare glass and fluoropolymer coated glass, as a reference, and coated SH and hydrophobic samples with different percentages of covered area by nanoparticles. Red dots (1 g/L 1 layer), purple (2 g/L 1 layer), blue (0.5 g/L 10 layers).
The transmittance of the coating is connected to the amount of area covered by the particles. In particular, in the range of the study (350 nm–750 nm), the glass covered with the fluoropolymer blend only (thickness 5–10 nm, refractive index 1.53, green dots) has an absorption comparable to the reference uncoated glass (black dots) showing T = 100%. The orange and the blue dots represent the maximum and the minimum transmittance, respectively, showing superhydrophobic behaviour at different covered areas. The red dots represent the signal of the only hydrophobic sample and, due to the lowest covered area (22%), with the highest transmittance observed. In Figure 8 the transmittance data of SH samples acquired at the wavelength of 350 nm as a function of the percentage of covered area are reported, where, due to coating morphology, absorbance phenomena are enhanced. The SH samples reported in the graph show instead different values depending on the preparation conditions (concentration of starting solution and number of layers), which significantly affect the amount of covered area; in particular the highest transmittance, 94%, corresponds to the sample with the lowest percentage of covered area (50%).
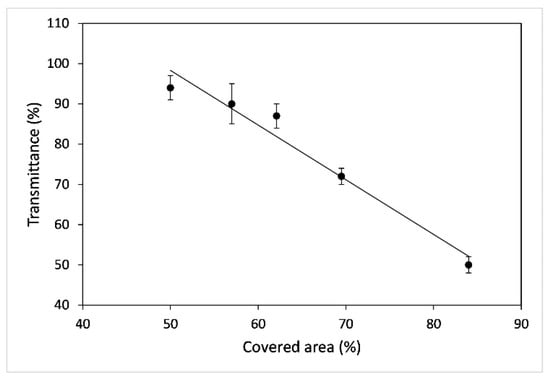
Figure 8.
Transmittance % as a function of the % of covered area for superhydrophobic samples. Data acquired at the wavelength of 350 nm. (The black line is a trend line).
At low percentage of covered area, the presence of small aggregates of silica particles (observable from profiles in Figure 1 acquired by profilometry) and the homogeneous presence of the surface uncoated by silica, allow the light radiation to cross the coated glass substrate with respect to the SH samples with higher amount of covered area that show condensed silica aggregates.
Furthermore, the SH coatings completely recover the transparency by water cleaning after contamination with the alumina and carbon powders. In Figure 9 the tests on SHS sample with T = 90%, Sa = 52 nm and 57% of covered area (2 g/L 2 layer cycles) are reported. In particular, the thin layer of carbon black powder and alumina deposited on the SH samples correspond to 0.04 mg/cm2 and 0.33 mg/cm2.
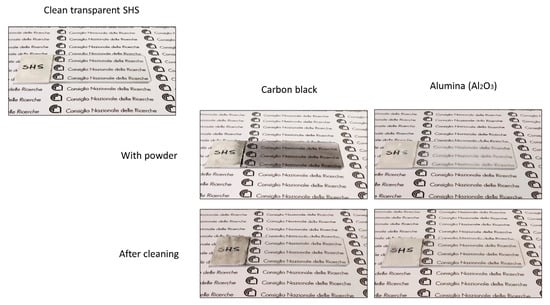
Figure 9.
Self-cleaning effect on SH coating. On the right the clean SH coating, on the left the coating after dirtying with carbon black and alumina and below after cleaning with water.
In Figure 10 the transmittance data of the clean SH coating before the application of carbon black and alumina layer are reported, along with the layers of powders before and after cleaning. Despite the smallest quantity of powders being deposited on the surface [], the transmittance showed a significant decrease of almost 40%. Due to the roughness hierarchical features, even the smaller CB particles do not enter the surface grooves, allowing a quantitative removal. In fact, compared to the dirty sample, transmittance after cleaning is the same as before the carbon black and alumina powders’ deposition in the same wavelength range.
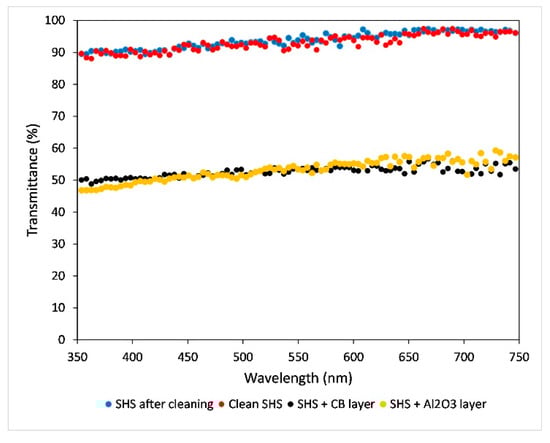
Figure 10.
Transmittance spectra of same coating of Figure 9: clean (red dots), dirtied with CB and Al2O3 (black and yellow dots) and coating after cleaning (blue dots).
3.4. Durability
In order to evaluate the resistance of the coating in aggressive conditions, the samples were tested with acidic and basic solutions. Two experiments were performed: the first one was the measure of the CA of a drop of acidic or basic solution on the SH coating; the second one was the immersion of the coated samples in acidic or basic solutions for a prolonged time. The first experiment showed that the coating maintains its superhydrophobicity for each tested pH during the contact of the drop and after its removal. In particular, the measured CA was the same as before the pH test (CA > 170°) and was constant in the whole studied pH range. The surface analysis, performed with a 3D profilometer, confirmed that no change in roughness occurred.
The second pH test consisted of an immersion, for at least 24 h, in a solution at different pH. It was found that, in the range of pH 1–13, the coating was always stable and maintained its superhydrophobicity. In particular, the surface did not require washing, after immersion in aggressive solutions, to recover its special wettability. After each immersion, the samples were observed with a 3D profilometer to evidence roughness alterations by the aggressive solutions. Over pH 13 the sample completely lost its SH behaviour, appearing without a coating, as reported in Figure 11. Probably, the immersion in a harsh solution of pH > 13 induced bond breakage of the C-F chains and Si-O-Si hydroxylation, thereby increasing the surface tension of the surface [].
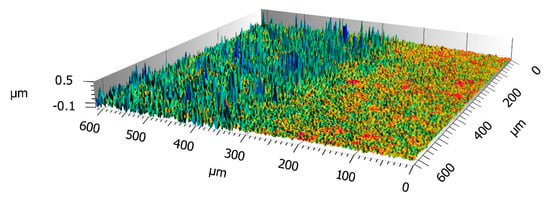
Figure 11.
3D images of SH sample (T = 90%, Sa = 52 nm and 57% Cov. Area as Figure 9) immersed at pH > 13. The right side of the image is the part of the sample immersed into basic solution.
Except for pH > 13, superhydrophobicity was kept and also, the roughness of the immersed part kept the same value as the non-immersed sample used as a reference.
In order to evaluate the robustness of our superhydrophobic films, drop impact experiments and raining tests were carried out on these surfaces. During the 14 h test (about 50,400 drops), water droplets always bounced and rolled off the surface. After 14 h, the coating continued to exhibit its special wettability, and yet the surface roughness was not altered in the drop impact area. The coating resistance allowed it to bear the mechanical stress produced by the water droplets’ impact in the tested conditions, without material loss.
On all SH samples, the transmittance was measured after each durability test. It was found that optical properties were maintained under all the tested conditions except over pH > 13, as reported in Figure 12 (sample with T = 90%, Sa = 52 nm and 57% covered area). Over this point the sample lost the SH coating and the transmittance approached that of the glass reference substrate.
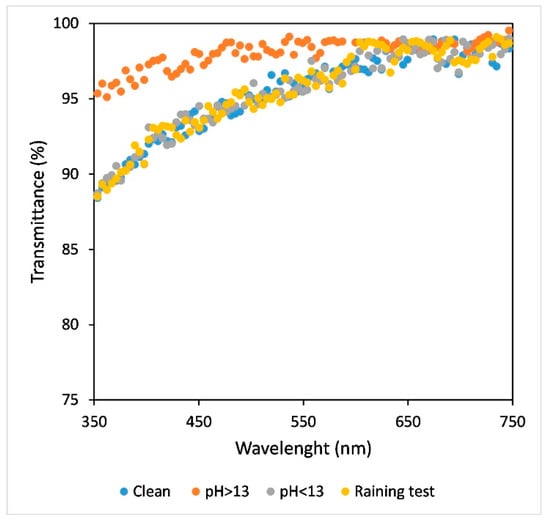
Figure 12.
Transmittance spectra of clean SH coating as Figure 9 (blue dots) and SH coating after durability test: raining test (yellow dots), 24 h of immersion in solution with pH < 13 (grey dots) and pH > 13 (orange dots).
4. Conclusions
A SH coating with CA > 170° and high transmittance containing a silica and fluoropolymer blend, with surface roughness below 100 nm, was prepared by an easy and scalable spray method, allowing us to modulate covered area and transparency.
The self-cleaning coating durability was successfully tested under simulated conditions with pollution agents like acid rain, harsh environments, continuous water droplets’ impact and dust particles with different physicochemical properties.
Surface morphology, wettability and transmittance were maintained except in extreme basic pH conditions.
In this study transparent, durable and SH coatings were effectively deposited by spray coating technique at room temperature starting from silica nanoparticles/fluoropolymer blend dispersion without the need for subsequent heat treatment or chemical functionalisation. This technique is low-cost and allows large areas to be covered and maintained over time, controlling the surface properties starting from the dispersion formulation and defining the necessary conditions (particle concentration and size distribution, numbers of layers) to provide the required surface features. By this method, SH coatings (CA > 170°) with Sa < 100 nm have been prepared by modulating the percentage of covered area, achieving different levels of transparency of the SH coated glass, from 60% up to 94% at 350 nm, growing towards 750 nm depending on the amount of covered area. These coatings also show the ability to repel water droplets without sticking but rolling off the surface with self-cleaning behaviour against dust of different size and properties, such as carbon black and alumina powder as model particles. Furthermore, the produced SHS can resist up to 14 h of water droplet impact and is resistant to immersion in aggressive solutions (pH 1 and 12) for 24 h.
Many papers in the literature [] report the preparation of transparent and also superhydrophobic surfaces by the use of different techniques including soft and colloidal lithography, spray coating, vapor deposition, magnetron sputtering, spin coating, Layer-by-Layer and hot embossing. In some works, [,] very high transmittance surfaces have been prepared but without superhydrophobic behaviour.
Spray coating is a widely used technique thanks to its ease of use to produce coatings with CA > 160° and, in some cases, good durability but with different drawbacks: low transmittance [], use of high temperature [,], or with high CAH that could make self-cleaning less efficient [].
On the other hand, performant SH coating with T > 90% can be found in the literature but their employment is limited due to their complex preparation methods [,,].
Our novel spray coated SH coating provides a highly transparent and robust solution with respect to the existing solution applied by this technique.
The SH coating developed in this paper, thanks to its easy/fast production and surface properties, could be employed for larger plants allowing a reduction in maintenance costs and an optimization of their yield over time. Furthermore, the developed preparation technology proposed has no limitation regarding the materials used as substrates thanks to the application at room temperature and the absence of organic solvents.
Supplementary Materials
The following are available online at https://www.mdpi.com/article/10.3390/coatings11050493/s1, Figure S1. DLS measurements of 0.5 g/L dispersion, Figure S2. DLS measurements of 2 g/L dispersion.
Author Contributions
Conceptualization, methodology, funding acquisition, M.F.; data analysis, M.F. and F.C.; investigation, F.C.; writing original draft, M.F. and F.C.; writing—review and editing, M.F., F.C., P.P. and J.V. All authors have read and agreed to the published version of the manuscript.
Funding
This research was funded by the Fondazione Bancaria Compagnia di San Paolo, Turin, ID ROL 20718, the Project ANFISOL-Design and the development of superamphiphobic coatings with self-cleaning properties for photovoltaic panels.
Institutional Review Board Statement
Not applicable.
Informed Consent Statement
Not applicable.
Acknowledgments
The authors acknowledge the support of Fondazione Bancaria Compagnia di San Paolo, Turin. This work has been performed within the framework of the Project ANFISOL Design and development of superamphiphobic coatings with self-cleaning properties for photovoltaic panels (ID ROL 20718) funded by the Fondazione Bancaria Compagnia di San Paolo, Turin.
Conflicts of Interest
The authors declare no conflict of interest.
References
- Cristaldi, L.; Faifer, M.; Rossi, M.; Toscani, S.; Catelani, M.; Ciani, L.; Lazzaroni, M. Simplified method for evaluating the effects of dust and aging on photovoltaic panels. Measurments 2014, 54, 207–214. [Google Scholar] [CrossRef]
- Silvestre, S.; Kichou, S.; Guglielminotti, L.; Nofuentes, G.; Alonso-Abella, M. Degradation analysis of thin film photovoltaic modules under outdoor long term exposure in Spanish continental climate conditions. Sol. Energy 2016, 139, 599–607. [Google Scholar] [CrossRef]
- Sisodia, A.K.; Mathur, R.K. Impact of bird dropping deposition on solar photovoltaic module performance: A systematic study in Western Rajasthan. Env. Sci. Pollut. Res. 2019, 26, 31119–31132. [Google Scholar] [CrossRef] [PubMed]
- Ilse, K.; Figgis, B.; Khan, M.Z.; Naumann, V.; Hagendorf, C. Dew as a Detrimental Influencing Factor for Soiling of PV Modules. IEEE J. Photovolt. 2018, 9, 287–294. [Google Scholar] [CrossRef]
- Nayshevsky, I.; Xu, Q.F.; Barahman, G.; Lyons, A.M. Fluoropolymer coatings for solar cover glass: Anti-soiling mechanisms in the presence of dew. Sol. Energy Mater. Sol. Cells 2020, 206. [Google Scholar] [CrossRef]
- Ghosh, T.K.; Prelas, M.A. Energy Resources and Systems; J.B. Metzler: Stuttgart, Germany, 2011; Volume 2. [Google Scholar]
- Grossmann, W.D.; Steininger, K.W.; Schmid, C.; Grossmann, I. Investment and employment from large-scale photovoltaics up to 2050. Empirica 2012, 39, 165–189. [Google Scholar] [CrossRef]
- Senthil, S.; Ravi, K.R.; Raj, B.; Biji, P. Self-Cleaning Coating for Solar Panel Applications. In The Masterbuilder; K.P. Pradeep: Chennai, India, 2017; pp. 1–11. [Google Scholar]
- Jamil, W.J.; Rahman, H.A.; Shaari, S.; Salam, Z. Performance degradation of photovoltaic power system: Review on mitigation methods. Renew. Sustain. Energy Rev. 2017, 67, 876–891. [Google Scholar] [CrossRef]
- Zaihidee, F.M.; Mekhilef, S.; Seyedmahmoudian, M.; Horan, B. Dust as an unalterable deteriorative factor affecting PV panel’s efficiency: Why and how. Renew. Sustain. Energy Rev. 2016, 65, 1267–1278. [Google Scholar] [CrossRef]
- Jones, R.K.; Baras, A.; Al Saeeri, A.; Al Qahtani, A.; Al Amoudi, A.O.; Al Shaya, Y.; Alodan, M.; Al-Hsaien, S.A. Optimized Cleaning Cost and Schedule Based on Observed Soiling Conditions for Photovoltaic Plants in Central Saudi Arabia. IEEE J. Photovolt. 2016, 6, 730–738. [Google Scholar] [CrossRef]
- Shah, A.; Hassan, A.; Laghari, M.; Alraeesi, A. The Influence of Cleaning Frequency of Photovoltaic Modules on Power Losses in the Desert Climate. Sustainability 2020, 12. [Google Scholar] [CrossRef]
- El-Mallakh, T.V.; Gao, Y.; El-Mallakh, R.S. The effect of simulated acid rain on growth of root systems of Scindapsus aureus. Int. J. Plant. Biol. 2014, 5, 13–15. [Google Scholar] [CrossRef]
- Eyssautier-Chuine, S.; Marin, B.; Thomachot-Schneider, C.; Fronteau, G.; Schneider, A.; Gibeaux, S.; Vazquez, P. Simulation of acid rain weathering effect on natural and artificial carbonate stones. Environ. Earth Sci. 2016, 75, 1–19. [Google Scholar] [CrossRef]
- Nnadi, D.B.N. Environmental/climatic effect on stand-alone solar energy supply performance for sustainable energy. Niger. J. Technol. Copyr. C 2012, 31, 79–88. [Google Scholar]
- Cassie, A.B.D.; Baxter, S. Wettability of porous surfaces. Trans. Faraday Soc. 1944, 40, 546–551. [Google Scholar] [CrossRef]
- Quéré, D. Fakir droplets Nanoscale plasticity. Nature 2002, 1, 14–15. [Google Scholar] [CrossRef] [PubMed]
- Barthlott, W.; Neinhuis, C. Purity of the sacred lotus, or escape from contamination in biological surfaces. Planta 1997, 202, 1–8. [Google Scholar] [CrossRef]
- Ragesh, P.; Ganesh, V.A.; Nair, S.V.; Nair, A.S. A review on ‘self-cleaning and multifunctional materials’. J. Mater. Chem. A 2014, 2, 14773–14797. [Google Scholar] [CrossRef]
- Ferrari, M.; Cirisano, F. High transmittance and highly amphiphobic coatings for environmental protection of solar panels. Adv. Colloid Interface Sci. 2020, 286. [Google Scholar] [CrossRef]
- Bravo, J.; Zhai, L.; Wu, Z.; Cohen, R.E.; Rubner, M.F. Transparent Superhydrophobic Films Based on Silica Nanoparticles. Langmuir 2007, 23, 7293–7298. [Google Scholar] [CrossRef] [PubMed]
- Nakajima, A.; Hashimoto, A.K.; Watanabe, T.; Takai, K.; Yamauchi, G.; Fujishima, A. Transparent Superhydrophobic Thin Films with Self-Cleaning Properties. Langmuir 2000, 16, 7044–7047. [Google Scholar] [CrossRef]
- Cho, K.L.; Liaw, I.I.; Wu, A.H.-F.; Lamb, R.N. Influence of Roughness on a Transparent Superhydrophobic Coating. J. Phys. Chem. C 2010, 114, 11228–11233. [Google Scholar] [CrossRef]
- Baquedano, E.; Torné, L.; Caño, P.; Postigo, P.A. Increased Efficiency of Solar Cells Protected by Hydrophobic and Hydrophilic Anti-Reflecting Nanostructured Glasses. Nanomaterials 2017, 7. [Google Scholar] [CrossRef]
- Polizos, G.; Jang, G.; Smith, D.; List, F.; Lassiter, M.; Park, J.; Datskos, P. Transparent superhydrophobic surfaces using a spray coating process. Sol. Energy Mater. Sol. Cells 2018, 176, 405–410. [Google Scholar] [CrossRef]
- Gao, L.; He, J. Surface hydrophobic co-modification of hollow silica nanoparticles toward large-area transparent superhydrophobic coatings. J. Colloid Interface Sci. 2013, 396, 152–159. [Google Scholar] [CrossRef] [PubMed]
- Seo, K.; Kim, M.; Seok, S.; Kim, D.H. Transparent superhydrophobic surface by silicone oil combustion. Colloids Surf. A Phys. Eng. Asp. 2016, 492, 110–118. [Google Scholar] [CrossRef]
- Gao, Y.; Gereige, I.; El Labban, A.; Cha, D.K.; Isimjan, T.T.; Beaujuge, P.M. Highly Transparent and UV-Resistant Superhydrophobic SiO2-Coated ZnO Nanorod Arrays. ACS Appl. Mater. Interfaces 2014, 6, 2219–2223. [Google Scholar] [CrossRef]
- Gwon, H.J.; Park, Y.; Moon, C.W.; Nahm, S.; Yoon, S.-J.; Kim, S.Y.; Jang, H.W. Superhydrophobic and antireflective nanograss-coated glass for high performance solar cells. Nano Res. 2014, 7, 670–678. [Google Scholar] [CrossRef]
- Sutha, S.; Suresh, S.; Raj, B.; Ravi, K. Transparent alumina based superhydrophobic self-cleaning coatings for solar cell cover glass applications. Sol. Energy Mater. Sol. Cells 2017, 165, 128–137. [Google Scholar] [CrossRef]
- Zhao, X.; Park, D.S.; Choi, J.; Park, S.; Soper, S.A.; Murphy, M.C. Robust, transparent, superhydrophobic coatings using novel hydrophobic/hydrophilic dual-sized silica particles. J. Colloid Interface Sci. 2020, 574, 347–354. [Google Scholar] [CrossRef] [PubMed]
- Li, X.; He, J.; Liu, W. Broadband anti-reflective and water-repellent coatings on glass substrates for self-cleaning photovoltaic cells. Mater. Res. Bull. 2013, 48, 2522–2528. [Google Scholar] [CrossRef]
- Vuellers, F.; Fritz, B.; Roslizar, A.; Striegel, A.; Guttmann, M.; Richards, B.S.; Hoelscher, H.; Gomard, G.; Klampaftis, E.; Kavalenka, M.N.; et al. Self-Cleaning Microcavity Array for Photovoltaic Modules. Acs Appl. Mater. Interfaces 2018, 10, 2929–2936. [Google Scholar] [CrossRef] [PubMed]
- Hegazy, A.A. Effect of dust accumulation on solar transmittance through glass covers of plate-type collectors. Renew. Energy 2001, 22, 525–540. [Google Scholar] [CrossRef]
- Chatzigrigoriou, A.; Karapanagiotis, I.; Poulios, I. Superhydrophobic Coatings Based on Siloxane Resin and Calcium Hydroxide Nanoparticles for Marble Protection. Coatings 2020, 10. [Google Scholar] [CrossRef]
- Ntelia, E.; Karapanagiotis, I. Superhydrophobic Paraloid Bprog. Org. Coat. 2020, 139. [Google Scholar] [CrossRef]
- Lee, S.G.; Ham, D.S.; Lee, D.Y.; Bong, H.; Cho, K. Transparent Superhydrophobic/Translucent Superamphiphobic Coatings Based on Silica–Fluoropolymer Hybrid Nanoparticles. Langmuir 2013, 29, 15051–15057. [Google Scholar] [CrossRef] [PubMed]
- Zhang, Y.; Ge, D.; Yang, S. Spray-coating of superhydrophobic aluminum alloys with enhanced mechanical robustness. J. Colloid Interface Sci. 2014, 423, 101–107. [Google Scholar] [CrossRef] [PubMed]
- Liggieri, L.; Passerone, A. An automatic technique for measuring the surface tension of liquid metals. High. Temp. Technol. 1989, 7, 82–86. [Google Scholar] [CrossRef]
- ISO. ISO/PAS 19450:2015: Automation Systems and Integration—Object-Process Methodology. Available online: https://www.iso.org/obp/ui/#iso:std:iso:pas:19450:ed-1:v1:en (accessed on 12 October 2020).
- Zhuang, A.; Liao, R.; Dixon, S.C.; Lu, Y.; Sathasivam, S.; Parkin, I.P.; Carmalt, C.J. Transparent superhydrophobic PTFE films via one-step aerosol assisted chemical vapor deposition. Rsc Adv. 2017, 7, 29275–29283. [Google Scholar] [CrossRef]
- Liang, Z.; Zhou, Z.; Zhao, L.; Dong, B.; Wang, S. Fabrication of transparent, durable and self-cleaning superhydrophobic coatings for solar cells. New J. Chem. 2020, 44, 14481–14489. [Google Scholar] [CrossRef]
- Huang, W.-H.; Lin, C.-S. Robust superhydrophobic transparent coatings fabricated by a low-temperature sol–gel process. Appl. Surf. Sci. 2014, 305, 702–709. [Google Scholar] [CrossRef]
- Liu, X.; Wang, Y.; Chen, Z.; Ben, K.; Guan, Z. A self-modification approach toward transparent superhydrophobic glass for rainproofing and superhydrophobic fiberglass mesh for oil–water separation. Appl. Surf. Sci. 2016, 360, 789–797. [Google Scholar] [CrossRef]
- Xu, Q.F.; Wang, J.N.; Smith, I.H.; Sanderson, K.D. Superhydrophobic and transparent coatings based on removable polymeric spheres. J. Mater. Chem. 2008, 19, 655–660. [Google Scholar] [CrossRef]
- 3M. 3M TM Novec TM 1700 Electronic Grade Coating. Prod. Info. 2011, 3–4. [Google Scholar]
- Lin, W.; Zhang, X.; Cai, Q.; Yang, W.; Chen, H. Dehydrogenation-driven assembly of transparent and durable superhydrophobic ORMOSIL coatings on cellulose-based substrates. Cellulose 2020, 27, 7805–7821. [Google Scholar] [CrossRef]
- Chen, H.-Y.; Hsu, L.-F.; Huang, S.-Z.; Zheng, L. Assessment of the Components and Sources of Acid Deposition in Northeast Asia: A Case Study of the Coastal and Metropolitan Cities in Northern Taiwan. Atmosphere 2020, 11. [Google Scholar] [CrossRef]
- Schoepp, W.; Posch, M.; Mylona, S.; Johansson, M. Long-term development of acid deposition (1880–2030) in sensitive freshwater regions in Europe. Hydrol. Earth Syst. Sci. 2003, 7, 436–446. [Google Scholar] [CrossRef]
- Huang, D.-Y.; Xu, Y.-G.; Peng, P.; Zhang, H.-H.; Lan, J.-B. Chemical composition and seasonal variation of acid deposition in Guangzhou, South China: Comparison with precipitation in other major Chinese cities. Env. Pollut. 2009, 157, 35–41. [Google Scholar] [CrossRef] [PubMed]
- Holden, R.; Clarkson, T.S. Acid rain: A New Zealand viewpoint. J. R. Soc. N. Z. 1986, 16, 1–15. [Google Scholar] [CrossRef]
- Huang, K.; Zhuang, G.; Xu, C.; Wang, Y.; Tang, A. The chemistry of the severe acidic precipitation in Shanghai, China. Atmos. Res. 2008, 89, 149–160. [Google Scholar] [CrossRef]
- Ma, S.; Chen, W.; Zhang, J.; Shen, H. Influence of simulated acid rain on the physiological response of flowering Chinese cabbage and variation of soil nutrients. Plant. Soil Env. 2020, 66, 42–51. [Google Scholar] [CrossRef]
- Zhao, M.; Li, L.; Liu, Z.; Chen, B.; Huang, J.; Cai, J.; Deng, S. Chemical Composition and Sources of Rainwater Collected at a Semi-Rural Site in Ya’an, Southwestern China. Atmos. Clim. Sci. 2013, 3, 486–496. [Google Scholar] [CrossRef]
- Wang, L.; Yang, J.; Zhu, Y.; Li, Z.; Sheng, T.; Hu, Y.; Yang, D.-Q. A study of the mechanical and chemical durability of Ultra-Ever Dry Superhydrophobic coating on low carbon steel surface. Colloids Surf. A Phys. Eng. Asp. 2016, 497, 16–27. [Google Scholar] [CrossRef]
- Huld, T.; Šúri, M.; Dunlop, E.D. Comparison of potential solar electricity output from fixed-inclined and two-axis tracking photovoltaic modules in Europe. Prog. Photovolt. Res. Appl. 2007, 16, 47–59. [Google Scholar] [CrossRef]
- Patil, N.D.; Bhardwaj, R.; Sharma, A. Droplet impact dynamics on micropillared hydrophobic surfaces. Exp. Fluid Sci. 2016, 74, 195–206. [Google Scholar] [CrossRef]
- Ebert, D.; Bhushan, B. Durable Lotus-effect surfaces with hierarchical structure using micro- and nanosized hydrophobic silica particles. J. Colloid Interface Sci. 2012, 368, 584–591. [Google Scholar] [CrossRef] [PubMed]
Publisher’s Note: MDPI stays neutral with regard to jurisdictional claims in published maps and institutional affiliations. |
© 2021 by the authors. Licensee MDPI, Basel, Switzerland. This article is an open access article distributed under the terms and conditions of the Creative Commons Attribution (CC BY) license (https://creativecommons.org/licenses/by/4.0/).