Next Article in Journal
Design Verification of an Optimized Wayfinding Map in a Station
Next Article in Special Issue
On the Representativeness of OpenStreetMap for the Evaluation of Country Tourism Competitiveness
Previous Article in Journal
An Open Source GIS Application for Spatial Assessment of Health Care Quality Indicators
Previous Article in Special Issue
Mapping Public Urban Green Spaces Based on OpenStreetMap and Sentinel-2 Imagery Using Belief Functions
 
 
ijgi-logo
Article Menu

Article Menu

Article

Analysis of OpenStreetMap Data Quality at Different Stages of a Participatory Mapping Process: Evidence from Slums in Africa and Asia

by
Godwin Yeboah
1,*,
João Porto de Albuquerque
1,
Rafael Troilo
2,
Grant Tregonning
1,
Shanaka Perera
3,
Syed A. K. Shifat Ahmed
4,
Motunrayo Ajisola
5,
Ornob Alam
4,
Navneet Aujla
6,
Syed Iqbal Azam
7,
Kehkashan Azeem
7,
Pauline Bakibinga
8,
Yen-Fu Chen
6,
Nazratun Nayeem Choudhury
4,
Peter J. Diggle
9,
Olufunke Fayehun
10,
Paramjit Gill
6,
Frances Griffiths
6,
Bronwyn Harris
6,
Romaina Iqbal
7,
Caroline Kabaria
8,
Abdhalah Kasiira Ziraba
8,
Afreen Zaman Khan
4,
Peter Kibe
8,
Lyagamula Kisia
8,
Catherine Kyobutungi
8,
Richard J. Lilford
11,
Jason J. Madan
12,
Nelson Mbaya
8,
Blessing Mberu
8,
Shukri F. Mohamed
6,8,
Helen Muir
6,
Ahsana Nazish
7,
Anne Njeri
8,
Oladoyin Odubanjo
13,
Akinyinka Omigbodun
14,
Mary E. Osuh
15,
Eme Owoaje
16,
Oyinlola Oyebode
6,
Vangelis Pitidis
1,
Omar Rahman
17,
Narjis Rizvi
7,
Jo Sartori
11,
Simon Smith
6,
Olalekan John Taiwo
18,
Philipp Ulbrich
1,
Olalekan A. Uthman
6,
Samuel I. Watson
11,
Ria Wilson
6 and
Rita Yusuf
4
add Show full author list remove Hide full author list
1
Institute for Global Sustainable Development, University of Warwick, Coventry CV4 7AL, UK
2
Heidelberg Institute for Geoinformation Technology, Heidelberg University, 69120 Heidelberg, Germany
3
Department of Computer Science, University of Warwick, Coventry CV4 7EZ, UK
4
Centre for Health, Population and Development, Independent University Bangladesh, Dhaka 1212, Bangladesh
5
National Institute for Health Research Project, University of Ibadan, Ibadan, Oyo State 200284, Nigeria
6
Division of Health Sciences, Warwick Medical School, University of Warwick, Coventry CV4 7AL, UK
7
Community Health Sciences Department, Aga Khan University, Karachi 74800, Pakistan
8
African Population and Health Research Center, Nairobi 00100, Kenya
9
Lancaster Medical School, Lancaster University, Lancaster LA1 4YW, UK
10
Department of Sociology, Faculty of Social Sciences, University of Ibadan, Ibadan, Oyo State 200284, Nigeria
11
Institute of Applied Health Research, College of Medical and Dental Sciences, University of Birmingham, Birmingham B15 2TT, UK
12
Warwick Clinical Trials Unit, Warwick Medical School, University of Warwick, Coventry CV4 7AL, UK
13
Nigerian Academy of Science, Lagos 100213, Nigeria
14
Department of Obstetrics and Gynaecology, Faculty of Clinical Sciences, College of Medicine, University of Ibadan, Ibadan, Oyo State 200284, Nigeria
15
Department of Periodontology and Community Dentistry, Faculty of Dentistry, College of Medicine, University of Ibadan, Ibadan, Oyo State 200284, Nigeria
16
Department of Community Medicine, Faculty of Public Health, College of Medicine, University of Ibadan, Ibadan, Oyo State 200284, Nigeria
17
Department of General Education, University of Liberal Arts Bangladesh, Dhaka 1209, Bangladesh
18
Department of Geography, Faculty of Social Sciences, University of Ibadan, Ibadan, Oyo State 200284, Nigeria
*
Author to whom correspondence should be addressed.
ISPRS Int. J. Geo-Inf. 2021, 10(4), 265; https://doi.org/10.3390/ijgi10040265
Submission received: 31 January 2021 / Revised: 26 March 2021 / Accepted: 4 April 2021 / Published: 14 April 2021

Abstract

:
This paper examines OpenStreetMap data quality at different stages of a participatory mapping process in seven slums in Africa and Asia. Data were drawn from an OpenStreetMap-based participatory mapping process developed as part of a research project focusing on understanding inequalities in healthcare access of slum residents in the Global South. Descriptive statistics and qualitative analysis were employed to examine the following research question: What is the spatial data quality of collaborative remote mapping achieved by volunteer mappers in morphologically complex urban areas? Findings show that the completeness achieved by remote mapping largely depends on the morphology and characteristics of slums such as building density and rooftop architecture, varying from 84% in the best case, to zero in the most difficult site. The major scientific contribution of this study is to provide evidence on the spatial data quality of remotely mapped data through volunteer mapping efforts in morphologically complex urban areas such as slums; the results could provide insights into how much fieldwork would be needed in what level of complexity and to what extent the involvement of local volunteers in these efforts is required.

1. Introduction

Slums, which are areas deprived of durable housing, acceptable sanitation, and safe water as well as characterized by insecure land tenure and overcrowding generally, hold about one-quarter of the world’s urban population [1]. Slum neighborhoods are frequently characterized by a complex morphology of their physical characteristics [2], which include the geometry of buildings and routes, density, and roofing material, among others [3,4]. In recent years, the lack of high-quality spatial data of slums has received renewed socio-political and academic interest [3,5,6]. One potential data source for making spatial data available is Volunteered Geographic Information (VGI), which is opening up new possibilities of data production in recent years and facilitating the emergence of a global humanitarian mapping community [7] with several initiatives aimed at “putting the most vulnerable people on the map” [8]. A key concern that arises from the use of volunteered and crowdsourced geographic information to map vulnerable areas is related to the quality of the data generated by non-experts. This has led to a plethora of scientific studies for evaluating the quality of data in crowdsourced platforms such as OpenStreetMap (OSM) [9,10,11,12,13,14,15,16,17,18,19]. The overall goal of the OSM project is aimed at the creation of a free to use, and editable, world map according to the OSM Foundation (OSMF) board which exists to protect the project [20]. Recent studies have investigated OSM data quality without using any external data; the so-called intrinsic approach [9,10]. In contrast to the intrinsic approach, other studies commonly used what is referred to as the extrinsic approach where the OSM data are compared with external datasets such as the UK Ordnance Survey data or National Park Service lists [21,22].
A major difficulty arises for evaluating the quality of OSM data for slums: since these neighborhoods are frequently not present in official maps, there is seldom external reference data to be used for extrinsic quality studies. Furthermore, intrinsic quality analyses of the mapping in slums often offers limited insights about data quality since most of these communities do not have organic growth in mapping activities. Implementing participatory-based mapping activities within slum environments offers the potential to assess the cumulative improvements of the data over time as in the OSM communities in the Global North.
Due to these challenges, very few studies have assessed the quality achieved by collaborative mapping efforts of the global humanitarian OSM community (e.g., [11]), particularly in slums, whose complex morphology raises particular challenges for mapping from satellite imagery. To fill this gap, we examined OSM data quality at different stages of a participatory mapping process leading to the final update of the OSM database. The following research question is addressed in this study: What is the spatial data quality of collaborative remote mapping achieved by volunteer mappers in morphologically complex urban areas? By addressing this question, a multi-country case study associated with an ongoing research project of the National Institute for Health Research (NIHR) Global Health Research Unit on Improving Health in Slums is presented. The Unit focuses on health services in slums through the study of seven slum sites across two continents (Asia and Africa) with the ultimate aim of finding optimal ways to deliver health services to slum dwellers [23]. This context enables us to overcome the challenges of previous studies, by analyzing the results of the same mapping procedures systematically applied in seven slums in four countries (Bangladesh, Kenya, Nigeria, and Pakistan). In this paper, we present results from a spatial data quality assessment along various stages of mapping process workflow used to map and update the OSM database in these sites and seek to learn lessons for future humanitarian mapping initiatives.
The next section, Section 2, discusses related work covering intrinsic, extrinsic, analytical platforms and identifies knowledge gaps which inform our research question. Section 3 presents the research question as well as materials and methods of the study. Section 4 presents results, and Section 5 presents the discussion and conclusion including limitations of the study and potential directions for future work.

2. Related Work

There are several quality categories that one can study when considering data quality of geographic datasets. According to the International Organization for Standardization (ISO), there are five categories of geographic data quality comprising completeness, logical consistency, positional accuracy, thematic accuracy, and temporal quality where, for example, completeness is defined as: “[…] the presence and absence of features, their attributes and relationships.” [12]. Among these quality categories, completeness is considered as a fundamental measure of geographic data quality in OSM research [13], as this foundation is paramount for the remaining quality elements to build upon. Some studies examined OSM feature attributes such as speed [24], or focused only on the main aspect of completeness (i.e., “presence and absence of features” where OSM feature extraction or determination was based on primary feature tags, or attributes, such as building or highway), sometimes relating outcome with the density of features but in a non-slum context [13,14,15]. Several studies used intrinsic approaches, where only OSM data is used, to investigate OSM data quality in recent years [9,10,16,21,25]. Some studies have used the concept of analyzing activity stages based on the history of OSM data and heuristic rules for stage transitions (e.g., no data, start, growth, and saturation), covering 12 representative metropolitan areas [12] as well as globally at the regional scale [25]. Other studies have developed tools to examine OSM line type feature data quality such as a plugin for Quantum Geographic Information System (QGIS) [10] and Python-based tools [16]. Some of the studies have led to a plethora of analytical platforms such as iOSMAnalyzer [9], OSM History Data Analytics Platform [26], OSMStats [27], and OSM Analytics Tool [28] among others. Although these platforms do show historical profiles of intrinsic quality indicators, they are unable to clearly define the underlying mapping stages that led to the data produced for visualization or descriptive statistics presented; this problem is partly due to a lack of information about the data production process that led to the historical data. Additionally, most of the services being offered by these platforms do not provide immediate latest analyses based on the most recent historical data. Making data production processes visible to researchers can help to identify whether the historical data available is produced via online mapping processes alone or in combination with field validation. Understanding the data production stages alongside the historical data in the database can be a very useful way to systematically explore challenges of quality data production as well as relative completeness (intrinsically) and absolute completeness (extrinsically).
In terms of extrinsic approaches, where OSM data is compared with other reliable datasets to examine data quality, previous studies have mostly used authoritative data as a reference and these studies were usually based on developed urban areas mostly in the UK, France, Germany, Ireland, United States, New Zealand, and Canada among others [13,14,15,17,18,19,21,22,29,30,31,32]. Where authoritative data are available, access and license restrictions can make the study impossible. Additionally, the financial cost and ethical appropriateness of the data for a given area to study can also be problematic. Finally, the data production stages leading to the final version of the data being shared are not transparent enough to allow systematic review in relation to identified stages of OSM data production. For extrinsic analysis, completeness measures for routes are usually length metrics and completeness is defined as the ratio of the total length of routes in OSM and the total length of routes in the reference data (e.g., [22]). Similarly, completeness measures for buildings are usually defined in terms of total number and/or area (e.g., [15]).
Related studies have used either unit-based or object-based comparative analytical approaches for examining the completeness of buildings and routes [14,15,17,19,22]. For example, the proportion of the total number of OSM buildings relative to the total number of reference buildings per unit in percentage form is considered a unit-based comparison. In the case of object-based comparison, an example is the proportion of the total number of buildings in the reference data that are present in the OSM in percentage form where the centroids of reference buildings intersect an OSM building [15]. These comparative approaches are normally implemented extrinsically due to the need for reference data to compare with the OSM data. Therefore, the historical OSM data is not used. In an object-based approach, matching of corresponding elements in both the OSM data and the reference is required prior to determining the proportion of the total number of reference buildings that are represented in OSM in percentage terms [15]. Because external and different reference data sets are compared with OSM data, it is impossible to establish a correspondence between objects of the two datasets without using either centroid proximity or overlapping area. As object-based matching is sensitive to positional mismatches of objects and can be complicated and time-consuming, recent studies normally use the unit-based approach that is much simpler [14,19]. The unit-based approach does not require any form of object-based matching and relies on the proportion of the total number (or area) of OSM buildings, or total length of OSM routes relative to the reference buildings (or routes) per unit in percentage terms [14,15,17,19,22]. However, in the case of building completeness estimation, the unit-based approach is reported to be sensitive to disparities in estimates depending upon whether the total number or area is used and therefore an object-based approach is recommended [15]. Although completeness and other quality indicators are examined in the aforementioned cases, the emphasis rarely focuses upon slum areas. The lack of suitable data in such areas often impede systematic analysis [17]. This is partly because authoritative or reliable data is usually not available for slums and it is consequently impossible to undertake extrinsic studies. Moreover, in cases where reliable secondary data is available, the completeness of OSM data could be so low that it would not make any sense to conduct either extrinsic or intrinsic study. Collecting data in slums is time-consuming and the data production process can be even more complex than in a non-slum area. For example, identification of building footprints and footpaths in slums can be daunting. This study contributes to this gap and investigates the stages of the mapping process leading to the final update of the OSM database. Because historical data from different time points and data sources exist in the OSM, lessons can be learned by examining the impact of different data production processes on data quality. Such work can help advance transparency and inform future work on OSM. Mapping stages undertaken by remote or local mappers need to be visible to inform OSM data quality assessment and decisions. In a situation where both intrinsic and extrinsic quality assessments are difficult to undertake, a research-based experimental approach might be the best option. There are very limited studies that adopt a research-based experimental approach. For example, Eckle and Albuquerque [11] designed an experimental approach to the assessment of OSM data quality in crisis mapping but recommended a bigger study. Until now, no systematic OSM-based experimental studies exist for mapping and surveying of slums across multiple countries using the same open-source-based methodological framework.

3. Materials and Methods

The following research question guided this study, which covers seven slums across four countries: What is the spatial data quality of collaborative remote mapping achieved by volunteer mappers in morphologically complex urban areas? Within this overarching question, we focus on the following measures: (1.1) completeness of remote mapping (Stage 1) based on additional field data collected from fieldwork (Stage 2); (1.2) growth in data completeness during remote mapping of slums based on field data; and (1.3) completeness contributions per mapper during remote mapping and fieldwork.

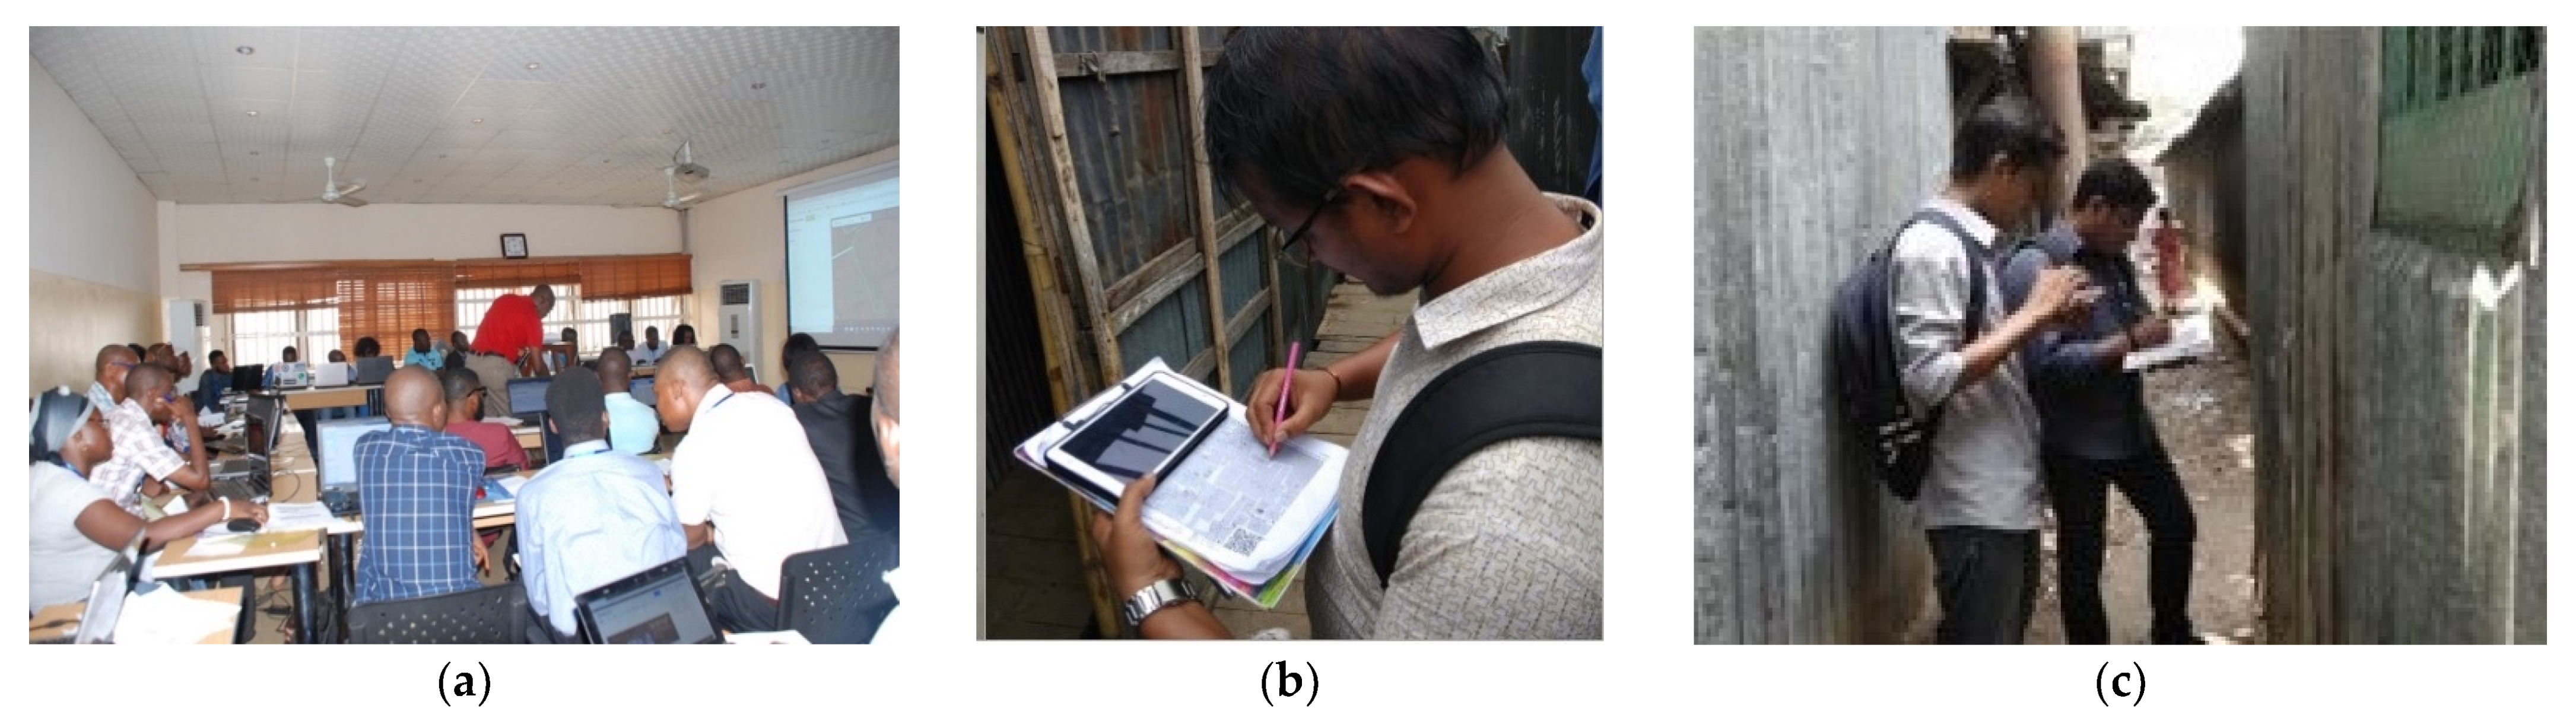
3.1. OSM-Based Mapping Process for Slums
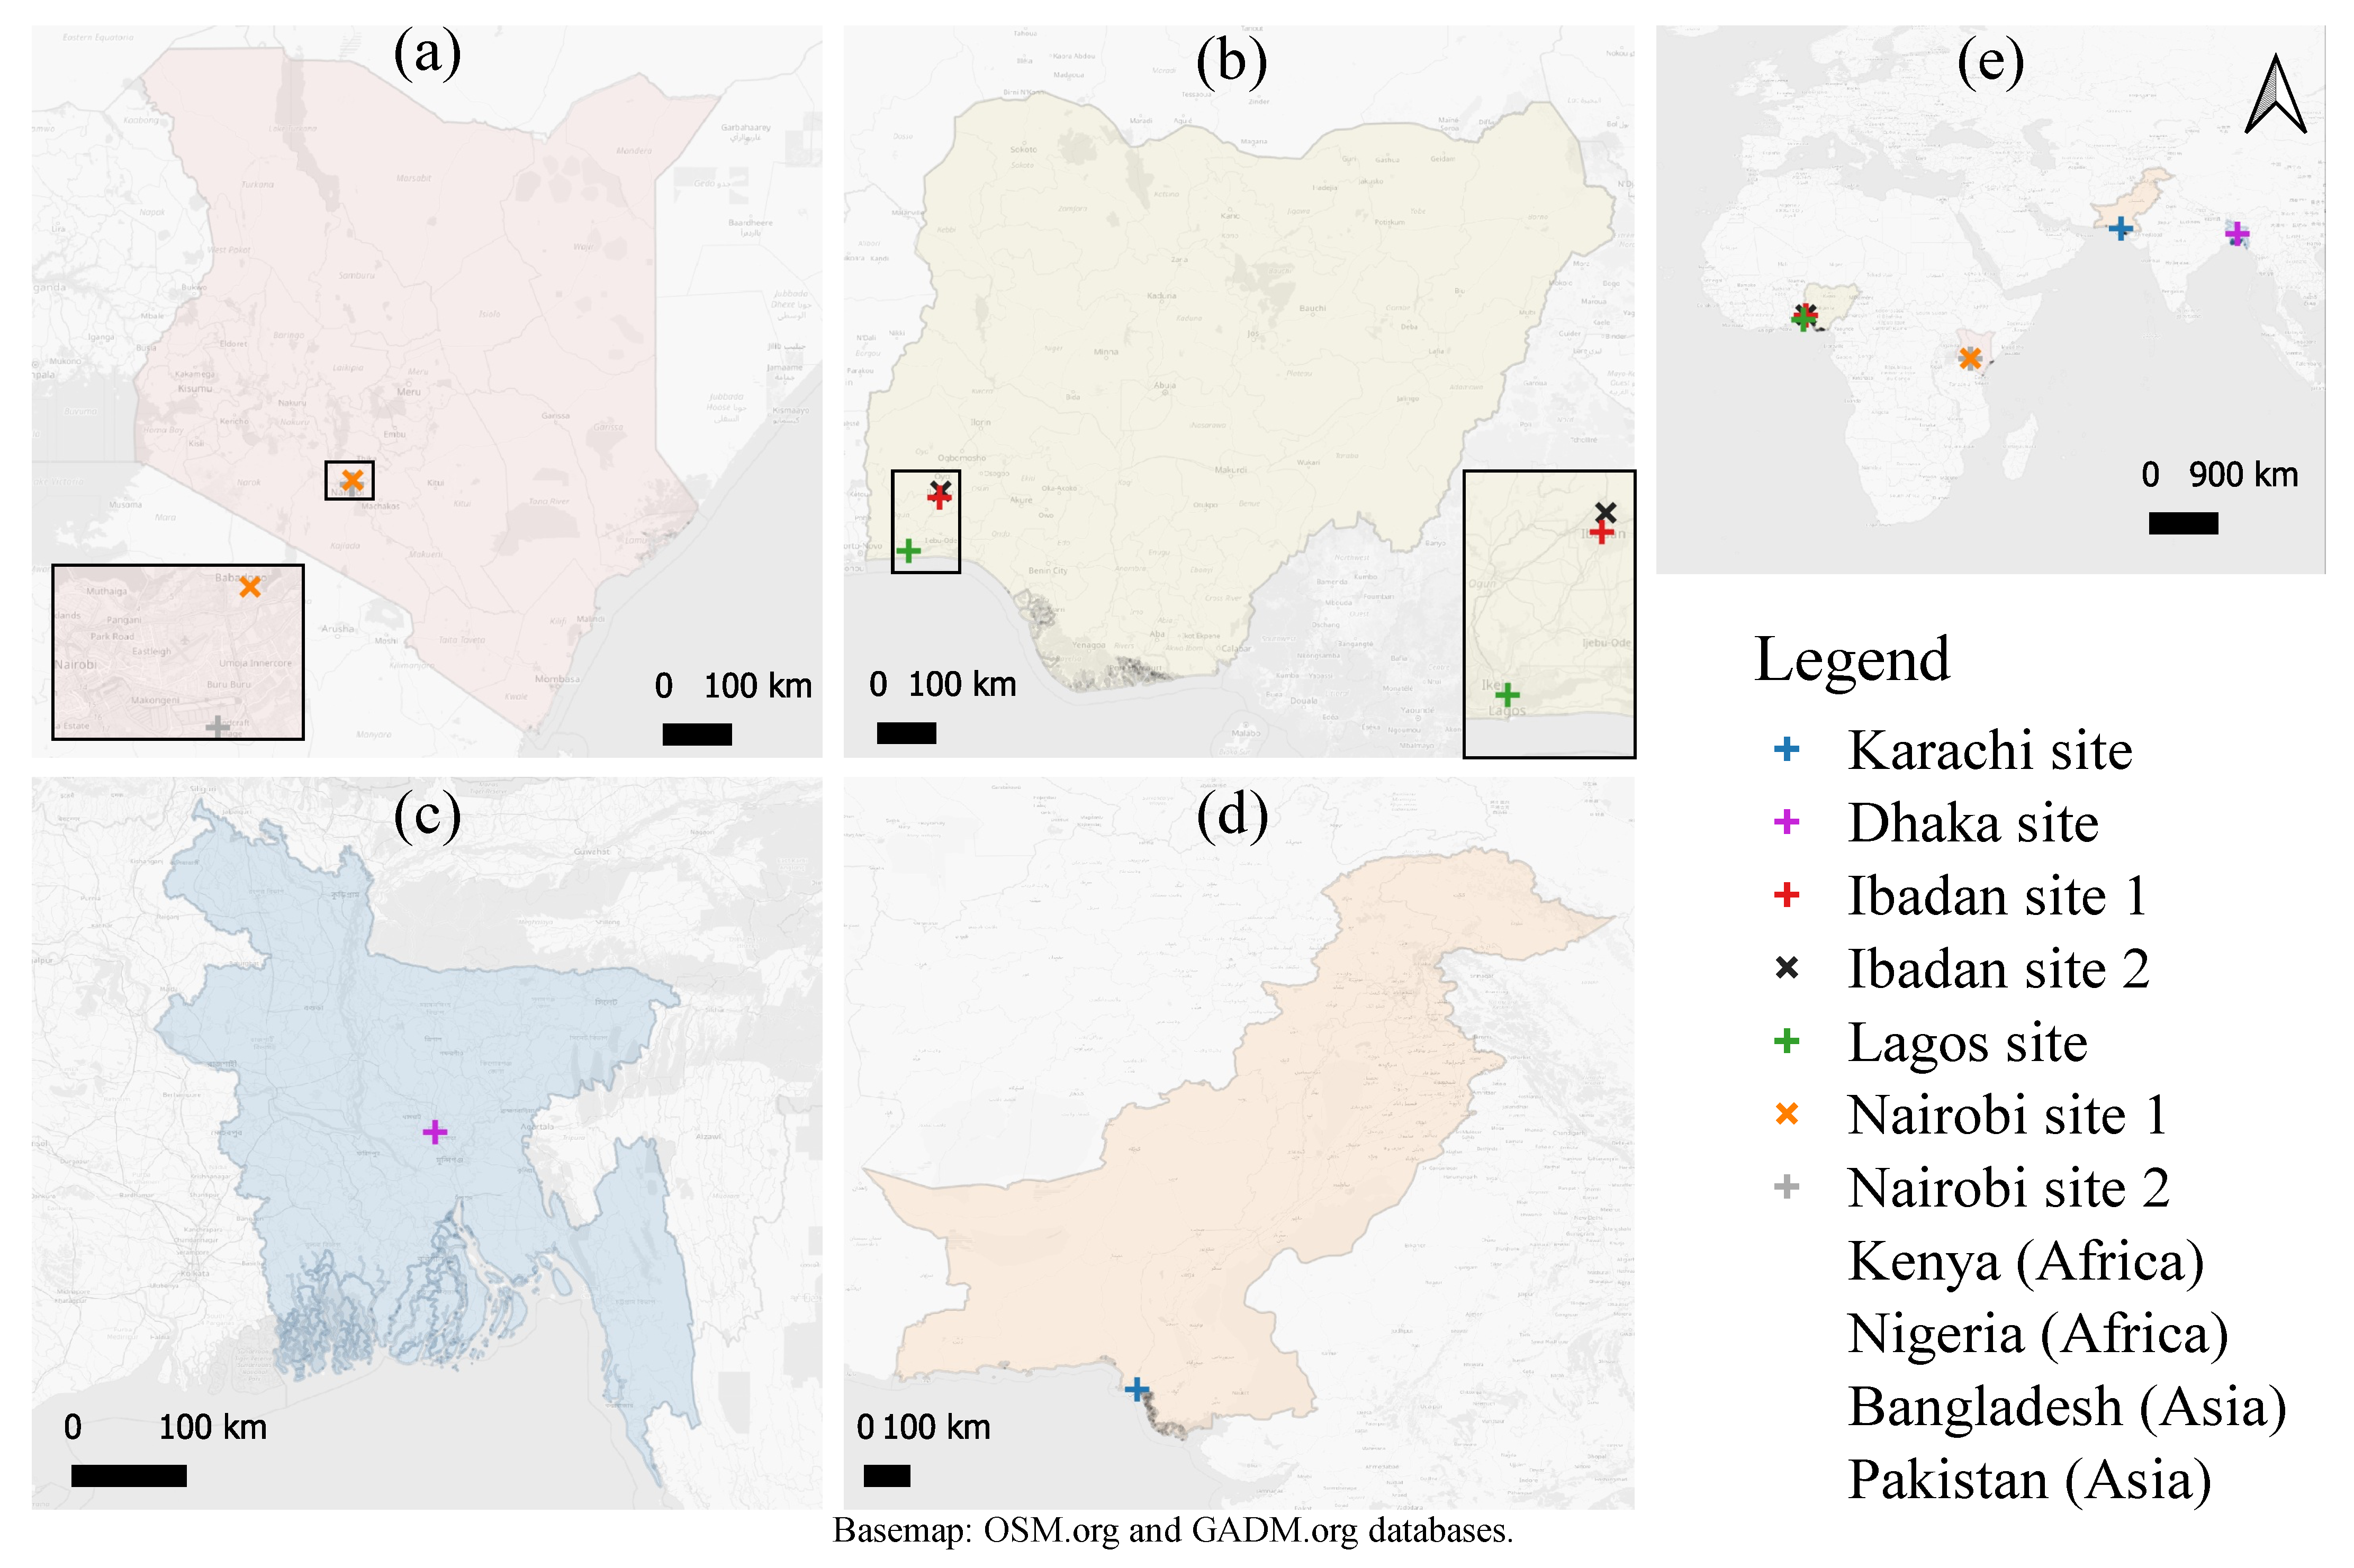
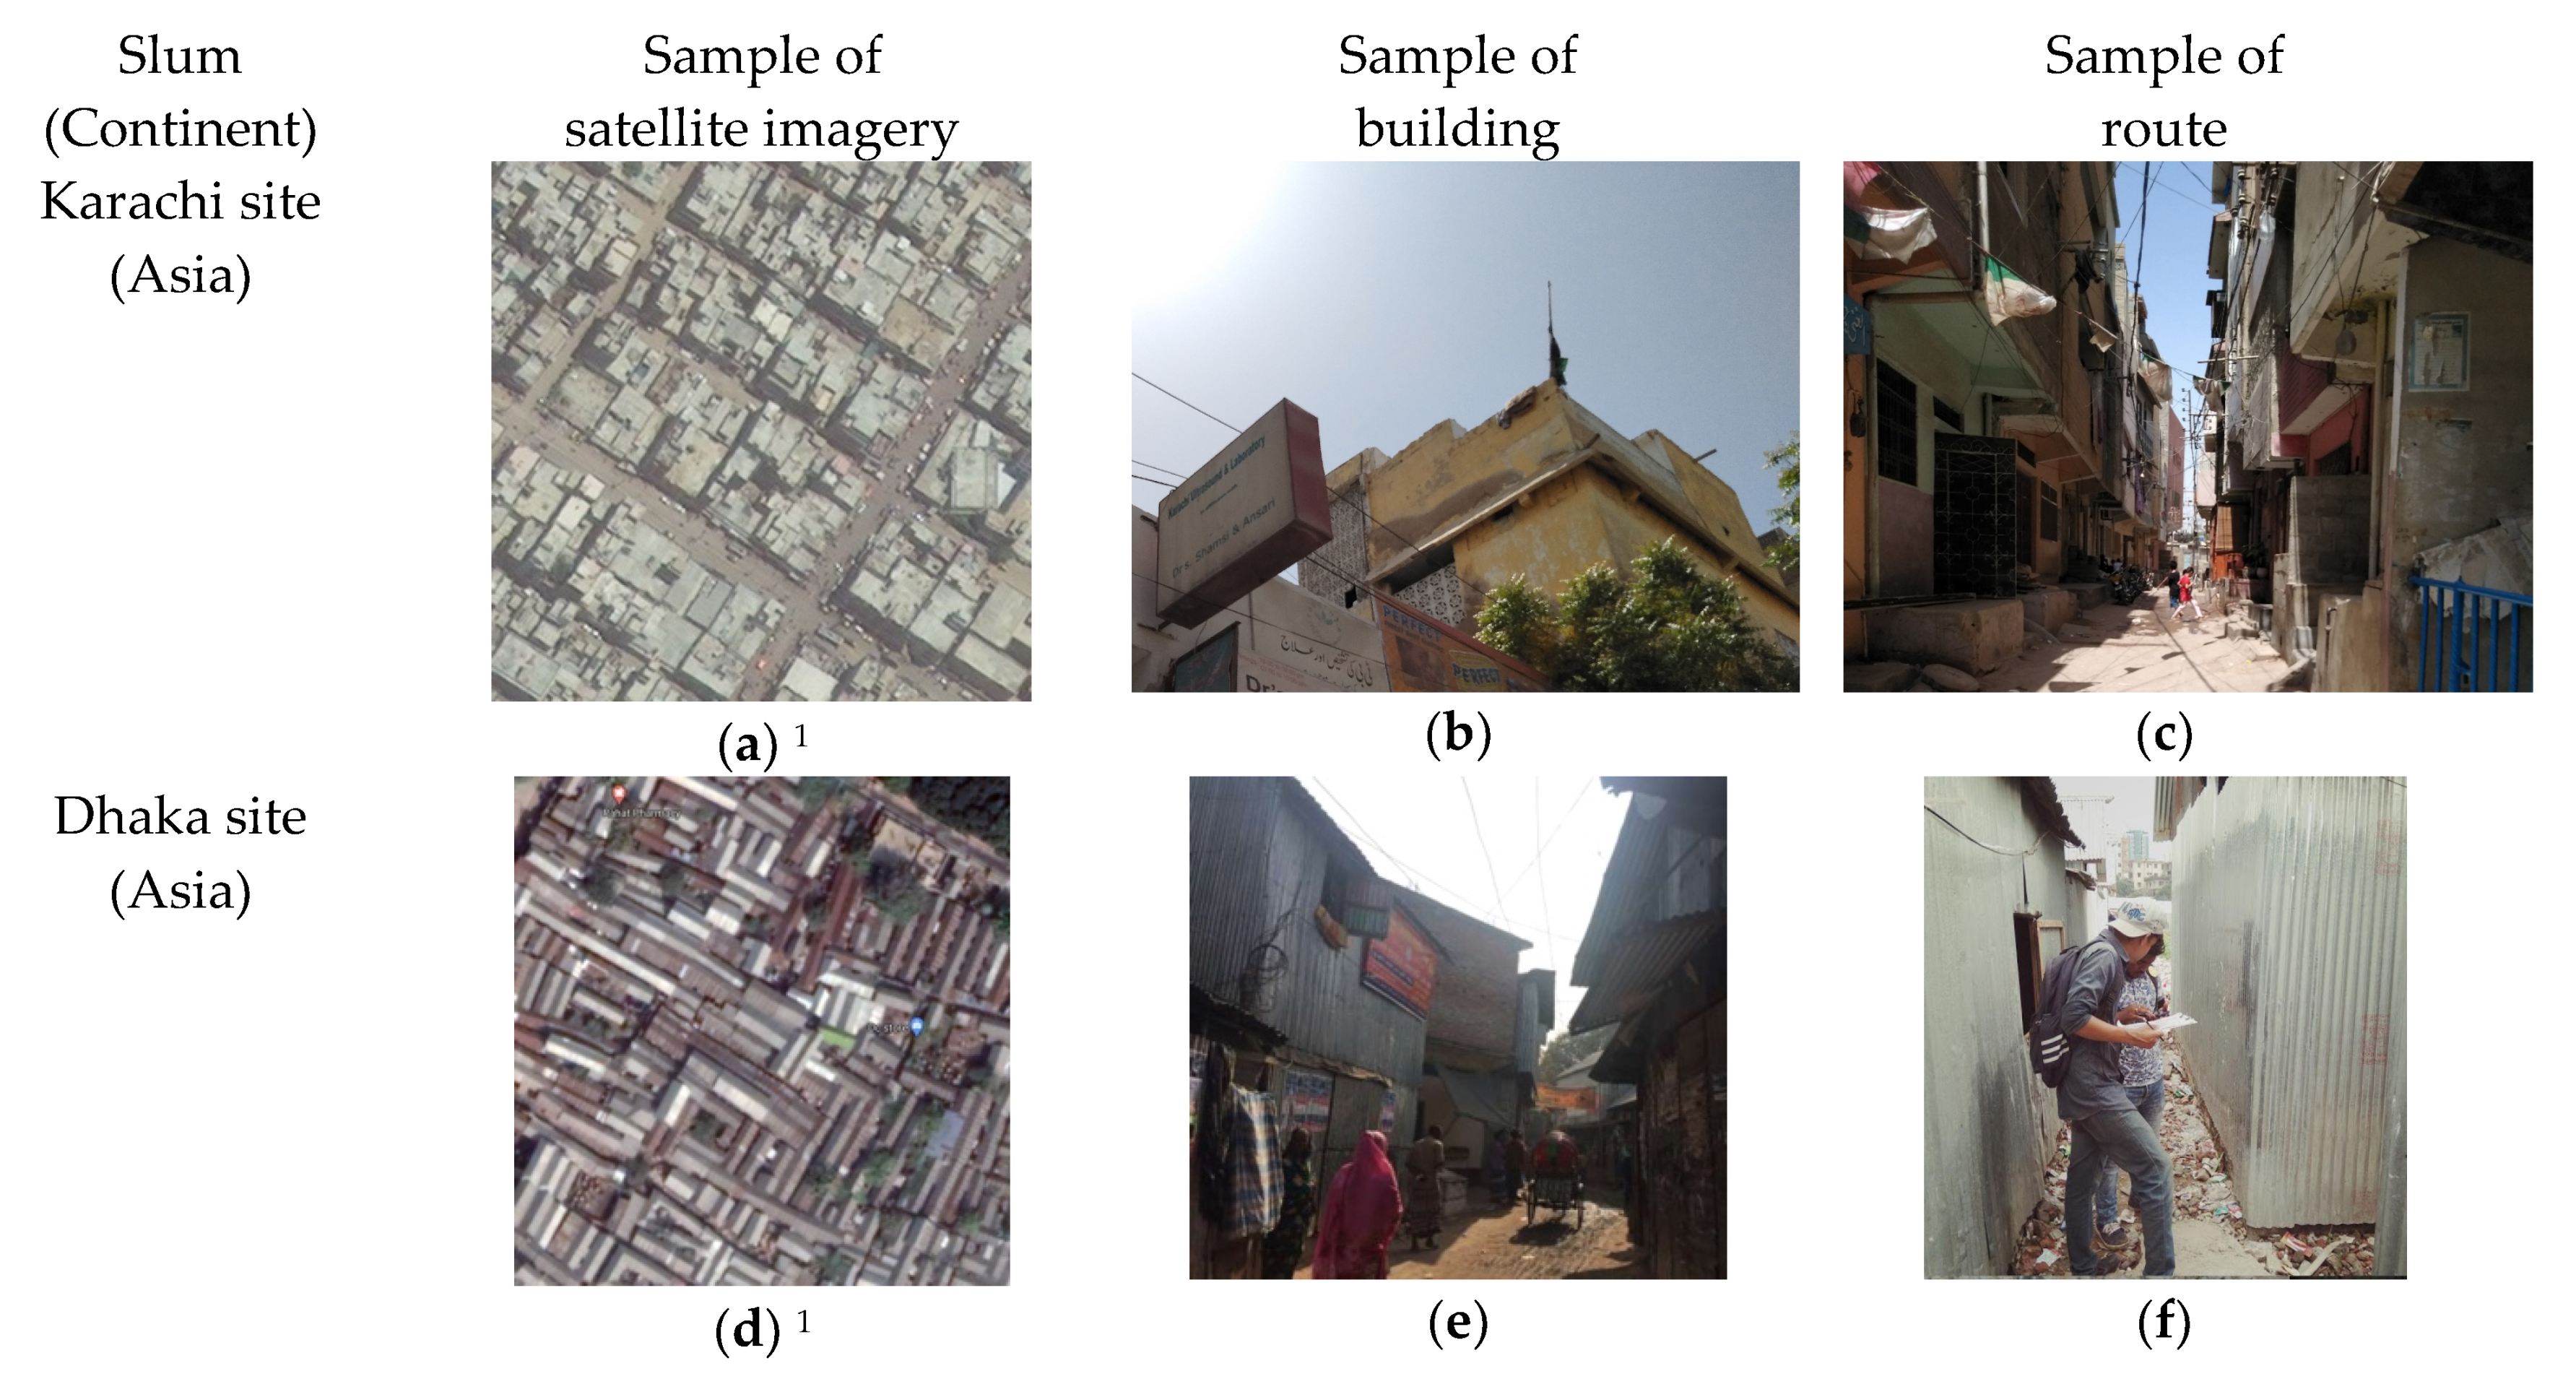
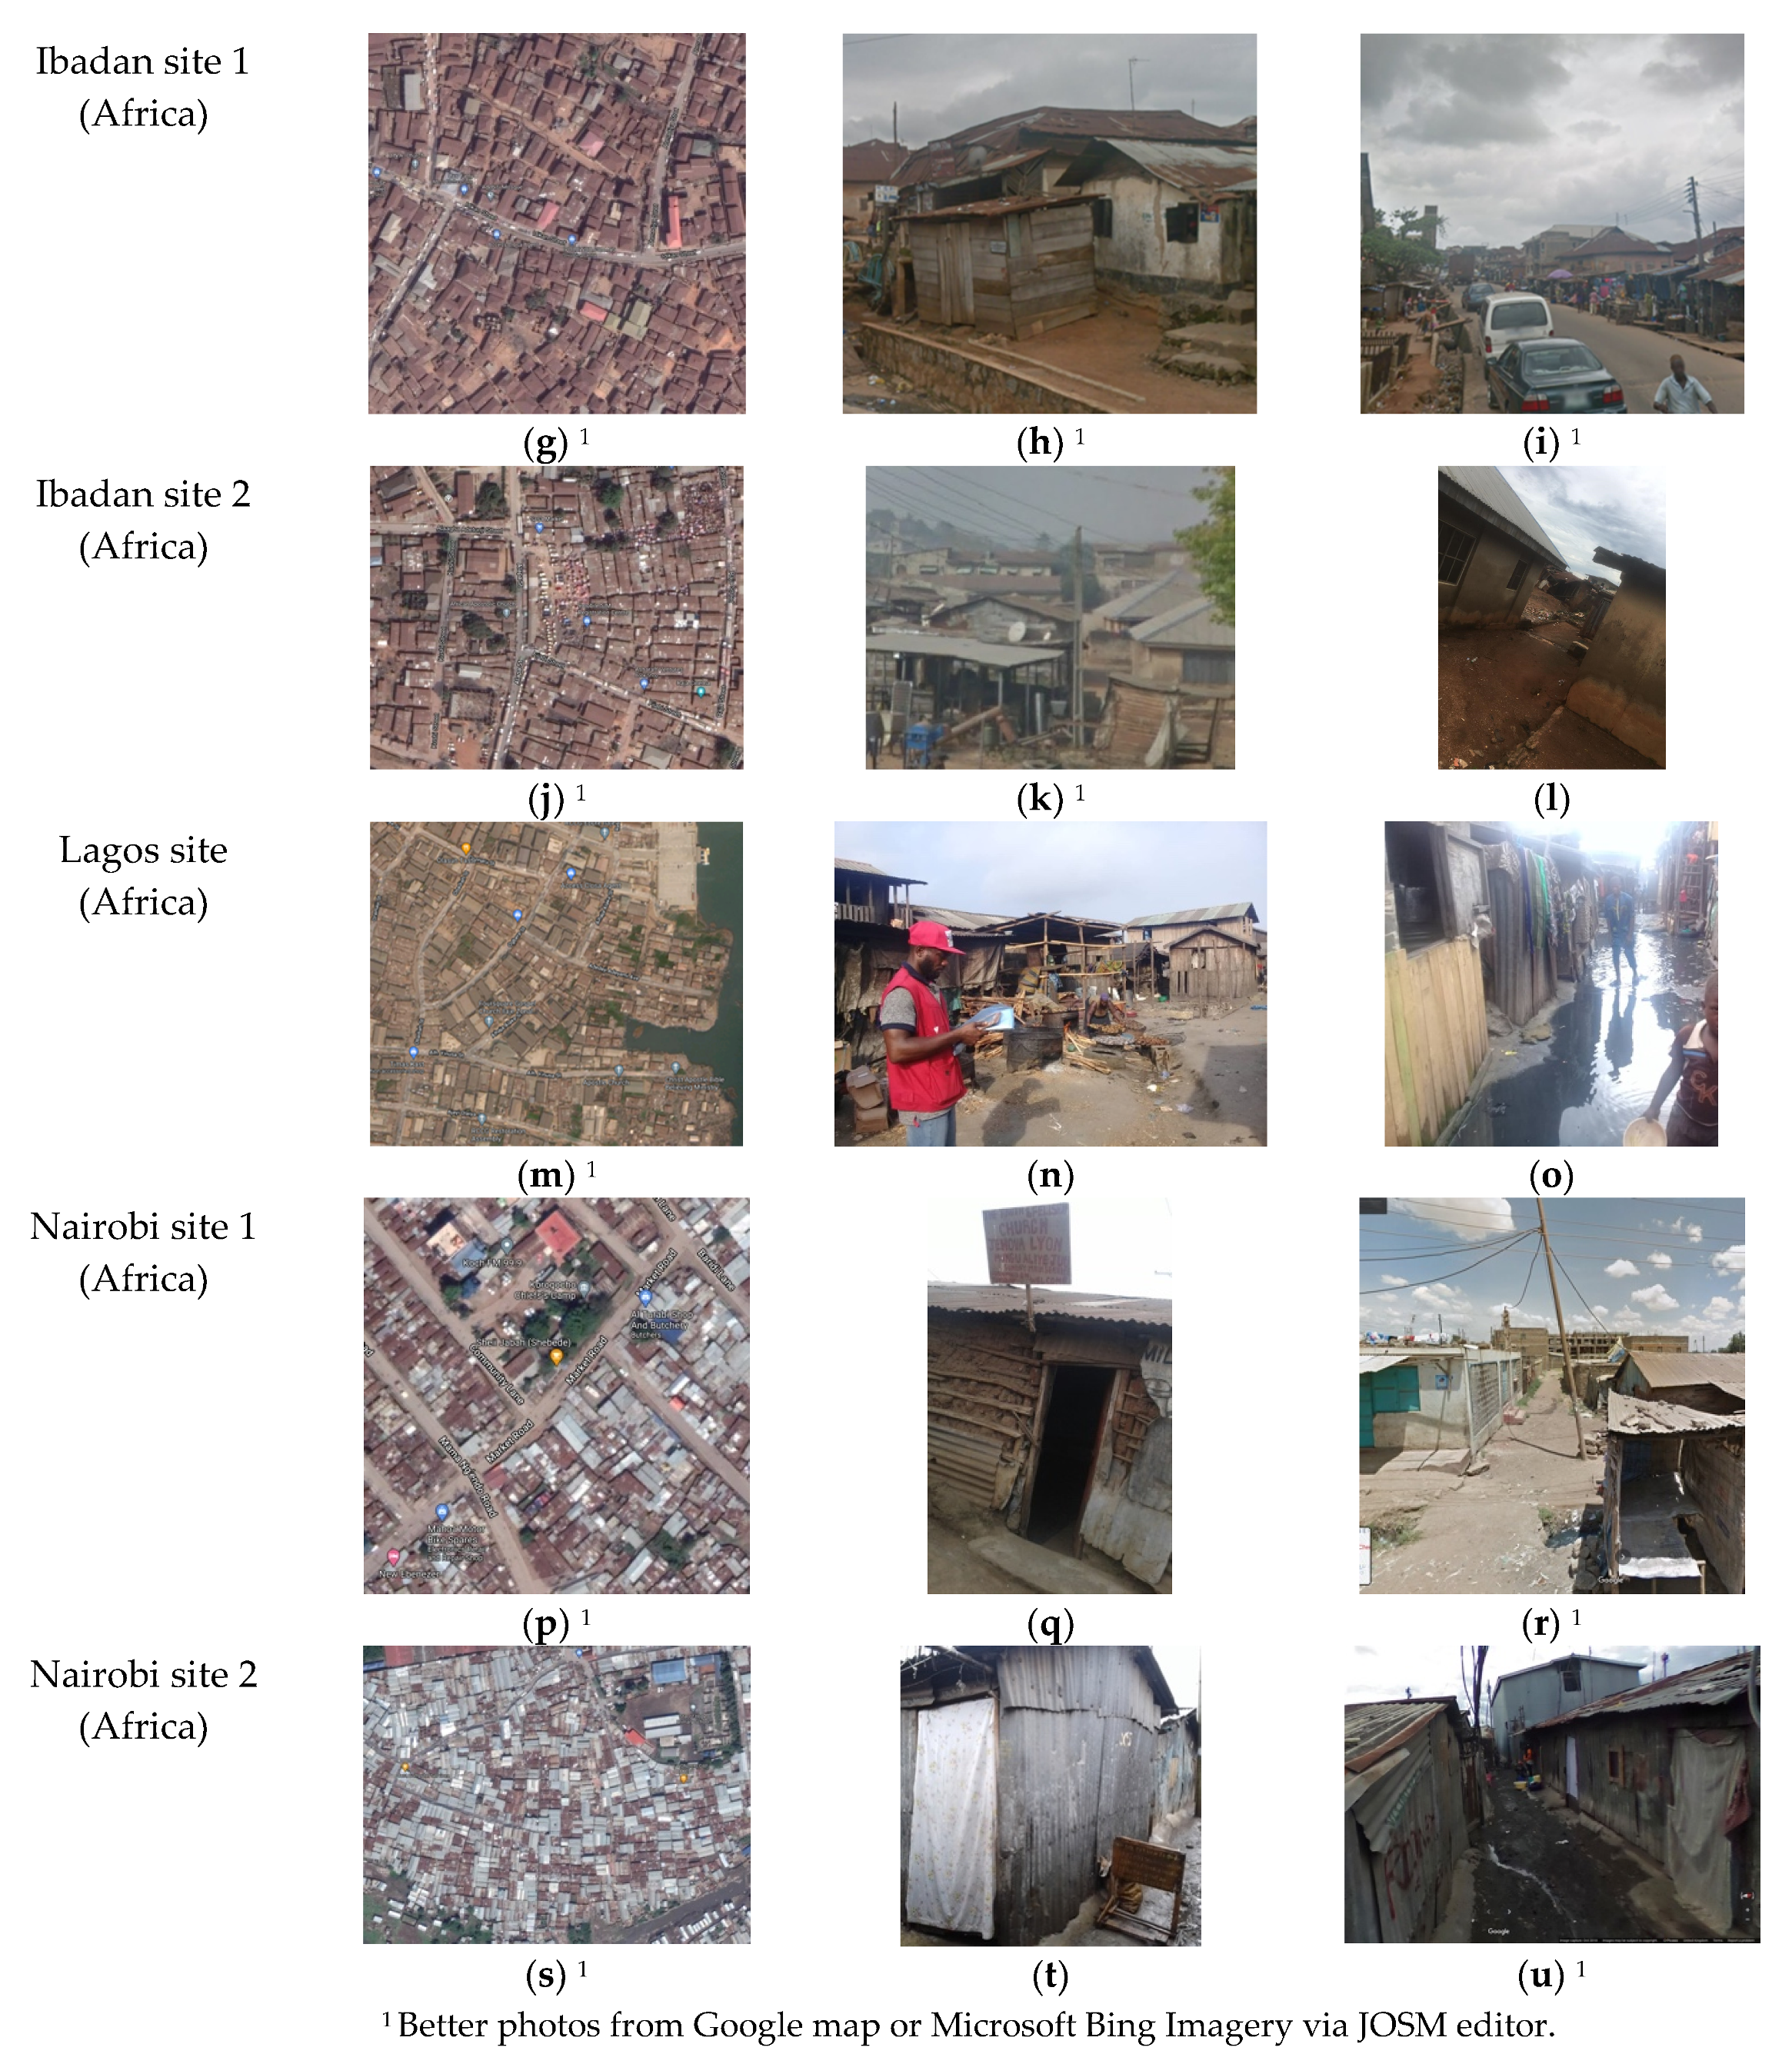
The overall methodological framework for mapping urban slum communities in the project has been published elsewhere [33,34]. In this section, an overview of the participatory method and process is provided along with details of the mapping process workflow and the stages at which data sets were captured for the analysis in this study. Table 1 describes the overview of the methodological framework of the mapping process, which builds upon the typology of tasks of geographic crowdsourcing presented in Albuquerque et al. [35].
Figure 1 depicts graphically the activities that were part of the different mapping stages of our OSM-based participatory mapping process. Stage 0 consisted of preparatory activities and was useful for setting the agenda prior to the start of the online mapping. The preparation period mainly covered creating training materials, defining responsibilities with local core teams in each partner country, training local teams, procuring high-resolution satellite imagery, identifying neighborhood boundaries with local core teams at partner institutions, and setting up of the online mapping platforms. Securing access to the slum sites was also negotiated during this period. All data collectors who took part in the mapping process but were not familiar with the tools were trained. Stage 1 was for online mapping. We used the Humanitarian OSM Team (HOT) Tasking manager (TM) and this served as an interface for coordination of mapping tasks [36]. The TM provided links to OSM editors (e.g., iD Editor/JOSM), which in turn directed all edits by mappers to be recorded in the OSM database [37]. The online mapping and validation activities ensured the capture of geometrically valid vector data from optical satellite imagery for fieldwork in Stage 2. Beyond online mapping and validation, field-mapping was undertaken to verify the digitized features. Stage 2 period was for fieldwork until the time by which the OSM data was extracted and prepared as a sampling frame. The sampling frame was made up of building structure geometry and names of household heads or representatives. Stage 2 involved using portable global positioning system (GPS) devices to track routes (roads and footpaths); uploading the data onto the OSM database; generating quick reference (QR) coded field paper maps based on Fieldpapers.org technology; annotating the paper maps (Fieldpapers) in the field after checking building structure geometry along with a tablet-based structured questionnaire for building geometry verification and enumeration; scanning the annotated paper maps; and, conflating scanned annotated maps into the OSM database to obtain final field data (reference data). Two key open-source technologies were integrated into the questionnaire template development using OpenDataKit (ODK) and OpenMapKit (OMK) technologies for the household-heads listing survey to inform sampling frame generation [38,39]. ODK server and client tools provided means for mobile a-spatial data collection and management while OMK tools allowed the collection of, and linking to, spatial data as part of the questionnaire administration.
Figure 2 shows example photographs of an online remote mapping event held during Stage 1 and fieldwork activities in Stage 2 (building geometry verification and enumeration) of the mapping process. An important variable in the definition of the stages is the actual dates for the start and end of the stages. Without the time intervals of the mapping stages, it is impossible to undertake systematic analyses as shown in this study. With careful planning, it might be possible to determine the Stage 1 period from the new version of the tasking manager but not that of the fieldwork. Identification of stage dates independently from the OSM database without any input from the mapping team can be inaccurate. For example, the use of annual stages by Gröchenig et al. [12] to estimate OSM completeness is not applicable to this study. Using the raw data, we defined the following indicators for analysis. Three measures were constructed comprising (1) completeness of building structures and routes, (2) completeness growth at each mapping stage as well as (3) completeness growth per mapper per stage. The next section presents the study sites, data, and analytical approach used in this study.

3.2. Study Sites

The seven study sites were as follows (see Figure 3 and Figure 4): a slum in Pakistan, city of Karachi anonymized as Karachi site; a slum in Bangladesh, city of Dhaka anonymized as Dhaka site; three slums in Nigeria, cities of Lagos and Ibadan anonymized as Lagos site, Ibadan site 1 and 2; and, two slums in Kenya, city of Nairobi anonymized as Nairobi site 1 and 2 [33,40]. Karachi site is centrally located in a well-established area with permanent and multi-story buildings undergoing vertical levels of new construction. Dhaka site is centrally located in a well-established area with semi-permanent structures, undergoing regular demolitions and reconstructions. Ibadan site 1 is centrally located within a historical area, which is along an old, tarred road with permanent structures in poor condition. Ibadan site 2 is a resettled community at the edge of the city with a well-spaced clear layout and mostly permanent structures. Nairobi site 1 has a settled community and is located about 12 km from the Central Business District (CBD) of the city; the slum structures are made up of mud, timber or tin-roof materials and are mostly in rows. Nairobi site 2 is located about 7 km from the CBD; the slum structures are made up of either iron sheet or tin walls with iron sheet roofs. Figure 4 shows the qualitative sample characteristics of the seven slums in terms of geographical location, satellite imagery, buildings, and routes. The satellite imagery and the photographs also show sample characteristics of the layout of structures as well as rooftop architecture and height qualitatively.

3.3. Data

We used the full history dump of OSM data that is normally referred to as Planet OSM [41]. There are three types of elements in the database: Nodes which define points in space; Ways which defines linear features and area boundaries; and Relations which are usually used to explain how other elements work together [42,43]. Another dimension of the history data is the information about contributors. Any changes made by contributors, or mappers, such as geometry changes or deletions or creation of new elements during an editing session are saved into the OSM database; all these editing information are saved in what is called Changeset [16]. All edits in the OSM history data were extracted using a computational framework for spatio-temporal analysis of OSM history database (OSHDB) in combination with the application programming interface of the “ohsome” big data analytics platform [26,44]. The scripts for the data extraction are available on Gitlab space [45].

3.4. Analytical Approach

In this study, an object-based approach was used with the updated OSM history file and relies upon using OSM object identifiers (OSM-IDs) of buildings and routes to match OSM objects at timestamp k with OSM objects at the last timestamp of the final stage of the mapping process (i.e., timestamp at end of Stage 2). We examined the "true sense" of completeness at each timestamp during the mapping process for seven slums in multiple countries, across Africa and Asia, by exploring four novel completeness definitions shown in Equations (1)–(4) (Equations (2) and (4) are used for sensitivity analyses to provide additional information; we expect the same conclusion in this study). The definitions allowed the possibility of obtaining completeness of buildings and routes at any time during the mapping process retrospectively. The final stage in the equations refers to the end of Stage 2 (fieldwork). To our knowledge, this is the first time building and route completeness have been studied at the level of urban slum settlements in multiple countries and in such detail simultaneously.
C b c _ k   =   B c k B c f
where C b c _ k is building count completeness at timestamp k; B c k was the total number of buildings at timestamp k which were also present at the final stage (i.e., end of fieldwork) and were never edited between timestamp k and the final stage; and, B c f was the total number of buildings at the final stage.
C b a _ k   =   B a k B a f
where C b a _ k is building area completeness at timestamp k; B a k was the total area of buildings at timestamp k which were also present at the final stage (i.e., end of fieldwork) and were never edited between timestamp k and the final stage; and, B a f was the total area of buildings at the final stage.
C r c _ k   =   R c k R c f
where C r c _ k is road count completeness at timestamp k; R c k was the total number of roads at timestamp k which were also present at the final stage (i.e., end of fieldwork) and were never edited between timestamp k and the final stage; and, R c f is the total number of roads at the final stage.
C r l _ k   =   R l k R l f
where C r l _ k is road length completeness at timestamp k; R l k was the total length of roads at timestamp k which were also present at the final stage (i.e., end of fieldwork) and were never edited between timestamp k and the final stage; and, R l f was the total length of roads at the final stage.
These four definitions of completeness, or completeness ratio, partly conform to the definition of completeness offered by Gröchenig et al. [12] who suggested that “the completeness measure of the geographical dataset D, where D is defined by geographical region R [slum area] and for purpose P [slum health mapping], depends on the degree of correspondence between the existence of objects and properties in the real world and the presence of their representing features in dataset D.” Using these equations based on the three metrics (total number, length, and area) will allow estimation of disparities of completeness to situate the results in a better context. The different mapping stages are defined in Figure 1 and Table A1 (see Appendix A). The estimated completeness is presented using descriptive statistical tables and graphs. Understanding the growth of OSM elements has the potential to serve as a foundation for data quality assessment [12,46]. Using the resulting data from completeness analysis, we calculate completeness growth (CG) of a stage which is defined as the difference, or gap, in completeness estimate resulting from the subtraction of the start estimates from the end estimates between stages expressed in percentage terms (see equation 5). Additionally, the number of mappers per stage together with the completeness growth estimates are used to compute completeness growth per mapper per stage (see equation 6). This information is used to compare the densities (i.e., number of elements per square kilometers) of OSM elements across the sites. OSM completeness measure is one of the most important components of quality and pertinent to our study, and, according to ISO, completeness measure indicates the presence or absence of real-world features in the database [47]. The presence or absence of real-world features in the slums during the different stages of the participatory mapping process is what we sought to explore in this study without consideration to feature attributes beyond building and highway primary tags used to identify buildings and routes (such as speed on routes [24]).
C g e _ s   =   ( C e _ s t a g e _ e n d C e _ s t a g e _ s t a r t ) * 100
where C g e _ s is the completeness growth of OSM element E (i.e., building or route) at Stage S in percentage form, C e _ s t a g e _ e n d is the completeness of E at end of S, and C e _ s t a g e _ s t a r t is the completeness of E at start of S.
C g e _ m _ s   =   C g e _ s M s
where C g e _ m _ s is completeness growth of OSM element E per mapper at stage S in percentage form, C g e _ s is the completeness growth of OSM element E at stage S in percentage form, and M s is the total number of active mappers in Stage S.

4. Results

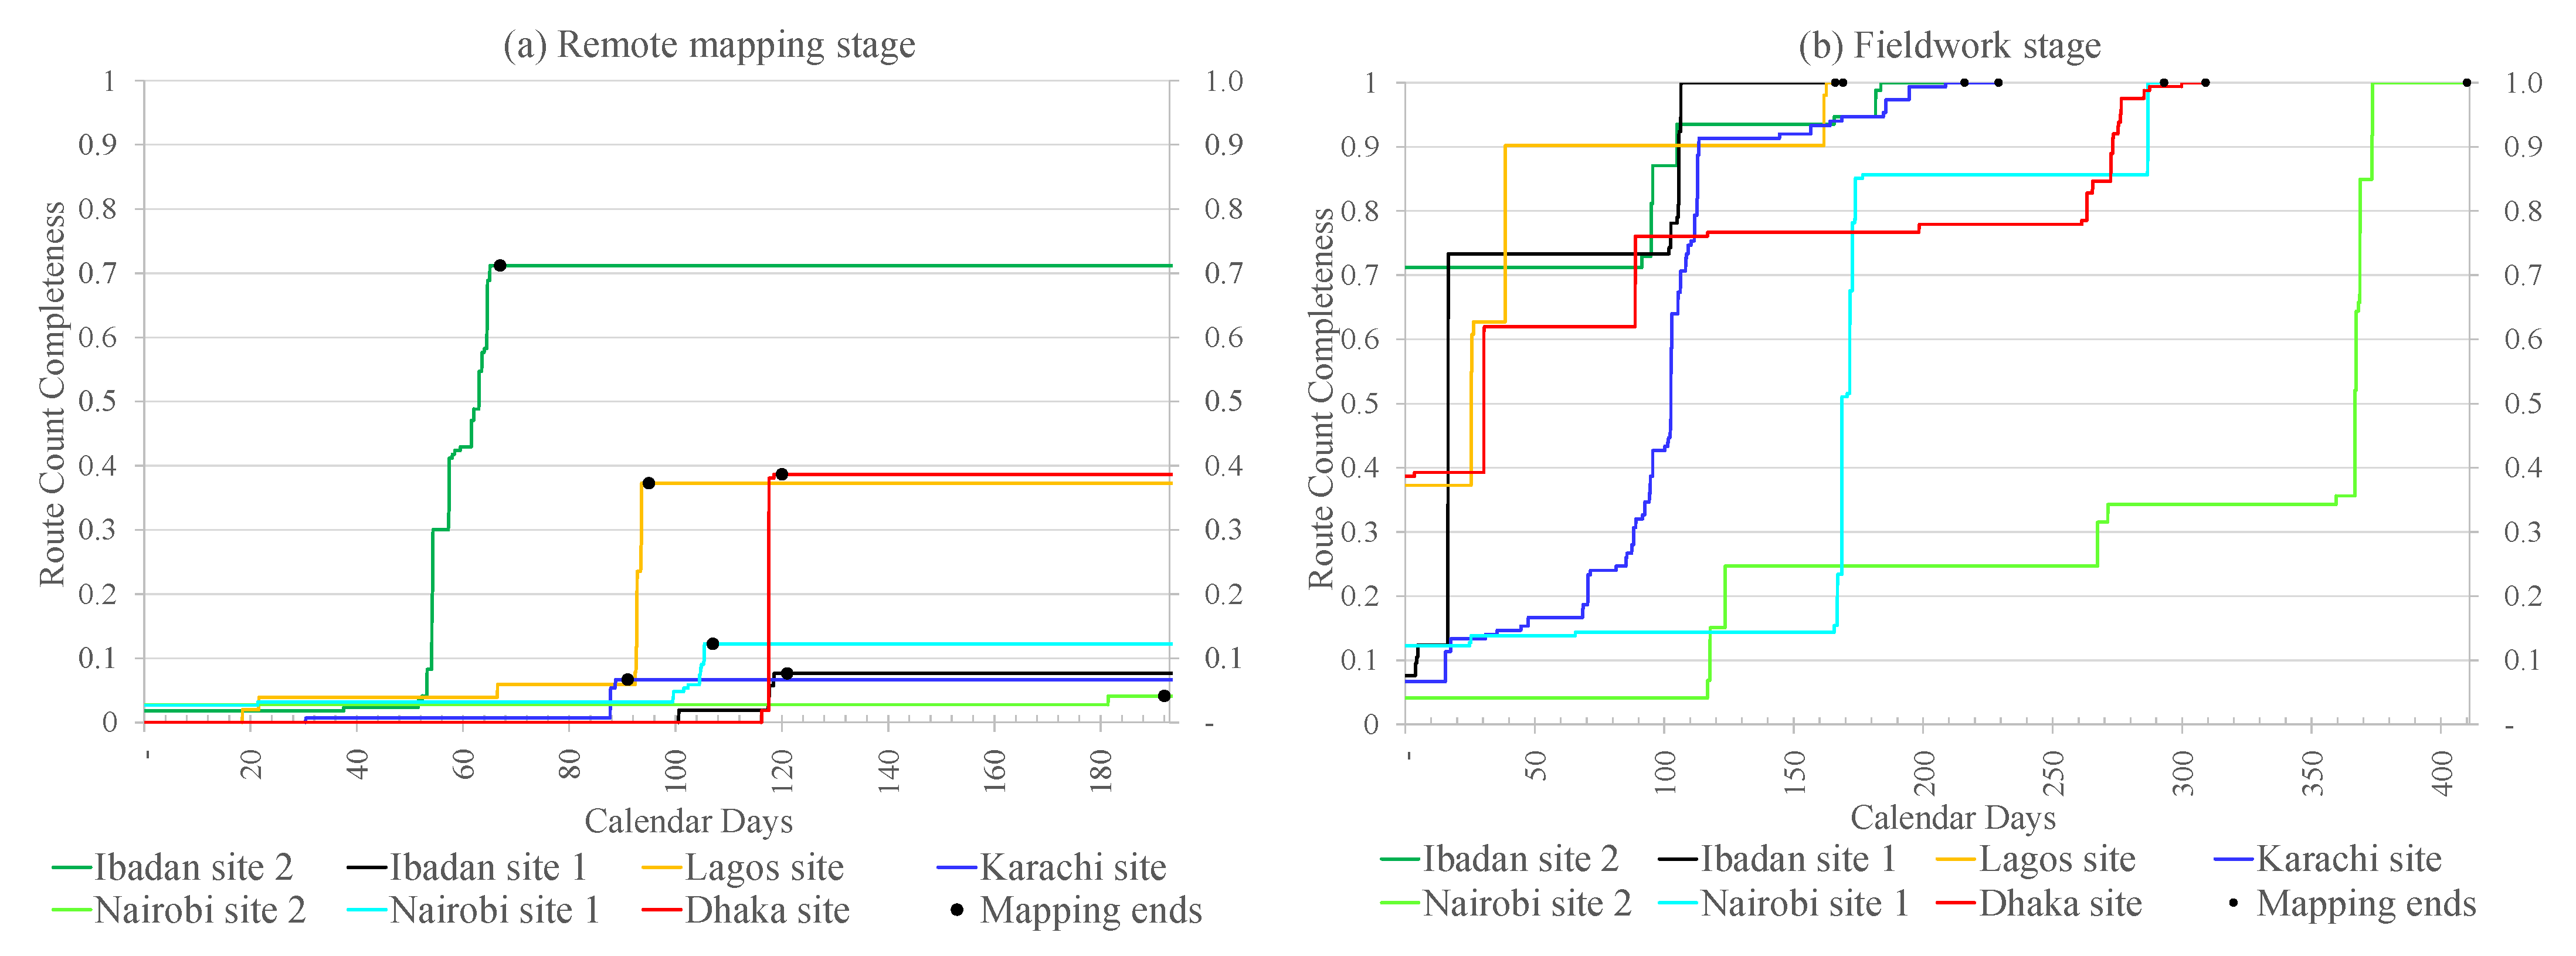
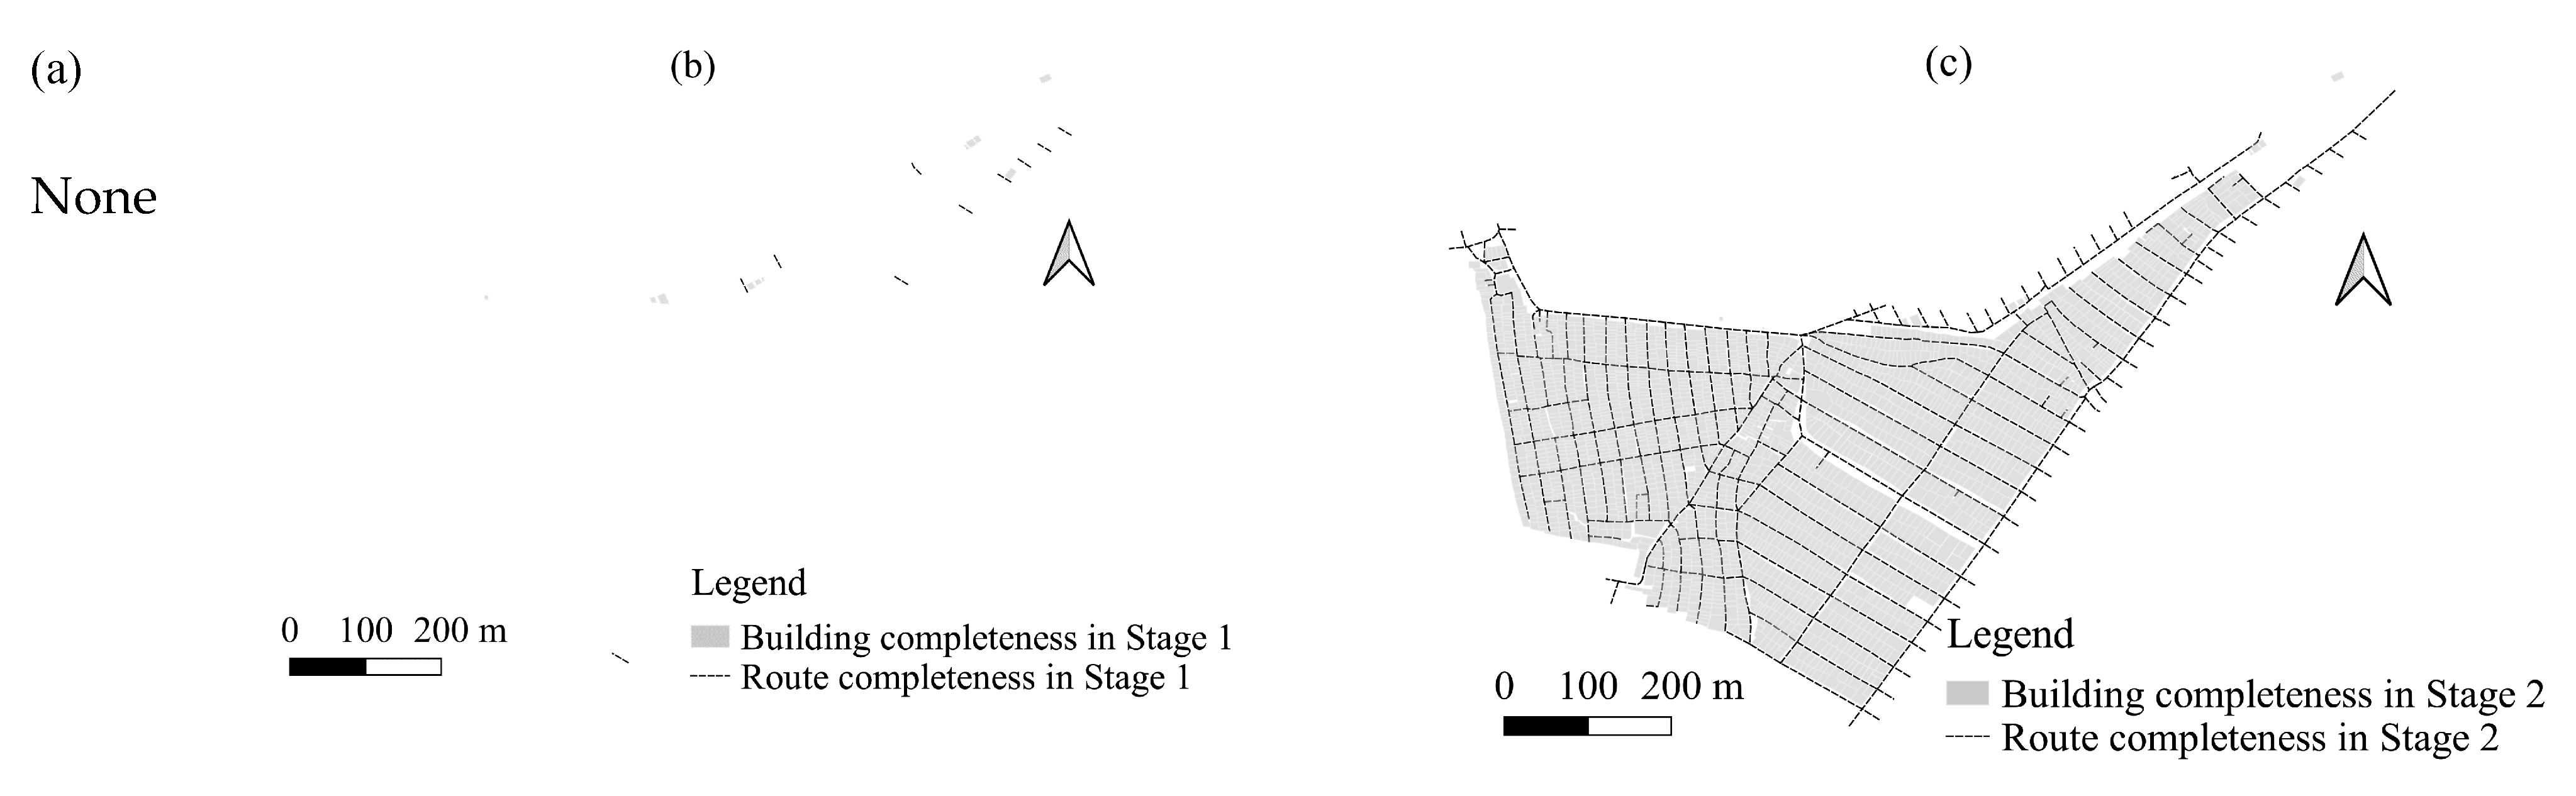
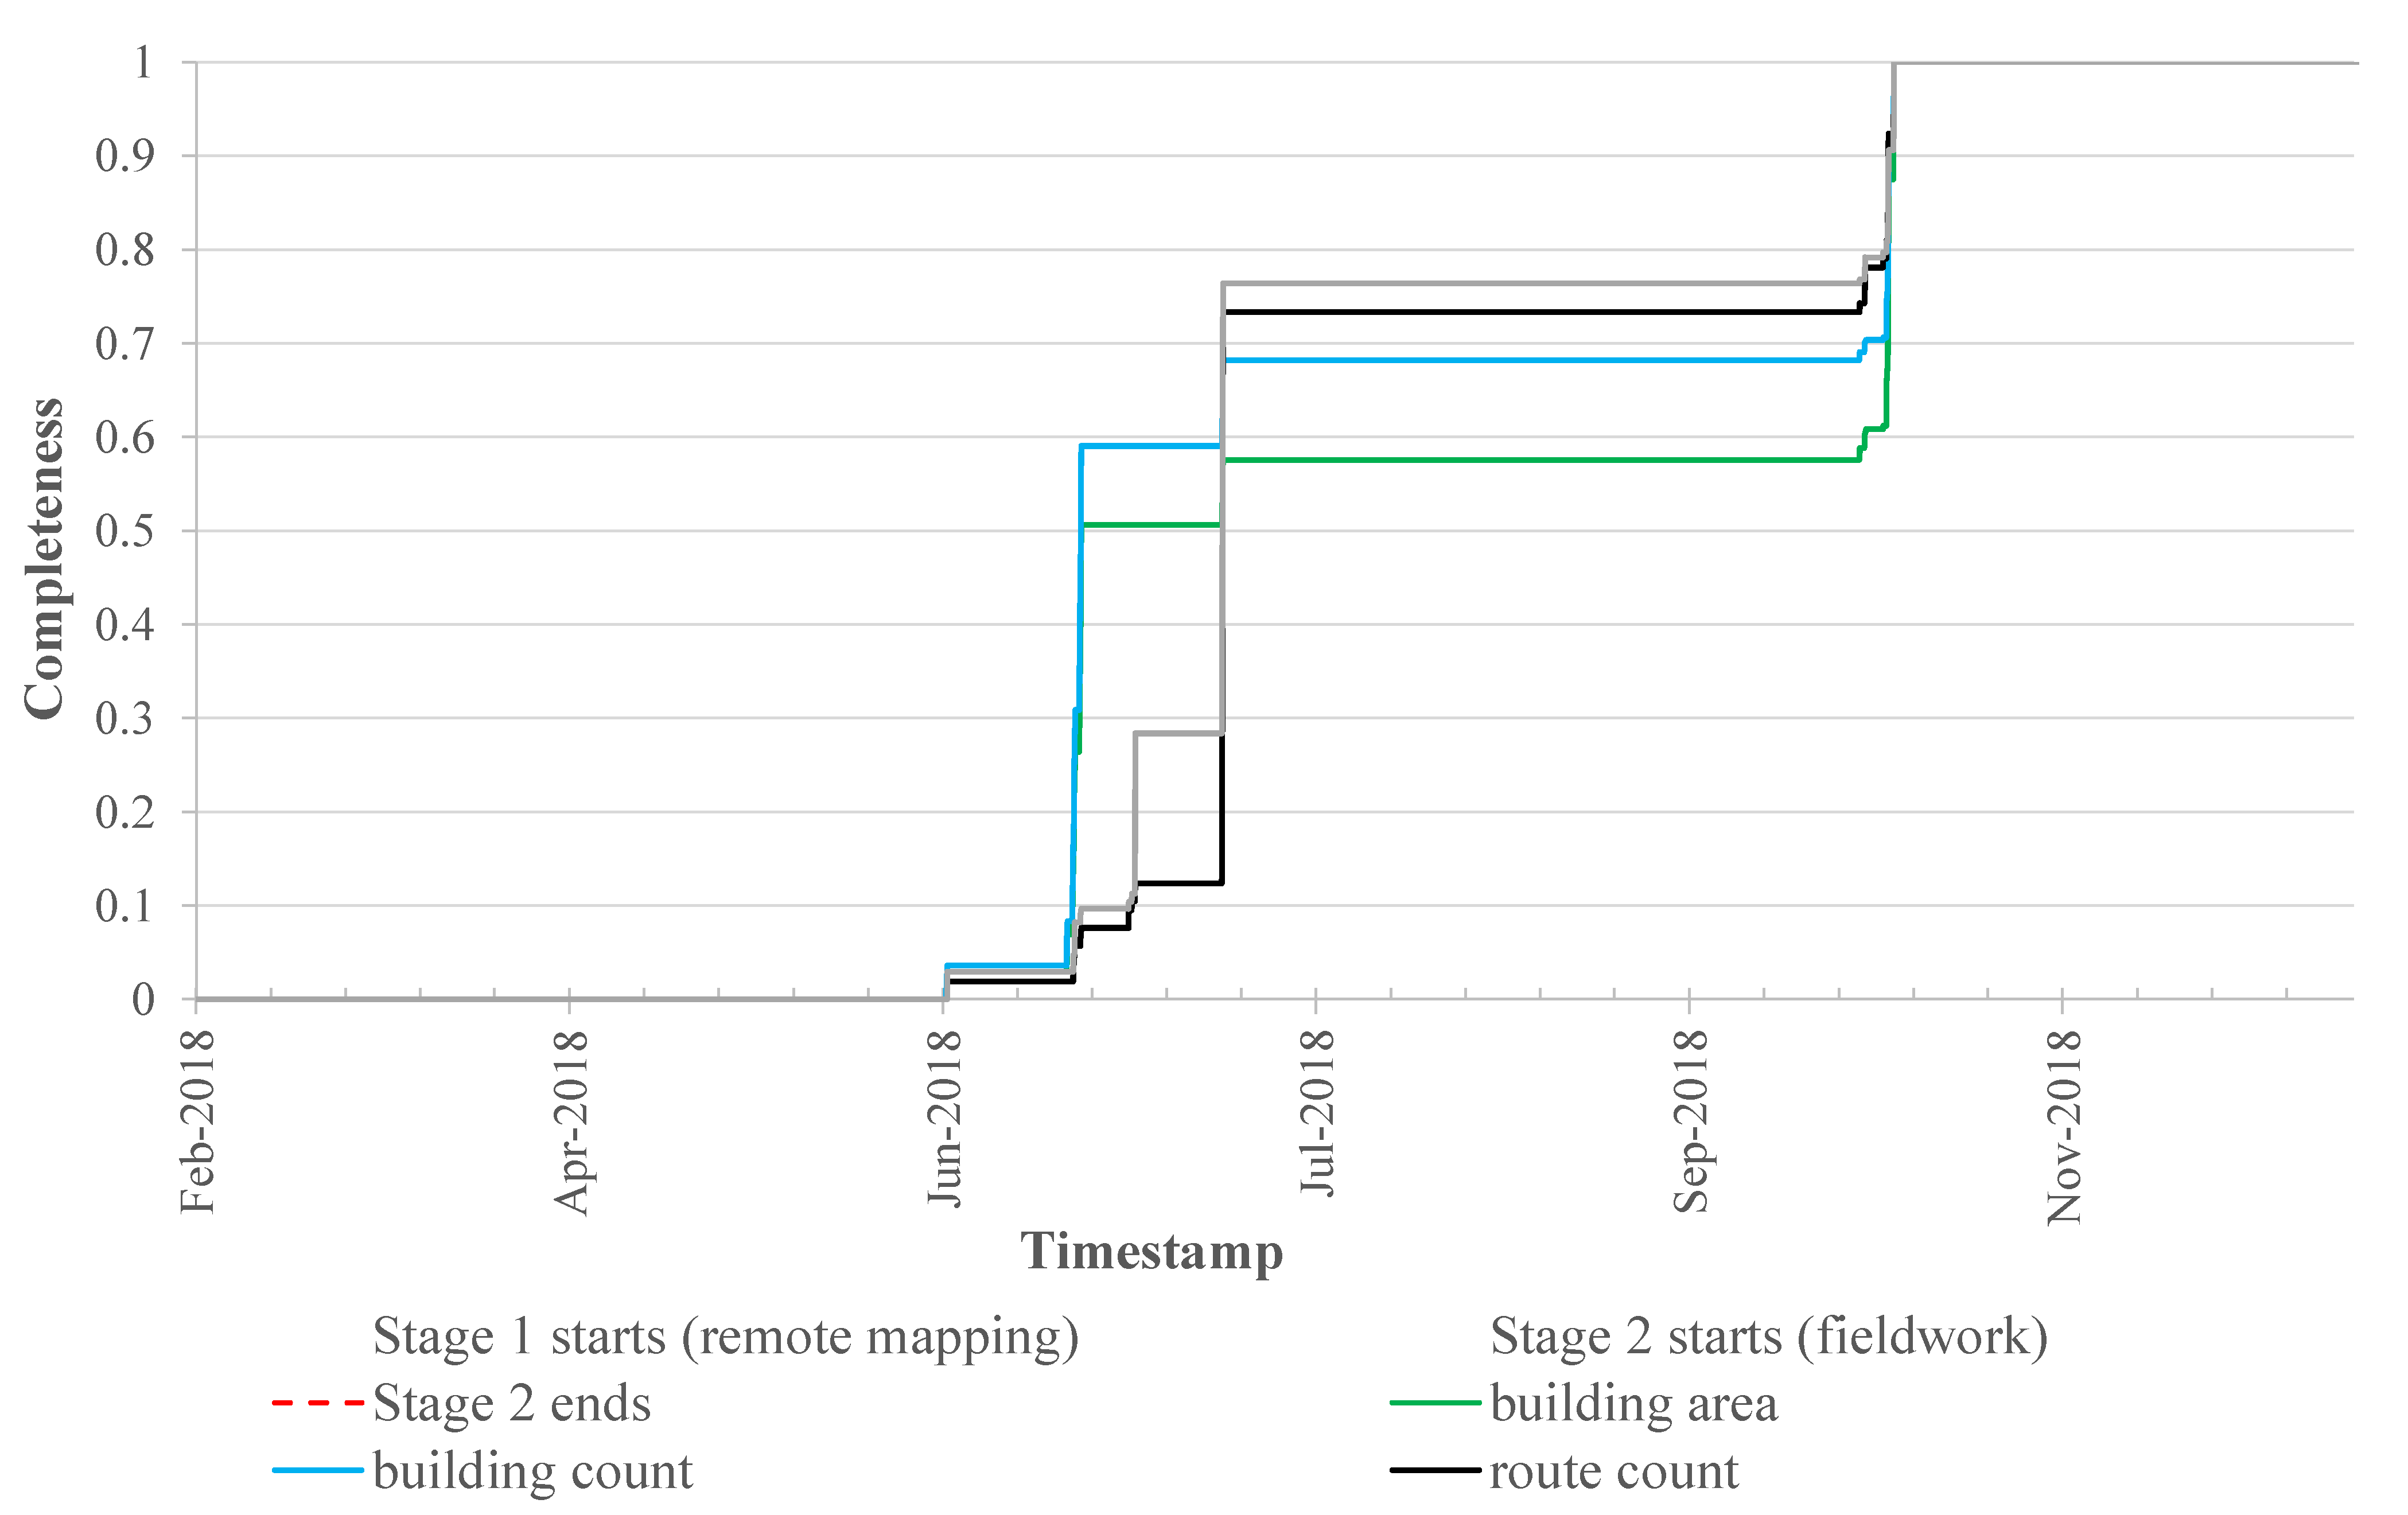
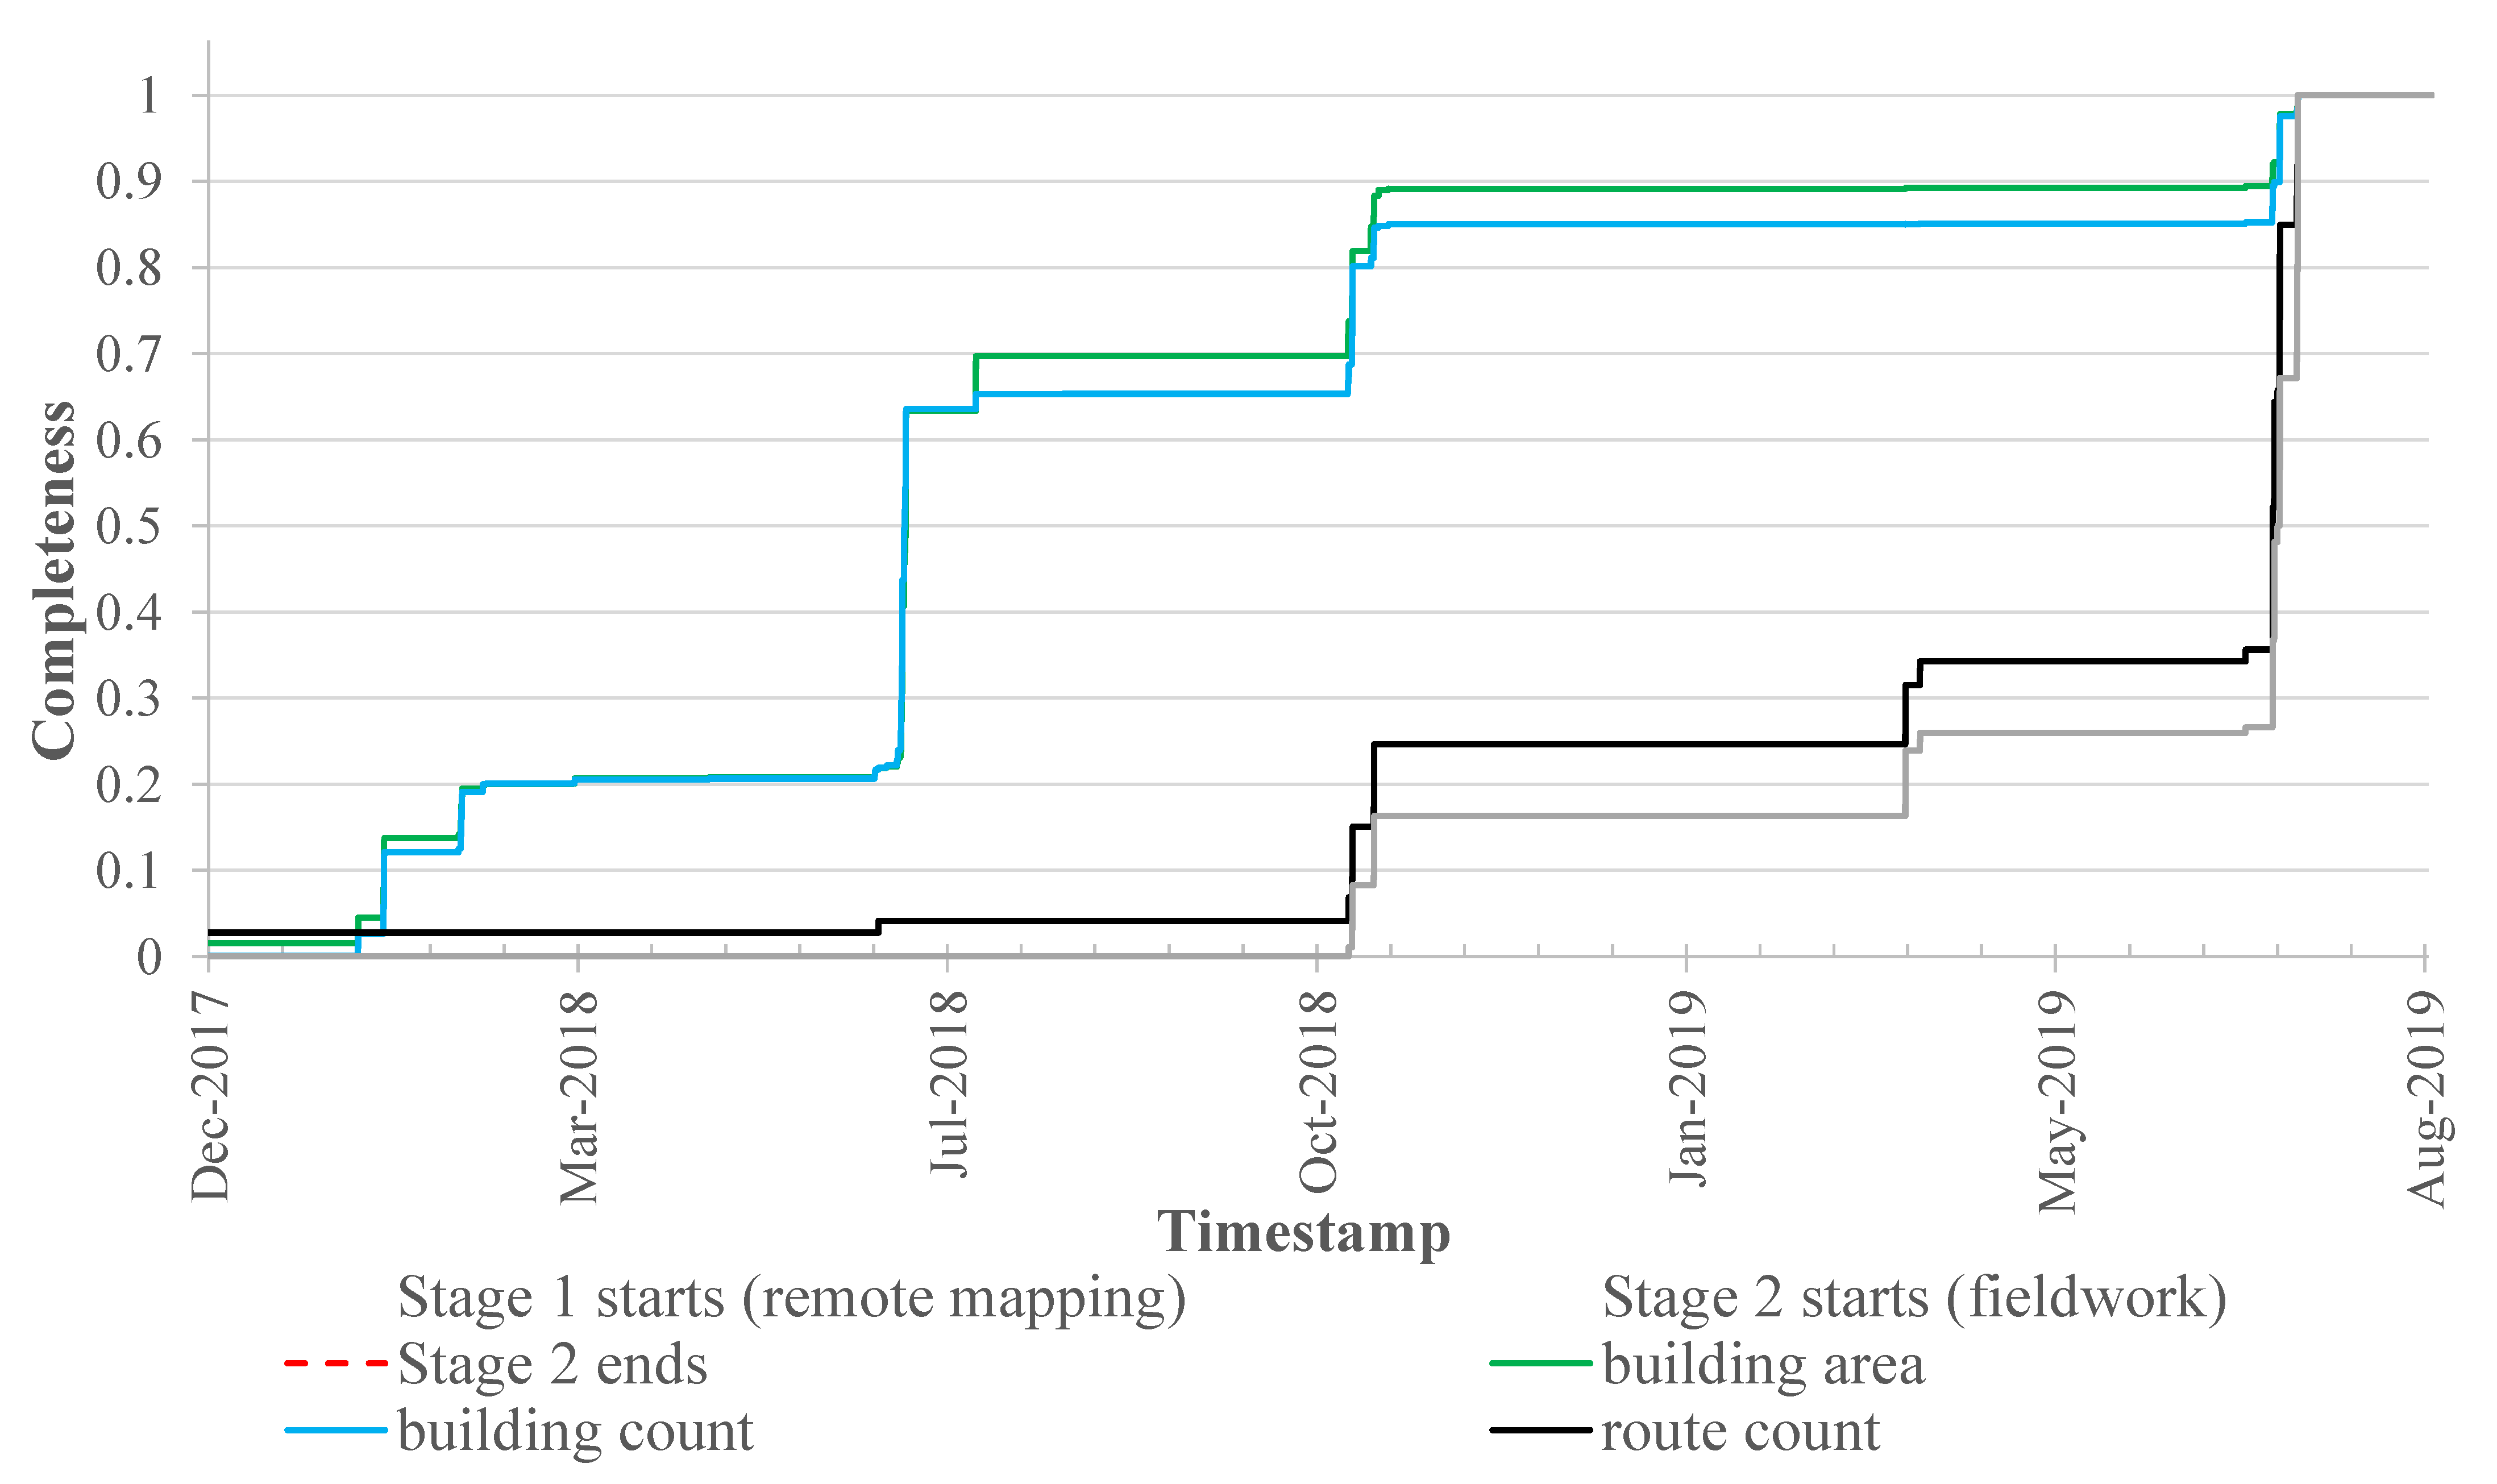
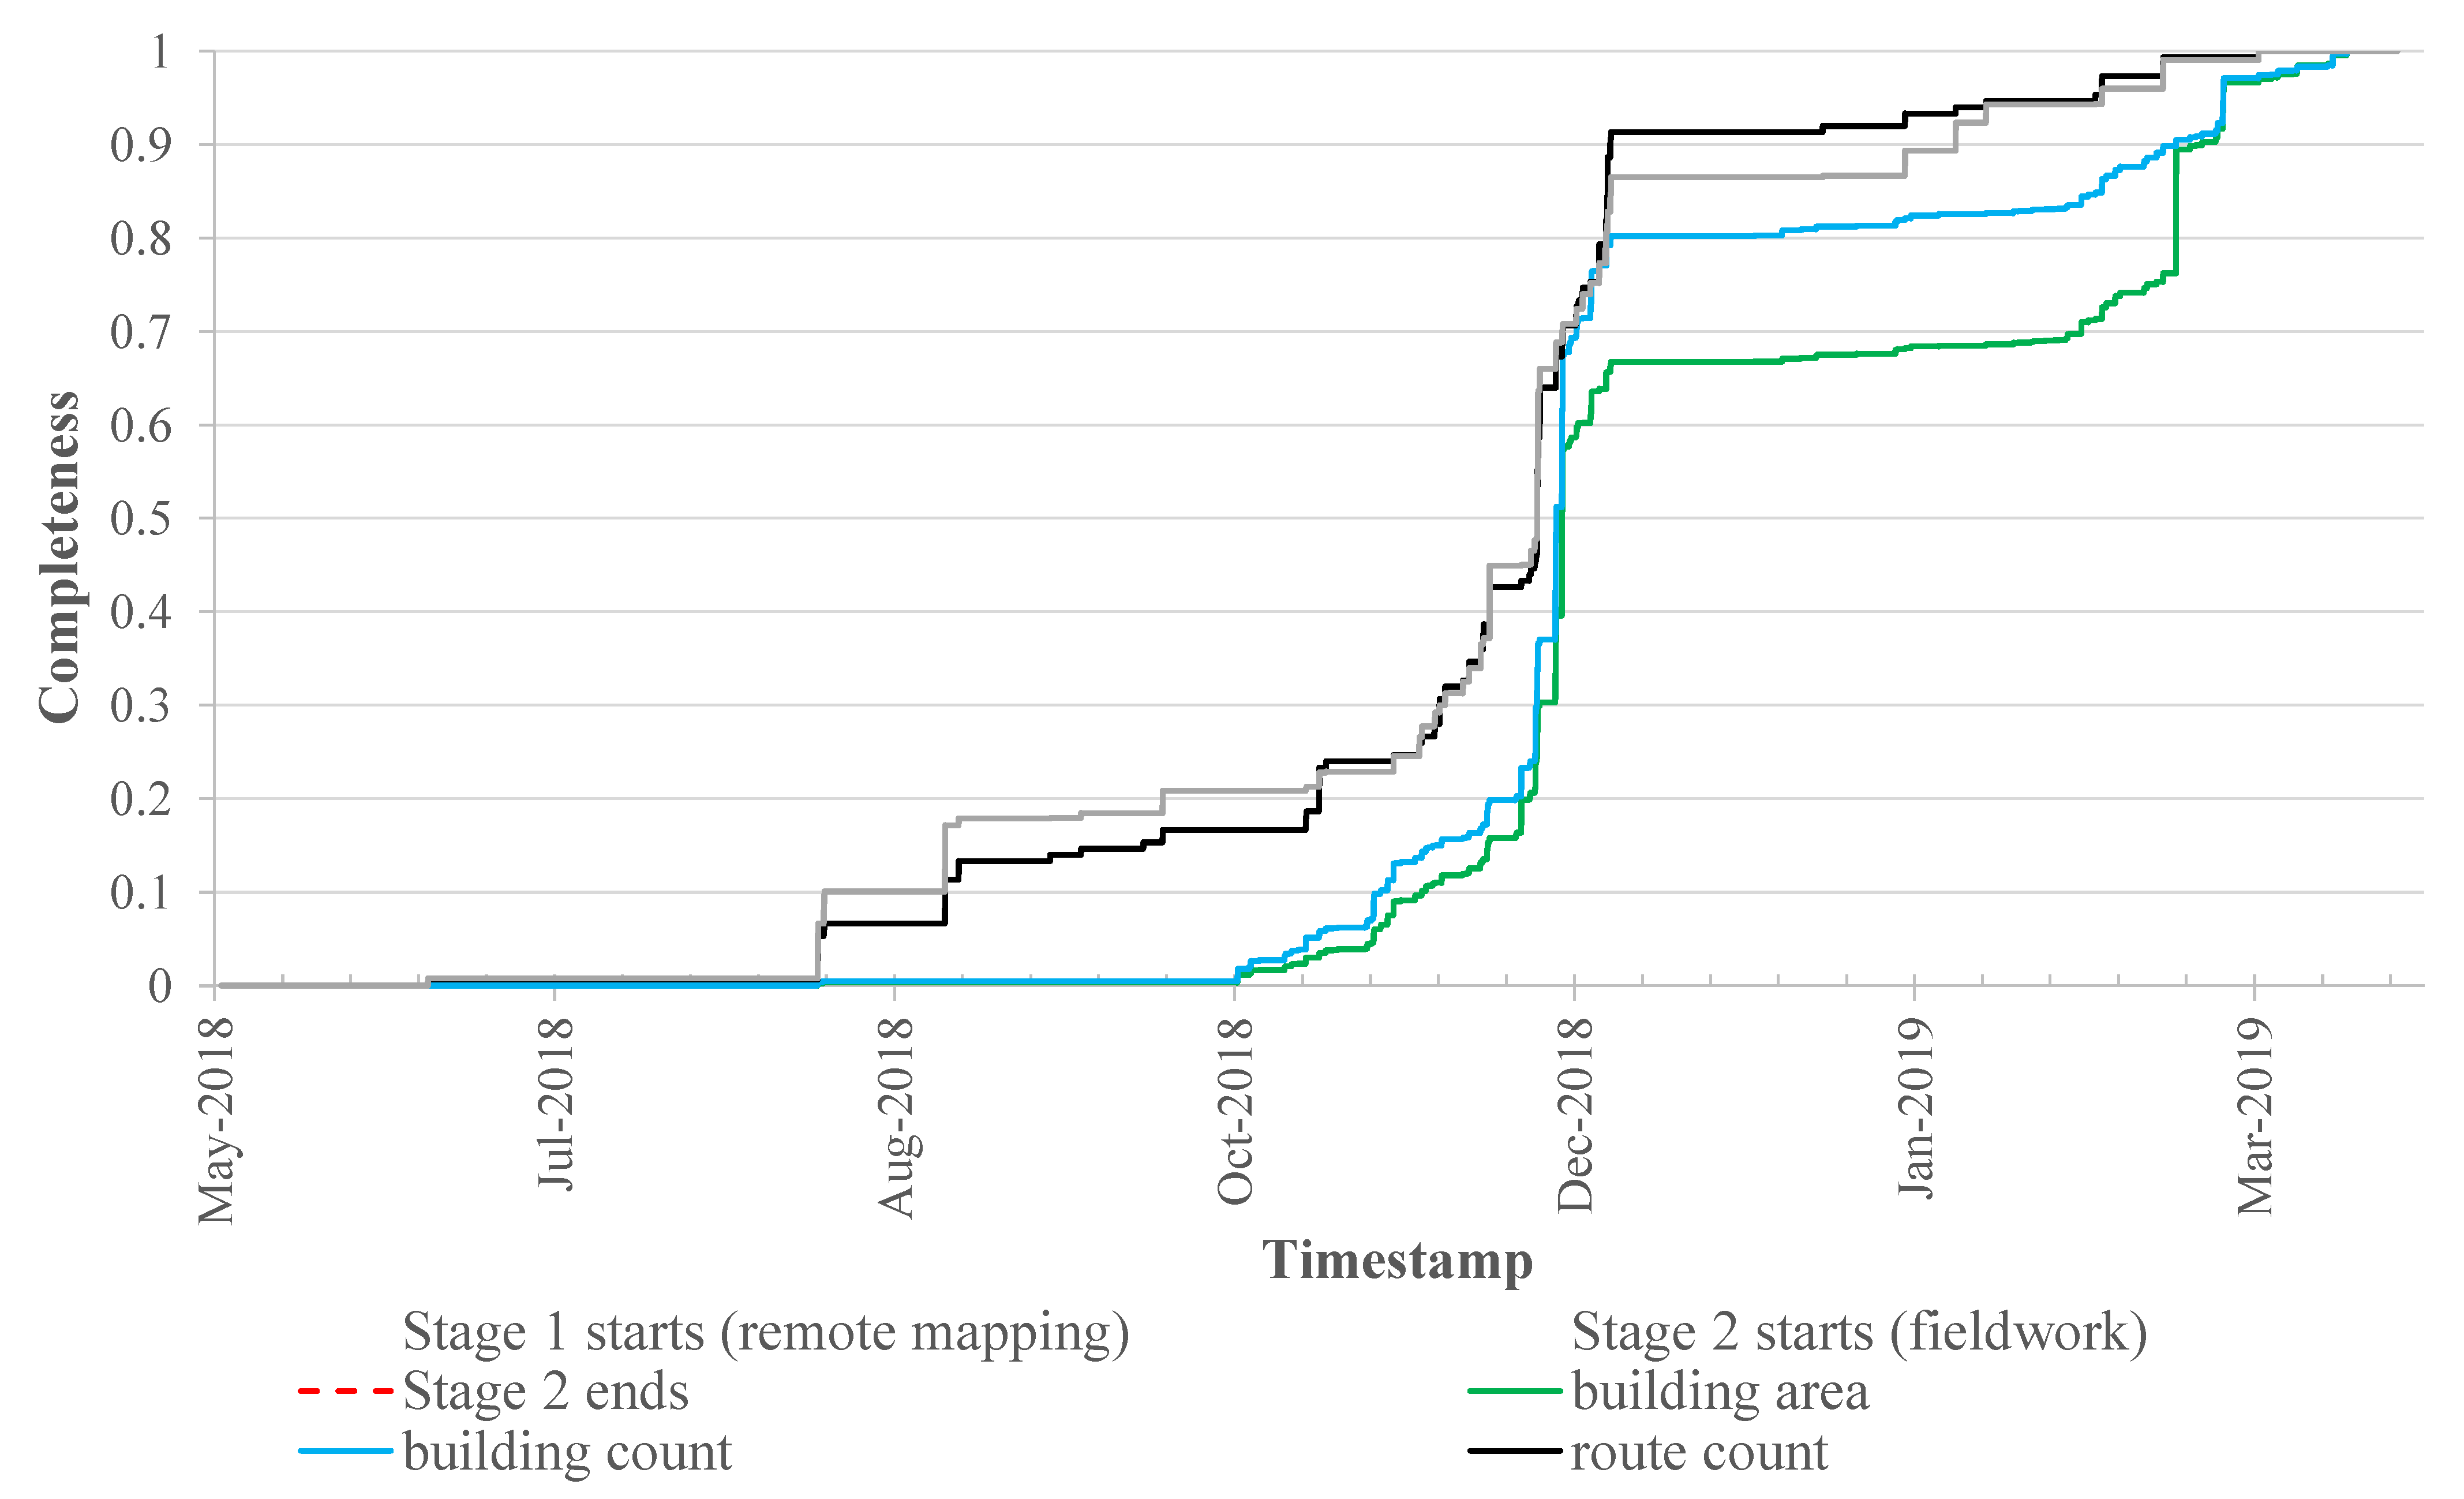
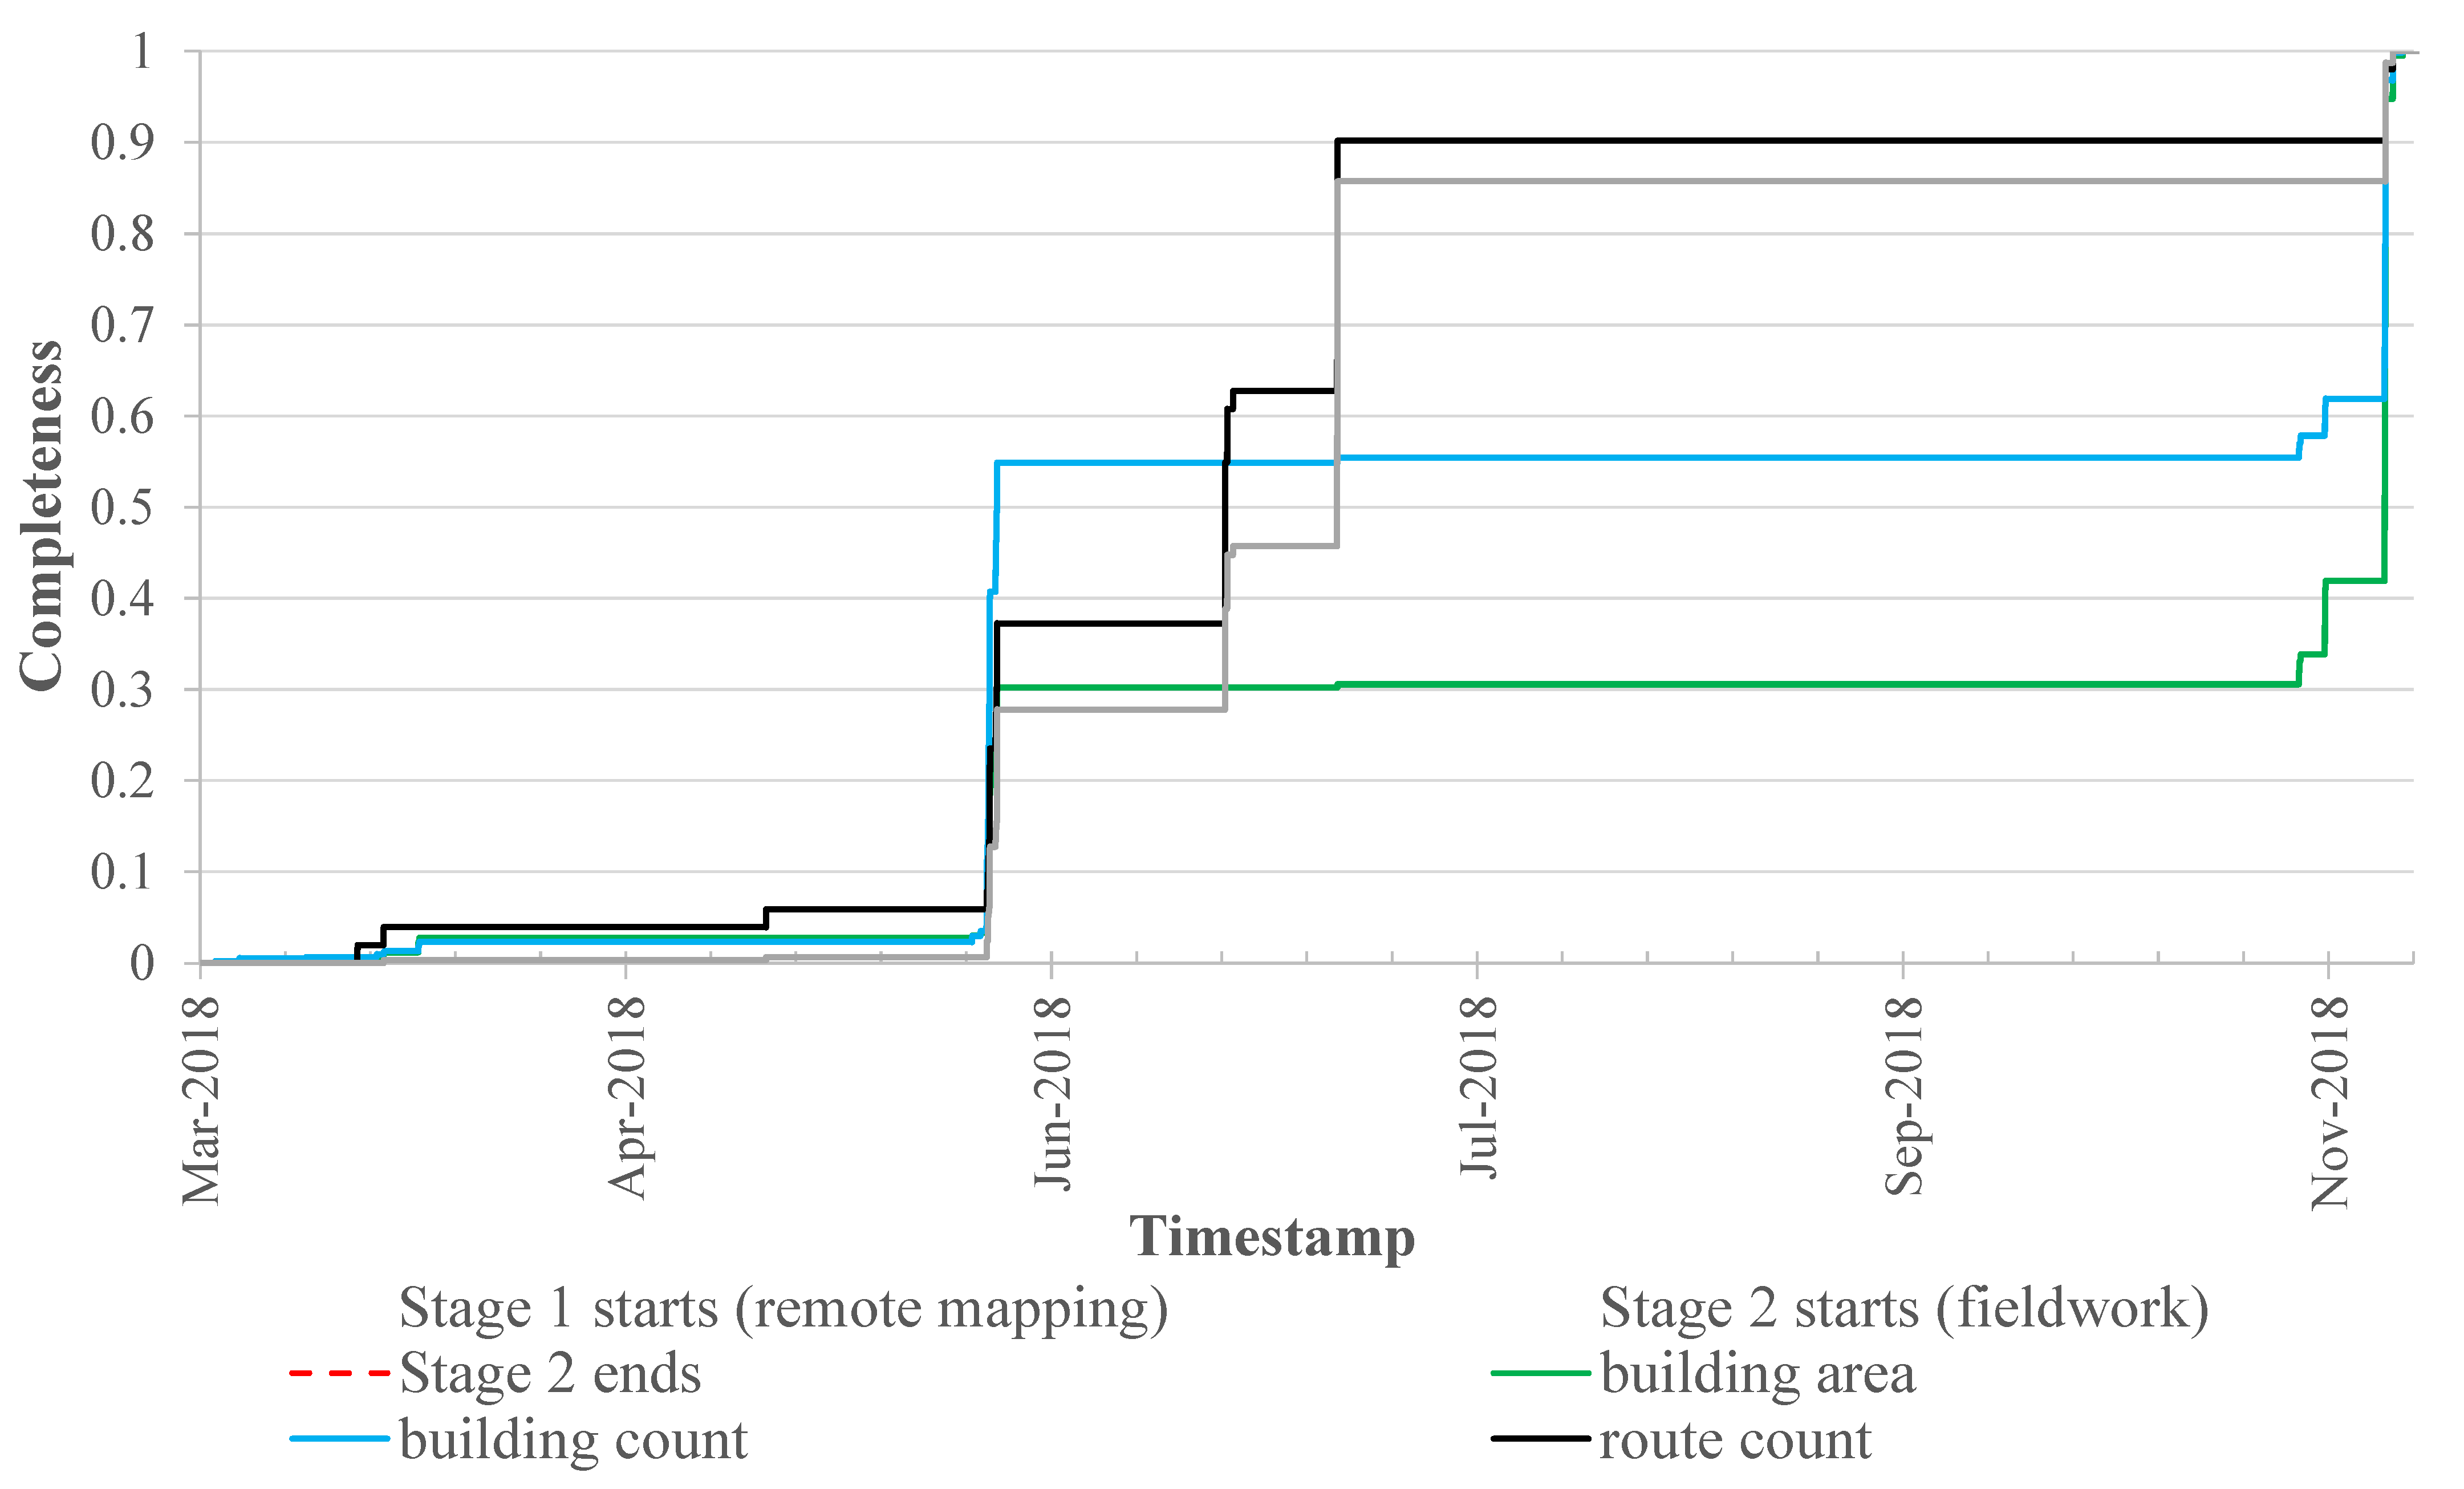
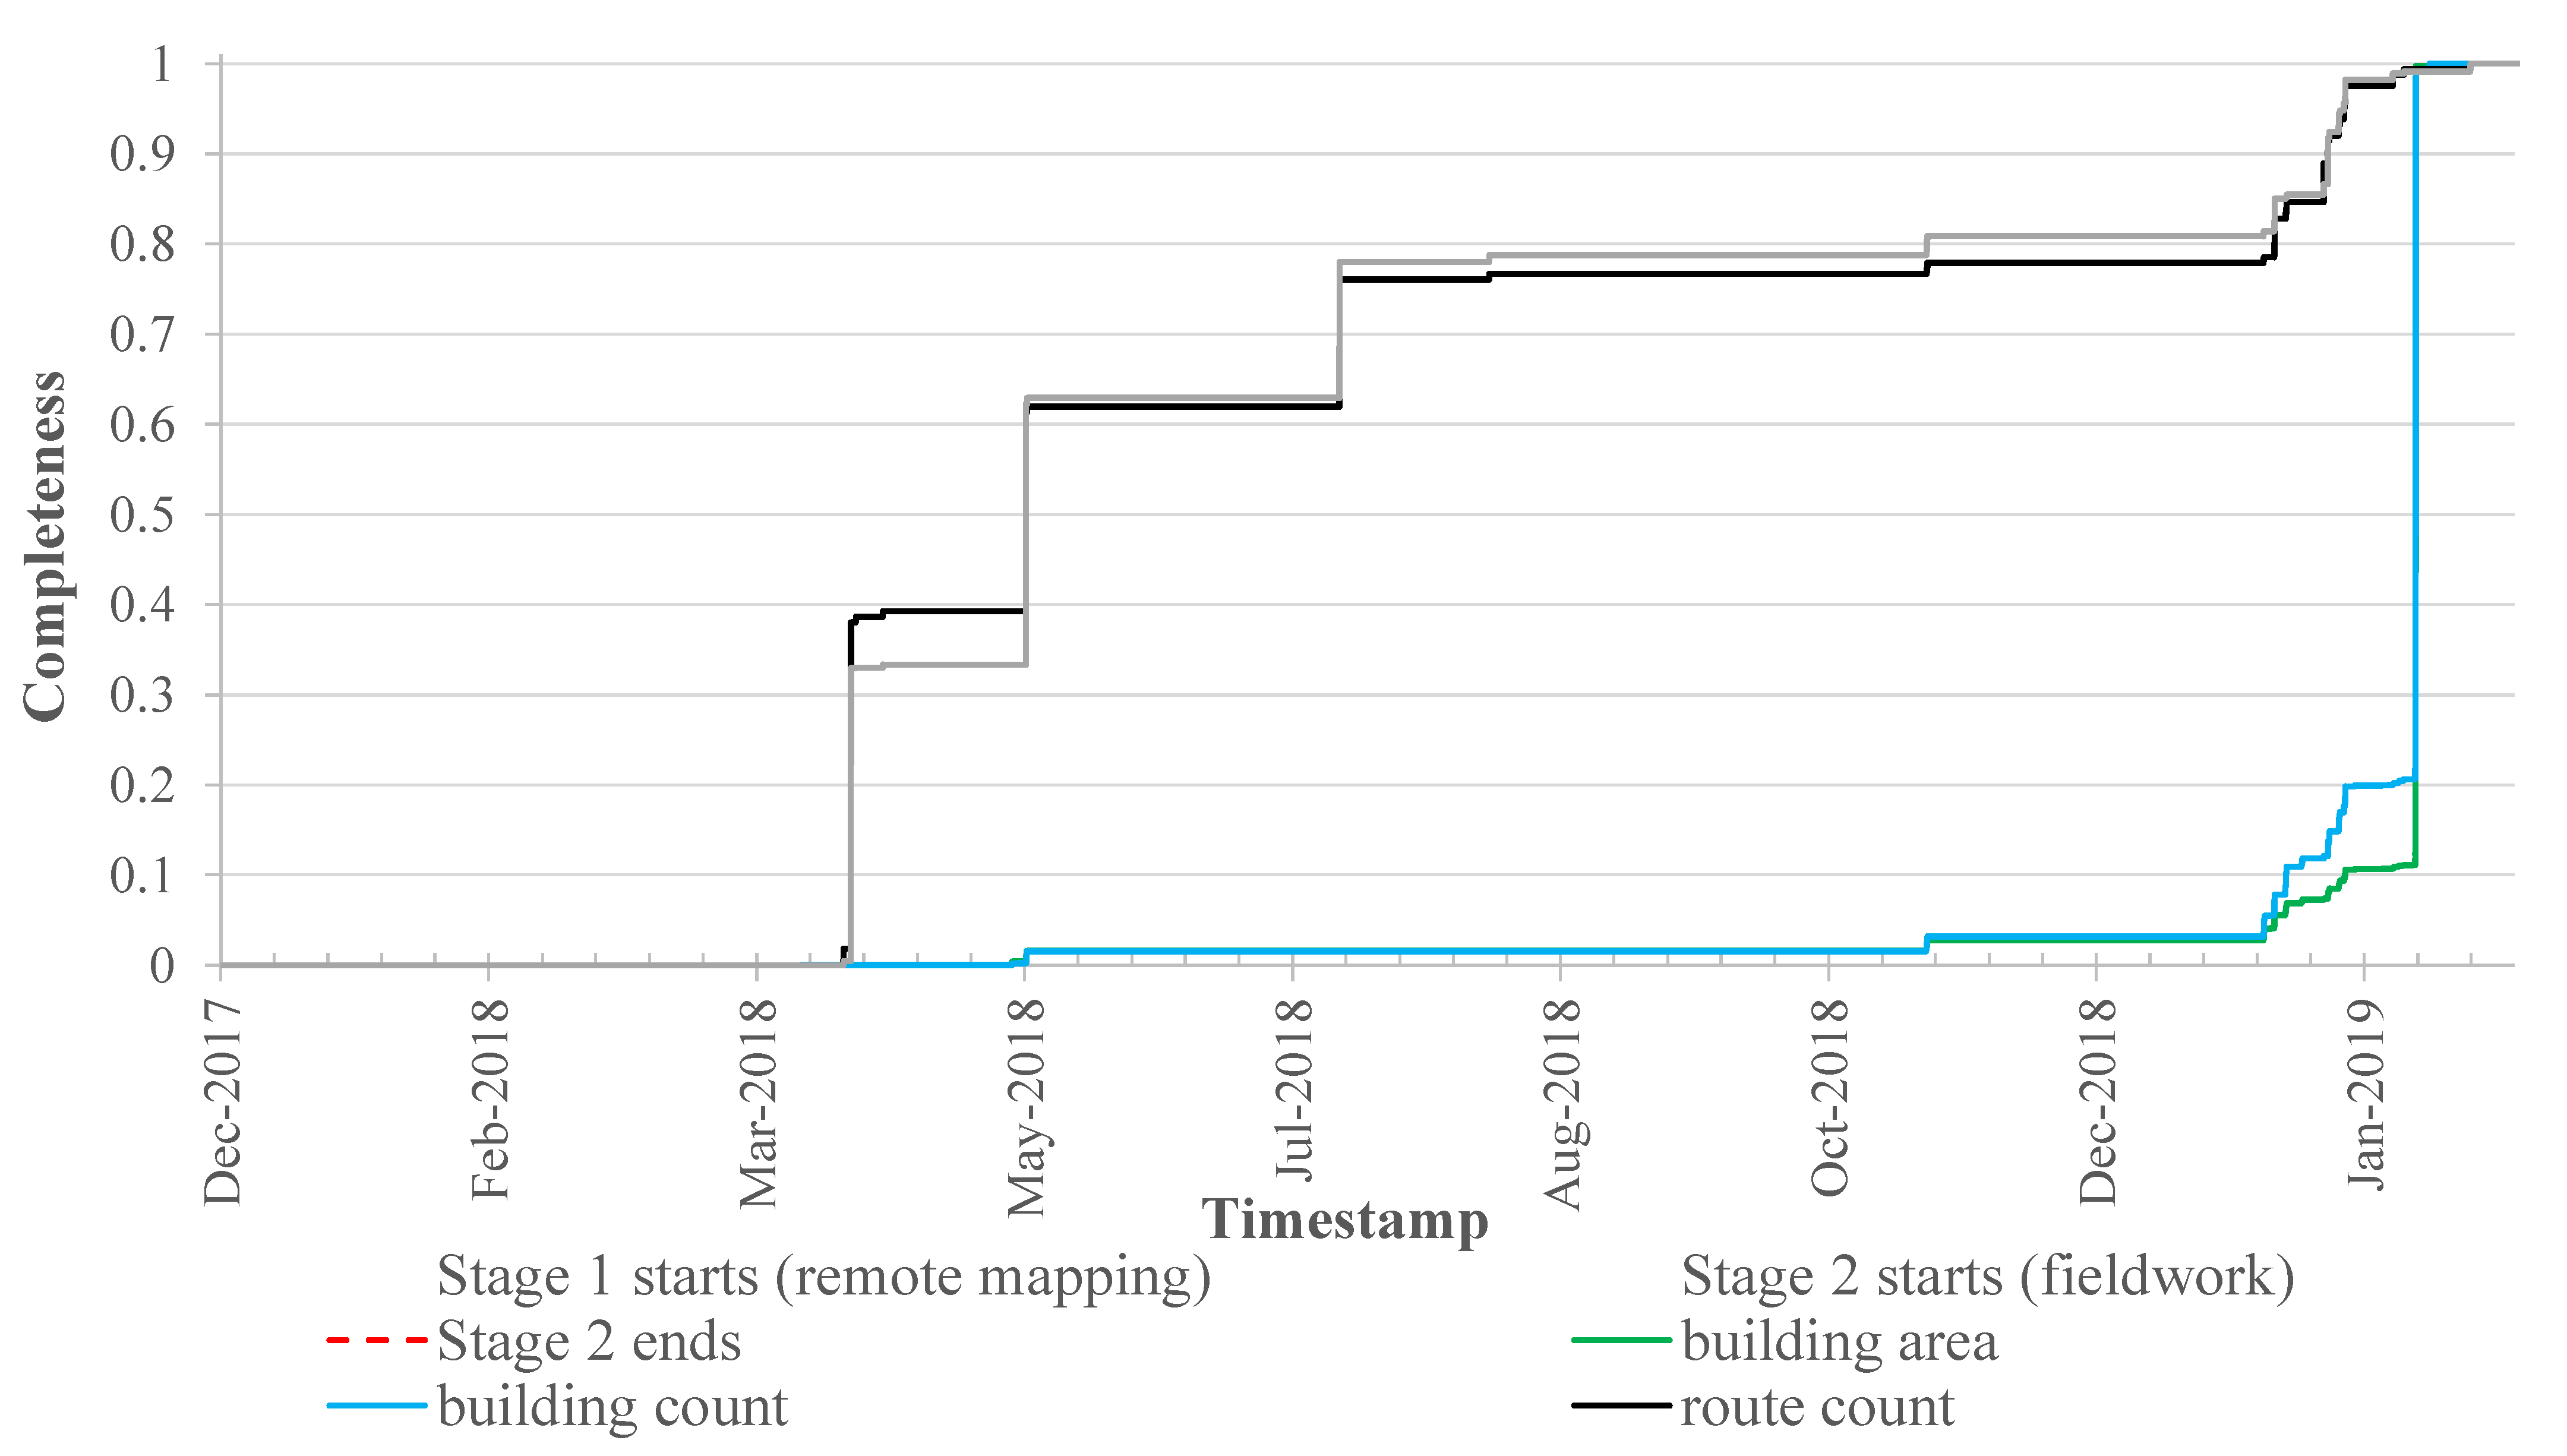
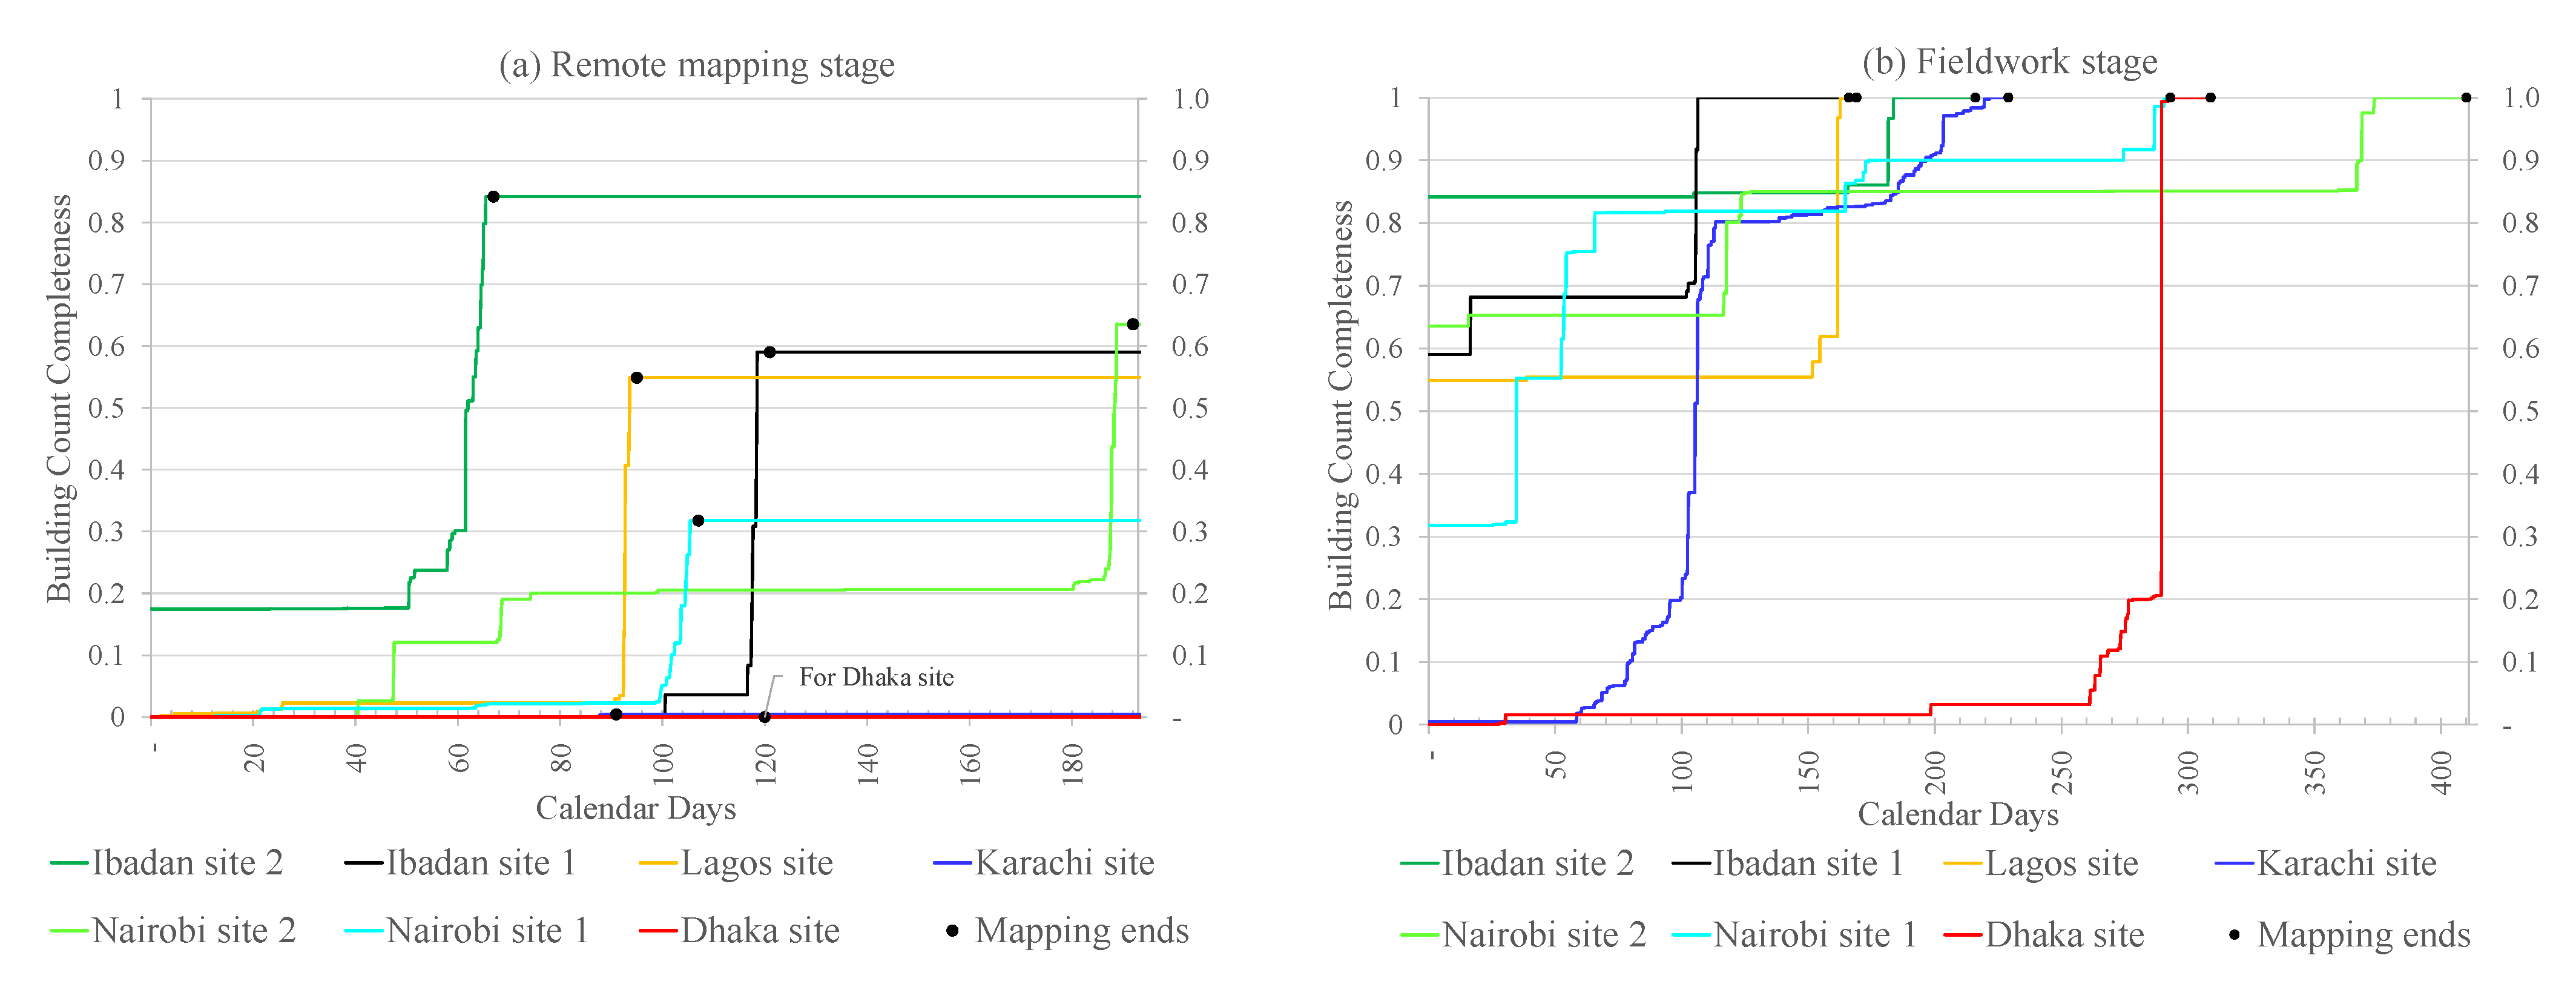
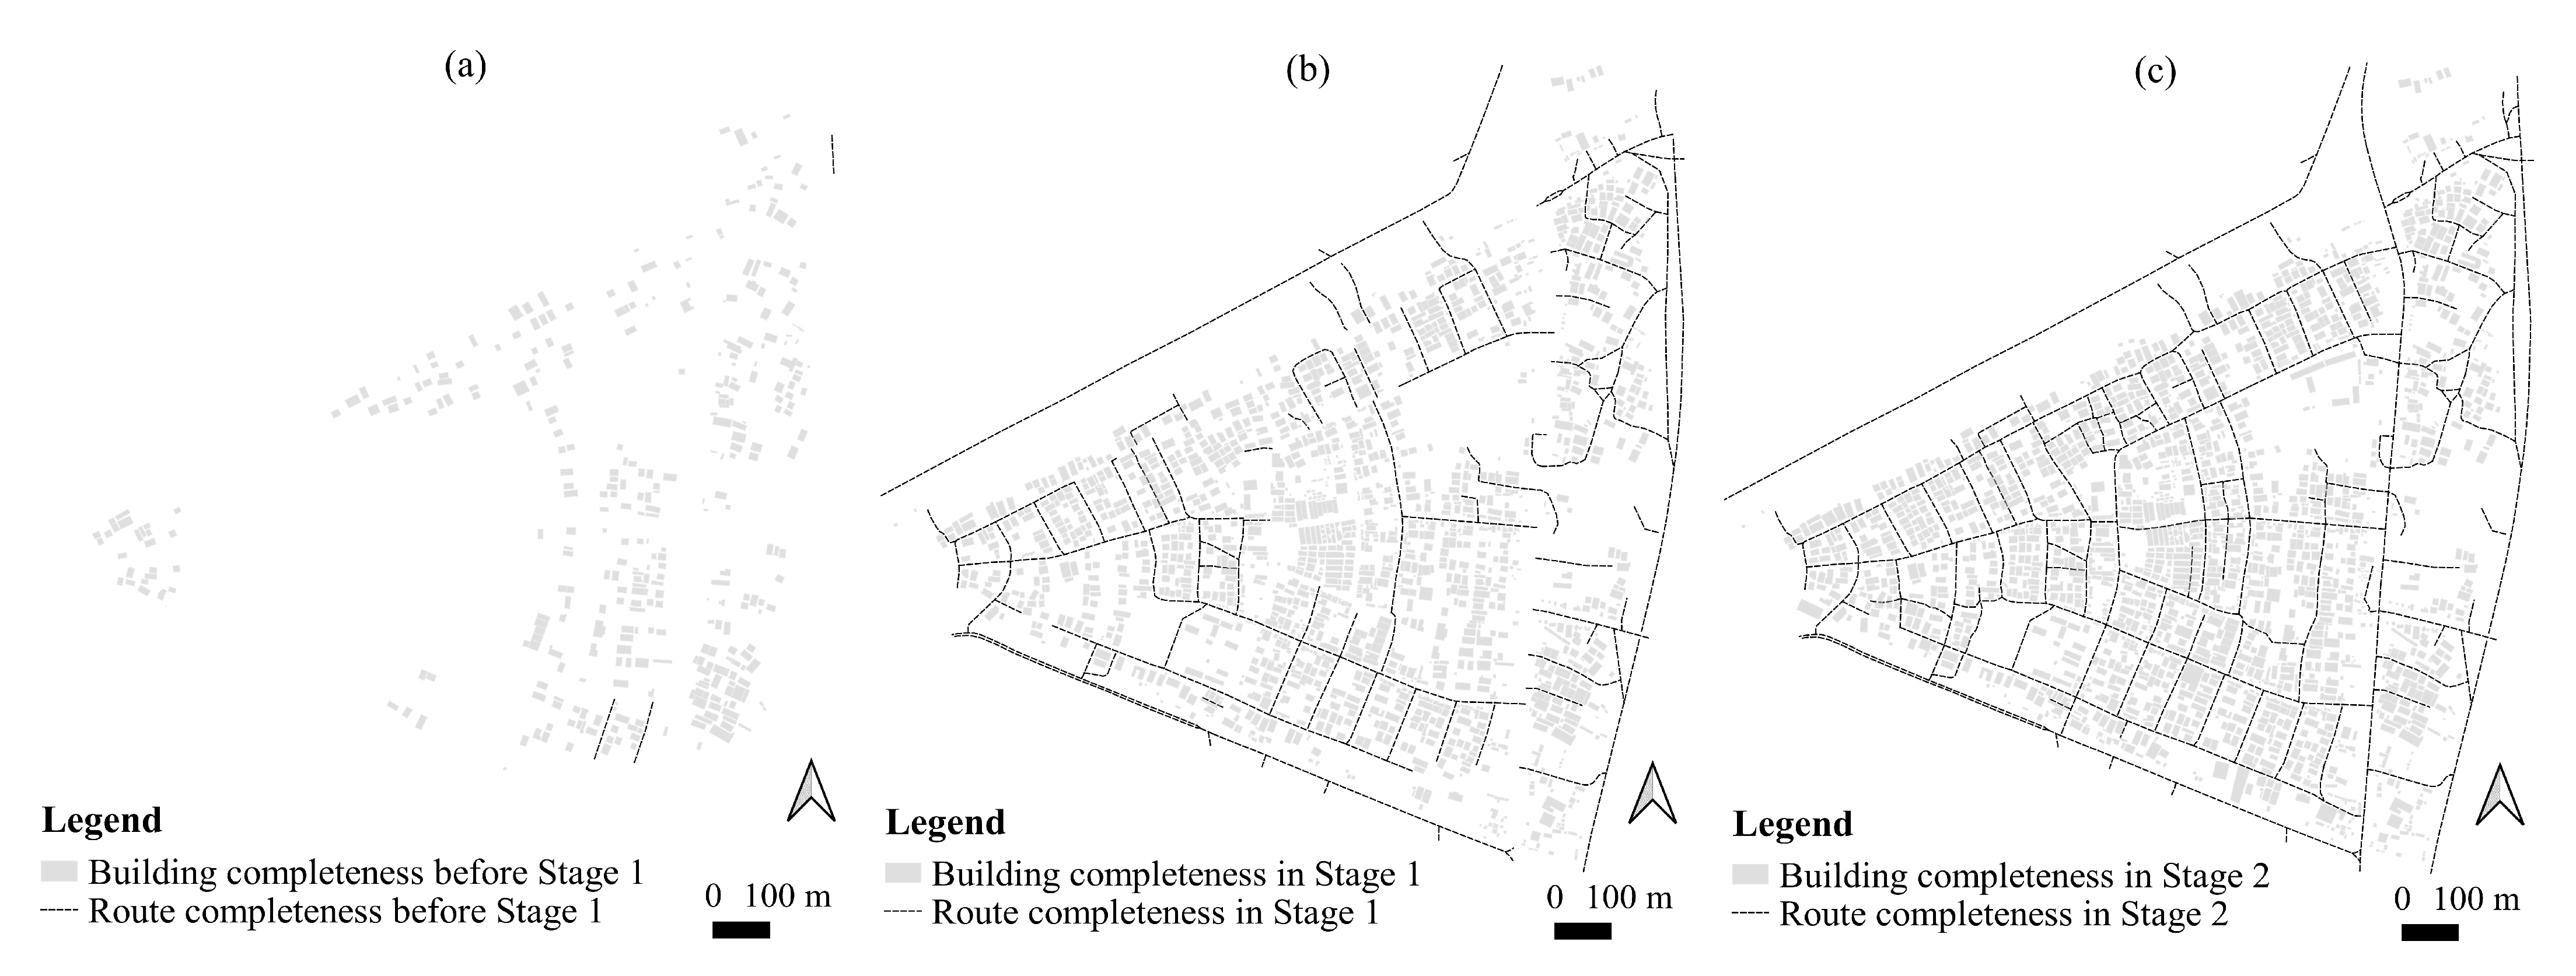
4.1. Completeness of Buildings and Routes

Figure 5 shows the completeness of buildings during the mapping stages in all the seven slums. The results provide empirical evidence suggestive of the possibility to achieve up to 84% building completeness during remote mapping of some slums. In this case, for the slums in Asia, Karachi site, and Dhaka site, no building completeness was achieved which means none of the remotely mapped buildings was used in the updated map after fieldwork (or all of them had to be corrected). At the time of remote mapping, Karachi site was characterized by complex rooftop architecture, making it difficult for mappers to interpret satellite imagery and digitized building footprints. The rooves were mainly concrete and made up of other small structures. This meant that almost all buildings had to be edited during Stage 2 (fieldwork). Dhaka site had "extreme" building density, which meant that buildings were close to each other, impeding satellite imagery interpretation and digitization of building footprints. Except Karachi site, the slums had mostly roofing sheets and relatively well defined building footprint interpretation in which Dhaka site was the worst case. Ibadan site 2, unsurprisingly, achieved the highest completeness during remote mapping due to its clear layout which had not changed substantially from its resettlement layout for the past few decades. Overall, during remote mapping, Ibadan sites 2 and 1 achieved the highest completeness of 84% and 59% respectively. In the case of the two slums in Asia, Stage 2 mapping was essential in achieving 100% completeness as shown in Figure 5b.
Figure 6 shows the completeness of routes during the mapping stages in all the seven slums. The results provide empirical evidence suggestive of the possibility to achieve up to 73% route completeness during remote mapping of slums. Graphs showing how route count completeness compares with route length completeness are presented in Appendix A (i.e., Figure A1, Figure A2, Figure A3, Figure A4, Figure A5, Figure A6 and Figure A7). Additionally, graphs showing how building count completeness compares with building area completeness are presented in Appendix A using the same figures showing route count versus length comparisons. The next section presents completeness growth per mapper at each mapping stage showing results of disparities in completeness growth using all four completeness definitions outlined in Section 3.4.
Figure 7 shows sample completeness maps of Ibadan site 2 which achieved the highest building and route completeness. Figure 7a shows that prior to remote mapping (Stage 1) in this study, there was some level of completeness for buildings and routes although not at the desirable level required for any serious work or decision-making. Another contrasting sample completeness map is shown in Figure 8 using Karachi site, which achieved nearly zero building completeness in Stage 1.

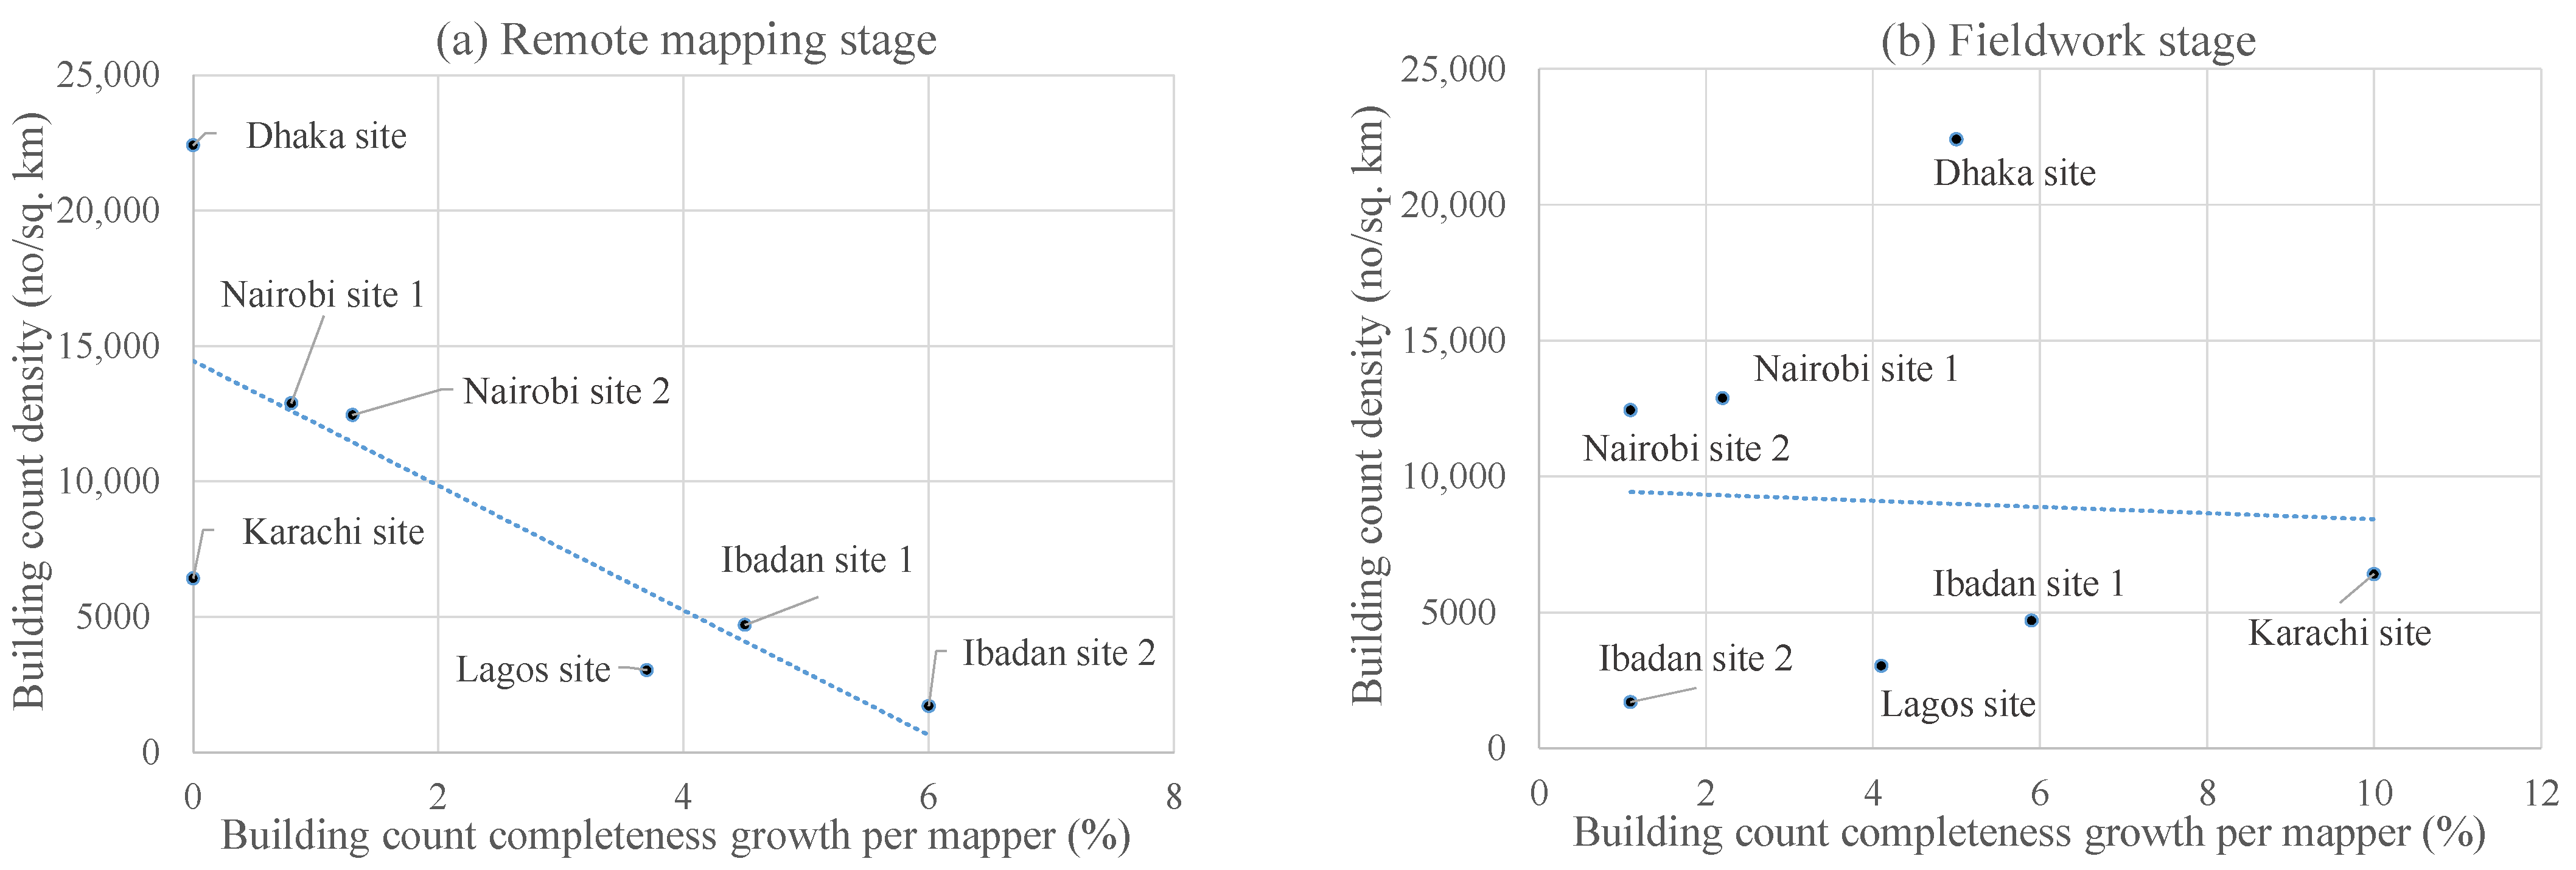
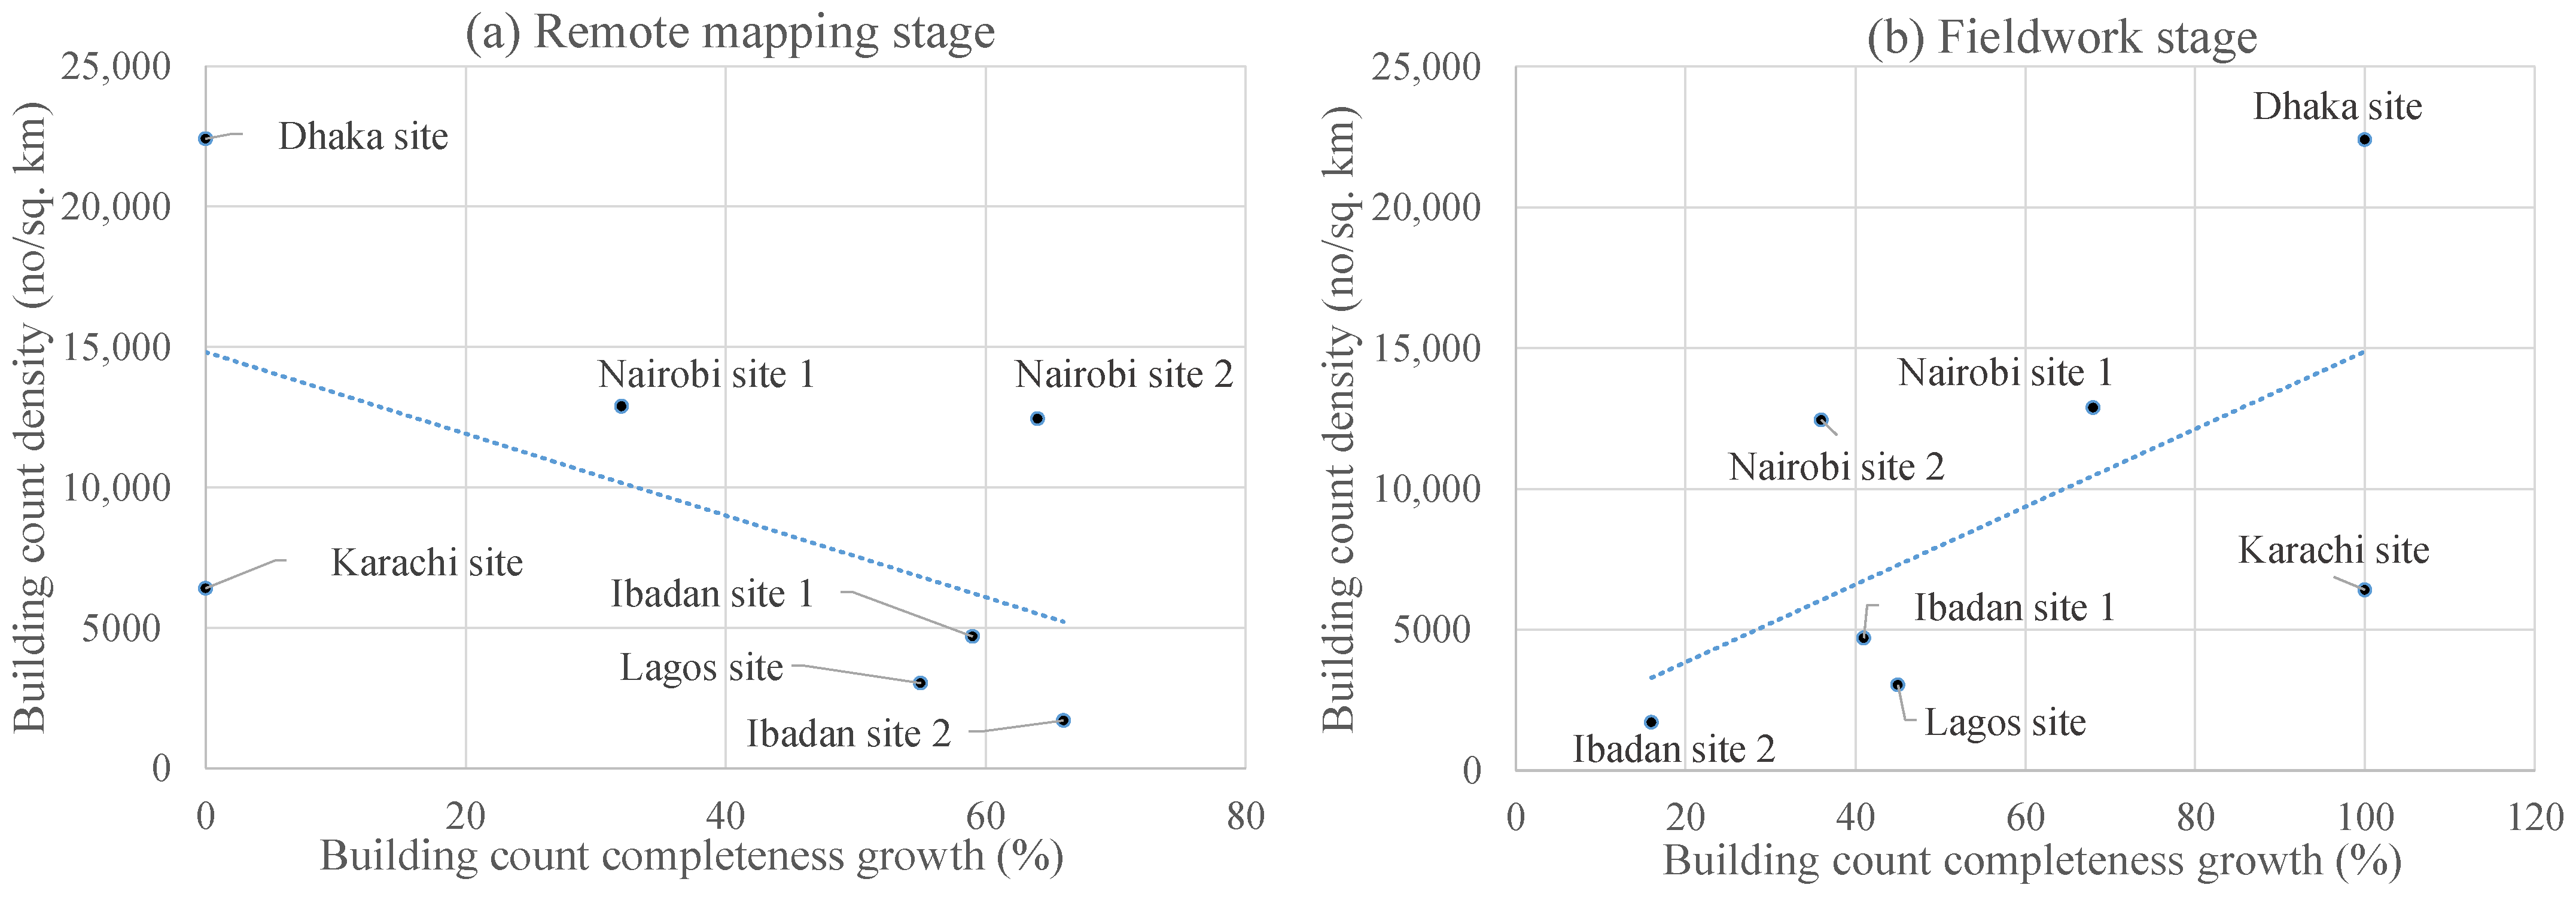
4.2. Completeness Growth per Mapper at Each Mapping Stage

We used the number of mappers per stage shown in Table 2 together with the completeness growth estimates in Table 3 to compute completeness growth per mapper per stage in Table 4. Only mappers who edited during a stage were counted and used for the calculation. Slum residents mapped Nairobi sites after prior training by the project team. Mostly experienced OSM mappers mapped Dhaka site; these mappers were already using OSM tools to update the database for other areas prior to remote mapping as part of our study. A mix of local and remote mappers including some slum residents mapped Karachi site. Postgraduate students mostly mapped slums in Nigeria. All inexperienced mappers who had not been exposed to OSM mapping techniques received training prior to remote mapping.
Ibadan site 2, with the least building density of 1706 buildings per sq. km, achieved maximum building completeness growth of 66% during remote mapping (Stage 1). Conversely, Dhaka site, which has the highest building density of 22,407 buildings per sq. km, achieved zero building completeness growth during remote mapping (Stage 1). This trend also applies to completeness growth contribution per mapper at Stage 1. Building completeness growth contribution per mapper in Ibadan site 2 during remote mapping (Stage 1) was nearly 4% (maximum) and zero in the case of Dhaka site. Building completeness growth per mapper during remote mapping was zero percent for both slums in Asia. These results suggest that there are contextual factors that influence the extent to which mappers can contribute to completeness growth. The differences in the study areas was partly due to the degree of complexity of morphological features (i.e., building density) and the inability to interpret correctly building footprints due to complex rooftop architecture), but there may be other contextual factors that need further exploration in future studies. Further work is needed to investigate factors influencing the heterogeneous nature of completeness growth estimates across sites. As noted in a recent study [14], due to the possible variation in building density in urban areas, there is a need to develop a method to “adaptively establish the mathematical relationship between OSM building density and OSM building completeness”.
A recent study [14] in non-slum areas has shown that it is possible to achieve about 69% linear relationship between building completeness and building density based on an extrinsic approach; no consideration was given to building completeness growth and number of mappers. Figure 9a shows a better linear relationship between building count completeness growth per mapper during remote mapping (Stage 1) and building density with two outliers (Dhaka site and Karachi site), when compared with Figure 9b. The same trend was realized in terms of building area completeness. The results in Table 3, Table 4, Figure 9, and Figure 10) suggest that there should be no expectation of any mapper’s contribution to building completeness at the remote mapping stage in “extremely” complex morphological conditions (e.g., the two outliers) and there are other explanatory factors that future research needs to explore to understand the distinction across stages regarding a density versus completeness-growth relationship. The new “field” knowledge gained and used during field mapping may have influenced the distinction across stages. For example, regarding building density versus building completeness-growth relationship, the identified two “extreme” conditions (i.e., the two outliers; complex rooftop architecture and high density) are less impactful at Stage 2. As shown in Table 2, the total number of mappers differed across stages in all the sites and the difference in mappers’ experience gathered in the course of mapping may differ which in turn may influence buildings and routes completeness-growth contribution behavior (future work should look into this). Additional analysis showed an increase in the linear relationship between building density and building completeness growth without consideration to the number of mappers (Figure 10). The same was not found for routes and future work should investigate these differences further. Moreover, the relationship between route count completeness growth per mapper and route density in both stages does not show a linear trend (Figure 11). However, it is important to note that given that the sample sizes (number of data points) for generating Figure 9, Figure 10, and Figure 11 are small, these relationships described are only indicative and we are not claiming that the relationship between the variables is statistically significant (which should be investigated in future work).

5. Discussion and Conclusions

This study has for the first time presented empirical evidence on completeness of data on buildings and routes of seven different slums in four countries across Africa and Asia at different stages of a systematic OSM-based participatory mapping process. The following research question was explored: What is the spatial data quality of collaborative remote mapping achieved by volunteer mappers in morphologically complex urban areas? In addressing this question, we focused on the possible extent to achieve completeness during remote mapping of slums based on field data; completeness growth during remote (and field) mapping of slums; and completeness growth contributions per mapper during remote mapping and fieldwork while providing additional perspective on how they relate with the density of buildings and routes. This section frames the discussion and conclusion in terms of collaborative remote mapping and spatial data quality of morphologically complex urban areas, lessons learnt from the mapping process, and limitations of the study and future outlook.

5.1. Collaborative Remote Mapping and Spatial Data Quality

The results presented in this study could provide insights into how much fieldwork would be needed in what kind of complexity and to what extent the involvement of local volunteers in these efforts is required. The major scientific contribution of this study is on the spatial data quality of remotely mapped data through volunteer mapping efforts in morphologically complex areas. This study advances our understanding of spatial data quality dimension in humanitarian remote mapping collaboration, providing a foundation for the improvement and use of OSM in future transdisciplinary studies in health and other fields. Humanitarian OSM-based collaborative mapping projects are exclusively based on digital imagery of the mapped areas, but this type of remote mapping may produce an uncertain data quality [11], since the mappers may not have the tacit knowledge on the local spatial context. There is an emergence of multiscale crowdsourced digital maps to help inform equitable urban planning where local knowledge is paramount for critical decision-making [48]. In this study, it has been shown that even with the local knowledge of local mapping teams, data quality is still not one hundred percent achievable in the remote mapping stages. This finding raises further questions, such as to what extent can data emerging from remote mapping should be trusted. In some cases, it is impossible to trust the generated data from remote mapping, such as areas with complex rooftop architectures (e.g., Karachi site) and extreme building density (e.g., Dhaka site). The influence of rooftop architectures and density in this study is in line with other studies suggesting that roof characteristics (e.g., surfaces, and densities) can pose a problem when mapping complex morphological features where systematic studies on slum mapping are encouraged [3]. The findings in this study show that it is possible to achieve completeness during remote mapping of slums for buildings (up to 85%) and routes (up to 73%) for sites with morphology that are more regular with less building density. The contribution to spatial data quality per mapper varied considerably across sites, reaching a maximum of 6% at the remote mapping stage and a maximum of 10% at the fieldwork stage. This finding is relevant within the context of humanitarian remote mapping of morphologically complex urban areas, like slum environments, where the completeness of the generated map is generally unknown. This study may therefore be used as a guide for future investigations on the expected contribution of individual mappers.

5.2. Lessons Learnt from the Mapping Process

This study employed a systematic OSM-based mapping approach for the production, curation, and analysis of volunteered geographic information (VGI) on urban communities based on a combination of collaborative satellite-imagery digitization and participatory mapping which relies upon geospatial open-source technologies and the collaborative mapping platform OSM. Findings across Stages 1 and 2 show that our method generated promising completeness results: particularly showing the heterogeneous nature of completeness growth during remote mapping. The participatory mapping process is reproducible given that the same mapping workflow and open-source technologies were used across all the study sites with different mapping teams. However, the process still requires technical expertise and future work should focus on optimizing the integration of the tools used to make it easier to implement for survey research. It is important to note that the overall goal of the mapping approach that we designed and implemented was to produce a high-quality spatial data sampling frame for a health survey and research in slums. Some of the lessons learnt are as follows.
Careful training of volunteer mappers on mapping tools is essential for the success of implementing OSM-based mapping for slum health surveys and research. The use of portable Global Positioning System (GPS) devices alone did not work at the household level during field mapping. In this study, GPS location functionality in the tablet was used as a guide along with the FieldPapers for orientation and identification of the actual building structure pre-loaded in the tablet as tiles. The use of FieldPapers played a key role in data collection and cleaning. FieldPapers served as a reference for solving any building identification disputes. Using the FieldPapers technology requires careful planning but ensures that buildings are identified and coded correctly as well as scanned properly to make it easier to upload and link to OSM editors for conflation. In this study, a 13-digit code was used to ensure unique structure codes. Routes are easy to interpret, useful in the field, and must always be mapped during remote mapping to facilitate fieldwork. Where the interpretation of satellite imagery is difficult during remote mapping (Stage 1), it is best not to attempt to map the individual buildings but to focus on well-known monuments (e.g., churches, mosques, and police stations) for orientation together with the mapping of routes. Online mapping of road networks and well-known monuments proved very useful for orientation in the field in this study. The rooftop architecture of building structures can create difficulties during mapping, and it is essential that consensus is reached regarding their interpretability prior to setup for remote mapping on Tasking Manager. Another important consideration is the security of mappers in the field; this could be ameliorated by working with the slum residents and community leaders. Although it is less unanticipated that experienced OSM-mappers in developed urban areas can generate high-quality data [49], our observations of the mapping process (as well as results from the quantitative analysis in this study) suggest that inexperienced but trained OSM-mappers in slums can also produce high quality data.

5.3. Limitations of the Study and Future Work

The study is limited by the scope, which is about slums. There is likely to be a plethora of other potential open-source technologies, which could have been extensively tested and used; familiarity with the technologies influenced the design and choices. Future work should examine how mappers (especially slum residents) perceive such mapping processes, sociodemographic profiles of mappers, and attribute accuracy to deepen our understanding of slum mapping for health research. Future research should look at methods for auto-defining the different stages of participatory mapping by using online mapping platforms to provide the basis for conducting a comparative systematic study of data quality at different geographic regions. Initial consideration could be to use the remote mapping period on HOT Tasking Manager as Stage 1 and explore OSM Changesets to identify data-source declarations and determine a Stage 2 timeframe. Such an endeavor will require a careful and systematic approach throughout the mapping stages to ensure explicit identification of objects and their validation. Although this study partly contributed to the temporal quality (another quality element looking at the validity of changes in the database in relation to real-world changes and also the rate of updates [22]), based on the completeness growth estimates, future work could examine the actual rate of modifications (e.g., deletes) and how they are reflected in space. Another possibility for future studies is to explore the remaining quality elements by considering their evolution across the two stages. Other emerging research is the use of participatory mapping and automated methods (e.g., machine learning) for structure detection and population estimation within slum regions. It is important to note that the participatory mapping approach used in this study is part of many approaches for slum mapping, which should be ideally combined towards an integrated deprived area “Slum” mapping system in the Global South [2]. Additionally, we see the current work as a step for the improvement of OSM-based workflows and mapping tools in support of a methodological framework for geospatial mapping of health and wellbeing in urban poor areas. Such improvement can facilitate impactful and potential future collaboration with local partners, OSM community, and other researchers for data production, usage, and analytics.

Author Contributions

Conceptualization, Godwin Yeboah and João Porto de Albuquerque; Methodology, Godwin Yeboah and João Porto de Albuquerque; Software, Rafael Troilo, Godwin Yeboah, and Shanaka Perera; Formal Analysis, Godwin Yeboah and João Porto de Albuquerque; Data Curation, Godwin Yeboah; Writing—Original Draft Preparation, Godwin Yeboah; Writing—Review & Editing, Godwin Yeboah, João Porto de Albuquerque, Grant Tregonning, Rafael Troilo, Shanaka Perera, Syed A. K. Shifat Ahmed, Motunrayo Ajisola, Ornob Alam, Navneet Aujla, Syed Iqbal Azam, Kehkashan Azeem, Pauline Bakibinga, Yen-Fu Chen, Nazratun Nayeem Choudhury, Peter J. Diggle, Olufunke Fayehun, Paramjit Gill, Frances Griffiths, Bronwyn Harris, Romaina Iqbal, Caroline Kabaria, Abdhalah Kasiira Ziraba, Afreen Zaman Khan, Peter Kibe, Lyagamula Kisia, Catherine Kyobutungi, Richard J. Lilford, Jason J. Madan, Nelson Mbaya, Blessing Mberu, Shukri F. Mohamed, Helen Muir, Ahsana Nazish, Anne Njeri, Oladoyin Odubanjo, Akinyinka Omigbodun, Mary E. Osuh, Eme Owoaje, Oyinlola Oyebode, Vangelis Pitidis, Omar Rahman, Narjis Rizvi, Jo Sartori, Simon Smith, Olalekan John Taiwo, Philipp Ulbrich, Olalekan A. Uthman, Samuel I. Watson, Ria Wilson, and Rita Yusuf; Visualization, Godwin Yeboah; Supervision, João Porto de Albuquerque and Godwin Yeboah; Project Administration, João Porto de Albuquerque and Godwin Yeboah; Funding Acquisition, Richard J. Lilford. All authors have read and agreed to the published version of the manuscript.

Funding

This research was funded by the National Institute for Health Research (NIHR) Global Health Research Unit on Improving Health in Slums using UK aid from the UK Government to support global health research. The APC was funded by the same project with reference number: 16/136/87. Richard J Lilford is supported by NIHR ARC West Midlands.

Data Availability Statement

Publicly available datasets (study sites updated by mapping activities in our project) were analyzed in this study. These data and data extraction codes used can be found here:

Acknowledgments

This research was funded by the National Institute for Health Research (NIHR) Global Health Research Unit on Improving Health in Slums using UK aid from the UK Government to support global health research. The views expressed in this publication are those of the author(s) and not necessarily those of the NIHR or the UK Department of Health and Social Care. The authors would like to express gratitude to all project members for their invaluable input and to the mappers of the OSM community who were active locally and remotely in this project. To learn more, visit http://www.openstreetmap.org/copyright. We thank Diego Pajarito-Grajales for discussions. We would like to thank all the four anonymous reviewers for their constructive comments which have improved the manuscript.

Conflicts of Interest

The authors declare no conflict of interest. The funders had no role in the design of the study; in the collection, analyses, or interpretation of data; in the writing of the manuscript, or in the decision to publish the results.

Abbreviations

The following abbreviations are used in this manuscript:
OSMOpenStreetMap
VGIVolunteered Geographic Information
GPSGlobal Positioning System
ISOInternational Organization for Standardization
NIHRNational Institute for Health Research
QGISQuantum Geographic Information System
CBDCentral Business District
ODKOpen Data Kit
OMKOpen Map Kit
HOTHumanitarian OpenStreetMap Team
TMTasking Manager

Appendix A

Table A1. Time intervals of defined stages.
SiteStage 1 (Start–End Dates 1)Stage 2 (Start–End Dates 1)
Karachi site21 May 2018–19 August 201820 August 2018–05 April 2019
Ibadan site 221 January 2018–28 March 201829 March 2018–30 October 2018
Nairobi site 125 January 2018–11 May 201812 May 2018–28 February 2019
Nairobi site 221 December 2017–30 June 201801 July 2018–14 August 2019
Ibadan site 126 February 2018–26 June 201827 June 2018–12 December 2018
Lagos site02 March 2018–04 June 201805 June 2018–17 November 2018
Dhaka site20 December 2017–18 April 201819 April 2018–21 February 2019
1 These periods covers the natural progression of activities including breaks. Calendar days.
Figure A1. Completeness of buildings and routes during mapping in Karachi site.
Ijgi 10 00265 g0a1
Figure A2. Completeness of buildings and routes during mapping in Ibadan site 2.
Ijgi 10 00265 g0a2
Figure A3. Completeness of buildings and routes during mapping in Ibadan site 1.
Ijgi 10 00265 g0a3
Figure A4. Completeness of buildings and routes during mapping in Lagos site.
Ijgi 10 00265 g0a4
Figure A5. Completeness of buildings and routes during mapping in Dhaka site.
Ijgi 10 00265 g0a5
Figure A6. Completeness of buildings and routes during mapping in Nairobi site 2.
Ijgi 10 00265 g0a6
Figure A7. Completeness of buildings and routes during mapping in Nairobi site 1.
Ijgi 10 00265 g0a7

References

  1. UN-Habitat. UNHABITAT Habitat III Issue Papers-22: Informal Settlements; UN-Habitat: New York, NY, USA, 2015. [Google Scholar]
  2. Thomson, D.R.; Kuffer, M.; Boo, G.; Hati, B.; Grippa, T.; Elsey, H.; Linard, C.; Mahabir, R.; Kyobutungi, C.; Maviti, J.; et al. Need for an Integrated Deprived Area “Slum” Mapping System (IDEAMAPS) in Low- and Middle-Income Countries (LMICs). Soc. Sci. 2020, 9, 80. [Google Scholar] [CrossRef]
  3. Kuffer, M.; Pfeffer, K.; Sliuzas, R. Slums from Space—15 Years of Slum Mapping Using Remote Sensing. Remote Sens. 2016, 8, 455. [Google Scholar] [CrossRef] [Green Version]
  4. Wurm, M.; Taubenböck, H. Detecting Social Groups from Space–Assessment of Remote Sensing-Based Mapped Morphological Slums Using Income Data. Remote Sens. Lett. 2018, 9, 41–50. [Google Scholar] [CrossRef]
  5. Hachmann, S.; Jokar Arsanjani, J.; Vaz, E. Spatial Data for Slum Upgrading: Volunteered Geographic Information and the Role of Citizen Science. Habitat Int. 2018, 72, 18–26. [Google Scholar] [CrossRef]
  6. Lilford, R.; Kyobutungi, C.; Ndugwa, R.; Sartori, J.; Watson, S.I.; Sliuzas, R.; Kuffer, M.; Hofer, T.; Albuquerque, J.P.d.; Ezeh, A. Because Space Matters: Conceptual Framework to Help Distinguish Slum from Non-Slum Urban Areas. BMJ Glob. Health 2019, 4, e001267. [Google Scholar] [CrossRef] [PubMed]
  7. Herfort, B.; Lautenbach, S.; Porto de Albuquerque, J.; Anderson, J.; Zipf, A. The Evolution of Humanitarian Mapping within the OpenStreetMap Community. Sci. Rep. 2021, 11, 3037. [Google Scholar] [CrossRef]
  8. Missing Maps. Available online: https://www.missingmaps.org/ (accessed on 13 July 2020).
  9. Barron, C.; Neis, P.; Zipf, A. A Comprehensive Framework for Intrinsic OpenStreetMap Quality Analysis. Trans. GIS 2014, 18, 877–895. [Google Scholar] [CrossRef]
  10. Sehra, S.S.; Singh, J.; Rai, H.S. Assessing OpenStreetMap Data Using Intrinsic Quality Indicators: An Extension to the QGIS Processing Toolbox. Future Internet 2017, 9, 15. [Google Scholar] [CrossRef] [Green Version]
  11. Eckle, M.; Albequerque, J.P.d. Quality Assessment of Remote Mapping in OpenStreetMap for Disaster Management Purposes. In Proceedings of the ISCRAM 2015 Conference-Kristiansand, Kristiansand, Norway, 24–27 May 2015; p. 9. [Google Scholar]
  12. Gröchenig, S.; Brunauer, R.; Rehrl, K. Estimating Completeness of VGI Datasets by Analyzing Community Activity Over Time Periods. In Connecting a Digital Europe Through Location and Place; Huerta, J., Schade, S., Granell, C., Eds.; Springer International Publishing: Cham, Swizterland, 2014; pp. 3–18. ISBN 978-3-319-03611-3. [Google Scholar]
  13. Barrington-Leigh, C.; Millard-Ball, A. The World’s User-Generated Road Map Is More than 80% Complete. PLoS ONE 2017, 12, e0180698. [Google Scholar] [CrossRef] [PubMed] [Green Version]
  14. Zhou, Q. Exploring the Relationship between Density and Completeness of Urban Building Data in OpenStreetMap for Quality Estimation. Int. J. Geogr. Inf. Sci. 2018, 32, 257–281. [Google Scholar] [CrossRef]
  15. Hecht, R.; Kunze, C.; Hahmann, S. Measuring Completeness of Building Footprints in OpenStreetMap over Space and Time. ISPRS Int. J. Geo-Inf. 2013, 2, 1066–1091. [Google Scholar] [CrossRef]
  16. Minghini, M.; Frassinelli, F. OpenStreetMap History for Intrinsic Quality Assessment: Is OSM up-to-Date? Open Geospat. Data Softw. Stand. 2019, 4, 9. [Google Scholar] [CrossRef] [Green Version]
  17. Girres, J.-F.; Touya, G. Quality Assessment of the French OpenStreetMap Dataset. Trans. GIS 2010, 14, 435–459. [Google Scholar] [CrossRef]
  18. Zhang, H.; Malczewski, J. Accuracy Evaluation of the Canadian OpenStreetMap Road Networks. Int. J. Geospat. Environ. Res. 2018, 5, 1–16. [Google Scholar]
  19. Törnros, T.; Dorn, H.; Hahmann, S.; Zipf, A. Uncertainties of completeness measures in openstreetmap; a case study for buildings in a medium-sized german city. In Proceedings of the ISPRS Annals of Photogrammetry, Remote Sensing and Spatial Information Sciences; Copernicus GmbH: Göttingen, Germany; Volume II-3-W5, pp. 353–357.
  20. OSMF Board Meeting Minutes 2012-11-03-OpenStreetMap Foundation. Available online: https://wiki.osmfoundation.org/wiki/Board_Meeting_Minutes_2012-11-03 (accessed on 24 November 2020).
  21. Jacobs, C.; Zipf, A. Completeness of Citizen Science Biodiversity Data from a Volunteered Geographic Information Perspective. Geo-Spatial Inf. Sci. 2017, 20, 3–13. [Google Scholar] [CrossRef] [Green Version]
  22. Haklay, M. How Good Is Volunteered Geographical Information? A Comparative Study of OpenStreetMap and Ordnance Survey Datasets. Environ. Plann B Plann. Des. 2010, 37, 682–703. [Google Scholar] [CrossRef] [Green Version]
  23. Lilford, R.J. NIHR Global Health Research Unit on Improving Health in Slums. Available online: https://warwick.ac.uk/fac/sci/med/about/centres/cahrd/slums (accessed on 25 November 2020).
  24. Guth, J.; Wursthorn, S.; Keller, S. Multi-Parameter Estimation of Average Speed in Road Networks Using Fuzzy Control. ISPRS Int. J. Geo-Inf. 2020, 9, 55. [Google Scholar] [CrossRef] [Green Version]
  25. Gröchenig, S.; Brunauer, R.; Rehrl, K. Digging into the History of VGI Data-Sets: Results from a Worldwide Study on OpenStreetMap Mapping Activity. J. Locat. Based Serv. 2014, 8, 198–210. [Google Scholar] [CrossRef]
  26. Oshome OpenStreetMap History Data Analytics Platform. Available online: https://heigit.org/big-spatial-data-analytics-en/ohsome/ (accessed on 8 July 2020).
  27. OSMstats. Available online: https://osmstats.neis-one.org/ (accessed on 8 July 2020).
  28. OSM Analytics Tool. Available online: https://osm-analytics.org/#/ (accessed on 8 July 2020).
  29. Haklay, M.; Basiouka, S.; Antoniou, V.; Ather, A. How Many Volunteers Does It Take to Map an Area Well? The Validity of Linus’ Law to Volunteered Geographic Information. Cartogr. J. 2010, 47, 315–322. [Google Scholar] [CrossRef] [Green Version]
  30. Mooney, P.; Corcoran, P. Characteristics of Heavily Edited Objects in OpenStreetMap. Future Internet 2012, 4, 285–305. [Google Scholar] [CrossRef] [Green Version]
  31. Neis, P.; Zielstra, D.; Zipf, A. The Street Network Evolution of Crowdsourced Maps: OpenStreetMap in Germany 2007–2011. Future Internet 2012, 4, 1–21. [Google Scholar] [CrossRef] [Green Version]
  32. Pourabdollah, A. OSM–GB: Using Open Source Geospatial Tools to Create OSM Web Services for Great Britain. OSGeo J. 2014, 13, 41–50. [Google Scholar]
  33. Improving Health in Slums Collaborative. A Protocol for a Multi-Site, Spatially-Referenced Household Survey in Slum Settings: Methods for Access, Sampling Frame Construction, Sampling, and Field Data Collection. BMC Med. Res. Methodol. 2019, 19, 109. [Google Scholar] [CrossRef] [PubMed] [Green Version]
  34. Porto de Albuquerque, J.; Yeboah, G.; Pitidis, V.; Ulbrich, P. Towards a Participatory Methodology for Community Data Generation to Analyse Urban Health Inequalities: A Multi-Country Case Study. In Proceedings of the 52nd Hawaii International Conference on System Sciences, Grand Wailea, HI, USA, 8 January 2019; p. 10. [Google Scholar]
  35. Albuquerque, J.P.d.; Herfort, B.; Eckle, M. The Tasks of the Crowd: A Typology of Tasks in Geographic Information Crowdsourcing and a Case Study in Humanitarian Mapping. Remote Sens. 2016, 8, 859. [Google Scholar] [CrossRef] [Green Version]
  36. HOT Tasking Manager. Available online: https://tasks.hotosm.org/ (accessed on 17 September 2020).
  37. OSMWiki Editors-OpenStreetMap Wiki. Available online: https://wiki.openstreetmap.org/wiki/Editors (accessed on 17 September 2020).
  38. OpenDataKit Open Data Kit. Available online: https://opendatakit.org/ (accessed on 17 September 2020).
  39. OpenMapKit OpenMapKit Website. Available online: http://openmapkit.org/ (accessed on 17 September 2020).
  40. Improving Health in Slums Collaborative. Improving Health in Slums Collaborative Impact of the Societal Response to COVID-19 on Access to Healthcare for Non-COVID-19 Health Issues in Slum Communities of Bangladesh, Kenya, Nigeria and Pakistan: Results of Pre-COVID and COVID-19 Lockdown Stakeholder Engagements. BMJ Glob. Health 2020, 5, e003042. [Google Scholar] [CrossRef]
  41. Planet_OSM. Available online: https://planet.openstreetmap.org/planet/full-history/ (accessed on 13 November 2020).
  42. OpenStreetMap Wiki—Planet.Osm/Full. Available online: https://wiki.openstreetmap.org/w/index.php?title=Planet.osm/full&oldid=1661018 (accessed on 13 November 2020).
  43. Noskov, A.; Grinberger, A.Y.; Papapesios, N.; Rousell, A.; Troilo, R.; Zipf, A. Modelling and Assessing Spatial Big Data: Use Cases of the OpenStreetMap Full-History Dump. In Spatial Planning in the Big Data Revolution; Angioletta, V., La Riccia, L., Eds.; IGI Global: Hershey, PA, USA, 2019; pp. 16–44. ISBN 978-1-5225-7927-4. [Google Scholar]
  44. Raifer, M.; Troilo, R.; Kowatsch, F.; Auer, M.; Loos, L.; Marx, S.; Przybill, K.; Fendrich, S.; Mocnik, F.-B.; Zipf, A. OSHDB: A Framework for Spatio-Temporal Analysis of OpenStreetMap History Data. Open Geospat. Data Softw. Stand. 2019, 4, 3. [Google Scholar] [CrossRef]
  45. Troilo, R.; Yeboah, G. Data Extraction Codes for Paper on Gitlab. Available online: https://gitlab.gistools.geog.uni-heidelberg.de/gyrt-share/ijgi-paper (accessed on 26 November 2020).
  46. Corcoran, P.; Mooney, P.; Bertolotto, M. Analysing the Growth of OpenStreetMap Networks. Spat. Stat. 2013, 3, 21–32. [Google Scholar] [CrossRef] [Green Version]
  47. International Organization for Standardization. ISO 19157:2013 Geographic Information-Data Quality; International Organization for Standardization: Geneva, Switzerland, 2013. [Google Scholar]
  48. Soman, S.; Beukes, A.; Nederhood, C.; Marchio, N.; Bettencourt, L.M.A. Worldwide Detection of Informal Settlements via Topological Analysis of Crowdsourced Digital Maps. ISPRS Int. J. Geo-Inf. 2020, 9, 685. [Google Scholar] [CrossRef]
  49. Yang, A.; Fan, H.; Jing, N. Amateur or Professional: Assessing the Expertise of Major Contributors in OpenStreetMap Based on Contributing Behaviors. ISPRS Int. J. Geo-Inf. 2016, 5, 21. [Google Scholar] [CrossRef]
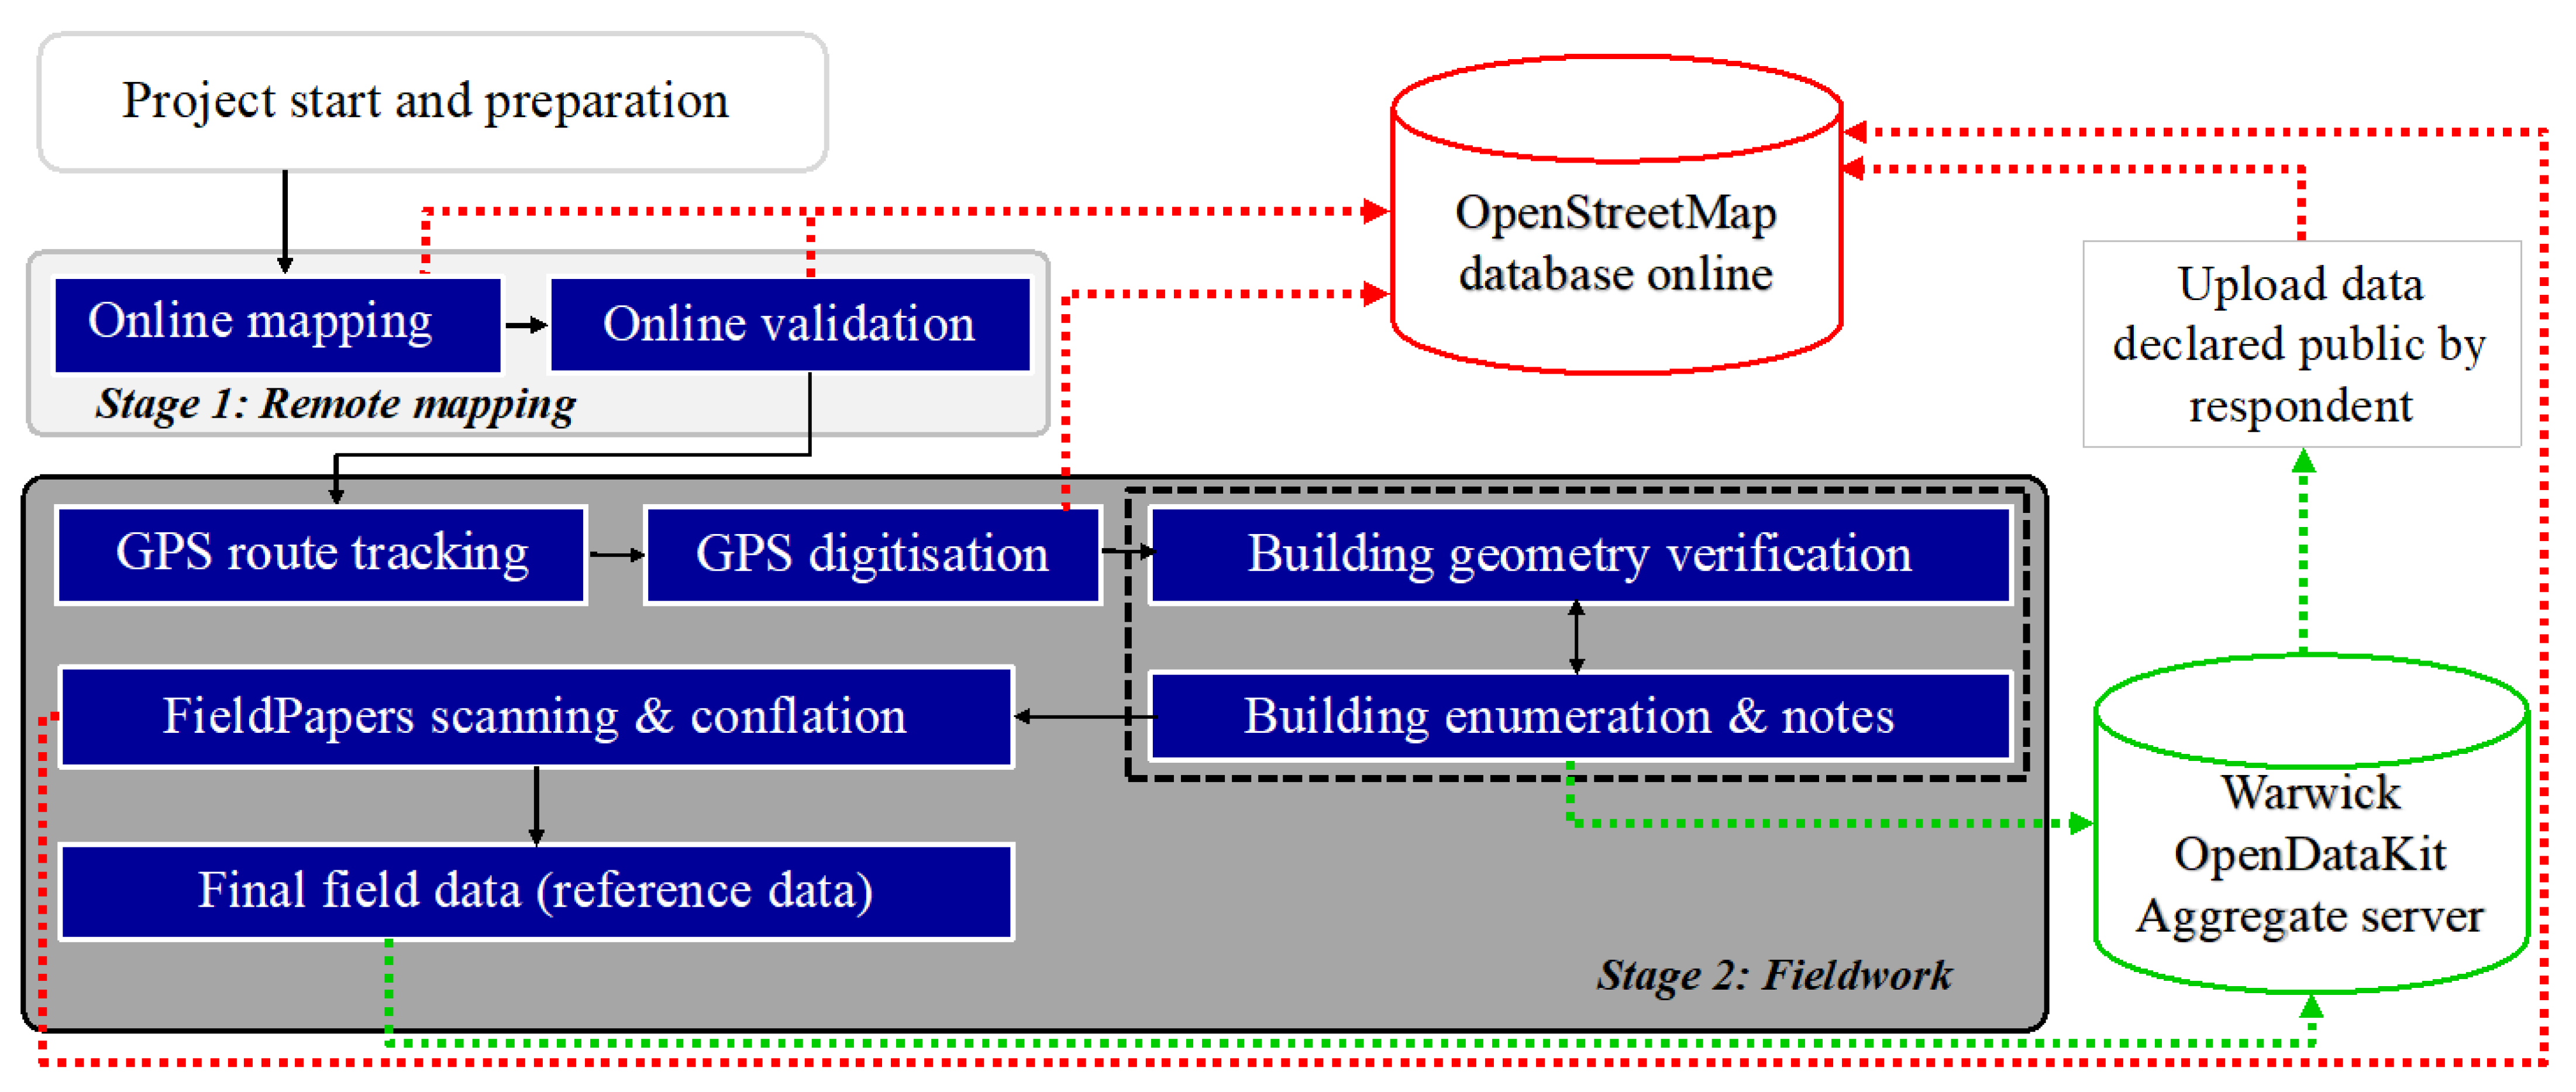
Figure 1. Participatory mapping process workflow with defined stages in grey background.
Ijgi 10 00265 g001
Figure 2. Example photographs. (a) Remote mapping activity; (b) Fieldwork activity; (c) Fieldwork activity.
Ijgi 10 00265 g002
Figure 3. Spatial location of study sites and country (ad) and overview map (e).
Ijgi 10 00265 g003
Figure 4. Photographic characterization of study sites showing samples of satellite imagery (a,d,g,j,m,p,s), structures of buildings (b,e,h,k,n,q) and routes (c,f,i,l,o,r,u).
Ijgi 10 00265 g004aIjgi 10 00265 g004b
Figure 5. Completeness of buildings. (a) During remote mapping stage; (b) During fieldwork stage.
Ijgi 10 00265 g005
Figure 6. Completeness of routes. (a) During remote mapping; (b) During fieldwork stage.
Ijgi 10 00265 g006
Figure 7. Ibadan site 2 completeness maps. (a) Before remote mapping; (b) End of remote mapping; (c) After fieldwork.
Ijgi 10 00265 g007
Figure 8. Karachi site completeness maps. (a) Before remote mapping; (b) End of remote mapping; (c) After fieldwork.
Ijgi 10 00265 g008
Figure 9. Comparison of building completeness growth per mapper and density. (a) During remote mapping stage; (b) During fieldwork stage.
Ijgi 10 00265 g009
Figure 10. Comparison of building completeness growth and density. (a) During remote mapping stage; (b) During fieldwork stage.
Ijgi 10 00265 g010
Figure 11. Comparison of route completeness growth per mapper and density. (a) During remote mapping stage; (b) During fieldwork stage.
Ijgi 10 00265 g011
Table 1. Overview of the main steps of the mapping process.
Main StepsBrief Description
PreparationPreparing materials, engaging stakeholders, and defining responsibilities for the subsequent steps. This involves clarifying who the persons are that will fulfil the roles for each local partner team, as well as preparing materials for the digitization and mapping phases.
DigitizationTo produce detailed base maps of the slum locations by tracing all streets and building structures from high-resolution optical satellite imagery. It involves digitization by remote and local teams and validation by experts.
Participatory mappingTo validate and enrich the digital maps obtained in the previous steps with the local communities by correcting potential inaccuracies and, most importantly, conflating the map with local knowledge of residents.
AnalysisTo consolidate the geospatial data obtained in the previous steps into data products and visualizations that will be useful for end-users and researchers.
Table 2. Number of mappers for buildings and routes.
Site
(Country)
Overall TotalStage 1
Mappers
Stage 2
Mappers
AreaNo. of
Buildings
(Routes)
Building (Route)Building (Route)Building (Route)Sq. km
Karachi site
(Pakistan)
24 (18)17 (22)10 (12)0.42566 (150)
Ibadan site 1
(Nigeria)
14 (19)13 (18)7 (11)0.41882 (105)
Ibadan site 2
(Nigeria)
17 (16)11 (13)15 (14)1.22047 (170)
Lagos site
(Nigeria)
15 (20)15 (16)11 (15)0.3911 (51)
Dhaka site
(Bangladesh)
21 (14)17 (10)20 (12)0.36722 (163)
Nairobi site 1 (Kenya)44 (37)39 (33)31 (27)0.56444 (188)
Nairobi site 2 (Kenya)53 (28)49 (24)33 (18)0.67470 (73)
Table 3. Completeness growth per mapping stage and density of OSM elements.
Site
(sq. km)
Stage 1
Completeness Growth in %
Stage 2
Completeness Growth in %
Final Density
(no./sq. km)
Building
Count
(Area)
Route
Count
(Length)
Building
Count
(Area)
Route
Count
(Length)
BuildingRoute
Karachi site (0.4)0 (0)7 (10)100 (100)93 (90)6415375
Ibadan site 1 (0.4)59 (51)8 (1)41 (49)92 (99)4705263
Ibadan site 2 (1.2)66 (60)70 (72)16 (16)30 (28)1706142
Lagos site (0.3)55 (30)37 (29)45 (70)63 (71)3037170
Dhaka site (0.3)0 (0)39 (33)100 (100)61 (67)22,407543
Nairobi site 1 (0.5)32 (15)9 (12)68 (85)88 (88)12,888376
Nairobi site 2 (0.6)64 (64)1(0)36 (36)96 (100)12,450122
Table 4. Completeness growth per mapper per mapping stage.
SiteStage 1
Completeness Growth per Mapper in %
Stage 2
Completeness Growth per Mapper in %
Building
Count (Area)
Route
Count (Length)
Building
Count (Area)
RouteCount (Length)
Karachi site0.0 (0.0)0.3 (0.5)10 (10)7.8 (7.5)
Ibadan site 14.5 (3.9)0.4 (0.1)5.9 (7.0)8.4 (9.0)
Ibadan site 26.0 (5.5)5.4 (5.5)1.1 (1.1)2.1 (2.0)
Lagos site3.7 (2.0)2.3 (1.8)4.1 (6.4)4.2 (4.7)
Dhaka site0.0 (0.0)3.9 (3.3)5.0 (5.0)5.1 (5.6)
Nairobi site 10.8 (0.4)0.3 (0.4)2.2 (2.7)3.3 (3.3)
Nairobi site 21.3 (1.3)0.0 (0.0)1.1 (1.1)5.3 (5.6)
Publisher’s Note: MDPI stays neutral with regard to jurisdictional claims in published maps and institutional affiliations.

